international journal of scientific engineering and...
TRANSCRIPT
International Journal of Scientific Engineering and Applied Science (IJSEAS) - Volume-1, Issue-9,December 2015 ISSN: 2395-3470
www.ijseas.com
73
Hydrogeological Study of Tawa Watershed Basin of Hoshangabad District M.P India, With Special Reference to
Increase the Groundwater Potentiality of the Region Mohammad Subzar Malik P
1P, J.P. ShuklaP
2
P
1, PResearch Scholar, Principal scientist P
2P, P
PCSIR-Advanced Materials and Processes Research Institute,
Bhopal Corresponding author email: [email protected]
Abstract
A systematic hydrogeological study has been carried out to study the nature of ground water conditions of the Tawa watershed basin. In the study a combined approach of remote sensing and field survey have been carried out to obtained information about the different litho and structural units contained in the study region having potentiality of water storage and discharge. In this study, online Satellite images of LANDSAT (ETM) supporting with DRM data is used to demarcate the hydrogeological formations, land-use, land-cover pattern and lithological units which are encouraging the potentiality of groundwater in the watershed basin. Survey of India (SOI) toposheets, No’s 55F/13, 14, 15 and55 J/2 of scale 1:50000 have also been used, for the preparation of base map of the study area. Geo-reference processing, classification of satellite data and preparation of different maps has being carried out with the help of ArcGIS and ERDAS imagine processing software. Additionally pre and post monsoon water level depth data has been taken during field survey in order to calculate the seasonal groundwater fluctuation in the watershed basin. Keywords: Groundwater potentiality, Hydrogeology, Field mapping, Satellite data and GIS techniques. 1. INTRODUCTION Ground water is an essential and vital component of our life supporting system. Presently in our country (India) groundwater is being utilized for drinking, irrigation and industrial purposes. However, due to rapid growth of population, urbanization, industrialization and agriculture activities, these water resources are under great stress. Groundwater considered as pure source of water its importance is growing day to day due to overexploitation and unscientific methods of exploration. Use and management of groundwater resources in sustainable manner is very important in modern age due to regular increase in water crises. Remote sensing and GIS techniques are very helping tools for analyzing and manipulating the data for the purpose of groundwater resource management and development (Krishnamurthy, et.al.2000). The greatest advantage of using remote sensing data for planning and management of groundwater resources is its ability to generate information in spatial and temporal domain (Baldev, et.al.1991). Additionally, remote sensing and GIS techniques are found efficient to minimize time, labor and money and are also able to make quick decisions for groundwater resources planning and management. Remotely sensed data are very useful where they are combinable with geographic information systems and ground-based information. Analysis of remote sensing data along the survey of India (SOI) topographical sheets and collateral information with necessary ground truth verifications help in generating the baseline information for groundwater targeting. Identification of groundwater occurrence location using remote sensing data is based on indirect analysis of directly observable terrain features like geological structures, geomorphology, and their hydrologic characteristics (Lattman, 1958). Application of GIS and remote sensing can also be considered for multi criteria analysis in resource evaluation and hydro-geomorphological mapping for groundwater resource planning and management. Remote sensing data helps in fairly accurate hydro-geomorphological analysis and identification and delineation of land features (Tiwari and Rai, 1996). Satellite remote sensing provides an opportunity for better observation and more systematic analysis of various geomorphic units, lineament features,
International Journal of Scientific Engineering and Applied Science (IJSEAS) - Volume-1, Issue-9,December 2015 ISSN: 2395-3470
www.ijseas.com
74
following the integration with the help of Geographical Information System to demarcate the groundwater potential zones (Sankar, 2002 and Magesh, 2012).
In the study an integrated approach of remote sensing and field observations have been carried out to determine the hydro-geological formations contained in the watershed basin in order to increase the groundwater potentiality of the region. The convectional technique involves in collection of all the available information pertaining to the existing devices of targeting the groundwater resources of the watershed basin. On the basis of preliminary survey the watershed basin constitutes the alluvial aquifer formations of shallow to deep depth. Well inventory data, such as location and type of well, diameter of the well, depth of static water level etc, are collected during the survey period. The water level (bgl) depth data has been collected in post and pre- monsoon seasons in different formations. The water table fluctuations are observed in the study area and it could be attributed to variation in rainfall distribution, nature of topography, local geology and physiographic conditions. It is observed from collected ground water level data that water table has shown fluctuations in pre and post-monsoon session. It varies in different formations in pre and post-monsoon session. Therefore, an integrated approach, including studies of lithology, hydrogeology and land-use, land-cover has been taken up, using remote sensing and GIS techniques, to increase the groundwater potential in the region. 2. MATERIAL AND METHODS
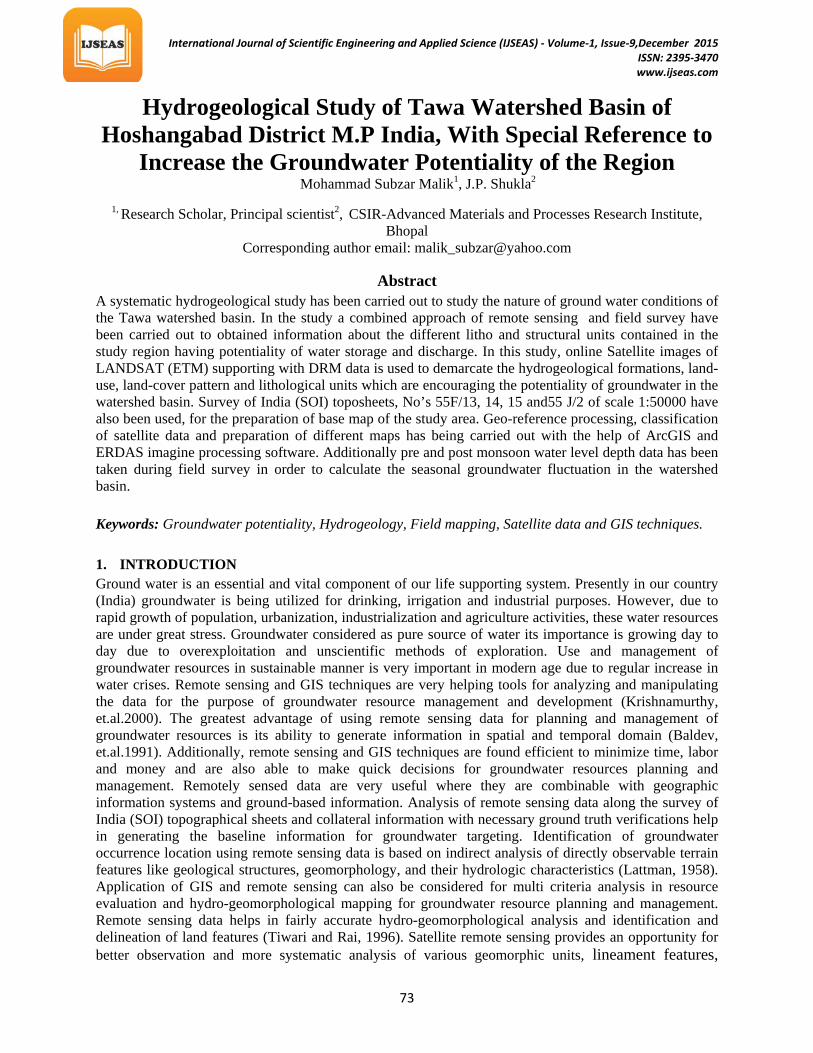
2.1. STUDY AREA Hoshangabad district has predominantly an agricultural based economy. It is situated in the eastern part of Madhya Pradesh. It is surrounded by Sehore and Raisen districts in the North, Narsinghpur district in the east, Chhindwara district in the south west Betul in the south and Harda district in the west. Hoshangabad district lies between north latitudes 22º 15’ and 23º 00’ and east longitudes 77º 15’ and 78º 42’ in part of survey of India toposheet Nos, 55F & 55J. The study area falls in survey of India (SOI) Toposheet Nos. 55 F/12, 55 F/13 between latitude 22 1TP
0P1T 30' 00'' to 221TP
0 P1T50' 00'' N and longitude 771TP
0P1T 45' 00'' to 781TP
0P1T 00' 00''E.
The study area is covered by Alluvium soil which encourages agricultural practices in the region.
Tawa River, a left bank tributary originates from Mhadeo hills in Chindwara district, flows through Betul and drains a part Hoshangabad district and finally merges in to Narmada River in Hosangabad. It is the longest Tributary of Narmada (172 Km) on the left bank (Chatterjee, Undated). At Tawa, Denva River joins Tawa River 823m upstream of Tawa dam site. This reservoir is located near Ranipur village, 35 Km form Itarsi railway Junction The dam is positioned at latitude of 220 30’40’’ N and a Longitude of 77056’30’’ E. The catchment area of the reservoir is 5982.9 KmP
2P.
Fig. 1: Location Map of the study area

International Journal of Scientific Engineering and Applied Science (IJSEAS) - Volume-1, Issue-9,December 2015 ISSN: 2395-3470
www.ijseas.com
75
A combined approach, including studies of lithology, hydrogeology and land-use, land-cover has been taken up, using remote sensing and GIS techniques to increase the groundwater potential in the region. Mapping of these features have been done during field surveys with the help of DRM data and Satellite imageries. Satellite data of LANDSAT-7, ETM+ sensor used in the study downloaded from the online available data source centers (glcf/nrsc) made mosaic in ERDAS imagine software. Thematic maps such as lithology, hydrogeology, geomorphology and land use land cover have been generated from the satellite data, with the help of ERADAS imagine and GIS processing. Identification and delineation of various units on the thematic maps are based on the color, tone, texture, size, pattern and association. All these thematic maps are verified during the field checks. The survey of India toposheets (SOI) No’s 55E/13, 14, 15 and J/2 have been used for the preparation of base map of the watershed basin. The thematic details thus finalized are transferred to the base map (Fig.3). Satellite image used carries various types of information which has been extracted by the techniques of digital image processing with the help of ERDAS Imagine software. Then it has been integrated in GIS platform for proper understanding of surface features and processes. Various image enhancement techniques have also been applied to satellite data to extract information on geology, geomorphology, land use, structural features and vegetation cover (Jenson and Domingue, 1988). 2.2. GEOLOGY Geologically, the entire Tawa watershed basin comprises of different lithological formations which include Vindhyan sandstones, Basalt, recent alluvium deposits and some patches of Banded gneisses complex (BGC) range in age from Archean to Quaternary are exposed in the area. The major part of the study area, along the vicinity of both banks of Tawa River is covered by recent alluvium deposits of reddish, yellowish, brownish and grayish clays intercalated with beds of sand, gravel and pebbles with occasionally ferruginous granules. District resource map (DRM) has shown that litho units of non-calcareous silt, sand and clay are found along the river channel. These unconsolidated fluvial deposits characterized of silty sand, sand, gravel and conglomerate found in the watershed basin contain well groundwater bearing formations. In climatic point of view study area is characterized by hot summer and evenly distributed rainfall during SW monsoon. Annual mean maximum and minimum temperatures are around 33 degree centigrade and 19.4 degree centigrade respectively. The study area receives about 1170mm rainfall on an average per year as estimated from last five years (2011-15) rainfall data (IMD New Delhi). The monsoon rainfall accounts for 80% of the annual rainfall. 2.3. GEOMORPHOLOGY
The study area is bounded by Satpura ranges in south and Narmada River in the north. The slope is generally steep at the foothills of Satpura range, but moderate to gentle towards Narmada River. Geomorphology showing that the whole watershed basin contains older and younger flood plain deposits of fluvial origin. The watershed basin comes in between the middle alluvial flood plains of the Narmada and Tawa River. Satpura range is surrounding in the south and badland topography zone confined to the vicinity of Narmada River in North.
International Journal of Scientific Engineering and Applied Science (IJSEAS) - Volume-1, Issue-9,December 2015 ISSN: 2395-3470
www.ijseas.com
76
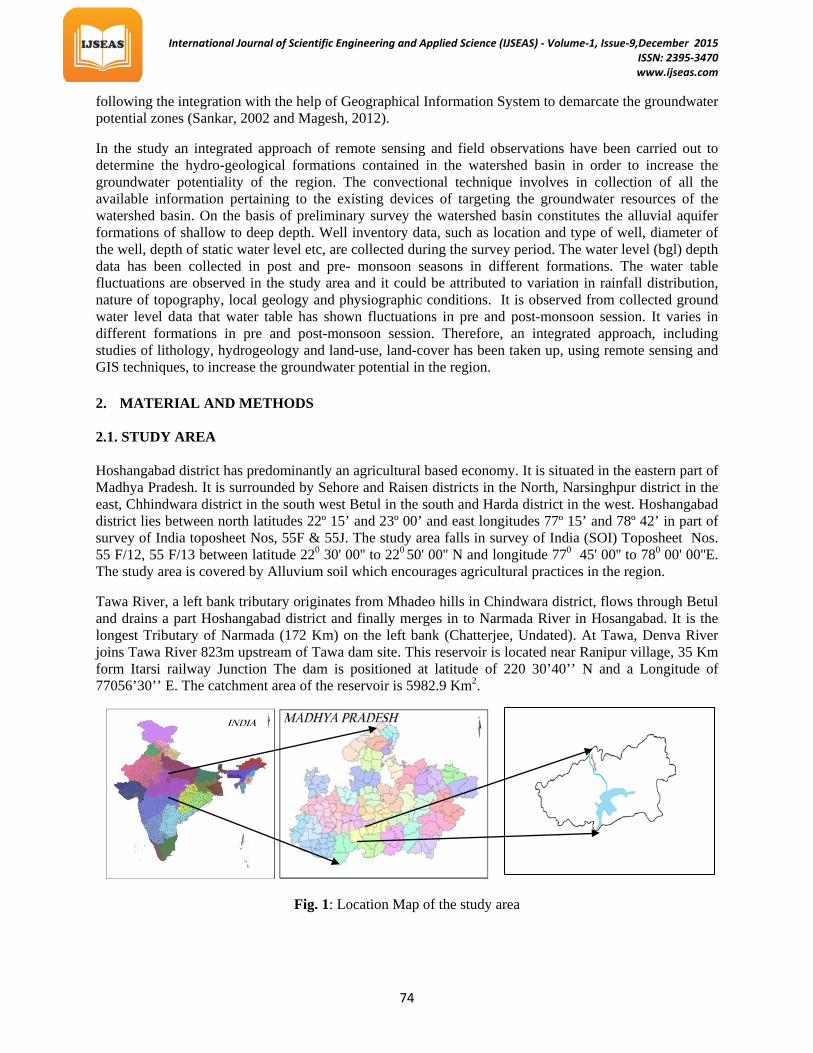
2.4. HYDROGEOLOGY
Hydro-geologically, the entire watershed basin contains alluvium formations of shallow to medium depth. The alluvial aquifer system in the region is the most extensive. Two to three granular zones and at places more number of potential granular zones comprising of fine to medium to coarse grained sand, gravel and pebbles and laterite are encountered in alluvium. The phreatic aquifers encountered in the area range in thickness from 2 to 10m and the depth range of 4 to 20m (bgl). They have intercalation of clay, silt and at some places with coarse sand or gravel. It appears that all the alluvial aquifer zones constitute a single aquifer system. The deeper aquifers are of semi-confined to confined nature with varying potentiometric heads. The yield of alluvial aquifers ranges from 180 to 3000 liters per minute. All the aquifers are principally recharged by a lateral low from the south and also by direct vertical percolation rain/irrigation water/seepage from tanks/canals. Hydrogeological point of view the watershed basin is falling in good groundwater potential zone. Therefore, good groundwater productivity wells can be excavating in the watershed basin, in order to develop the water resources in the region and reduce the water scarcity.
Fig.2: LANDSAT Satellite Image of Tawa Catchment area

International Journal of Scientific Engineering and Applied Science (IJSEAS) - Volume-1, Issue-9,December 2015 ISSN: 2395-3470
www.ijseas.com
77
2.5. WATER LEVEL DEPTH
Water levels form a very important parameter of the ground water system. The groundwater balance expresses itself in the change in water levels hence a continuous record is important and useful. In the study water level measurements has taken during field surveys, both in pre and post-monsoon seasons. In May (2015) pre-monsoon field visit has been carried out in the study area, during field survey water level measurements has been taken in bore and dug wells at various locations in the watershed basin with the help automatic water level recorder. Based on field measurements average depth to water level in the area ranges from 3.60 to 17.50 m below ground level. Shallow water level of less than 6 m has been recorded at Sankhera, Rajon, Nimsadia, Samon and Somalwada kalan. Depth to water level between 6 to 9 m (bgl), has been recorded at Sirwar, Samon Babai, Bhanpur, showing in (Table.1).
Table 1: Pre-monsoon depth to groundwater level May (2015) Formation Location Name Water level depth in (m) bgl
Alluvium
Sankhera 6m Rajon 5m Sirwar 9m Samon 9m Babai 9m Bhanpur 9m
In Oct. (2015) post-monsoon field visit has been carried in watershed basin for the collection of water level data. During field visit water levels measurements at various places in the watershed basin has been taken in bore wells and dug wells. Very Shallow water levels have been recorded at Nimsadiya (3m) bgl, Somalwada kalan(3m)bgl and Tawapur (4m) bgl. Depth to water level between 7 to 10 m bgl have been reported from Bichwa(6m) Babai(7m), Anchalkheda, (8m) Rampur(9.8m), Kandai(9m), Gujarwada(10m)bgl. Deepest water level 12m bgl has been recorded at Gujpur showing in (Table.2). As per the records of the pre and post-monsoon water level record it is seen that water level has shown seasonal fluctuations. Therefore, it seems that in the catchment region well productivity dug wells and bore wells can be executed to provide sufficient water for drinking and agricultural uses, which will helps in the development of region.
Table 2: Post-monsoon depth to groundwater level Oct. (2015).
Formation Location Name Water level depth in (m) bgl Alluvium
Nimsadiya 3m Tawapur 4m Anchalkheda 8m Babai 7m Gujarwada 10m Bichwa 7m Gujpur 12m Rampur 9.8m Somalwada kalan 3m Kandai 9m

International Journal of Scientific Engineering and Applied Science (IJSEAS) - Volume-1, Issue-9,December 2015 ISSN: 2395-3470
www.ijseas.com
78
Fig.3: Post-monsoon Water Level Depth in Tawa River Catchment Area
2.6. DRAINAGE The entire area is drained by Tawa River and its left bank canal. Drainage map, (Fig.5) have been prepared with the help of toposheets and verified by satellite data and field checks. Drainage map shows the water bodies, tributaries, perennial & ephemeral streams are contained in the study region. Drainage network helps in delineation of watersheds. Drainage mapping also gives information related to lithology, runoff, infiltration slope and permeability. The study area is representing the third order drainage pattern. Drainage map is showing high density of streams at the foot hills of Satpura range. Because of presence of good alluvium formations most drainage part is fed by groundwater. The coarse drainage texture indicates highly porous and permeable rock formations. The presence of unconsolidated deposits of gravel, sand and silt representing good groundwater bearing formations, because of their good water holding and yielding characteristics. Therefore, for evaluating the groundwater productivity of any watershed basin, it is necessary to draw the drainage pattern of the basin, because it reflects the surface characteristics as well as subsurface formations (Horton, 1945).

International Journal of Scientific Engineering and Applied Science (IJSEAS) - Volume-1, Issue-9,December 2015 ISSN: 2395-3470
www.ijseas.com
79
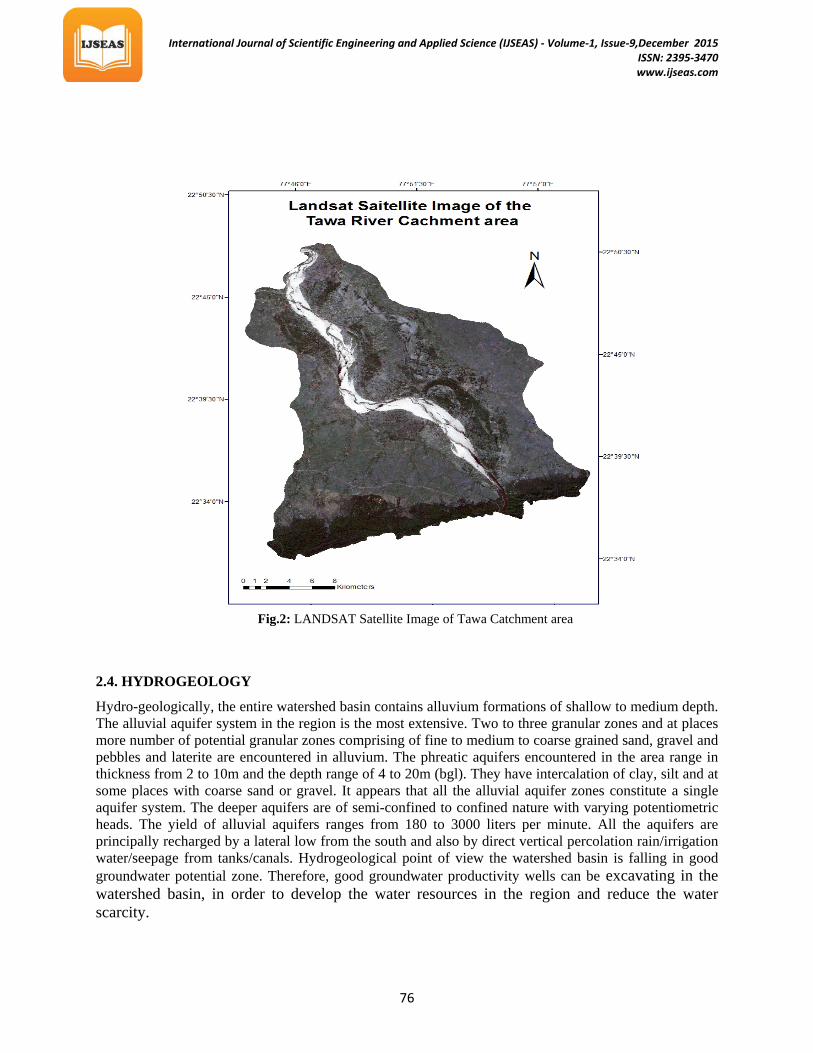
Fig.4: Drainage Map of Tawa Watershed Basin 2.7. LAND USE AND LAND COVER The whole catchment area is rich in the field of agriculture due to good sources of irrigation and fertile alluvial soil. The total area of the watershed basin is 710sq.km. Based on land-use land-cover mapping most of the area of Tawa watershed is coming under agricultural cover shown in base map (Fig.5). Forest cover is seen along the foot hills of Satpura range. Also some patches of scrub lands are seen along the vicinity of both the banks of Tawa River. The agricultural area covers almost 90% of area of the watershed basin. In the watershed basin large scale agricultural cropping is going there, because of fertile alluvium and good irrigation sources.Wheat and gram are the main crops grown during Rabi (winter) season. Soybean, Rice, Mustard and Groundnut are the grown in Kharif (summer season).
International Journal of Scientific Engineering and Applied Science (IJSEAS) - Volume-1, Issue-9,December 2015 ISSN: 2395-3470
www.ijseas.com
80
3.0. RESULT AND DISCUSSION Remote sensing and GIS techniques play a vital role in planning and development of groundwater resources. Remote sensing is not applicable directly for the groundwater studies. Satellite data obtained, through this giving valuable information regarding hydraulic conductivity and possible water bearing geological formations. LANDSAT (ETM P
+P) satellite data, supported by district resources maps have been
used to generate different maps which are beneficial in groundwater studies. Different maps generated from satellite data, with the help of image processing software’s are giving complete information about the rock formations, hydro-morphological landforms and structural units contained in the watershed basin. These maps help in delineation of groundwater potential zones. Besides, this evaluation of the groundwater table conditions of the watershed basin also representing the groundwater potentiality of the region. For this pre and post-monsoon field surveys have been carried out for the collection of water table data to observe the seasonal fluctuation of water level. Hydro-geologically the entire watershed basin contains alluvium aquifers of shallow to medium depth of recent age. A number of good productivity groundwater wells are already working from many years in the watershed basin. Due to large scale agricultural cropping in the watershed basin the groundwater resources are under great stress. Half of irrigation is satisfied, by the groundwater providing dug wells and bore wells in the watershed basin. Therefore it is necessary to develop the groundwater resources in the catchment region for long sustenance of agricultural in the region. From geomorphologic point of view the watershed basin contain new and old flood plain alluvium deposits. Land-use land-cover mapping shows dominancy of cropping land. Some patches of scrub lands have been seen in the vanity of river banks. Forest covers covering the
Fig.5: Base Map of Tawa Watershed

International Journal of Scientific Engineering and Applied Science (IJSEAS) - Volume-1, Issue-9,December 2015 ISSN: 2395-3470
www.ijseas.com
81
foot hills part of Satpura range in South. Structural units demarked through Satellite data provides important information regarding on subsurface fractures that may control the movement and storage of groundwater. Besides, this electromagnetic information obtained by spectral sensors has always to be transformed into other information, which is relevant in the field of hydrology. 4.0. CONCLUSION The remote sensing technique provides satellite imagery data. With the help GIS techniques and ERDAS image processing the classification of the satellite data sets have been made for identification of different litho and structural units that are capable for water storage and discharge. Field surveys have been carried to know the groundwater condition and complete inventory on the groundwater providing structures have been prepared. Groundwater level measurements have been taken in the watershed basin knowing the pre and post monsoon fluctuation in water level. Hydro-geologically the entire watershed contained recent and old alluvium formations of shallow to medium depth. Land-use land-cover mapping shows the dominance of cultivable land in the watershed basin. Forest cover is seen along the foot hills of Satpura range in North. Some patches of open scrub lands are found in the watershed basin. The result is giving complete information about groundwater resources of the watershed basin. With the help these findings, well productivity groundwater structures like dug well, bore and tube well can be executed in the watershed basin to increase the groundwater productivity in the region. Therefore, it is concluded that the remote sensing combined with field methods has great potential to revolutionize groundwater resources in the future by providing unique and new data to supplement the conventional field data. A challenge is the development of affordable, physically based use of satellite data with a high temporal resolution for monitoring recharge and emergence of groundwater driven by flow systems. Such advancements will certainly enable us to develop and manage precious groundwater resources in a real sustainable and environment friendly way. ACKNOWLEDGEMENTS Authors are thankful to Director AMPRI, Bhopal for giving permission to publish this research work. REFERENCES
1. Baldev, S. Bhattacharya, A., and Hegde, V.S. (1991). IRS-1A application for groundwater targeting, special issue on Remote Sensing for National Development, Journal of Current Science, 61, pp 172-179.
2. Horton, R.E. (1945). Erosional development of streams and their drainage basins: hydrophysical approach to quantitative morphology. Bulletin of the Geological Society of America 56, 2 75-3 70
3. Jenson, S.K and Domingue, J. O. (1998). Extracting Topographic Structure from Digital Elevation Data for Geographic Information System Analysis
4. Krishnamurthy, J., Arul Mani, Jayaraman, V. and Manivel, M. (2000). Groundwater resources development in hard rock terrain – an approach using remote sensing and GIS techniques, International journal of applied geology, 2(¾), pp 204-215.
5. Lattman, L.H. (1958), Technique of mapping geologic fracture traces and lineaments on aerial photographs, Photogrammetric Engineering, 19(4), pp 568-576.
6. Magesh, N.S. et.al. (2012). Delineation of groundwater potential zones in Theni district, Tamil Nadu, using remote sensing, GIS and MIF techniques. Geoscience Frontiers Volume 3, Issue 2, March 2012, Pages 189–196.
7. Sankar, K. (2002). Evaluation of Ground water potential zones using Remote Sensing Data in Upper Vaigai River basin, Tamilnadu, India. J. Indian Soc. Remote Sen Jing, 30 (3), pp 119-128.

International Journal of Scientific Engineering and Applied Science (IJSEAS) - Volume-1, Issue-9,December 2015 ISSN: 2395-3470
www.ijseas.com
82
8. Tiwari, A and Rai, B. (1996), Hydrogeomorphological mapping for groundwater prospecting using Landsat MSS images- A case study of part of Dhanbad district, Journal of Indian Society of Remote Sensing, 24(4), pp 281-285.