international journal of pure and applied research … -453.pdf · abstract: - this research paper...
TRANSCRIPT
Research Article CODEN: IJPAKY Impact Factor: 4.226 ISSN: 2319-507X Prof. R. E. Hiwase, IJPRET, 2015; Volume 4 (3): 116-130 IJPRET
Available Online at www.ijpret.com
116
INTERNATIONAL JOURNAL OF PURE AND APPLIED RESEARCH IN ENGINEERING AND
TECHNOLOGY A PATH FOR HORIZING YOUR INNOVATIVE WORK
RESEARCH METHODOLOGY FOLLOWED FOR OPTIMIZATION OF PRODUCTION
SYSTEM FOR ROLL BOND EVAPORATOR OF DOMESTIC REFRIGERATOR PROF. R. E. HIWASE1, DR. J. F. AGRAWAL2
1. Asso. Prof., Department of Mechanical Engineering Bapurao Deshmukh College of Engineering Sevagram, Wardha, India.
2. Principal, Shri Sai College of Engineering, Bhadrawati, Chandrapur, India.
Accepted Date: 05/10/2015; Published Date: 01/11/2015
\
Abstract: - This research paper deals with the research methodology followed for
optimization of production system for Roll Bond Evaporator of Domestic Refrigerator. Methodology refers to more than a simple set of methods; rather it refers to the rationale and the philosophical assumptions that underlie a particular study. The study adopts an analytical research design with experimental approach. Beginning with the research questions that emerged after the review of literature on the productivity and the optimization of various industrial processes, the paper focuses on to the different set of methods used to operationalize the research work. Among other facets shared by the various fields of inquiry is the conviction that the process be objective to reduce a biased interpretation of the results. Another basic expectation is to document, archive and share all data and methodology so they are available for careful scrutiny by other scientists, thereby
allowing other researchers the opportunity to verify results by attempting to reproduce them. In the present study, a quantitative method was used, which was clearly identified in
view of the specific objectives of the study. Keywords: Research Methodology, Optimization, Quantitative Method.
Corresponding Author: PROF. R. E. HIWASE
Access Online On:
www.ijpret.com
How to Cite This Article:
Prof. R. E. Hiwase, IJPRET, 2015; Volume 4 (3): 116-130
PAPER-QR CODE

Research Article CODEN: IJPAKY Impact Factor: 4.226 ISSN: 2319-507X Prof. R. E. Hiwase, IJPRET, 2015; Volume 4 (3): 116-130 IJPRET
Available Online at www.ijpret.com
117
INTRODUCTION
There are many ways of outlining the basic method shared by all fields of scientific inquiry. In
the present investigation, the researcher followed a general research method as follows
1. Define the question
2. Gather information and resources (observe)
3. Form hypothesis
4. Data Collection
5. Analyze data
6. Interpret data and draw conclusions
In the present study, a careful collection of facts was undertaken by the researcher to ensure
the validity of the facts. Wherever, possible, the data for the same variable was recorded from
more than one source. This allowed the careful scrutiny of the recorded data, which would give
more appropriate results. The present study was carried out in three steps involving
reconnaissance, sampling/data generation and analysis, followed by interpretation of the
results.
Roll Bond Evaporators
Aluminum Roll-Bond evaporators provide unique designs flexibility for direct cooling
refrigeration systems. Roll-Bond evaporators deliver efficient thermal performance in a product
that can be shaped to fit most applications. They are often supplied in four different
manufacturing stages: inflated, stamped, welded, painted (with connectors - aluminum, copper
aluminum or heat exchanger). The integration of the primary and secondary plates, together
with the aluminum thermal conductivity, supply excellent thermal transfer characteristics and
can be offered in different finishes.
Manufacturing process of Roll Bond Evaporators
The manufacturing process of the production of roll-bond evaporator panels (evaporators) is
divided into phases:
casting of the broadband;

Research Article CODEN: IJPAKY Impact Factor: 4.226 ISSN: 2319-507X Prof. R. E. Hiwase, IJPRET, 2015; Volume 4 (3): 116-130 IJPRET
Available Online at www.ijpret.com
118
rolling of broadband into the band for evaporators;
roll-bonding at the warm formation temperature on the Expandalstation;
recrystallization annealing in the chamber furnace;
inflation of imprinted channels on the evaporation panel on hydraulic recasting machines;
final dimension cut with mechanical scissors to customer request and packaging;
stamping with stamping tools on eccentric presses and packaging.
Data Collection
All the data collection procedures have been described in this section of the paper. Each day of
data collection involved the following activities:
When? What? Who?
Before going out
to collect data
Checked that data collection
personnel has all the materials
necessary for field visits and
confirmed transport arrangement
on each day
Called each facility to be visited
and confirm appointment
Research scholar
On arrival at the
plant
Introduced survey team and
reminded staff of the visit’s
purpose
Verified and completed the outlet
information on first page of the
data sheet
Collected and recorded necessary
data from relevant sources
Checked all data entered into the
data collection form before leaving
Research scholar
Research Article CODEN: IJPAKY Impact Factor: 4.226 ISSN: 2319-507X Prof. R. E. Hiwase, IJPRET, 2015; Volume 4 (3): 116-130 IJPRET
Available Online at www.ijpret.com
119
facility
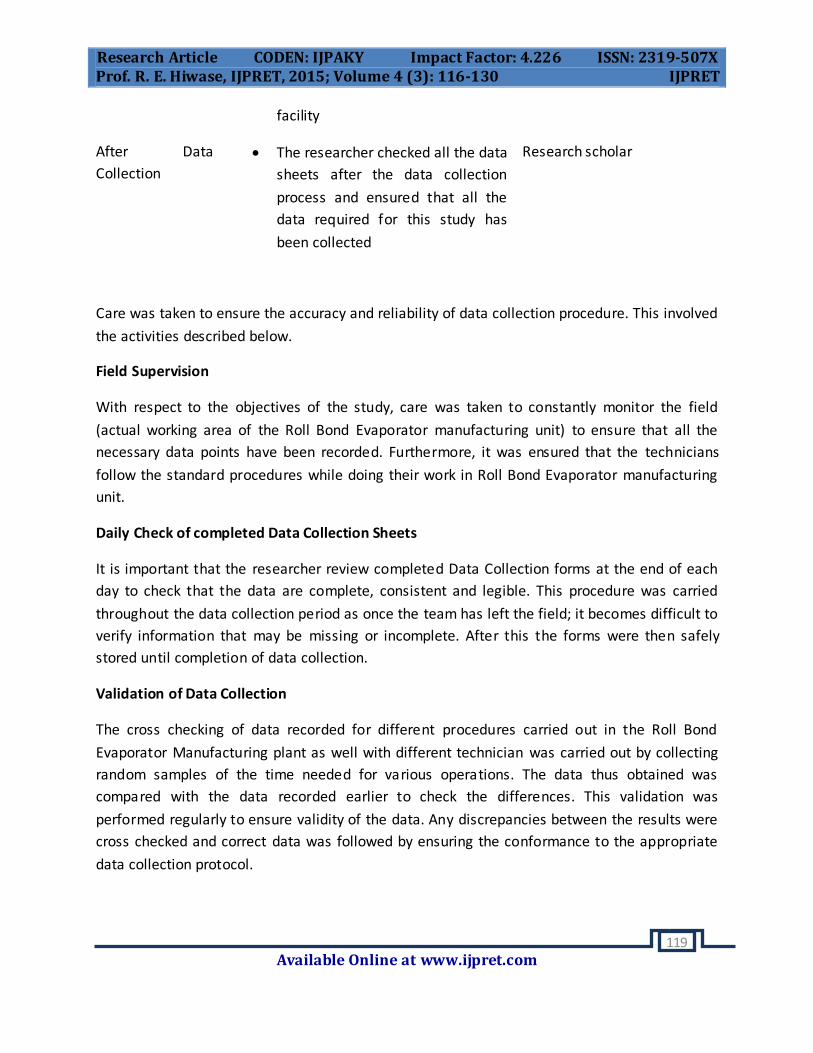
After Data
Collection
The researcher checked all the data
sheets after the data collection
process and ensured that all the
data required for this study has
been collected
Research scholar
Care was taken to ensure the accuracy and reliability of data collection procedure. This involved
the activities described below.
Field Supervision
With respect to the objectives of the study, care was taken to constantly monitor the field
(actual working area of the Roll Bond Evaporator manufacturing unit) to ensure that all the
necessary data points have been recorded. Furthermore, it was ensured that the technicians
follow the standard procedures while doing their work in Roll Bond Evaporator manufacturing
unit.
Daily Check of completed Data Collection Sheets
It is important that the researcher review completed Data Collection forms at the end of each
day to check that the data are complete, consistent and legible. This procedure was carried
throughout the data collection period as once the team has left the field; it becomes difficult to
verify information that may be missing or incomplete. After this the forms were then safely
stored until completion of data collection.
Validation of Data Collection
The cross checking of data recorded for different procedures carried out in the Roll Bond
Evaporator Manufacturing plant as well with different technician was carried out by collecting
random samples of the time needed for various operations. The data thus obtained was
compared with the data recorded earlier to check the differences. This validation was
performed regularly to ensure validity of the data. Any discrepancies between the results were
cross checked and correct data was followed by ensuring the conformance to the appropriate
data collection protocol.
Research Article CODEN: IJPAKY Impact Factor: 4.226 ISSN: 2319-507X Prof. R. E. Hiwase, IJPRET, 2015; Volume 4 (3): 116-130 IJPRET
Available Online at www.ijpret.com
120
Storing the Generated Data
Completed forms were copied and stored in waterproof plastic bags in the field, in a location
that was protected from moisture, direct sunlight, rodents and insects. Originals were stored in
a separate location from copies. All original data collection forms, including those for validation
visits, were transferred to the safe location upon completion of fieldwork. This data was then
entered in the database prepared using MS-Office package.
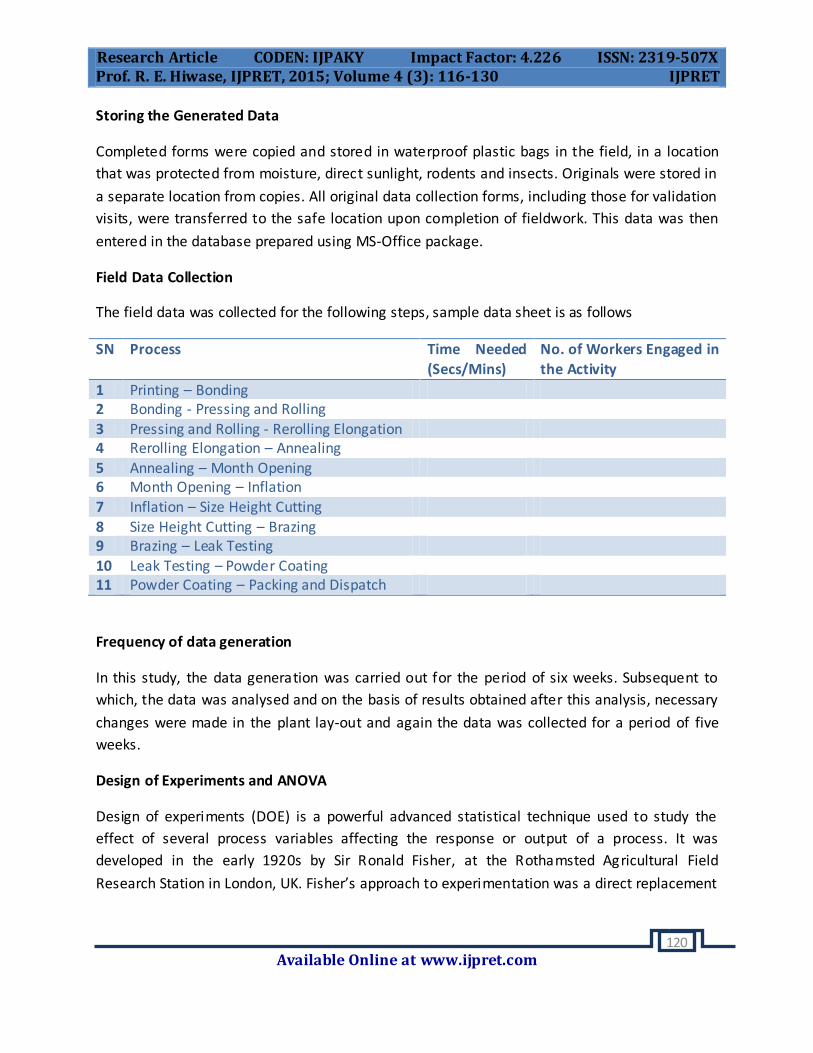
Field Data Collection
The field data was collected for the following steps, sample data sheet is as follows
SN Process Time Needed
(Secs/Mins)
No. of Workers Engaged in
the Activity
1 Printing – Bonding 2 Bonding - Pressing and Rolling
3 Pressing and Rolling - Rerolling Elongation 4 Rerolling Elongation – Annealing
5 Annealing – Month Opening 6 Month Opening – Inflation
7 Inflation – Size Height Cutting 8 Size Height Cutting – Brazing 9 Brazing – Leak Testing 10 Leak Testing – Powder Coating 11 Powder Coating – Packing and Dispatch
Frequency of data generation
In this study, the data generation was carried out for the period of six weeks. Subsequent to
which, the data was analysed and on the basis of results obtained after this analysis, necessary
changes were made in the plant lay-out and again the data was collected for a period of five
weeks.
Design of Experiments and ANOVA
Design of experiments (DOE) is a powerful advanced statistical technique used to study the
effect of several process variables affecting the response or output of a process. It was
developed in the early 1920s by Sir Ronald Fisher, at the Rothamsted Agricultural Field
Research Station in London, UK. Fisher’s approach to experimentation was a direct replacement

Research Article CODEN: IJPAKY Impact Factor: 4.226 ISSN: 2319-507X Prof. R. E. Hiwase, IJPRET, 2015; Volume 4 (3): 116-130 IJPRET
Available Online at www.ijpret.com
121
of traditional one-factor-at-a time approach to experimentation. Over the past several years,
DOE has gained worldwide acceptance as an essential ingredient for improving process
effectiveness and product quality. This recognition is partially due to the work of Taguchi, a
Japanese engineer and an international quality management consultant, who promoted the
importance of making robust products and processes through the application of DOE. Many
manufacturers have reported a number of successful applications of DOE for improving product
performance, improving product life and reliability over the years.
Guidelines for Designing Experiments:
To use the statistical approach in designing and analyzing an experiment, it is necessary for
everyone involved in the experiment to have a clear idea in advance of exactly what is to be
studied, how the data are to be collected, and at least a qualitative understanding of how these
data are to be analyzed.
Recognition and statement of the problem:
It is necessary to develop all ideas about the objectives of the experiment. In this work careful
collection of all the processes was carried out and a list of specific processes was prepared.
Since, all these processes contribute substantially to better understanding of the phenomenon
being studied and the final solution of the problem, this process was given due importance.
Choice of factors, levels and range
One of the first things in conduction of a DOE evaluation, is to select the factors that will be
examined. This can be accomplished by using following selection criteria. The criteria of interest
include:
Scope refers to the applicability of the factor which is relevant in many different situations.
Pieces of equipment etc., or is it restricted to relatively few situations?
Economy of control- can control of the factor be effective with relatively low cost?
Practicality of control-disregarding cost would control of the factor actually happen, or
would it be too cumbersome to put into effect?
Significance as a Single Factor Acting Alone-what is the estimated influence of the factor on
its own?

Research Article CODEN: IJPAKY Impact Factor: 4.226 ISSN: 2319-507X Prof. R. E. Hiwase, IJPRET, 2015; Volume 4 (3): 116-130 IJPRET
Available Online at www.ijpret.com
122
Significance of the Factor as a part of any Multiple-Factor interactions-How influential might
the factor be in combination with other factors?
Originality of work-Does inclusion of this factor advance knowledge or simply repeat work
already performed?
Specific Company Needs- Is inclusion of the factor essential to make the results meaningful
to specific company.
Once the experimenter has selected the design factors, he/she must choose the ranges over
which these factors will be varied, and the specific levels at which runs will be made. Thought
must also be given to how these factors are to be controlled at the desired values and how they
are to be measured. In this study, the data pertaining to time and productivity (response
variables) was collected after making changes in the plant lay out. Choice of Design involves the
consideration of sample size, the selection of suitable run order for the experimental trials, and
the determination of whether or not blocking or other randomization restrictions are involved.
In selecting the experimental design, it is important to keep the experimental objective in mind.
Taguchi Method
The technique of laying out the conditions of experiments involving multiple factors was first
proposed by the Englishman, Sir R. A. Fisher. The method is popularly known as the factorial
design of experiments. A full factorial design will identify all possible combinations for a given
set of factors. Since most industrial experiments usually involve a significant number of factors,
a full factorial design results in a large number of experiments. To reduce the number of
experiments to a practical level, only a small set from all the possibilities is selected. The
method of selecting a limited number of experiments which produces the most information is
known as a partial fraction experiment. Although this method is well known, there are no
general guidelines for its application or the analysis of the results obtained by performing the
experiments. In view of this Taguchi constructed a special set of general design guidelines for
factorial experiments that cover many applications.
Robust Design method is central to improving engineering productivity. Robust Design method,
also called the Taguchi Method, pioneered by Dr. Genichi Taguchi, greatly improves engineering
productivity. By consciously considering the noise factors (environmental variation during the
product’s usage, manufacturing variation, and component deterioration) and the cost of failure
in the field the Robust Design method helps ensure customer satisfaction. Robust Design
focuses on improving the fundamental function of the product or process, thus facilitating
Research Article CODEN: IJPAKY Impact Factor: 4.226 ISSN: 2319-507X Prof. R. E. Hiwase, IJPRET, 2015; Volume 4 (3): 116-130 IJPRET
Available Online at www.ijpret.com
123
flexible designs and concurrent engineering. Indeed, it is the most powerful method available
to reduce product cost, improve quality, and simultaneously reduce development interval.
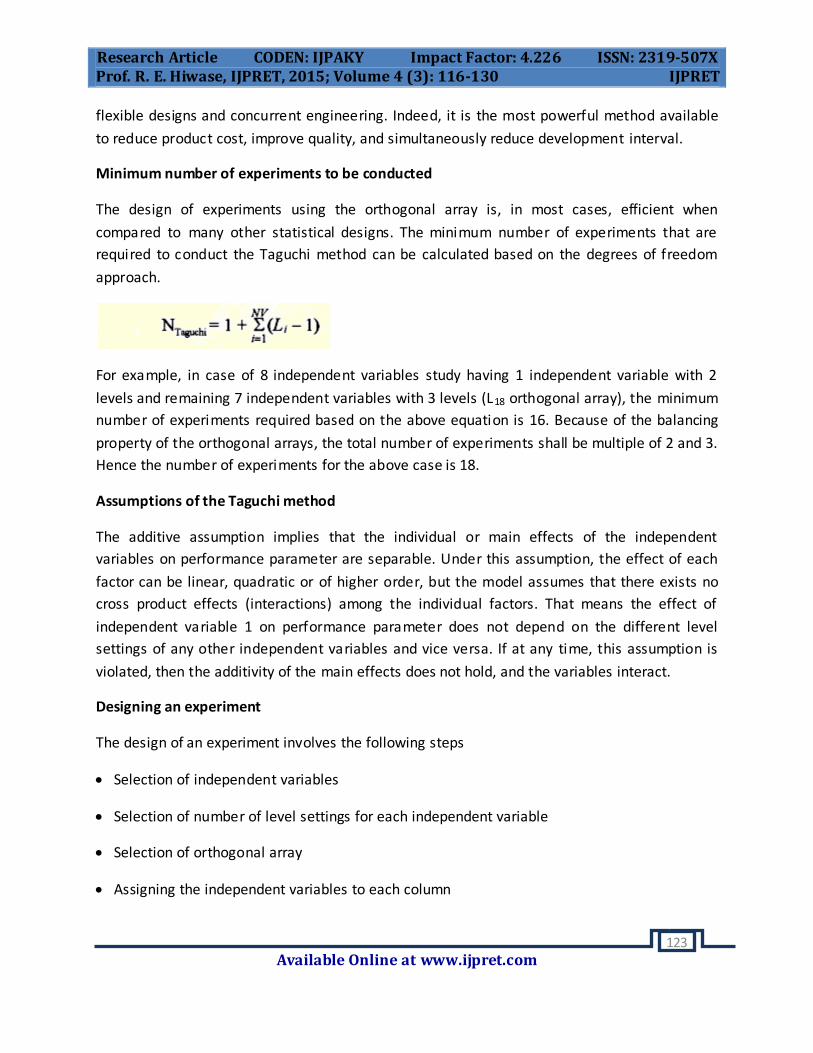
Minimum number of experiments to be conducted
The design of experiments using the orthogonal array is, in most cases, efficient when
compared to many other statistical designs. The minimum number of experiments that are
required to conduct the Taguchi method can be calculated based on the degrees of freedom
approach.
For example, in case of 8 independent variables study having 1 independent variable with 2
levels and remaining 7 independent variables with 3 levels (L18 orthogonal array), the minimum
number of experiments required based on the above equation is 16. Because of the balancing
property of the orthogonal arrays, the total number of experiments shall be multiple of 2 and 3.
Hence the number of experiments for the above case is 18.
Assumptions of the Taguchi method
The additive assumption implies that the individual or main effects of the independent
variables on performance parameter are separable. Under this assumption, the effect of each
factor can be linear, quadratic or of higher order, but the model assumes that there exists no
cross product effects (interactions) among the individual factors. That means the effect of
independent variable 1 on performance parameter does not depend on the different level
settings of any other independent variables and vice versa. If at any time, this assumption is
violated, then the additivity of the main effects does not hold, and the variables interact.
Designing an experiment
The design of an experiment involves the following steps
Selection of independent variables
Selection of number of level settings for each independent variable
Selection of orthogonal array
Assigning the independent variables to each column
Research Article CODEN: IJPAKY Impact Factor: 4.226 ISSN: 2319-507X Prof. R. E. Hiwase, IJPRET, 2015; Volume 4 (3): 116-130 IJPRET
Available Online at www.ijpret.com
124
Conducting the experiments
Analyzing the data
The details of the above steps are given below.
Selection of the independent variables
Before conducting the experiment, the knowledge of the product/process under investigation is
of prime importance for identifying the factors likely to influence the outcome. In order to
compile a comprehensive list of factors, the input to the experiment was obtained from all the
people involved in the roll bond evaporator manufacturing process.
Deciding the number of levels and Selection of an orthogonal array
Once the independent variables were decided, the number of levels for each variable was
decided. The selection of number of levels depends on how the performance parameter is
affected due to different level settings. If the performance parameter is a linear function of the
independent variable, then the number of level setting shall be 2. However, if the independent
variable is not linearly related, then one could go for 3, 4 or higher levels depending on whether
the relationship is quadratic, cubic or higher order.
Before selecting the orthogonal array, the minimum number of experiments to be conducted
was fixed based on the total number of degrees of freedom [3] present in the study. The
minimum number of experiments that must be run to study the factors was more than the total
degrees of freedom available. In counting the total degrees of freedom the investigator
commits 1 degree of freedom to the overall mean of the response under study. The number of
degrees of freedom associated with each factor under study equals one less than the number
of levels available for that factor. Hence the total degrees of freedom without interaction effect
is 1 + as already given by above equation. The minimum number of experiments was decided to
be 6 per week.
Assigning the independent variables to columns
The order in which the independent variables are assigned to the vertical column is very
essential. Finally, before conducting the experiment, the actual level values of each design
variable were decided.

Research Article CODEN: IJPAKY Impact Factor: 4.226 ISSN: 2319-507X Prof. R. E. Hiwase, IJPRET, 2015; Volume 4 (3): 116-130 IJPRET
Available Online at www.ijpret.com
125
Conducting the experiment
Once the orthogonal array was selected, the experiments were conducted to know the
manpower requirement for different processes, which were part of the roll bond
manufacturing process. Care was taken that all the experiments were conducted. The
performance parameter under study (manpower requirement) was noted down for each
experiment to conduct the sensitivity analysis.
Analysis of the data
Since each experiment is the combination of different factor levels, it is essential to segregate
the individual effect of independent variables. This can be done by summing up the
performance parameter values for the corresponding level settings. For example, in order to
find out the main effect of level 1 setting of the independent variable 2, sum the performance
parameter values of the experiments 1, 4 and 7. Similarly for level 2, sum the experimental
results of 2, 5 and 7 and so on. Once the mean value of each level of a particular independent
variable is calculated, the sum of square of deviation of each of the mean value from the grand
mean value is calculated. This sum of square deviation of a particular variable indicates whether
the performance parameter is sensitive to the change in level setting. If the sum of square
deviation is close to zero or insignificant, one may conclude that the design variables is not
influencing the performance of the process. In other words, by conducting the sensitivity
analysis, and performing analysis of variance (ANOVA), one can decide which independent
factor dominates over other and the percentage contribution of that particular independent
variable.
A main cause of poor yield in manufacturing processes is the manufacturing variation. These
manufacturing variations include variation in manpower skills or efficacy of the equipments,
variation in raw materials, and drift of process parameters. These sources of noise/variation are
the variables that are impossible or expensive to control.
The objective of the robust design was to find the controllable process parameter settings for
which noise or variation has a minimal effect on the product's or process's functional
characteristics. It is to be noted that the aim is not to find the parameter settings for the
uncontrollable noise variables, but the controllable design variables. To attain this objective,
the control parameters, also known as inner array variables, are systematically varied as
stipulated by the inner orthogonal array. For each experiment, a series of new experiments are
conducted by varying the level settings of the uncontrollable noise variables. The level
combinations of noise variables are done using the outer orthogonal array.

Research Article CODEN: IJPAKY Impact Factor: 4.226 ISSN: 2319-507X Prof. R. E. Hiwase, IJPRET, 2015; Volume 4 (3): 116-130 IJPRET
Available Online at www.ijpret.com
126
The influence of noise on the performance characteristics can be found using the ratio where S
is the standard deviation of the performance parameters for each inner array experiment and N
is the total number of experiment in the outer orthogonal array. This ratio indicates the
functional variation due to noise. Using this result, it is possible to predict which control
parameter settings will make the process insensitive to noise. Hence, based on the results of
the experiments, it was observed that when the roll bond evaporator manufacturing plant’s
layout is modified, the time needed to manufacture the units i.e. roll bond evaporators was
reduced significantly. This was evident from the overall batch production of the roll bond
evaporators, which showed significant (P<0.05) improvement. Besides, the manpower required
to complete the process also showed remarkable decline. This decline was evident throughout
the roll bond evaporator manufacturing process as well as sub-processes.
Statistical Analysis of data:
Statistical methods were used to analyze the data so that results and conclusions are objective
rather than judgmental in nature. Often we find that simple graphical methods play an
important role in data analysis and interpretation. Because many of the questions that the
experimenter wants to answer can be cast into a hypothesis testing framework, hypothesis
testing and confidence interval estimation procedures are very useful in analyzing data from a
designed experiment. It is also usually very helpful to present the results of many experiments
in terms of an empirical model, that is, an Equation derived from the data that expresses the
relationship between the response and the important design factors.
Analysis of Variance (ANOVA)
Analysis of Variance (ANOVA) is an incredibly effective method for analyzing the data obtained
from properly and scientifically designed experiments. Analysis of Variance is a statistical
method used to intercept experimental data and make necessary decisions. Analysis of
Variance is a statistically based decision tool for detecting any difference in average
performance- of groups of items tested. The decision rather than using pure judgment, takes
variations in account. The essence of ANOVA is that the total amount of variation in a set of
data is broken down in two types, that the amount which can be attributed to chance and that
amount which can be attributed to specify cause.
The ANOVA technique is important in the context of all those situations where we want to
compare two or more than two populations. In such circumstances one generally does not
want to consider all possible combinations of two populations at a time for that would be a ble
to arrive at a decision. This would consume lot of time and money and even then relationships

Research Article CODEN: IJPAKY Impact Factor: 4.226 ISSN: 2319-507X Prof. R. E. Hiwase, IJPRET, 2015; Volume 4 (3): 116-130 IJPRET
Available Online at www.ijpret.com
127
remains unidentified (particularly the interaction effects). Therefore, one quite often utilizes
the ANOVA technique and thoroughly investigates the differences among the means of all the
populations simultaneously.
Methodology of ANOVA:
In any experiment where several factors are allowed to vary, a situation called experimental
error exists. Experimental error is the random error created in the experiment from chance
variation in uncontrollable factors such as quality material, environmental conditions, and
operators involved. Taken together experimental error creates a background “noise” in the
data.
ANOVA measures this background noise. Then ANOVA measures the amount of signal creates a
real change in the response variable. If a factor is creating a signal that has more magnitude
than the background noise, we say that this factor has the significant effect. Factors that cannot
overcome the noise are called insignificant.
Thus through ANOVA technique one can, in general investigate any number of factors, which
are hypothesized or said to influence the dependent variable. One may investigate the
difference amongst various categories within each of these factors, which may have a large
number of possible values. We are said to use one-way ANOVA and in case we investigate two
factors at the same time, then we use two-way ANOVA. In two or more way ANOVA the
interaction (i.e. interaction between two independent variable factors) if any, between two
independent variables affecting a dependent variable can as well be studied for better decision.
Using PASW 18.0 Software for performing ANOVA
In the present study, Analysis of Variance procedure was carried out by using the PASW 18.0
software. The analysis was separately carried out for different sub-processes. Further to
ANOVA, a Post Hoc Test procedure was also carried out to know which means differ. In addition
to this the Tuckey’s HSD test was also carried out.
Statistical Analysis of Data and Significance Level
Analysis of data was done with the help of suitable statistical tests. The descriptive statistics,
such as mean, standard deviation, mode, frequency, percentage, minimum and maximum, etc.
were determined from the collected data. The comparative assessment was done using ANOVA
as well as suitable graphs. All the data generated during the study was processed using various
statistical tests with the aid of Statistical Package for Social Sciences (SPSS) 18.0 software. The

Research Article CODEN: IJPAKY Impact Factor: 4.226 ISSN: 2319-507X Prof. R. E. Hiwase, IJPRET, 2015; Volume 4 (3): 116-130 IJPRET
Available Online at www.ijpret.com
128
significance level was chosen to be 0.05 (or equivalently, 5%) by keeping in view the
consequences of such an error. That is, researcher wants to make the significance level as small
as possible in order to protect the null hypothesis and to prevent, as far as possible, from
inadvertently arriving at false conclusions
REFERENCES
1. Biren Prasad, (1995) A structured approach to product and process optimization for
manufacturing and service industries, International Journal of Quality & Reliability
Management, 1995, 12(9), pp.123 – 13
2. C. C. Wong, A. Danno, X. H. Huang and K. K. Tong. A study into a cost effective roll bonding
process for clad metals. SIMTech technical reports 2008,9 (2) 50
3. Cengiz Kahraman, Tijen Ertay , Gülçin Büyüközkan. A fuzzy optimization model for QFD
planning process using analytic network approach. European Journal of Operational Research.
2006, 171(2, 1), pp 390–411.
4. Christian J.L. Hermes, Cláudio Melo , Cezar O.R. NegrãoInternational Journal of Refrigeration.
A numerical simulation model for plate-type, roll-bond evaporators. 2008, 31, (2), pp 335–347
5. Diomidis D. Spinellis Chrissoleon T. Papadopoulos. Modular Production Line
Optimization:The ExPLOre Architecture. Mathematical Problems in Engineering, 2001; 6
(6):527-541
6. Duranik T., Stopper M. & Ruzbarsky J. (2014). Proposal of Storage Process
Optimization in Manufacturing Enterprise, Procedia Engineering, 69, pp. 550-554
7. Durga Prasad K.G., Subbaiah K.V. & Rao K.N. (2011). COST ENGINEERING WITH QFD: A
MATHEMATICAL MODEL, International Journal for Quality research. 5(1), UDK- 657.478
8. Gröger C., Niedermann F. & Mitschang B. (2012)., Data Mining Driven Manufacturing Process
Optiization, Proceedings of the World Congress on Engineering, 3, WCE 2012, London, U.K.
9. Hermes C.J.L., Melo C. & Negrão C.O.R. (2008). A numerical simulation model for plate type,
roll-bond evaporators, International Journal of Refrigeration, 31(2), pp. 335-347
10. Ilias Bin Mamat. Development of a simulation model for plant manufacturing strategies. A
Thesis Submitted To The University Of Wales .European Business Management School.
University of Wales, Swansea .United Kingdom 1992

Research Article CODEN: IJPAKY Impact Factor: 4.226 ISSN: 2319-507X Prof. R. E. Hiwase, IJPRET, 2015; Volume 4 (3): 116-130 IJPRET
Available Online at www.ijpret.com
129
11. Indrajit Mukherjee and Pradip Kumar Ray. A review of optimization techniques in metal
cutting processes. Computers & Industrial Engineering. 2006. 50(1–2), pp 15–34
12. J. C. Hernandez-Matias · A. Vizan · A. Hidalgo .J. Rios. Evaluation of techniques for
manufacturing process analysis. J Intell Manuf (2006) 17:571–583
13. Jayal A.D., Badurdeen F., Dillon Jr. O.W. & Jawahir I.S. (2010). Sustainable manufacturing:
Modeling and optimization challenges at the product, process and system levels, CIRP Journal
of Manufacturing Science and Technology, 2(3), pp.144-152
14. Joaquim M. Gonçalves, Cláudio Melo, Christian J.L. Hermes. A semi-empirical model for
steady-state simulation of household refrigerators. Applied Thermal Engineering 2009, 29(8–9),
pp 1622–1630
15. John Mapes, Marek Szwejczewski and Colin New. Process variability and its effect on plant
performance., International Journal of Operations & Production Management 2000, 20 (7), pp
792-808
16. Julie Z. Zhang, Joseph C. Chen, E. Daniel Kirby. Surface roughness optimization in an end-
milling operation using the Taguchi design method. Journal of Materials Processing Technology.
2007, 184(1–3), pp 233–239
17. Kruger G.H., Shih A.J., Hattingh D.G., & Niekerk T. I. (2011). Intelligent machine agent
architecture for adaptive control optimization of manufacturing processes, Advanced
Engineering Informatics, 25(4), pp. 783-796
18. Law Chee Hong.Performance optimization of domestic refrigerator using Experimental
method Report submitted in partial fulfillment of the requirements for the award of the degree
of Bachelor of Mechanical Engineering Faculty of Mechanical Engineering Universiti Malaysia
Pahang. 2009
19. M. Fatouh, M. El Kafafy. Experimental evaluation of a domestic refrigerator working with
LPG.Applied Thermal Engineering. 2006, 26(14–15), pp 1593–1603
20. M. Tement. Roll- Bond Evaporator Panel Double side and one side inflated2009, 4,1/14
21. Matej Visek, Cesare Maria Joppolo, Luca Molinaroli, Andrea Olivani. Advanced sequential
dual evaporator domestic refrigerator/freezer: System energy optimization. International
Journal of Refrigeration. 2014, 43, pp 71–79

Research Article CODEN: IJPAKY Impact Factor: 4.226 ISSN: 2319-507X Prof. R. E. Hiwase, IJPRET, 2015; Volume 4 (3): 116-130 IJPRET
Available Online at www.ijpret.com
130
22. Mustafa Kurt, Eyup Bagci, Yusuf Kaynak. Application of Taguchi methods in the optimization
of cutting parameters for surface finish and hole diameter accuracy in dry drilling processes.
The International Journal of Advanced Manufacturing Technology. 2009, 40( 5-6),pp 458-469
23. Navalertporn T. & Afzulpurkar N.V. (2011). Optimization of tile manufacturing process using
particle swarm optimization, Swarm and Evolutionary Computation, 1(2), , pp. 97-109
24. Neil Hooper, Dynamic distribution planning techniques: progressive logistics optimization
for manufacturers, Logistics Information Management, 1996, 9(3), pp.27 – 35
25. Nouira I., Frein F., Atidel B. Hadj-Alouane (2014). Optimization of manufacturing systems
under environmental considerations for a greenness-dependent demand, International Journal
of Production Economics, 150, pp. 188-198
26. O. Laguerre, D. Flick. Temperature prediction in domestic refrigerators: Deterministic and
stochastic approaches. International Journal of Refrigeration.2010, 33 (1), pp 41–51
27. P.R. Periyanan, U. Natarajan , Optimization of multiple-quality characteristics in micro-
WEDG process using Taguchi technique, International Journal of Quality & Reliability
Management, 2014, 31( 2), pp.205 – 219
28. Paul R. & Anand S. (2014). Optimization of layered manufacturing process for reducing form
errors with minimal support struc tures, Journal of Manufacturing Systems, In Press, Corrected
Proof,
29. R. Konda, K.P. Rajurkar, R.R. Bishu, A. Guha, M. Parson, (1999) Design of experiments to
study and optimize process performance, International Journal of Quality & Reliability
Management, 1999. 16(1), pp.56 – 71
30. Sun X., Wu J., Dai Y.& Wang R. (2014). Experimental study on roll bond
collector/evaporator with optimized-channel used in direct expansion solar assisted heat pump
water heating system, Applied Thermal Engineering, 66(1–2), pp. 571-579
31. Sushil, P.S. Satsangi, D.R. Prajapati, Optimization of process factors for controlling defects
due to melt shop using Taguchi method, International Journal of Quality & Reliability
Management, 2013, 30 (1), pp.4 – 22.