international journal of pharmaceutics - agilent · pdf filethe dip speed and dip interval of...
TRANSCRIPT

International Journal of Pharmaceutics 478 (2015) 318–327
Evaluation of the coat quality of sustained release pellets by individualpellet dissolution methodology
Min Xu, Celine Valeria Liew, Paul Wan Sia Heng *GEA-NUS Pharmaceutical Processing Research Laboratory, Department of Pharmacy, National University of Singapore, 18 Science Drive, 117543, Singapore
A R T I C L E I N F O
Article history:Received 8 July 2014Received in revised form 13 November 2014Accepted 26 November 2014Available online 27 November 2014
Keywords:Sustained release pelletsCoat qualityDrug release profileIndividual pellet dissolution
A B S T R A C T
This study explored the application of 400-DS dissolution apparatus 7 for individual pellet dissolutionmethodology by a design of experiment approach and compared its capability with that of the USPdissolution apparatus 1 and 2 for differentiating the coat quality of sustained release pellets. Drug loadedpellets were prepared by extrusion–spheronization from powder blends comprising 50%, w/wmetformin, 25%, w/w microcrystalline cellulose and 25%, w/w lactose, and then coated with ethylcellulose to produce sustained release pellets with 8% and 10%, w/w coat weight gains. Various pelletproperties were investigated, including cumulative drug release behaviours of ensemble and individualpellets. When USP dissolution apparatus 1 and 2 were used for drug release study of the sustained releasepellets prepared, floating and clumping of pellets were observed and confounded the release profiles ofthe ensemble pellets. Hence, the release profiles obtained did not characterize the actual drug releasefrom individual pellet and the applicability of USP dissolution apparatus 1 and 2 to evaluate the coatquality of sustained release pellets was limited. The cumulative release profile of individual pellet usingthe 400-DS dissolution apparatus 7 was found to be more precise at distinguishing differences in theapplied coat quality. The dip speed and dip interval of the reciprocating holder were critical operationalparameters of 400-DS dissolution apparatus 7 that affected the drug release rate of a sustained releasepellet during the individual dissolution study. The individual dissolution methodology using the 400-DSdissolution apparatus 7 is a promising technique to evaluate the individual pellet coat quality without theinfluence of confounding factors such as pellet floating and clumping observed during drug release testwith dissolution apparatus 1 and 2, as well as to facilitate the elucidation of the actual drug releasemechanism conferred by the applied sustained release coat onto the pellets.
ã 2014 Elsevier B.V. All rights reserved.
Contents lists available at ScienceDirect
International Journal of Pharmaceutics
journa l home page : www.e l sev ier .com/ loca te / i jpharm
1. Introduction
Coated pellets have extensive applications in the pharmaceuti-cal industry, ranging from aesthetic purposes to therapeuticnecessity. Ideally, good quality coated multi-particulates shoulddisplay an even coverage of coat, with smooth surface and nodefects (Hogan, 1995). The uniform thickness and the integrity ofthe deposited coat are critical to the functionality of sustainedrelease multi-particulates. For instance, coat defects such asblisters, flaking, cracks and pin-holes usually result in prematureexposure of the core content to the extracting media. In the case ofsustained release pellets, faster than expected drug release couldoccur when the coat thickness is compromised.
Coat weight gain, which is often expressed as the percentage ofcoating polymer applied onto the pellets, is popularly used to infer
* Corresponding author. Tel.: +65 65162930; fax: +65 67752265.E-mail address: [email protected] (P.W.S. Heng).
http://dx.doi.org/10.1016/j.ijpharm.2014.11.0570378-5173/ã 2014 Elsevier B.V. All rights reserved.
the pellet coat thickness (Ringqvist et al., 2003). However, theweight gain measurement is non-specific and does not considerthe physicochemical properties of the pellet coat (Ho et al., 2009).Tristimulus colour assessment has been found to be useful forroutine quality control and colour stability study of coated pellets(Turi et al., 1972). For example, spot colour measurement using thetristimulus colorimeter was employed to evaluate the colour coatdistribution on pellet surface and to study the influence of processfactors on the coating efficiency of the Wurster fluidized bedprocessor (Chan et al., 2001). However, there are limitations to theapplication of these colorimetric techniques as they require thepellet samples to be colour coated. In terms of pellets withfunctional coat for the purpose of taste masking or sustaining drugrelease, visual observations with light and scanning electronmicroscopy could be used to measure the coat thickness ofindividual pellets. However, such microscopy techniques arerestricted to the sample surface properties and there are inevitablepractical problems such as the difficulty in cross-sectioningspherical pellets (Wesdyk et al., 1990). Confocal laser scanning

M. Xu et al. / International Journal of Pharmaceutics 478 (2015) 318–327 319
microscopy has been introduced as a non-destructive techniquefor imaging film-core interface and quantifying the coat quality ofindividual thinly-coated small pellets by measuring their coatingthickness (Depypere et al., 2009). Other analytical techniques usedto investigate the physical characteristics of pellet coat includeatomic force microscopy (Ringqvist et al., 2003), nuclear magneticresonance spectroscopy, energy dispersive X-ray imaging (Ensslinet al., 2008), terahertz imaging (Haaser et al., 2013), electronparamagnetic resonance spectroscopy (Ensslin et al., 2009), andfluorescence microscopy (Andersson et al., 2000). Often, certainassumptions are required such as a perfectly spherical pellet whenthe estimation of pellet coat thickness is made by thesemeasurement techniques. However, in reality, pellets often haveless than perfect shapes and may be presented as elongated,elliptical or even rod-like particulates. In addition, although thesemicroscopy and spectroscopy techniques could indicate pellet coatuniformity by measuring the coat thickness, there may not bedirect relationship between these physical coat properties and thedrug release behaviour of the coated pellets.
For coated pellets designed for sustained release drug delivery,in vitro dissolution tests are often carried out using compendialdissolution testers to assure coat quality and release performance(Zahirul and Khan, 1996). However, it has been reported that thecumulative release kinetics observed in a multiple-unit system,being a summation of drug release from all the subunits, does notaccurately characterize the basic release mechanism of anindividual subunit (Hoffman et al., 1986). Moreover, it wasdemonstrated that the sustained release behaviour of differentpellets from the same coating batch varied to a great extent(Borgquist et al., 2004). Such wide ranging release properties of theindividual coated pellets in a dosage form suggested poorlycontrolled manufacturing processes especially during pelletcoating. Thus, manufacturing robustness requires introspection.In pellet coating, data on drug release properties of individualpellets could identify the uniformity of the spray coating processand be used in process optimization. Therefore, a dissolutiontechnique that allows profiling of single pellet drug release wouldbe desirable for the examination of individual dissolutioncharacteristics.
The reciprocating holder dissolution apparatus, designed incompliance with all the compendial requirements of United StatesPharmacopeia (USP) apparatus 7, is a small-volume dissolutiontesting system for non-disintegrating and extended release dosageforms. It was found to be suitable for dissolution studies of slowlyreleasing actives from medical devices such as subcutaneousimplants, drug eluting stents (Crist, 2009) and small transdermalpatches (Zhou et al., 2007). This apparatus uses a reciprocatingmotion to dip the dosage form in a medium at programmed timeintervals. Sustained release pellets with water-insoluble polymercoats are able to remain structurally unchanged in aqueousmedium for a prolonged period and as the drug content in anindividual pellet is rather low, the small-volume dissolutionsystem of apparatus 7 is ideal for determining its releasecharacteristics. Thus, the objective of this study was to explorethe application of dissolution apparatus 7 for assessing individualpellet coat quality by a design of experiment (DoE) approach and tocompare its findings with that of the USP dissolution apparatus1 and 2 for the determination of drug release from sustainedrelease pellets.
2. Materials and methods
2.1. Materials
Commercially available a-lactose monohydrate (GranuLac 200,Meggle, Germany) and drug metformin hydrochloride (BP grade,
Granules, India) were used to prepare pellets with microcrystallinecellulose (MCC, Avicel PH 101, FMC Biopolymer, Ireland). Acetoni-trile (HPLC grade, TEDIA, USA) and acetic acid (analytical grade,Merck, Germany) were used as supplied. The ethyl cellulosecoating dispersion (Surelease, Colorcon, USA) was diluted withwater from 25%, w/w solids to 15%, w/w solids and stirred forapproximately 30 min before use. Unless otherwise mentioned,water used was deionized water (Milli-Q, Millipore Corporation,USA).
2.2. Preparation of sustained release pellets
2.2.1. Preparation of drug loaded pellets by extrusion–spheronizationAn appropriate amount of powder (25%, w/w MCC, 25%, w/w
lactose and 50%, w/w micronized metformin) was first blended in adouble-cone blender (AR 400E, Erweka, Germany) at 10 rpm for20 min. The blended mixture was transferred into a planetarymixer (Major 250, Kenwood, UK) and moistened for 5 min with28.8%, v/w deionized water amounting to 80% of the WTmax (theamount of water corresponding to the maximum mean torquevalue in the rheological profile) obtained from mixer torquerheometry studies (MTR, Caleva Process Solutions, UK) on thecorresponding powder blend. The rheological studies of powderblend and preparation of drug loaded pellets followed the methodas described by Sarkar (Sarkar et al., 2013). The resultant wet masswas extruded using a screw speed of 85 rpm through a radial screwextruder (E140, GEA-AF, UK) fitted with a screen of 0.8 mmaperture diameter and thickness to target producing pellets in thesize range from 710 to 1000 mm. Extrudates were spheronized(S320, GEA-AF, UK) on a 30 cm cross-hatched frictional base platerotated at 500 rpm for 5 min. The resultant pellets were dried in afluid bed dryer (Strea-1, GEA-AF, UK) set with an inlet temperatureof 80 �C. The drying process was stopped when the monitoredproduct temperature reached 40 �C. The pellets were then furthersubjected to oven drying at 60 �C for at least 12 h.
2.2.2. Preparation of sustained release pellets by fluidized bed coatingDrug loaded pellets (710–1000 mm) weighing 250 g were
transferred into Wurster fluid bed coater (Strea-1, GEA-AF, UK)and coated with aqueous ethyl cellulose dispersion to producesustained release pellets with 8% and 10%, w/w coat weight gains(designated, 8% coat and 10% coat batches, respectively). Theprocess parameters used were as follows: inlet air volume, 80 m3/h; inlet temperature, 60 �C; product temperature, 38 �C; spray rate,3–5 g/min; and atomization pressure, 1.2 bar. The coating disper-sion was delivered by a two-fluid spray nozzle with a nozzle tip of1.2 mm and set to protrude at 1 mm from the flushed bottomposition. After coating, the pellets were oven dried at 60 �C for 12 h.The fines and agglomerates were fractionated using sieves withaperture sizes of 710 mm and 1400 mm, respectively.
2.3. Characterization of sustained release pellets
2.3.1. Size and size distributionSustained release pellets with 8% and 10% coats (approximately
50 g) were accurately weighed and sieved through a nest of sieves(Endecotts, UK) with aperture sizes chosen in a
p2 progression
from 710 mm to 90 mm on a sieve shaker (VS1000, Retsch,Germany) vibrated at 1 mm amplitude for 10 min. The relativeweights (%, w/w) of pellets in each sieve size fractions weredetermined and the cumulative percentage weight undersizegraph plotted. Median pellet size (D50) was determined from thepercentage weight undersize plot. Span value of pellets (SPpel) wascalculated according to Eq. (1).

320 M. Xu et al. / International Journal of Pharmaceutics 478 (2015) 318–327
SPpel ¼D90 � D10
D50(1)
where D10,D50 and D90 are the pellet diameters at the 10, 50, and90 percentiles of the cumulative percentage weight undersize plot,respectively. SPpel reflects the degree of homogeneity in pellet sizedistribution. A smaller SPpel value indicates a narrower and tightersize distribution.
Sustained release pellets with 8% and 10% coats were firstpassed through the 850 mm aperture size sieve and pellets thengently re-sieved using the same sieve. Pellets trapped in the sievemesh were carefully extricated using a soft brush, for later use inshape, coat thickness measurement, individual pellet weight anddrug content analyses and individual pellet dissolution studies.
2.3.2. ShapeShape analysis of the 850 mm pellets was carried out using an
image analyser on a stereomicroscope (SZH, Olympus, Japan). Theimages of two hundred randomly selected pellets were capturedwith a digital camera (DSP 3CCD, Sony, Japan) and analysed usingan imaging software (Image-Pro Version 6.3, Media Cybernetics,USA). Two shape determinant parameters, roundness and aspectratio, were calculated by Eqs. (2) and (3), respectively. Roundnessvalues emphasize the sphericity of pellets while pellet elongationis described by the aspect ratio (Bouwman et al., 2004). For aperfect sphere, these two shape parameters would bear the valueof unity.
Roundness ¼ P2
4pA(2)
Aspect ratio ¼ lb
(3)
where P, A and l are the perimeter, area and length of the two-dimensional particle outline, and b is the perpendicular widthagainst l.
2.3.3. Pellet coat thickness measurement by scanning electronmicroscopy (SEM)
Sustained release pellets with 8% and 10% coats were slicedequatorially using a razor blade. The cut pellets were examined andphotomicrographs taken at 80 times magnification using a SEM(JSM-6010LV, JEOL, Japan) with secondary electron imaging and anaccelerating voltage of 1.5 kV. The pellet coat thickness measure-ments were made from the photomicrographs by using theimaging software (InTouchScope Software, JEOL, Japan). Tenrandom measurements were made for each cut pellet surfaceand ten cut pellets were sampled for each batch.
Fig. 1. The schematic diagram of a dissolution set in 400-DS dissolution appa
2.3.4. Individual pellet weightA sample of 50 pellets was accurately weighed (AG 135, Mettler
Toledo, USA) and the average pellet weight (Ws) was calculated.Triplicated measurements were conducted for sustained releasepellets with 8% and 10% coats and results averaged.
2.3.5. Drug contentOne 850 mm size pellet was sampled randomly and ground with
a mortar and pestle. The resultant powder was transferred into a25 mL volumetric flask, deionized water added and sonicated for10 min to completely dissolve the drug. After making up to volume,the solution was filtered using 0.45 mm membrane filter (Regen-erated Cellulose, Sartorius Stedim Biotech, Germany) into vials. Thevials were then assayed using reversed-phase high performanceliquid chromatography (HPLC; SIL-10AD VP, LC-20AT VP, Shi-madzu, Japan) with the ODS C18 column (150 mm � 4.6 mm, 5 mm;Hypersil, Thermo Scientific, USA) at 40 �C and a diode arraydetector (SPD-M10A VP, Shimadzu, Japan) set at a wavelength of233 nm. Mobile phase of acetonitrile, purified water and acetic acid(55:44.75:0.25, v/v/v, respectively) was delivered at flow rate of0.5 mL/min and an injection volume of 10 mL used. For thesustained release pellets with 8% and 10% coats, 25 pellets fromeach batch were subjected to the drug content assay and resultsaveraged.
2.4. In vitro dissolution studies
2.4.1. Drug release from ensembles of pelletsDissolution studies were conducted using USP dissolution
apparatus 1 and 2 (9ST, Caleva, UK) with 900 mL deionized watermaintained at 37 � 0.5 �C and stirred at 100 rpm. At predeterminedtime intervals, samples of 5 mL were withdrawn and filtered(0.45 mm). The amount of metformin was determined spectro-photometrically (3101 PC, Shimadzu, Japan) at 233 nm. The finalsample was withdrawn after rotating the baskets at 300 rpm for30 min to ensure complete drug release. Runs were triplicated andresults averaged. From the plot of cumulative drug release (%)against time, T10 and T50, the times required for 10% and 50% drugrelease were determined. Model independent comparison ofdissolution profiles was carried out using the difference factor(f1) as calculated by Eq. (4). Two dissolution profiles are consideredsimilar when the f1 value varies from 0 to 15 (Moore and Flanner,1996).
The in vitro drug release data were fitted to three releasekinetics models which are commonly used for sustained releasedosage forms, namely zero-order, first-order and Higuchi models,employing, Eqs. (5)–(7), respectively. The best-fit model wasidentified by evaluating the coefficient of determination (R2),
ratus 7 and the illustration of one dip cycle during the drug release test.

Table 1Design variables and response variables for individual dissolution study ofsustained release pellets in 400-DS dissolution apparatus 7.
Order Design variables Response variables
Stda Runa A B C Ravg Rstd
1 1 10 20 9 6.47 4.9716 2b 20 40 9 8.19 3.805 3 10 40 6 10.21 7.226 4 30 40 6 6.91 5.308 5 30 40 12 13.71 8.62
10 6 20 60 6 12.21 5.837 7 10 40 12 25.83 13.9311 8 20 20 12 5.05 2.9817 9b 20 40 9 9.42 6.6613 10b 20 40 9 10.88 7.773 11 10 60 9 26.54 14.74
12 12 20 60 12 12.02 4.9314 13b 20 40 9 8.70 3.352 14 30 20 9 9.65 7.469 15 20 20 6 6.48 4.17
15 16b 20 40 9 9.07 5.294 17 30 60 9 12.03 6.28
(A) Refers to dip speed (DPM). (B) Refers to dip interval (min). (C) Refers to thevolume of dissolution medium (mL).
a Std order refers to the original order of the design while run order refers to theexact running order of the experiments after randomization.
b Denotes centre points of the Box–Behnken design.
M. Xu et al. / International Journal of Pharmaceutics 478 (2015) 318–327 321
where the highest R2 value indicates the best fit.
f 1 ¼ Sni¼1jRi � Tij
Sni¼1ðRi þ TiÞ=2
� 100 (4)
M0 � Mt ¼ K0t (5)
lnM0
Mt
� �¼ K1t (6)
Mt ¼ Kh
ffiffit
p(7)
where n is the total number of sampling points, Ri and Ti are themean drug release values for the two profiles at time point i,respectively. M0 and Mt correspond to the drug amounts at timezero and dissolved at a particular time t, respectively. K0, K1 and Kn
refer to the release kinetic constants obtained from the linearcurves of zero-order, first-order and Higuchi models, respectively.
2.4.2. Drug release from individual pelletFive coated pellets were randomly selected and subjected to
drug release test using the dissolution apparatus 7 (400-DS,Agilent Technologies, USA) in deionized water as dissolutionmedium maintained at 37 � 0.5 �C by heating jackets around thedissolution cells. The schematic diagram of a dissolution set in400-DS dissolution apparatus 7 and the illustration of one dip cycleduring the dissolution study is shown in Fig. 1. At the end of eachdip interval, 1.5 mL of the medium was withdrawn through theauto-sampling port at the base of the dissolution cell into a HPLCvial on the sample collection tray. An equivalent volume of freshmedium was then introduced by a fluidic module. The amount ofdrug released in each dip interval was assayed and percentage drugreleased for one pellet at all dip intervals during the dissolution runwere averaged to obtain the percentage drug release in each dipinterval for the pellet (Rx) and the standard deviation of percentagedrug release (SDx) was also determined. For a total of five pelletsamples in each run, the average percentage drug release in eachdip interval (Ravg) and the standard deviation of percentage drugrelease in each dip interval (Rstd) were calculated by Eqs. (8) and(9):
Ravg ¼ 15S
5i¼1Rx (8)
Rstd ¼ 15S
5i¼1 SDxð Þ (9)
Cumulative drug release profiles over a period of 240 min underoptimized settings in 400-DS were also plotted for individualsustained release pellets with 8% and 10% coats with a total of15 pellets for each sample.
2.5. Design of experiment
A three-level, three-factorial Box–Behnken experimental de-sign was used to evaluate the effects of the following designvariables: A, dip speed (DPM); B, dip interval (min); C, volume ofdissolution medium (mL), on the response variables. The objectiveof the design was to optimize the operational parameters used forconducting drug release test of individual pellet in the 400-DSdissolution apparatus 7 so that an appropriate amount of drugwould be released within each dip interval and the variabilitywould be minimal. The variability in drug release could be
characterized by the standard deviation of inter-pellet percentagedrug release rates. Hence, Ravg and Rstd were chosen as the responsevariables in the design. The design variables along with their low,medium and high levels which were decided based on the resultsof preliminary experiments and together with response variablesselected, are shown in Table 1. Based on the settings selected,17 experiments, including 5 centre points, were generated. Thesecentre points could be used to check for non-linearity andreproducibility of the system. Hence, no further replication ofthe design was needed. The experiments were conducted in arandomized order to reduce the effects of any possible factors thatwere not included in the study, particularly effects that were time-dependent. The possible effects of the design variables on theresponse variables were examined by fitting the responses to aleast-order polynomial model using response surface methodolo-gy (RSM). Process optimization was then carried out based on thefollowing criteria: (a) Ravg should be within 10–15%; (b) Rstd shouldbe minimal and not exceeding 5%.
2.6. Statistical analysis
The statistical analysis and process optimization were carriedout using Design-Expert (Version 8.0.7.1, Stat-Ease Inc., USA). Theresponse surface modelling was performed by a sequentialprocedure of collecting experimental data from each dissolutionstudy, estimating polynomials and checking model adequacy.Regression analysis was conducted in coded units, where low levelwas coded as �1 while high level was coded as 1. The level ofsignificance was defined as p < 0.05.
Process optimization was conducted by response optimizationof Design-Expert software. Once a significant model for a responsevariable was generated, it formed the design space for thisresponse variable and its desired value range could be input topredict the contributing design variables. Triplicate confirmationruns (n = 5) were subsequently conducted using the optimizedparameters to check the validity of the models generated by RSM.The responses were averaged and compared with 95% predictioninterval of the predicted value.
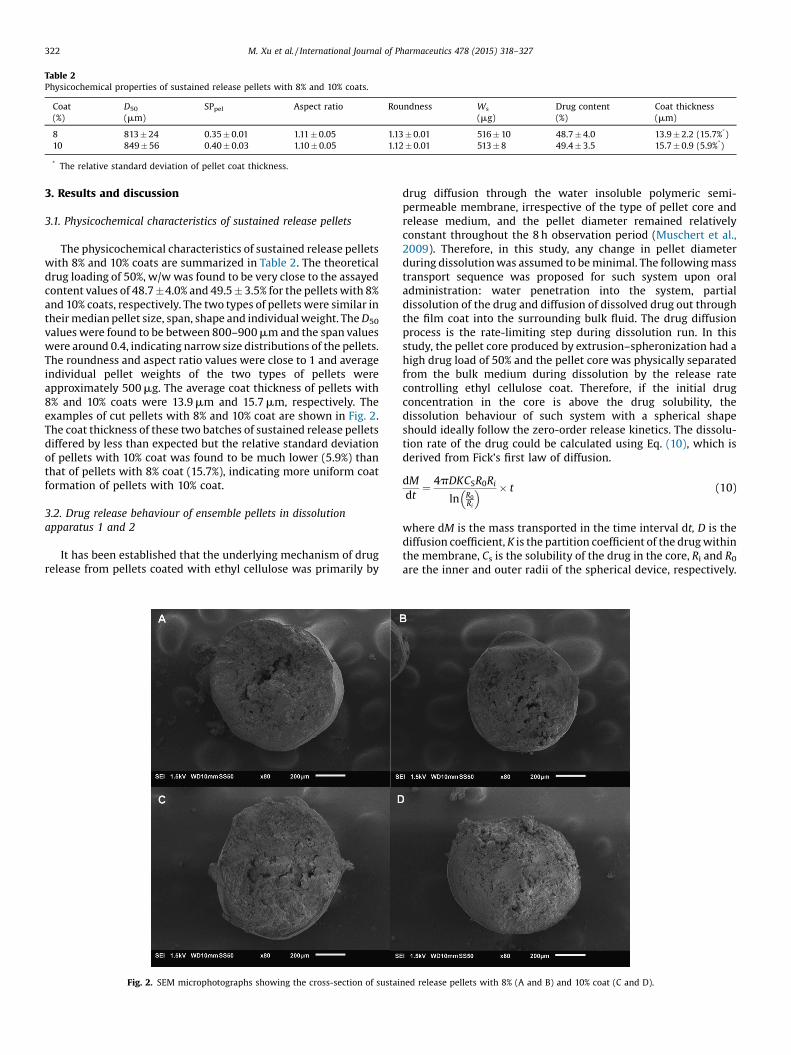
Table 2Physicochemical properties of sustained release pellets with 8% and 10% coats.
Coat(%)
D50
(mm)SPpel Aspect ratio Roundness Ws
(mg)Drug content(%)
Coat thickness(mm)
8 813 � 24 0.35 � 0.01 1.11 � 0.05 1.13 � 0.01 516 � 10 48.7 � 4.0 13.9 � 2.2 (15.7%*)10 849 � 56 0.40 � 0.03 1.10 � 0.05 1.12 � 0.01 513 � 8 49.4 � 3.5 15.7 � 0.9 (5.9%*)
* The relative standard deviation of pellet coat thickness.
322 M. Xu et al. / International Journal of Pharmaceutics 478 (2015) 318–327
3. Results and discussion
3.1. Physicochemical characteristics of sustained release pellets
The physicochemical characteristics of sustained release pelletswith 8% and 10% coats are summarized in Table 2. The theoreticaldrug loading of 50%, w/w was found to be very close to the assayedcontent values of 48.7 �4.0% and 49.5 � 3.5% for the pellets with 8%and 10% coats, respectively. The two types of pellets were similar intheir median pellet size, span, shape and individual weight. The D50
values were found to be between 800–900 mm and the span valueswere around 0.4, indicating narrow size distributions of the pellets.The roundness and aspect ratio values were close to 1 and averageindividual pellet weights of the two types of pellets wereapproximately 500 mg. The average coat thickness of pellets with8% and 10% coats were 13.9 mm and 15.7 mm, respectively. Theexamples of cut pellets with 8% and 10% coat are shown in Fig. 2.The coat thickness of these two batches of sustained release pelletsdiffered by less than expected but the relative standard deviationof pellets with 10% coat was found to be much lower (5.9%) thanthat of pellets with 8% coat (15.7%), indicating more uniform coatformation of pellets with 10% coat.
3.2. Drug release behaviour of ensemble pellets in dissolutionapparatus 1 and 2
It has been established that the underlying mechanism of drugrelease from pellets coated with ethyl cellulose was primarily by
Fig. 2. SEM microphotographs showing the cross-section of sustai
drug diffusion through the water insoluble polymeric semi-permeable membrane, irrespective of the type of pellet core andrelease medium, and the pellet diameter remained relativelyconstant throughout the 8 h observation period (Muschert et al.,2009). Therefore, in this study, any change in pellet diameterduring dissolution was assumed to be minimal. The following masstransport sequence was proposed for such system upon oraladministration: water penetration into the system, partialdissolution of the drug and diffusion of dissolved drug out throughthe film coat into the surrounding bulk fluid. The drug diffusionprocess is the rate-limiting step during dissolution run. In thisstudy, the pellet core produced by extrusion–spheronization had ahigh drug load of 50% and the pellet core was physically separatedfrom the bulk medium during dissolution by the release ratecontrolling ethyl cellulose coat. Therefore, if the initial drugconcentration in the core is above the drug solubility, thedissolution behaviour of such system with a spherical shapeshould ideally follow the zero-order release kinetics. The dissolu-tion rate of the drug could be calculated using Eq. (10), which isderived from Fick’s first law of diffusion.
dMdt
¼ 4pDKCSR0Ri
ln R0Ri
� � � t (10)
where dM is the mass transported in the time interval dt, D is thediffusion coefficient, K is the partition coefficient of the drug withinthe membrane, Cs is the solubility of the drug in the core, Ri and R0are the inner and outer radii of the spherical device, respectively.
ned release pellets with 8% (A and B) and 10% coat (C and D).

Fig. 3. Cumulative drug release profiles of ensemble of sustained release pellets with 8% and 10% coats using USP dissolution apparatus 1 (basket) and apparatus 2 (paddle).
M. Xu et al. / International Journal of Pharmaceutics 478 (2015) 318–327 323
The cumulative drug release profiles of ensemble pellets with8% and 10% coats using the dissolution apparatus 1 and 2 are shownin Fig. 3 and the modelled dissolution data are summarized inTable 3. As can be seen, the two types of pellets exhibited differentrelease patterns and rates in the two dissolution apparatus. Withthe paddle dissolution apparatus, the release profile of pellets with8% coat was observed to follow the zero-order model (R2 = 0.990)while that of pellets with 10% coat followed closer to the Higuchimodel (R2 = 0.991). However, when using the basket dissolutionapparatus, the dissolution profile of pellets with 8% coat fittedbetter to Higuchi model (R2 = 0.989) and that of pellets with 10%coat followed closer to the zero-order release model (R2 = 0.990).More importantly, for both pellet batches with 8% and 10% coats,the values of difference factor f1 were above 15, indicating thattheir drug release profiles obtained from the two dissolutionapparatus were significantly different. Therefore, the cumulativerelease profiles of ensemble pellets seemed to be confoundedwhen USP dissolution apparatus 1 and 2 were applied fordifferentiating the release properties of the sustained releasepellets.
For the paddle dissolution apparatus, pellets with 8% coat wereobserved to float on the surface of dissolution medium throughoutthe drug release test. T10 and T50 values from the drug releaseprofile were found to be longer than those obtained using thebasket dissolution apparatus, which suggested a slower drugrelease rate of 8% coat pellets with the paddle apparatus. On theother hand, the pellets with 10% coat were found to float initiallyand then sink into the dissolution medium during the drug release
Table 3Coefficients of determination obtained from ensemble of sustained release pellets with
dissolution profiles using T10, T50 and f1.
Coat(%)
Dissolution apparatus Zero-order Higuchi
R2 K0 R2 K
8 Paddle 0.990 0.253 0.982 58 Basket 0.925 0.238 0.989 510 Paddle 0.959 0.238 0.991 510 Basket 0.990 0.202 0.967 4
test with the paddle dissolution apparatus. The shorter T10 andT50 values of the release profile indicated a faster drug release ratethan that with the basket dissolution apparatus. Floating of pelletshad significantly reduced the effective surface area in contact withthe dissolution medium and thus slowed down the drug releaserate (Pillay and Fassihi, 1998). Moreover, excessive variability indrug release rate has also been reported due to the highlyheterogeneous fluid flow and complex hydrodynamics with thepaddle dissolution apparatus (Ameur and Bouzit, 2013). The use ofa wire or glass helix sinker, enclosing the dosage unit, to prevent itfrom floating (Nakamichi et al., 2001) could also significantlyimpede drug release and lead to an uneven dissolution from thesides of the ‘sinked’ dosage form (Burgess et al., 2004). Therefore,the cumulative release profile of the ensemble pellets obtained bythe paddle method may not truly reflect the actual drug releasemechanism of sustained release pellets and may even result inerroneous interpretations of the applied pellet coat properties.
With the basket dissolution apparatus, the pellet floatingproblem was avoided by entrapping the pellets in the dissolutionbasket. However, during the dissolution studies, conditions such asthe clumping of pellets could occur due to limits imposed by theconfined space and low shear force in the basket (D’Arcy et al.,2006). As can be seen in Fig. 3, the cumulative release profile ofensemble pellets with 8% coat appeared to have a two-phaserelease profile with a more rapid release initial phase followed by aslower release second phase. It was likely that the initial fasterrelease behaviour of the sustained release pellets was the outcomeof turbulence among the pellets with propensity to float while
8% and 10% coats according to three mathematical models and comparison of their
First-order T10(min)
T50(min)
f1
h R2 K1
.331 0.726 0.005 26.0 � 3.5 125.6 � 4.4 20
.158 0.689 0.004 19.5 � 3.3 109.0 � 11.3
.126 0.693 0.005 32.6 � 2.4 152.8 � 13.1 30
.223 0.824 0.005 56.8 � 6.1 225.4 � 7.5
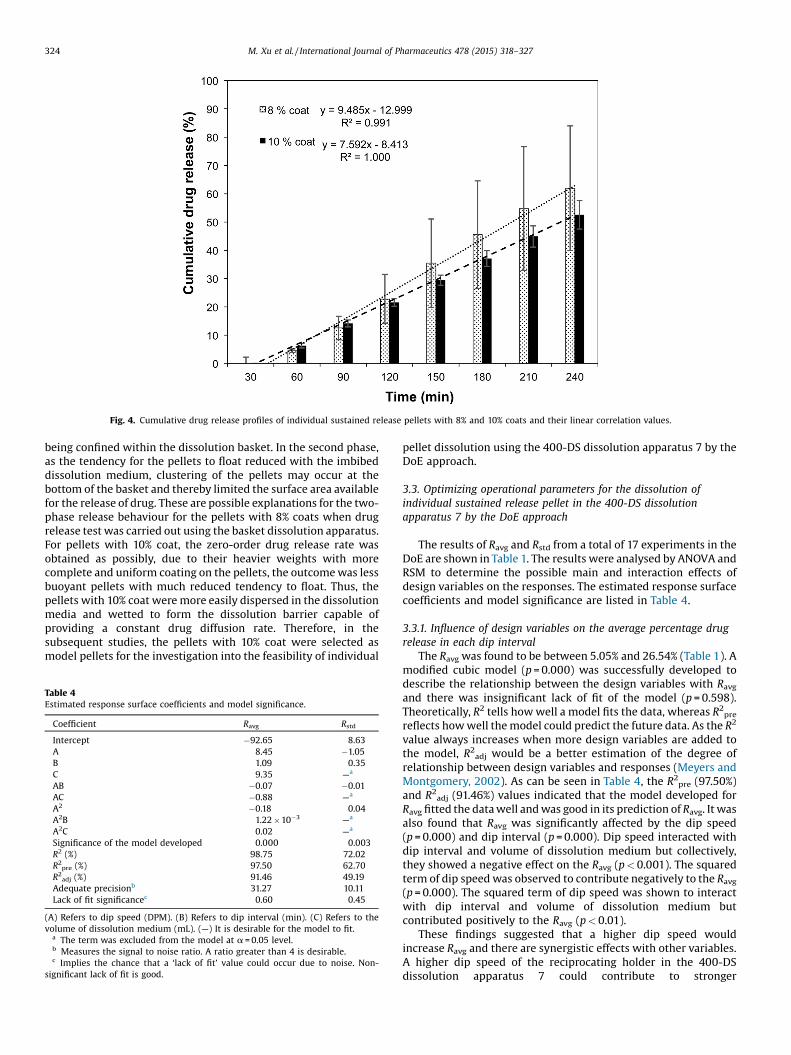
Fig. 4. Cumulative drug release profiles of individual sustained release pellets with 8% and 10% coats and their linear correlation values.
324 M. Xu et al. / International Journal of Pharmaceutics 478 (2015) 318–327
being confined within the dissolution basket. In the second phase,as the tendency for the pellets to float reduced with the imbibeddissolution medium, clustering of the pellets may occur at thebottom of the basket and thereby limited the surface area availablefor the release of drug. These are possible explanations for the two-phase release behaviour for the pellets with 8% coats when drugrelease test was carried out using the basket dissolution apparatus.For pellets with 10% coat, the zero-order drug release rate wasobtained as possibly, due to their heavier weights with morecomplete and uniform coating on the pellets, the outcome was lessbuoyant pellets with much reduced tendency to float. Thus, thepellets with 10% coat were more easily dispersed in the dissolutionmedia and wetted to form the dissolution barrier capable ofproviding a constant drug diffusion rate. Therefore, in thesubsequent studies, the pellets with 10% coat were selected asmodel pellets for the investigation into the feasibility of individual
Table 4Estimated response surface coefficients and model significance.
Coefficient Ravg Rstd
Intercept �92.65 8.63A 8.45 �1.05B 1.09 0.35C 9.35 —a
AB �0.07 �0.01AC �0.88 —a
A2 �0.18 0.04A2B 1.22 �10�3 —a
A2C 0.02 —a
Significance of the model developed 0.000 0.003R2 (%) 98.75 72.02R2pre (%) 97.50 62.70R2adj (%) 91.46 49.19Adequate precisionb 31.27 10.11Lack of fit significancec 0.60 0.45
(A) Refers to dip speed (DPM). (B) Refers to dip interval (min). (C) Refers to thevolume of dissolution medium (mL). (—) It is desirable for the model to fit.
a The term was excluded from the model at a = 0.05 level.b Measures the signal to noise ratio. A ratio greater than 4 is desirable.c Implies the chance that a ‘lack of fit’ value could occur due to noise. Non-
significant lack of fit is good.
pellet dissolution using the 400-DS dissolution apparatus 7 by theDoE approach.
3.3. Optimizing operational parameters for the dissolution ofindividual sustained release pellet in the 400-DS dissolutionapparatus 7 by the DoE approach
The results of Ravg and Rstd from a total of 17 experiments in theDoE are shown in Table 1. The results were analysed by ANOVA andRSM to determine the possible main and interaction effects ofdesign variables on the responses. The estimated response surfacecoefficients and model significance are listed in Table 4.
3.3.1. Influence of design variables on the average percentage drugrelease in each dip interval
The Ravg was found to be between 5.05% and 26.54% (Table 1). Amodified cubic model (p = 0.000) was successfully developed todescribe the relationship between the design variables with Ravgand there was insignificant lack of fit of the model (p = 0.598).Theoretically, R2 tells how well a model fits the data, whereas R2prereflects how well the model could predict the future data. As the R2
value always increases when more design variables are added tothe model, R2adj would be a better estimation of the degree ofrelationship between design variables and responses (Meyers andMontgomery, 2002). As can be seen in Table 4, the R2pre (97.50%)and R2adj (91.46%) values indicated that the model developed forRavg fitted the data well and was good in its prediction of Ravg. It wasalso found that Ravg was significantly affected by the dip speed(p = 0.000) and dip interval (p = 0.000). Dip speed interacted withdip interval and volume of dissolution medium but collectively,they showed a negative effect on the Ravg (p < 0.001). The squaredterm of dip speed was observed to contribute negatively to the Ravg(p = 0.000). The squared term of dip speed was shown to interactwith dip interval and volume of dissolution medium butcontributed positively to the Ravg (p < 0.01).
These findings suggested that a higher dip speed wouldincrease Ravg and there are synergistic effects with other variables.A higher dip speed of the reciprocating holder in the 400-DSdissolution apparatus 7 could contribute to stronger

Table 6Predicted and actual characteristics of Ravg and Rstd under optimized conditions in 400-DS dissolution apparatus 7.
Actual characteristics from triplicated confirmation runs Predicted characteristics(SD)
95% PI low 95% PI high
1 2 3 Mean (SD)
Ravg 9.66 9.62 10.31 9.86 (0.39) 11.19 (0.96) 9.33 13.04Rstd 5.85 6.39 5.98 6.07 (0.29) 5.25 (2.01) 2.21 8.29
SD refers to the standard deviation of actual characteristics from triplicated confirmation runs.
M. Xu et al. / International Journal of Pharmaceutics 478 (2015) 318–327 325
hydrodynamic forces in the dissolution medium. The diffusioncontrolled dissolution process could be explained by the com-monly used Nernst–Brunner equation as follows (Siepmann andSiepmann, 2013):
dmdt
¼ S � dd
� cs � ctð Þ (11)
where dm is the amount of drug which dissolves in the timeinterval dt, S denotes the surface area available for drug diffusion, dis the diffusion coefficient of the drug within the unstirred liquidboundary layer, d is the thickness of the boundary layer, cs and ctare the concentrations of dissolved drug at the pellet surface and inthe dissolution medium at time t, respectively.
Nernst–Brunner equation could be used to elaborate thetransport of drug molecules through the unstirred liquid boundarylayer surrounding a sustained release pellet. During the dissolutionstudy of individual sustained release pellet using a high dip speed,a more efficient agitation of dissolution medium decreased thethickness of unstirred boundary layer d, through which the drugdiffused. The reduced boundary layer thickness consequentlyresulted in a faster drug diffusion rate, or higher dm/dt. Theobserved increase in Ravg was likely to be due to a more efficienttransport of drug molecules between the unstirred boundary layerand the well agitated dissolution medium. The dip interval andvolume of dissolution medium could also influence dm/dt byaltering ct, concentration of dissolved drug in the dissolutionmedium.
3.3.2. Influence of design variables on the standard deviation ofaverage percentage drug release
The Rstd was found to range from 3.35% to 14.74% (Table 1). Asignificant quadratic model was successfully developed (p = 0.003)to describe the effects of design variables on Rstd. The model hadrelatively poor R2pre (62.70%) and R2adj (49.19%) values but couldstill serve to facilitate better understanding of the relationshipbetween design variables and Rstd. ANOVA revealed that dip speedhad a significant negative effect (p = 0.04) on Rstd. The squared termof dip sed (p = 0.003) was also observed to be significant,suggesting the relationship between dip speed and Rstd wasnon-linear. A reasonably high dip speed generated an unimpededand constant flow of the dissolution medium, which could reducethe unstirred boundary layer to an optimal thickness around thepellet during the drug release test. However, if the dip speed hadbeen too high, the distribution of shear forces around the unstirred
Table 5Results of numerical optimization with the highest D-value and the optimizedconditions chosen for use in individual dissolution by 400-DS dissolution apparatus7.
Number A B C Ravg Rstd D-value
1 15.53 29.37 11.94 10.32 4.97 12 16.23 31.29 11.95 10.06 4.99 13 13.26 23.59 11.45 10.70 4.95 14 15.77 30.02 11.63 10.06 4.98 15 13.35 22.60 11.34 10.10 4.75 16 15 30 12 11.19 5.25 0.984
(A) Refers to dip speed (DPM). (B) Refers to dip interval (min). (C) Refers to thevolume of dissolution medium (mL).
layer would likely be non-uniform. Such uneven shear forces mightlead to heterogeneity in the thickness of the unstirred boundarylayer, resulting in highly variable, non-reproducible drug releaserates (Siepmann and Siepmann, 2013).
The positive coefficient (p = 0.053) of dip interval indicated thatRstd increased when the dip interval was longer, probably due tothe accumulation of dissolved drug in the dissolution medium overa longer dip interval. However, if drug concentration wasexcessively high, the presentation of a sink condition in thedissolution medium could be impeded, resulting in less consistentdrug diffusion rate. The dip speed and dip interval were also foundto have a synergistically negative effect on Rstd (p = 0.018), whichrevealed that neither of these two operational parameters in 400-DS dissolution apparatus 7 contributed to the variation in drugrelease rate of a sustained release pellet independently.
3.4. Optimization of dissolution parameters in the 400-DS dissolutionapparatus 7
As the experimental range of Ravg was from 5.05 to 26.54%(Table 1), a medium average percentage drug release was chosenand set at 10–15%, in order to allow for sufficient number ofsamples in each dissolution test and to avoid too fast drug release.For Rstd, the target range was set to a minimum of 3–5% to reducethe variability in average drug release in each dip interval. Table 5shows the results of numerical optimization with highestdesirability by the numerical optimization function in Design-Expert statistical software. Desirability value (D-value) is ameasure of the accuracy of prediction. The closer the predictedresponse to the target, the closer the D-value is to one. Althoughfive combinations of dependent variables with the highest D-value(Numbers 1–5) were generated by the software, they were veryclose to each other and not the best operating parameters from thetechnical point of view. For instance, it was operationallychallenging to set the dip speed of the reciprocating holder toexactly 15.53 DPM and the dissolution volume to be 11.94 mL.Therefore, taking everything into consideration, optimized param-eters with a slightly lower D-value of 0.984 were chosen (Number6) to confirm the validity of the models generated by RSM.
Triplicated confirmation runs of individual dissolution in400-DS dissolution apparatus 7 under the chosen optimizedparameters were conducted. The results are summarized in Table 6and the mean of Ravg and Rstd were compared to the predictedresponse. 95% PI was defined as 95% of prediction intervalgenerated from the models developed in the DoE and was usedto predict the 95% confidence interval of response variable for thenext single observation under a specific setting of design variables.95% PI could help to assess the response of confirmationexperiments where more than one experimental run at theoptimized settings of design variables were carried out. If theresponse of confirmation experiments were within the 95% PI thenthe confirmation would be considered a success. As can be seen,both the average Ravg and Rstd fell within the 95% PI of predictedresponses and their standard deviations were rather low, indicat-ing the drug release profiles of individual sustained release pelletsin the 400-DS dissolution apparatus 7 could be accuratelypredicted by the RSM models developed in this study.
326 M. Xu et al. / International Journal of Pharmaceutics 478 (2015) 318–327
3.5. Comparison of release behaviours between the ensemble pelletsand individual pellets
The cumulative release profiles of ensemble pellets wereconfounded by the conditions of pellets during dissolution studies,such as whether they tended to float on the surface of dissolutionmedium or underwent dissolution as an aggregated cluster in thedissolution basket. Hence, the ensemble pellets release profilerepresents both the cumulative release of all the pellets within aswell as their potential interactive, like aggregation, or non-interactive, like floating, tendencies. Thus, the ensemble pelletsrelease may not represent the drug release behaviours ofindividual pellets. The 400-DS dissolution apparatus 7 has avariety of customized reciprocating holders, which are available toaccommodate dosage forms of different sizes and shapes. Thesesample holders could contain the whole dosage form and beagitate according to the programmed agitation rate. Such agitationallows the dosage form to be suspended freely in the dissolutionmedium. Hence, the confounding effects caused by conditions suchas bunching or aggregations of pellets during dissolution studieswere minimized. The cumulative release profiles of individualsustained release pellets with 8% and 10% coats are shown in Fig. 4.Linear relationships between cumulative drug release anddissolution time were obtained for sustained release pellets with8% and 10% coats with R2 = 0.991 and 1.000, respectively. Theobserved constant drug release rate supported the zero-orderrelease model of sustained release pellets with 10% coat using thebasket dissolution apparatus. As the pellet samples chosen forindividual dissolution studies were consistent in their diameters(850 mm sieve mesh aperture size), the effects of pellet size andsurface area on the dissolution rate were minimized. The higherstandard deviation in the individual drug release profiles indicatedgreater differences in the coat quality of pellets with 8% coat.Similarly, the significantly lower inter-pellet variability in cumu-lative drug release for sustained release pellets with 10% coat alsosuggested a more uniform coat formation with more ethylcellulose polymer deposited onto the pellet surface. This is alsocorroborated by the coat thickness measurement using SEM, inwhich the relative standard deviation of coat thickness for pelletswith 10% coat was much lower. Therefore, the coat quality ofsustained release pellets can be distinguished by the standarddeviations of cumulative drug release profiles obtained fromindividual dissolution methodology using the 400-DS dissolutionapparatus 7.
4. Conclusion
Pellet floating and clumping during dissolution studies ofsustained release pellets with dissolution apparatus 1 and 2 couldconfound the release profiles of ensemble pellets and therefore theresults did not characterize the actual drug release behaviour ofindividual sustained release pellets. This study explored thefeasibility of the 400-DS dissolution apparatus 7 to distinguishthe individual coat quality of sustained release pellets and toelaborate their underlying drug release mechanisms. A systematicDoE approach was used to optimize the operational parameters ofthe 400-DS dissolution apparatus 7 and mathematical modelswere successfully developed to describe the relationships betweendesign variables and responses. The dip speed and dip interval ofthe reciprocating holder were found to be critical parameters thataffected the drug release rate of sustained release pellets bychanging the hydrodynamics and sink conditions in the dissolutionmedium.
Individual pellet dissolution study for sustained release pelletsin 400-DS dissolution apparatus 7 was conducted using theoptimized parameters and subsequently compared with their
ensemble release profile. The drug release mechanism of sustainedrelease pellets could be elaborated by the cumulative releaseprofile of individual pellets and the standard deviation of drugrelease rate was found to be a useful coat quality indicator of thebatch of sustained release pellets. The individual pellet dissolutionusing the 400-DS dissolution apparatus 7 is a promising techniqueto evaluate pellet coat quality and provide better understanding ofthe actual drug release mechanism of a batch of sustained releasepellets.
Acknowledgements
The authors would like to acknowledge the financial supportfrom GEA-NUS PPRL fund (N-148-000-008-001) and A*STAR SERCGrant No.102 161 0049 (R-148-000-157-305). Agilent Technologiesis also acknowledged with appreciation for the loan of the 400-DSdissolution apparatus 7. Min Xu is a recipient of the NationalUniversity of Singapore Graduate Research Scholarship.
References
Ameur, H., Bouzit, M., 2013. 3D hydrodynamics and shear rates’ variability in theUnited States pharmacopeia paddle dissolution apparatus. Int. J. Pharm. 452,42–51.
Andersson, M., Holmquist, B., Lindquist, J., Nilsson, O., Wahlund, K.-G., 2000.Analysis of film coating thickness and surface area of pharmaceutical pelletsusing fluorescence microscopy and image analysis. J. Pharm. Biomed. Anal. 22,325–339.
Borgquist, P., Nevsten, P., Nilsson, B., Wallenberg, L.R., Axelsson, A., 2004. Simulationof the release from a multiparticulate system validated by single pellet and doserelease experiments. J. Control. Release 97, 453–465.
Bouwman, A.M., Bosma, J.C., Vonk, P., Wesselingh, J.H.A., Frijlink, H.W., 2004. Whichshape factor (s) best describe granules? Powder Technol. 146, 66–72.
Burgess, D.J., Crommelin, D.J., Hussain, A.S., Chen, M.-L., 2004. Assuring quality andperformance of sustained and controlled release parenterals. Eur. J. Pharm. Sci.21, 679–690.
Chan, L.W., Chan, W.Y., Heng, P.W.S., 2001. An improved method for themeasurement of colour uniformity in pellet coating. Int. J. Pharm. 213, 63–74.
Crist, G.B., 2009. Trends in small-volume dissolution apparatus for low-dosecompounds. Dissolution Technol. 16, 19–22.
Depypere, F., Van Oostveldt, P., Pieters, J.G., Dewettinck, K., 2009. Quantification ofmicroparticle coating quality by confocal laser scanning microscopy (CLSM).Eur. J. Pharm. Biopharm. 73, 179–186.
D’Arcy, D.M., Corrigan, O.I., Healy, A.M., 2006. Evaluation of hydrodynamics in thebasket dissolution apparatus using computational fluid dynamics – dissolutionrate implications. Eur. J. Pharm. Sci. 27, 259–267.
Ensslin, S., Moll, K.P., Metz, H., Otz, M., Mäder, K., 2009. Modulating pH-independentrelease from coated pellets: effect of coating composition on solubilizationprocesses and drug release. Eur. J. Pharm. Biopharm. 72, 111–118.
Ensslin, S., Moll, K.P., Paulus, K., Mäder, K., 2008. New insight into modified releasepellets–internal structure and drug release mechanism. J. Control. Release 128,149–156.
Haaser, M., Karrout, Y., Velghe, C., Cuppok, Y., Gordon, K.C., Pepper, M., Siepmann, J.,Rades, T., Taday, P.F., Strachan, C.J., 2013. Application of terahertz pulsed imagingto analyse film coating characteristics of sustained-release coated pellets. Int. J.Pharm. 457, 521–526.
Hogan, J.E., 1995. Sugar coating. In: Cole, G.C., Hogan, J.E., Aulton, M.E. (Eds.),Pharmaceutical Coating Technology. Taylor and Francis, UK, pp. 53–63.
Hoffman, A., Donbrow, M., Gross, S.T., Benita, S., Bahat, R., 1986. Fundamentals ofrelease mechanism interpretation in multiparticulate systems: determinationof substrate release from single microcapsules and relation between individualand ensemble release kinetics. Int. J. Pharm. 29, 195–211.
Ho, L., Cuppok, Y., Muschert, S., Gordon, K.C., Pepper, M., Shen, Y., Siepmann, F.,Siepmann, J., Taday, P.F., Rades, T., 2009. Effects of film coating thickness anddrug layer uniformity on in vitro drug release from sustained-release coatedpellets: a case study using terahertz pulsed imaging. Int. J. Pharm. 382, 151–159.
Meyers, R.H., Montgomery, D.C., 2002. Response Surface Methodology. Wiley, NewYork, NY.
Muschert, S., Siepmann, F., Leclercq, B., Carlin, B., Siepmann, J., 2009. Prediction ofdrug release from ethylcellulose coated pellets. J. Control. Release 135, 71–79.
Moore, J.W., Flanner, H.H., 1996. Mathematical comparison of dissolution profiles.Pharm. Technol. 20, 64–74.
Nakamichi, K., Yasuura, H., Fukui, H., Oka, M., Izumi, S., 2001. Evaluation of a floatingdosage form of nicardipine hydrochloride and hydroxypropylmethylcelluloseacetate succinate prepared using a twin-screw extruder. Int. J. Pharm. 218,103–112.
Pillay, V., Fassihi, R., 1998. Evaluation and comparison of dissolution data derivedfrom different modified release dosage forms: an alternative method. J. Control.Release 55, 45–55.

M. Xu et al. / International Journal of Pharmaceutics 478 (2015) 318–327 327
Ringqvist, A., Taylor, L.S., Ekelund, K., Ragnarsson, G., Engström, S., Axelsson, A.,2003. Atomic force microscopy analysis and confocal Raman microimaging ofcoated pellets. Int. J. Pharm. 267, 35–47.
Sarkar, S., Heng, P.W.S., Liew, C.V., 2013. Insights into the functionality ofpelletization aid in pelletization by extrusion–spheronization. Pharm. Dev.Technol. 18, 61–72.
Siepmann, J., Siepmann, F., 2013. Mathematical modeling of drug dissolution. Int. J.Pharm. 453, 12–24.
Turi, P., Brusco, D., Maulding, H.V., Tausendfreund, R.A., Michaelis, A.F., 1972. Rapiddetermination of color stability of tablet formulations. J. Pharm. Sci. 61,1811–1814.
Wesdyk, R., Joshi, Y.M., Jain, N.B., Morris, K., Newman, A., 1990. The effect of size andmass on the film thickness of beads coated in fluidized bed equipment. Int. J.Pharm. 65, 69–76.
Zahirul, M., Khan, I., 1996. Dissolution testing for sustained or controlled release oraldosage forms and correlation with in vivo data: challenges and opportunities.Int. J. Pharm. 140, 131–143.
Zhou, M.X., Shoudt, D., Calderon, G., Feng, M., 2007. Application of USP Apparatus7 to in vitro drug release in scopolamine transdermal systems. DissolutionTechnol. 14, 25–29.