international journal of materials research in science
TRANSCRIPT

International Journal of Materials Research in Science & TechnologyVolume 1 | Issue 1
Research Article Open Access
https://journalofmaterials.com 1
Research Article
Higher Intrinsic Quantum Yield of Eu3+-Doped Zn2sio4 Obtained by Sol-Gel Process, Calculated by Judd - Ofelt Theory
Adriana Souza de Oliveira1, Juliana Maria Martins Buarque1, Luiz Fernando Cappa de Oliveira2, Clebio Soares Nascimento Jr.3, Marco Antonio Schiavon1, Helliomar P. Barbosa4, Jose Henrique Faleiro4 and Jefferson Luis Ferrari1,2*
1Grupo de Pesquisa em Quimica de Materiais – (GPQM), Departamento de Ciencias Naturais (DCNAT), Universidade Federal de São João del-Rei (UFSJ), Campus Dom Bosco (CDB), Praca Dom Helvecio, 74, 36301-160, Sao Joao del-Rei, MG, Brazil2Núcleo de Espectroscopia e Estrutura Molecular (NEEM), Universidade Federal de Juiz de Fora (UFJF), Juiz de Fora, Minas Gerais, José Lourenço Kelmer, s/n – Martelos, Brazil, 36036-3303Universidade Federal de São Joao del-Rei (UFSJ), Campus Dom Bosco (CDB), Praca Dom Helvecio, 74, 36301-160, São João del-Rei, MG, Brazil4Desenvolvimento de Materiais Inorgânicos com Terras Raras (DeMITeR), Laboratorio de Materiais Fotoluminescentes (LAMAF), Instituto de Quimica – (IQ), Universidade Federal de Uberlândia – (UFU), Av. Joao Naves de Ávila, 2121 – Bairro Santa Mônica, CEP: 38400-902, Uberlândia, MG, Brazil
Received Date: May 15, 2020; Accepted Date: May 21, 2020; Published Date: May 28, 2020
AbstractThe sol-gel process allows the obtaining of Eu3+-doped Zn2SiO4 with 1 mol% with different molar ratios between Zn2+ and Si4+. The
materials reported here were obtained with a resistive furnace at 600, 900, 1000 and 1100°C degree, during 2 h. All the materials exhibited an intense photoluminescence emission with bands assigned to the Eu3+ transitions. Among the materials studied, the samples containing 70 and 80% of Si4+, exhibited higher Eu3+ lifetimes values. The predominance of the quartz phase decreases micro deformations and the location of the Eu3+ ions in higher symmetry sites, reducing the intensity of the photoluminescent materials. The increasing of annealing temperature contributes to the detrimental lifetime and luminescence materials due to the location of the Eu3+ in the site of high symmetry. Through Judd-Ofelt theory was possible to obtain higher values of intrinsic quantum yield ( )Ln
LnQ between 32 and 66% dependent on the temperature of heat-treatment, in comparison with the same material reported in the literature.
Key Words: Orthosilicates; Photoluminescence; Rare Earth; Europium;
Introduction
Among the many classes of materials that currently contribute to the improvement of the worldwide quality of people’s lives, those with photoluminescent properties are among the most sought after and researched [1]. Currently, there is interest in the development and improvement of photoluminescent materials
*Corresponding author: Prof. Jefferson Luis Ferrari, Grupo de Desenvolvimento de Materiais Inorgânicos com Terras Raras (DeMITeR),Laboratório de Materiais Fotoluminescentes (LAMAF – Bloco 3Z), Universidade Federal de Uberlândia Instituto de Química – Bloco 1D, Av. João Naves de Avila, 2121 – Santa Mônica, Uberlândia – MG, Brazil, E-mail: [email protected] or [email protected]
Citation: Luis Ferrari J, Adriana Souza de O, Juliana Maria MB, Luiz Fernando Cappa de CO, et al. (2020) Higher Intrinsic Quantum Yield of Eu3+-Doped Zn2sio4 Obtained by Sol-Gel Process, Calculated by Judd - Ofelt Theory. Int J Mater Res Sci Tech 1(1):1-14.https://doi.org/10.47890/IJMRST/2020/JLFerrari/14205431
with higher efficiency on its properties and also high stability in chemical characteristics [2–7]. The luminescent properties mainly of inorganic materials are very attractive, due to their potential applications in optoelectronics [8], photonics, optics [4,9–15], as light-emitting diodes (LEDs) [16], sensors, scintillators[6, 7, 17], solar cells [7, 18–21], lasers and others [4,22–29]. Typically these materials can be obtained with a composition in which comprise

International Journal of Materials Research in Science & Technology
https://journalofmaterials.com
Helics Group
2
a host matrix and an activator Rare Earth (RE3+) ion emitter [5, 31–33].
RE3+ doped different kinds of materials are very attractive for applications in photoluminescence due to their intrinsic spectroscopic characteristics, that are dependent on the electronic configuration and consequently of f-f intraconfigurational transitions [34, 35]. Due to the lanthanide contraction properties, the f orbitals are located internally, making these orbitals be weakly affected by environment or crystal field, resulting in thin spectral lines and monochromatic spectra characteristics [32, 36, 37].
Among the most promising luminescent materials, zinc orthosilicate, Zn2SiO4, shows interesting properties like high photoluminescent efficiency, transparency from UV to the visible range, high refractive index (~ 1.7), high-energy of band gap (5.5 eV) and crystalline structure with high thermal and mechanical stability, making it a suitable host matrix for RE3+ [38, 39]. Dependent on the characteristics of the energy level of RE3+ dopant ion, these materials can be an emitter of electromagnetic radiation in a wide range from ultraviolet to medium infrared region. Emitter materials in the blue, green and red region can be obtained easily when the Ce3+, Tb3+, and Eu3+, are present in the host matrix [40]. RE3+-doped Zn2SiO4 has applications in many optoelectronic devices, such as cathode ray tubes, light emitting diodes, coverings, lamps, flat screen monitors, amplifiers, lasers, sensors and radiation detectors for medical imaging systems [31,37,41 and 42].
Especially in search of materials that can emit in the red region of the electromagnetic spectrum, the Eu3+ it is widely used due mainly to its emission attributed to the transition 5D0→7F2 of f-f intraconfigurational transition. This emission is widely studied in the exact literature as it contributes to the use of energy in the region of approximately 612 nm [43]. The Eu3+ ion doped Zn2SiO4 host lattice and due to the intraconfigurational transitions 4f-4f can show narrow bands in the visible spectrum, which can improve the luminescence efficiency of these phosphors [44]. In addition, these matrices can act as an excellent sensitizer transferring part of their energy to the emitting 5D1, 5D0 levels of the Eu3+ ion. Moreover, the principal emitting 5D0 level is non-degenerate and exhibits a long phosphorescence decay time (around milliseconds).
Many kinds of the experimental procedure for obtaining of Zn2SiO4 are reported, that include the conventional solid-state reaction, solution-based syntheses like sol-gel process, co-precipitation, hydrothermal method, and others. Among them, the solid-state reaction is the most used to produce silicate due to its simplicity of operation and suitability for industrial applications. However, this procedure is not feasible due to the high temperatures of calcination, long reaction time, and difficulty in controlling and agglomerating particles [45, 46]. The sol-gel process is quite feasible because the reactions of precursor’s solutions are conducted at low temperatures of reaction, resulting in products with good crystallinity and small diameter of particles.
Another very important point that needs to be taken into account is the homogeneity of the components in the precursor solution that improve the high quality in the material final composition [47, 48].
Among many ways of RE3+ doped zinc orthosilicates applications, such as those previously reported, White Light Emitting Diodes (WLED’s) are receiving great attention because of their luminescent efficiency, low power consumption, the long service life of the devices [49, 50]. Luminescent materials for WLED’s applications normally combine material that emits blue light (In ,Ga)N and another that emits yellow light, usually cerium doped yttrium aluminate (Y3Al5O12), (YAG: Ce) [44, 51]. These WLED’s emit a bluish cold light and are normally used in lighting systems that require a long lifetime of use, being applied in car lights, traffic lights, external lighting, among others. If, on the one hand, these WLED’s have high luminous efficiency, they still have drawbacks to color reproduction, specifically the weakness of the red-light component due to thermal and suppression of luminescence. Therefore, it is necessary to develop warm WLED’s and more efficient color reproduction, which can be used in more sophisticated applications such as indoor lighting. Devices made by combining blue LEDs with phosphors that emit green and red and LED light with red, green, and blue phosphors are among the alternative methods of generating white light. These WLED’s support multiple broadband emitters, improving color reproduction, which makes the light source more similar to sunlight, needed for more specific applications [52, 53].
To contribute with the understanding of better photoluminescence properties in the materials obtained, the Judd-Ofelt theory is an interesting procedure to obtain information about radiative transition rates, nonradiative rates, and emission intrinsic quantum yield when it comes based on RE3+ doped materials [54–56].
Considering all these needs and applications, this study aims to apply the sol-gel process for preparing of Eu3+-doped zinc silicate with low dopant concentration (1 mol%). Besides, the influence of the heat-treatment temperature and the ratios between the amount of silicon (Si) and zinc (Zn) used in the precursor solution was verified. As a base of the obtained materials, its photoluminescent properties and structural characteristics of the obtained materials were evaluated to design a possible application in photonic materials.
Experimental
Sample Preparation
The syntheses were performed by sol-gel process with the molar ratios of Si:Zn of 90:10 (9SZ), 80:20 (8SZ), 70:30 (7SZ), 60:40 (6SZ) and 50:50 (5SZ), with Si+Zn = 0.445 mol L-1 were based on the work reported by Ferrari, J.L. and [14,57,58]. The tetraethoxysilane, TEOS (98% - Sigma Aldrich), and europium

International Journal of Materials Research in Science & Technology
https://journalofmaterials.com
Helics Group
3
oxide, Eu2O3 (Sigma Aldrich – 99.99%), were used as silicon and rare-earth precursors, respectively. The doping was performed at 1 mol% of Eu3+, calculated concerning the total number of moles of Zn+Si. The stock solution of Eu3+ 0.01 mol L-1 was prepared and standardized with EDTA 0.01 mol L-1 to ensure effective doping concentration in each material obtained. In this point it is important to report that de RE2O3 behaves as a primary standard. Initially, two solutions were prepared separately. The first one containing TEOS, anhydrous ethanol and hydrochloric acid (0.27 mol L-1), with the molar ratio between TEOS:HCl equal to 1:0.007, respectively. The second one is composed of a mixture of Zn2+ and Eu3+ in an anhydrous alcohol solution. Both solutions were mixed, resulting in 20 mL of the final solution, and kept under stirring for 15 min, at room temperature, for homogenization of the components to obtain the sol. The sol was kept in an oven at 60 °C for 24 h to obtain the xerogel. The xerogels obtained were grounded in an agate mortar and then were submitted to the heat-treated in an oven at 600, 900, 1000 and 1100°C for 2 h with a heating rate of 10°C min-1. The xerogels obtained at 60°C were analyzed by thermogravimetric analysis (TGA) and differential thermal analysis (DTA) using a Shimadzu thermal analyzer, model DTG-60H with a heating rate of 10 °C min-1 under air atmosphere from room temperature up to 1100°C. The FT-IR spectra of the materials after heat-treatment at different temperatures, as well as their precursors, were obtained using a Perkin-Elmer Spectrum GX spectrometer, in the region of 4000-400 cm-1. The samples in powder form were prepared in the form of pellets, diluted in spectroscopy degree KBr under 10 tons of pressure. In order to obtain information about the crystalline structure, the materials were analyzed by X-ray diffraction (XRD), with a Shimadzu diffractometer, CrKα (λ = 2.2909 Å) radiation, in the 2θ range of 10-70° with a scanning rate of 0.02° s-1. The positions and intensity of the peaks were compared with the standard JCPDS card to identify the crystalline phase formed. Through the analysis of data from XRD patterns, the crystallite size of the samples was calculated using Debye–Scherrer’s Equation (1) [59–63].
in which D is the nanocrystallite size (nm), K is the shaper factor (0.9) (in which the use this value is considering the spherical shape of the particles), λ is the wavelength of CrKα radiation, Δβ is the correction of full width at half maximum (FWHM) of the most intense diffraction peak and θ is the diffraction angle. To correct the FWHM, Si with particle size >20 mm was used as a pattern. The calculation of lattice strain (micro deformations) was achieved with the classic Williamson-Hall method (W-H) [64].
Wherein ∆K=2 cosθ Δβ/λ; Δβ is the correction of FWHM; θ is the Bragg angle; λ is the wavelength of the incident radiation CrKα (2.2909 Å); K = 2 senθ/λ and DW-H is the size of crystallite; ε is the lattice strain (microdeformation). Using the data of the diffraction peaks to build a linear curve with(∆K)2 as a function of
. cos
kD λβ θ
=∆ (1)
(2)( )2
2 2 20.9 4W H
K KD
ε−
∆ = +
K2 whose slope gives the value of the strain of the crystal lattice. The photoluminescence emission spectra, between 550 and 750 nm, were obtained at room temperature using a spectrofluorometer SPEX Fluorolog F2121/Jobin-Yvon-HORIBA with excitation fixed at 255, 394 and 463 nm. The excitation and emission slits used were 4 and 2 nm, respectively. The filter cut-off bellow 490 nm was used in the entrance of emission monochromator. The study of the emission decay curves as a function of time to obtain the values of the lifetime of the excited state of the Eu3+ was conducted with the same equipment, at room temperature. The samples were excited using a pulsed lamp in the same wavelengths of the excitation reported before, while the wavelength of emission was fixed at 612 nm. The slits used in this experiment were the same used to obtain the emission spectra. The morphology of the obtained materials were analyzed by Scanning Electron Microscopy (SEM), using a Hitachi TM 3000 bench microscope with 1000X of magnification and a voltage of 15 eV.
Results and Discussion
The profile of the thermal decomposition of xerogels may indicates the temperatures used in the heat-treatment of precursors for obtaining the desired material. The concomitant analysis of TG and DTA curves permits the identification of the temperatures associated with the crystallization process of the zinc silicate. Figure 1 shows the TG and DTA analysis of the synthesized xerogels. The steps of TG and DTA curves of the sample with the highest percentage of zinc, Figure 1(A), 50 mol% of zinc, are very well defined when compared to the curves obtained from the other xerogel. DTA curves exhibit an intense endothermic peak around 104°C in which may be associated with the evaporation of adsorbed water and organic compounds from solutions precursors. There are consecutive events associated with the loss of mass between 182 and 550°C that may be associated with the decomposition of organic groups from TEOS used as a precursor. The presence of the events related to the burning and decomposition of organic compounds is important once the conversion of precursors in Zn2SiO4 can be induced during the removal of these species. DTA curves suggest a slow crystallization of the samples, because a well-defined exothermic peak is not observed in temperatures above 600°C. The exothermic broad peaks positioned between 808 and 900°C are attributed to the crystallization of the silicate phase and phase transition from β-Zn2SiO4 to α- Zn2SiO4. The total
Table 1: Loss of mass of the samples during thermogravimetric
analysis.Composition Mass loss/%
5SZ 626SZ 587SZ 418SZ 399SZ 33

International Journal of Materials Research in Science & Technology
https://journalofmaterials.com
Helics Group
4
Figure 1: TG and DTA curves of xerogel samples for (A) 5SZ and (B) 9SZ.
mass loss, shown in Table 1 changes significantly as a function of xerogel samples composition. Xerogels containing higher amounts of silicon in the composition, Figure 1 (B) (90% of Si), presents less mass loss due to the formation of a dense SiO2 network structure.
Analyses of FT-IR (Figure 2) were performed to monitor the structural changes as a function of heat-treatments and different compositions of materials. The wide band located at ~3510 cm-1 is attributed to O-H stretching vibrations present in silanol groups physically adsorbed on the surface of the particles. The bands centered at 1609 cm-1 is associated to the vibrational mode assigned to H-O-H angular deformation of water molecules present in the materials. This water molecule localized on the particle probably was adsorbed during the cooling process or from the precursors used in the synthesis process. During the sol-gel process, water molecules are formed as a product of the main reaction.
Both bands are absent or have a considerably diminished intensity as a function of heat-treatment temperature. The elimination of O-H groups is convenient because this drastically influences the optical properties of the materials, compromising their photoluminescence efficiency. The spectra present as an absorption band at 1100 cm-1 with a shoulder at 1225 cm-1 assigned to the asymmetric stretching mode of Si-O-Si, typical of SiO2, suggesting the formation of a SiO2 network in the samples.
The samples not heat-treated exhibit vibration modes at 952 cm-1 associated with the Si-O stretching in Si-OH groups and Si-O- positioned on the surface. The bands at 472 cm-1 and 805 cm-1 are associated to the bending and stretching, respectively, of Si-O-Si present in SiO2[65].
Structural changes after heat-treatment were observed based on the appearance of absorption bands between 400 and 1350 cm-1, indicating the formation of Zn2SiO4 phase. The characteristic bands of willemite (highlighted in Figure 2) occur at 978, 929 and 897 (ν3, SiO4), 865 (ν1, SiO4) and 461 (ν4, SiO4), and 615 (ν3, ZnO4) and 574 (ν1, ZnO4); in which ν1 refers to fully symmetrical stretching, ν3 asymmetric stretching and ν4 asymmetric deformation[66]. Representative bands of willemite are very well defined in the spectra of the samples containing higher amounts of zinc. 7SZ and 9SZ samples exhibit absorption band around 790 cm-1 indicating the presence of SiO2. For composition 7SZ, this band is less evident, however, for the composition 9SZ, the band is quite significant, showing higher intensity compared to the absorption bands between 980-897 cm-1 assigned to Zn2SiO4. It is considered that the stretching Si-O-Zn, of Zn2SiO4, which occurs at 900-950 cm-1 was overlaid by the strong and intense absorption SiO4 modes. However, the formation of Zn-Si-O- bonding is evidenced not only by the appearance of bands assigned to the willemite, but also by the shift of the positions of bands assigned to the ZnO and SiO2.

International Journal of Materials Research in Science & Technology
https://journalofmaterials.com
Helics Group
5
Figure 2:FTIR spectra of the samples (A) 5SZ, (B)7SZ and (C) 9SZ.
The structure of willemite consists of silicon and oxygen tetrahedron, SiO4
4-, in which atoms are covalently bonded. There is an ionic interaction between the zinc atoms and the oxygen of the tetrahedron. There is, therefore, connection between complex anions since they are surrounded by Zn2+. The distance of Si-O bonds is smaller than the distances between the Zn-O. Thus, the changes in wavenumbers depicted in the spectra are assigned to the strengthening of the Zn-O bond and reduction of the average energy on bonding of Si-O due to the formation of Si-O-Zn in the materials.
The diffractograms of the samples are depicted in Figure 3. The diffraction peaks of the samples 5SZ agree with the JCPDS 37-1485 card confirming the formation of the willemite phase, with a trigonal system. In accordance with other compositions, the 8SZ 9SZ sample shows the presence of a quartz phase, in accordance with JCPDS 46-1045, trigonal system, and space group R3H (148). It is possible to verify that the silica formation as well as the silicate
phase formation are directly dependent on the amount of Si4+ and Zn2+.
The graphs of crystallite size (CS) and lattice strain (LS) results as a function of the amount of silicon used were plotted and are depicted in Figure 4. It is observed that the crystallite size (Figure 4A) becomes larger with the increase in temperature of the heat-treatment. Furthermore, when annealed at 900°C, a large crystallite size distribution is observed for the different compositions of materials. Differently from the samples heat-treated at 1000 and 1100 °C, which exhibit greater uniformity of CS. In general, it is possible to notice a decrease in the LS (Figure 4B), by increasing of the amount of silicon to a percentage of 80 mol%; for samples 9SZ the LS returns to being expressive.
The emission spectra of samples excited at 255, 394 and 463 nm are shown in Figures 5, 6 and 7, respectively. All the emission spectra show bands characteristic of Eu3+ emission, assigned to the intraconfigurational f-f transitions, originated

International Journal of Materials Research in Science & Technology
https://journalofmaterials.com
Helics Group
6
Figure 3: Diffractograms of the: (A) 5SZ, (B)6SZ, (C) 7SZ, (D)8SZ and (E) 9SZ of the samples heat-treated at different temperatures obtained by the sol-gel process.
Figure 4: (A) Crystallites size of the samples calculated by Scherrer’s equation and (B) lattice strain values calculated by Williamson-Hall method, both obtained as a function of percentage of Si and heat-treatment temperature.

International Journal of Materials Research in Science & Technology
https://journalofmaterials.com
Helics Group
7
Figure 5: Emission spectra of the samples heat-treated at (A) 600, (B) 900 and (C) 1000 and 1100 °C under excitation at 255 nm.
Figure 6: Emission spectra of the samples heat-treated at (A) 600, (B) 900 and (C) 1000 and 1100°C under excitation at 394 nm.

International Journal of Materials Research in Science & Technology
https://journalofmaterials.com
Helics Group
8
from 5D0→7F2 levels, wherein J = 0, 1, 2, 3 and 4, positioned at 578, 591, 612, 652 and 701 nm, respectively. The band centered at 614 nm, corresponding to the 5D0→7F2 transition that occurs in the red region, exhibits greater intensity for all samples. This transition is forbidden by parity but becomes allowed when the Eu3+ is positioned in the site without an inversion symmetry center. Thus, this transition occurs through forced dipole-electric and is hypersensitive to the local environment in which the ion is positioned. The transition 5D0→7F1, in turn, takes place via magnetic dipole and is independent of the local symmetry in which the RE3+ is located. In general, the broad emission band profile in the spectra is observed for all samples under excitation in all wavelengths. However, the profiles of emission bands in the spectra of samples heat-treated at 1100°C, are thinner in comparison to another one. As discussed by XRD analysis, the sample heat-treated at 1100°C
presents the zinc silicate phase in greater proportion. In this sense, this crystalline phase promotes the presence of the sites with higher symmetry contributing to the formation of thinner band shape for the emission bands spectra of the samples heat-treated at 1100°C. In the emission bands spectra of the samples 9SZ heat-treated at 900, 1000 and 1100°C under excitation at 255 nm it is observed the presence of a broad band below 600 nm. Another point observed is that the intensity of the emission bands assigned to the 5D0 ®7FJ with J = 0, 3 and 4 for samples 9SZ heat-treated at 900, 1000 and 1100°C under excitation at 255 nm, are almost not present. The absence of these bands can be attributed to the presence of defects in SiO2 amorphous phase acting as a deactivator of the excited state.
Figure 7 and 8 shows the ratio graphics depending on the amount of silicon in the samples. The ratio between the intensities
Figure 7: Emission spectra of the samples heat-treated at (A) 600, (B) 900 and (C) 1000 and 1100°C under excitation at 463 nm.
Figure 8: Relation of the intensities between transitions 5D0→7F2 and 5D0→7F1 depending on amount of silicon in the samples,
when excited at (A) 255, (B) 394 and (C) 463 nm.

International Journal of Materials Research in Science & Technology
https://journalofmaterials.com
Helics Group
9
of these transitions, 5D0→7F2 / 5D0→7F1, is fundamental to investigate the vicinity of Eu3+, acting, therefore, as a structural probe of local symmetry. The higher the ratio values between both transitions corresponds to the site of symmetry with a high magnitude of electric dipole.
All materials exhibit higher values of R, indicating that the Eu3+
is inserted in non-centrosymmetric sites. Moreover, there is a wide range of values of ratio (2.5 to 4.0) for the materials synthesized, suggesting a significant change in the symmetry sites occupied by
the Eu3+. The highest R values (~ 4.0), obtained for the 5SZ and 7SZ samples, both treated at 900°C, depict the low symmetry in Eu3+ ions site are located which explains the high intensity of the 0-2 transition regarding the 0-1 transition due to the high magnitude of electric dipole present in the environment of the ion. The samples of the photoluminescence intensity are observed to be strongly correlated to the heat-treatment temperature of the samples as well as the concentration of system components.
The lifetimes of the values for all materials are shown in Table
Table 2: Values of the lifetimes of the materials heat-treated at different temperatures.
λexc/nm T/°C
Lifetime/ms
5SZ 6SZ 7SZ 8SZ 9SZ
255
900 1.616 1.578 1.675 1.807 1.7961000 1.406 1.406 1.654 1.596 1.5081100 1.155 1.198 1.416 1.274 0.864
394
900 1.704 1.614 1.709 1.832 1.7251000 1.466 1.404 1.692 1.624 1.5421100 1.173 1.311 1.444 1.301 1.059
463
900 1.599 1.513 1.641 1.711 1.5991000 1.444 1.314 1.58 1.55 1.2221100 1.104 1.209 1.279 1.182 0.863
Figure 9: Decay curve for 5D0→7F2 transition of sample 8SZ under excitation at 255 nm in which is representative for all samples obtained in this work.
2. In general, the lifetime values decrease as the heat-treatment temperature increases. It may be related to the insertion of the Eu3+
in sites with higher symmetry. A representative curve of lifetime for all samples is depicted in Figure 9 and is adequately described by monoexponential decays.
To understanding better the photoluminescent properties of the RE3+ doped materials the intensity of f-f transition is fundamental.
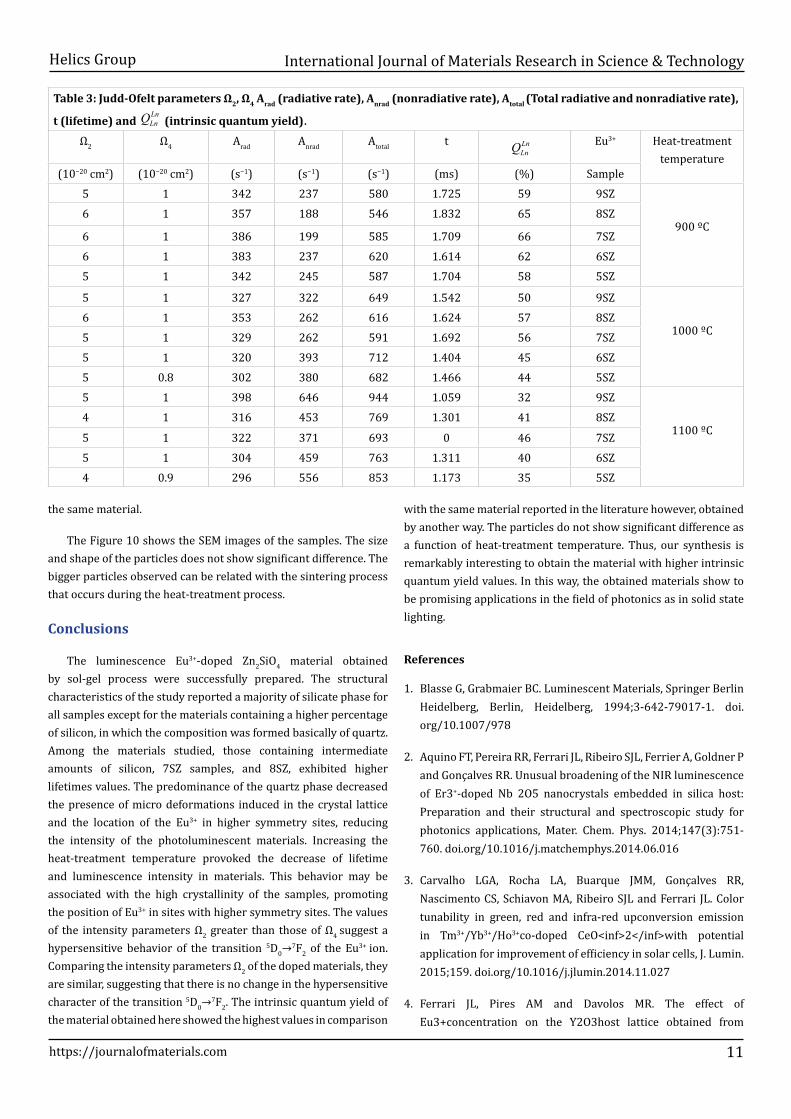
Then, based on results obtained in this work, the Judd-Ofelt theory [54–56] was applied to obtain information about of two empirical parameters Ω2 (corresponding to the 5D0→7F2 transition is mainly influenced by small angular changes in coordination geometry of the Eu3+ ion) and Ω4 (corresponding to the 5D0→7F4 is greatly influenced by the distance of the bond formed between the Eu3+ ion and the ligand) [67–69]. In the Table 3 are exhibited the Judd-Ofelt parameters obtained in this work. In accordance with the values

International Journal of Materials Research in Science & Technology
https://journalofmaterials.com
Helics Group
10
obtained, the intrinsic quantum yield is higher in comparison with the same material obtained by polymer assisted by sol-gel method
[70]. In comparison with this work reported literature, the process of synthesis used in our work showing better and easier to obtain
Figure 10: Scanning Electron Microscopy of the materials obtained.
International Journal of Materials Research in Science & Technology
https://journalofmaterials.com
Helics Group
11
Table 3: Judd-Ofelt parameters Ω2, Ω4 Arad (radiative rate), Anrad (nonradiative rate), Atotal (Total radiative and nonradiative rate),
t (lifetime) and LnLnQ (intrinsic quantum yield).
Ω2 Ω4 Arad Anrad Atotal t Eu3+ Heat-treatment temperature
(10−20 cm2) (10−20 cm2) (s−1) (s−1) (s−1) (ms) (%) Sample5 1 342 237 580 1.725 59 9SZ
900 ºC6 1 357 188 546 1.832 65 8SZ
6 1 386 199 585 1.709 66 7SZ6 1 383 237 620 1.614 62 6SZ5 1 342 245 587 1.704 58 5SZ
5 1 327 322 649 1.542 50 9SZ
1000 ºC6 1 353 262 616 1.624 57 8SZ5 1 329 262 591 1.692 56 7SZ5 1 320 393 712 1.404 45 6SZ5 0.8 302 380 682 1.466 44 5SZ5 1 398 646 944 1.059 32 9SZ
1100 ºC4 1 316 453 769 1.301 41 8SZ
5 1 322 371 693 0 46 7SZ5 1 304 459 763 1.311 40 6SZ4 0.9 296 556 853 1.173 35 5SZ
LnLnQ
the same material.
The Figure 10 shows the SEM images of the samples. The size and shape of the particles does not show significant difference. The bigger particles observed can be related with the sintering process that occurs during the heat-treatment process.
Conclusions
The luminescence Eu3+-doped Zn2SiO4 material obtained by sol-gel process were successfully prepared. The structural characteristics of the study reported a majority of silicate phase for all samples except for the materials containing a higher percentage of silicon, in which the composition was formed basically of quartz. Among the materials studied, those containing intermediate amounts of silicon, 7SZ samples, and 8SZ, exhibited higher lifetimes values. The predominance of the quartz phase decreased the presence of micro deformations induced in the crystal lattice and the location of the Eu3+ in higher symmetry sites, reducing the intensity of the photoluminescent materials. Increasing the heat-treatment temperature provoked the decrease of lifetime and luminescence intensity in materials. This behavior may be associated with the high crystallinity of the samples, promoting the position of Eu3+ in sites with higher symmetry sites. The values of the intensity parameters Ω2 greater than those of Ω4 suggest a hypersensitive behavior of the transition 5D0→7F2 of the Eu3+ ion. Comparing the intensity parameters Ω2 of the doped materials, they are similar, suggesting that there is no change in the hypersensitive character of the transition 5D0→7F2. The intrinsic quantum yield of the material obtained here showed the highest values in comparison
with the same material reported in the literature however, obtained by another way. The particles do not show significant difference as a function of heat-treatment temperature. Thus, our synthesis is remarkably interesting to obtain the material with higher intrinsic quantum yield values. In this way, the obtained materials show to be promising applications in the field of photonics as in solid state lighting.
References
1. Blasse G, Grabmaier BC. Luminescent Materials, Springer Berlin Heidelberg, Berlin, Heidelberg, 1994;3-642-79017-1. doi.org/10.1007/978
2. Aquino FT, Pereira RR, Ferrari JL, Ribeiro SJL, Ferrier A, Goldner P and Gonçalves RR. Unusual broadening of the NIR luminescence of Er3+-doped Nb 2O5 nanocrystals embedded in silica host: Preparation and their structural and spectroscopic study for photonics applications, Mater. Chem. Phys. 2014;147(3):751-760. doi.org/10.1016/j.matchemphys.2014.06.016
3. Carvalho LGA, Rocha LA, Buarque JMM, Gonçalves RR, Nascimento CS, Schiavon MA, Ribeiro SJL and Ferrari JL. Color tunability in green, red and infra-red upconversion emission in Tm3+/Yb3+/Ho3+co-doped CeO<inf>2</inf>with potential application for improvement of efficiency in solar cells, J. Lumin. 2015;159. doi.org/10.1016/j.jlumin.2014.11.027
4. Ferrari JL, Pires AM and Davolos MR. The effect of Eu3+concentration on the Y2O3host lattice obtained from

International Journal of Materials Research in Science & Technology
https://journalofmaterials.com
Helics Group
12
citrate precursors, Mater Chem Phys. 2009;113:587–590. doi.org/10.1016/j.matchemphys.2008.08.002
5. Perrella RV, Dos Santos DP, Poirier GY, Góes MS, Ribeiro SJL, Schiavon MA and Ferrari JL. Er3+-doped Y2O3 host lattice obtained by polymeric precursor: Synthesis, structure and upconversion emission properties, J. Lumin. 2014;149:333-340. doi.org/10.1016/j.jlumin.2014.01.052
6. Ferrari JL, Pires AM, Serra OA, Davolos MR. Luminescent and morphological study of Sr2CeO4 blue phosphor prepared from oxalate precursors, J Lumin. 2011;131(1):25-29. doi.org/10.1016/j.jlumin.2010.08.020
7. Rocha LA, Schiavon MA, Nascimento CS, Guimarães L, Góes MS and Pires AM, et al. Sr2CeO4: Electronic and structural properties, J. Alloys Compd. 2014;608:73–78. doi.org/10.1016/j.jallcom.2014.04.091.
8. Godlewski M, Wolska E, Yatsunenko S, Opalińska A, Fidelus J and Łojkowski W, et al. Doped nanoparticles for optoelectronics applications, Low Temp. Phys. 2009;35:48–52. doi.org/10.1063/1.3064908
9. Reis DHS, Pecoraro E, Cassanjes FC, Poirier GY, Gonçalves RR and Esbenshade, et al. Multifunctional possible application of the Er3+/Yb3+-coped Al2O3 prepared by recyclable precursor (aluminum can) and also by sol-gel process, Opt. Mater. (Amst). 2018;84:504–513. doi.org/10.1016/j.optmat.2018.07.017.
10. LA Rocha, Siqueira RL, Esbenshade J, Schiavon MA and Ferrari JL. Photoluminescence and thermal stability of Tb3+-doped GdO3 nanoparticles embedded in SiO2 host matrix, J. Alloys Compd. 2018;731. doi.org/10.1016/j.jallcom.2017.10.084
11. Aquino FT, Ferrari JL, Maia LJQ, Ribeiro SJL, Ferrier A, Goldner P and Gonçalves RR. Near infrared emission and multicolor tunability of enhanced upconversion emission from Er3+-Yb3+co-doped Nb2O5 nanocrystals embedded in silica-based nanocomposite and planar waveguides for photonics, J. Lumin. 2016. doi.org/10.1016/j.jlumin.2015.08.077
12. Reis DHS, Buarque JMM, Schiavon MA, Pecoraro MA, Ribeiro SJL and Ferrari JL. Simple and cost-effective method to obtain RE3+-doped Al2O3 for possible photonic applications, Ceram. Int. 2015;41. doi.org/10.1016/j.ceramint.2015.04.086
13. Cunha CDS, Ferrari JL, Ribeiro SJL, Ferrari M and Gonçalves RR. Tailoring the Structure and Luminescence of Nanostructured Er3 and Er3+/Yb3+ -Activated Hafnia-Based Systems, J. Am. Ceram. Soc. 2015;98. doi.org/10.1111/jace.13689
14. Ferrari JL, Lima KO, Maia LJQ, Ribeiro SJL, Gomes ASL and Gonçalves RR. Broadband NIR emission in sol-gel Er3+-Activated
SiO2-Ta2O5 glass ceramic planar and channel waveguides for optical application, J Nanosci Nanotechnol. 2011;11(3):2540-2544. doi.org/10.1166/jnn.2011.3565
15. Gonçalves RR, Guimarães JJ, Ferrari JL, Maia LJQ and Ribeiro SJL. Active planar waveguides based on sol-gel Er3+-doped SiO2-ZrO for photonic applications: Morphological, structural and optical properties, J Non Cryst Solids. 2008;354(42-44):4846-4851. doi.org/10.1016/j.jnoncrysol.2008.05.055
16. Weaver MS, Lidzey DG, Pavier MA, Mellor H, Thorpe SL, Bradley DDC and Richardson T, et al. Organic light-emitting diodes (LEDs) based on Langmuir-Blodgett films containing rare-earth complexes, Synth. Met. 1996;76:91–93. doi.org/10.1016/0379-6779(95)03425-J
17. Ferrari JL, Pires AM, Serra OA and Davolos MR. Luminescent and morphological study of Sr2CeO4 blue phosphor prepared from oxalate precursors, J Lumin. 2011;131(1):25–29. doi.org/10.1016/j.jlumin.2010.08.020
18. Buarque JMM, Manzani D, Scarpari SL Nalin M, Ribeiro SJL and Esbenshade J, et al. SiO2-TiO2 doped with Er3+/Yb3+/Eu3+ photoluminescent material: A spectroscopy and structural study about potential application for improvement of the efficiency on solar cells, Mater Res Bull. 2018;107:295–307. doi.org/10.1016/j.materresbull.2018.07.007
19. De Mayrinck C, Santos DP, Ribeiro SJL, Schiavon MA and Ferrari JL. Reassessment of the potential applications of Eu3+-doped Y2O3 photoluminescent material in ceramic powder form, Ceram. Int. 2014;40. doi.org/10.1016/j.ceramint.2014.07.125
20. Dos Reis PM, De Oliveira AS, Pecoraro E, Ribeiro SJL and MS Góes MS, et al. Photoluminescent and structural properties of ZnO containing Eu3 using PEG as precursor, J. Lumin. 2015;167:197-203. doi.org/10.1016/j.jlumin.2015.06.025
21. AL Pena, Buarque JMM, Schiavon MA, Rangel JL, Carvalho I and Gonçalves RR, et al. Structural and optical investigations of Eu3+-doped TiO2 nanopowders, Ceram. Int. 2016;42. doi.org/10.1016/j.ceramint.2016.01.077
22. De Mayrinck C, Schiavon MA, Nascimento CS, Guimarães L, and Davolos M. Spherical-shaped Y2O3:Eu3+nanoparticles with intense photoluminescence emission, Ceram. Int. 2015;41(1);1189. doi.org/10.1016/j.ceramint.2014.09.047
23. Ferrari JL, Cebim MA, Pires AM, Couto Dos Santos MA. Y2O3:Eu3+ (5 mol%) with Ag nanoparticles prepared by citrate precursor, J. Solid State Chem. 2010;183. doi.org/10.1016/j.jssc.2010.07.010
24. Clare AG. Rare Earths in Glasses for Laser Applications, Key Eng. Mater. 1994;94–95:161–180. doi.org/10.4028/www.scientific.

International Journal of Materials Research in Science & Technology
https://journalofmaterials.com
Helics Group
13
net/KEM.94-95.161
25. Donohue T. Laser Purification of the Rare Earths, Opt. Eng. 1979;18. doi.org/10.1117/12.7972347
26. Hecht J. Rare earths create useful long-wavelength lasers, Laser Focus World. 1993;29:135–142.
27. Girard S, Kuhnhenn J, Gusarov A, Brichard B, Van Uffelen M and Ouerdane Y, et al. Radiation Effects on Silica-Based Optical Fibers: Recent Advances and Future Challenges, IEEE Trans. Nucl. Sci. 2013;60:2015–2036. doi.org/10.1109/TNS.2012.2235464.
28. B Jacquier. Laser spectroscopy of rare earth-doped glass waveguides, J. Alloys Compd. 1995;225:15–19. doi.org/10.1016/0925-8388(94)07111-X
29. Martins TS, Isolani PC. Terras raras: aplicações industriais e biológicas, Quim. Nova. 2005;28(1):111–117. doi.org/10.1590/S0100-40422005000100020
30. Zhang Q, Pita K and Kam C. Sol–gel derived zinc silicate phosphor films for full-color display applications, J. Phys. Chem. Solids. 2003;64: 333–338. doi.org/10.1016/S0022-3697(02)00331-1
31. Chang SS, Jo MS. Luminescence properties of Eu-doped SnO2, Ceram. Int. 2007;33(4)511–514. doi.org/10.1016/j.ceramint.2005.10.021
32. Ramakrishna PV, Murthy DBRK and Sastry DL. White-light emitting Eu3+ co-doped ZnO/Zn2SiO4:Mn2+ composite microphosphor, Spectrochim. Acta Part A Mol. Biomol. Spectrosc. 2014;125:234–238. doi.org/10.1016/j.saa.2014.01.110
33. Fonseca AFVD, Siqueira RL, Landers R, Ferrari JL, Marana NL and Sambrano JR, et al. A theoretical and experimental investigation of Eu-doped ZnO nanorods and its application on dye sensitized solar cells, J. Alloys Compd. 2018;739. doi.org/10.1016/j.jallcom.2017.12.262
34. Demirkhanyan GG, Kostanyan RB. Parametrization of intensity of inter-Stark f-f transition, in: A. V. Papoyan (Ed.), 2010-799805. doi.org/10.1117/12.890880
35. Saxe JD, Faulkner TR, Richardson FS. Optical activity of the f–f transitions in trigonal dihedral (D3) lanthanide(III) complexes. II. Calculations, J. Chem. Phys. 1982;76:1607–1623. doi.org/10.1063/1.443198
36. Jose G, Amrutha KA, Toney TF, Thomas V, Joseph C, Ittyachen MA and Unnikrishnan NV. Structural and optical characterization of Eu3+/CdSe nanocrystal containing silica glass, Mater. Chem. Phys. 2006;96:381–387. doi.org/10.1016/j.matchemphys.2005.07.028
37. Nogami M. Fluorescence properties of Eu-doped GeO2–SiO2 glass heated under an H2 atmosphere, J. Lumin. 2001;92(4):329–336. doi.org/10.1016/S0022-2313(00)00265-9
38. El Mir L, Omri K, El Ghoul J, AL-Hobaib AS, Dahman H and Barthou C. Yellow emission of SiO2/Zn2SiO4:Mn nanocomposite synthesized by sol–gel method, Superlattices Microstruct. 2014;65:248–255. doi.org/10.1016/j.spmi.2013.11.006
39. Ramakrishna PV, Murthy DBRK, Sastry DL. Synthesis, structural and luminescence properties of Ti co-doped ZnO/Zn2SiO4:Mn2+composite phosphor, Ceram. Int. 2014;40:4889–4895. doi.org/10.1016/j.ceramint.2013.10.065
40. Takesue M, Hayashi H, Smith RL. Thermal and chemical methods for producing zinc silicate (willemite): A review, Prog. Cryst. Growth Charact. Mater. 2009;55(9):98–124. doi.org/10.1016/j.pcrysgrow.2009.09.001
41. Su F, Ma B, Ding K, Li G, Wang S and Chen W, et al. McCready, Luminescence temperature and pressure studies of Zn2SiO4 phosphors doped with Mn2+ and Eu3+ ions, J. Lumin. 2006;116:117–126. doi.org/10.1016/j.jlumin.2005.03.010
42. Hayakawa T, Tamil Selvan S, Nogami M. Enhanced fluorescence from Eu3+ owing to surface plasma oscillation of silver particles in glass, J. Non. Cryst. Solids. 1999;259:16–22. doi.org/10.1016/S0022-3093(99)00531-1
43. Carlos LD, Messaddeq Y, Brito HF, Sá Ferreira RA, de Zea Bermudez V, Ribeiro SJL. Full-Color Phosphors from Europium(III)-Based Organosilicates. Adv Mater. 2000;12:594–598. doi.org/10.1002/(SICI)1521-4095(200004)12:8<594::AID-ADMA594>3.0.CO;2-S
44. Yang R-Y, Peng Y-M, Lai H-L, Chu C-J, Chiou B, Su Y-K. Effect of the different concentrations of Eu3+ ions on the microstructure and photoluminescent properties of Zn2SiO4:xEu3+ phosphors and synthesized with TEOS solution as silicate source. Opt. Mater. 2013;35:1719–1723. doi.org/10.1016/j.optmat.2013.05.011
45. https://tus.elsevierpure.com/en/publications/luminescence-p r o p e r t y - a n d - p h a s e - s e p a r a t i o n - t e x t u r e - o f - p h a s e -separOhgaki%20T,%20Nagumo%20Y,%20Soga%20K,%20Yasumori%20A.%20Luminescence%20Property%20and%20Phase-Separation%20Texture%20of%20Phase-Separated%20Glasses%20and%20Glass-Ceramics%20in%20Mn-Doped%20ZnO-SiO2%20System.%20J%20Ceram%20Soc%20Japan.%202007;115:201–204.%20https:/doi.org/10.2109/jcersj.115.201
46. Takesue M, Suino A, Shimoyama K, Hakuta Y, Hayashi H, Smith RL. Formation of α- and β-phase Mn-doped zinc silicate in supercritical water and its luminescence properties at Si/(Zn+Mn) ratios from 0.25 to 1.25. J Cryst Growth.

International Journal of Materials Research in Science & Technology
https://journalofmaterials.com
Helics Group
14
2008;310:4185–4189. doi.org/10.1016/j.jcrysgro.2008.06.068
47. Zha J, Roggendorf H. Sol-gel science, the physics and chemistry of sol-gel processing, Ed. by C. J. Brinker and G. W. Scherer, Academic Press, Boston 1990, xiv, 908 pp., bound?ISBN 0-12-134970-5. Adv Mater. 1991;3:522–522. doi.org/10.1002/adma.19910031025
48. Kang YC, Park HD. Brightness and decay time of Zn2SiO4:Mn phosphor particles with spherical shape and fine size. Appl Phys A. 2003;77:529–532. doi.org/10.1007/s00339-002-1487-4
49. Krames MR, Shchekin OB, Mueller-Mach R, Mueller GO, Zhou L, Harbers G and Craford MG. Status and Future of High-Power Light-Emitting Diodes for Solid-State Lighting. J Disp Technol. 2007;3:160–175. doi.org/10.1109/JDT.2007.895339
50. Sommer C, Hartmann P, Pachler P, Hoschopf H, Wenzl FP. White light quality of phosphor converted light-emitting diodes: A phosphor materials perspective of view. J Alloys Compd. 2012;520:146–152. doi.org/10.1016/j.jallcom.2011.12.161
51. Hermus M, Brgoch J. Phosphors by Design: Approaches Toward the Development of Advanced Luminescent Materials. Interface Mag. 2015;24:55–59. doi.org/10.1149/2.F06154if
52. Höppe HA. Recent Developments in the Field of Inorganic Phosphors, Angew. Chemie Int Ed. 2009;48:3572–3582. doi.org/10.1002/anie.200804005
53. Baginskiy I, Liu RS, Wang CL, Lin RT, Yao YJ. Temperature Dependent Emission of Strontium-Barium Orthosilicate (Sr2−xBax)SiO4:Eu2+ Phosphors for High-Power White Light-Emitting Diodes. J Electrochem Soc. 2011;158(10):118. doi.org/10.1149/1.3625282
54. Judd BR. Optical Absorption Intensities of Rare-Earth Ions. Phys Rev. 1962;127:750–761. doi.org/10.1103/PhysRev.127.750
55. Walsh BM. Judd-Ofelt theory: principles and practices. Adv Spectrosc Lasers Sens. 2006;403–433. doi.org/10.1007/1-4020-4789-4_21
56. Ofelt GS. Intensities of Crystal Spectra of Rare-Earth Ions, J Chem Phys. 1962;37(3):511–520. doi.org/10.1063/1.1701366
57. Ferrari JL, Lima KO, Maia LJQ, Gonçalves RR. Sol-gel preparation of near-infrared broadband emitting Er3+-doped SiO2-Ta2O5 nanocomposite films. Thin Solid Films. 2010;519:1319-1324. doi.org/10.1016/j.tsf.2010.09.035
58. Ferrari JL, Lima KO, Maia LJQ, Ribeiro SJL, Gonaçalves RR. Structural and spectroscopic properties of luminescent Er 3+-doped SiO2-Ta2O5 nanocomposites. J Am Ceram Soc. 2011:94(4). doi.org/10.1111/j.1551-2916.2010.04191.x
59. Patterson AL. The Scherrer Formula for X-Ray Particle Size Determination. Phys Rev. 1939;56:978–982. doi.org/10.1103/PhysRev.56.978
60. He K, Chen N, Wang C, Wei L, Chen J. Method for Determining Crystal Grain Size by X-Ray Diffraction. Cryst Res Technol. 2018;53:1700157. doi.org/10.1002/crat.201700157
61. Holzwarth U, Gibson N. The Scherrer equation versus the “Debye-Scherrer equation,” Nat Nanotechnol. 2011;6:534. doi.org/10.1038/nnano.2011.145
62. Muniz FTL, Miranda MAR, Morilla dos Santos C, Sasaki JM. The Scherrer equation and the dynamical theory of X-ray diffraction. Acta Crystallogr Sect A Found Adv. 2016;72:385–390. doi.org/10.1107/S205327331600365X
63. Debye P and Scherrer P. Interference on inordinate orientated particles in x-ray light. Phys Zeitschrift. 1917;1:22–31.
64. Williamson G, Hall W. X-ray line broadening from filed aluminium and wolfram. Acta Metall. 1953;1:22–31. doi.org/10.1016/0001-6160(53)90006-6
65. Almeida RM, Marques AC. Characterization of Sol-Gel Materials by Infrared Spectroscopy. Handb Sol-Gel Sci Technol. 2018:1121–1151. doi.org/10.1007/978-3-319-32101-1_33
66. Omar NAS, Fen YW, Matori KA, Aziz SHA, Alassan ZN, Samsudin NF. Development and Characterization Studies of Eu3+-doped Zn2SiO4 Phosphors with Waste Silicate Sources. Procedia Chem. 2016;19:21–29. doi.org/10.1016/j.proche.2016.03.006
67. M. Vega, P. Alemany, I.R. Martin, J. Llanos. Structural properties, Judd–Ofelt calculations, and near infrared to visible photon up-conversion in Er 3+ /Yb 3+ doped BaTiO 3 phosphors under excitation at 1500 nm. RSC Adv. 2017;7:10529–10538.
68. Aguiar FP, Costa IF, Espínola JGP, Faustino WM, Moura JL, Brito HF, Paolini TB, Felinto MCFC, Teotonio EES. Luminescent hybrid materials functionalized with lanthanide ethylenodiaminotetraacetate complexes containing β-diketonate as antenna ligands. J Lumin. 2016;170:538–546.
69. Assunção I, Carneiro A, Moura R, Pedroso C, Silva IGN, Felinto M, Teotonio E, Malta O, Brito H. Odd-Even Effect on Luminescence Properties of Europium Aliphatic Dicarboxylate Complexes, ChemPhysChem. 2019;20(15):1931-1940.
70. Dacanin L, Lukić SR, Petrović DM, Nikolić M, Dramićanin MD. Judd–Ofelt analysis of luminescence emission from Zn2SiO4:Eu3+ nanoparticles obtained by a polymer-assisted sol–gel method. Phys B Condens Matter. 2011;406:2319–2322.