international journal of chemtech research -...
TRANSCRIPT
Study of Bio-Chemical Status on Antioxidants, Lipid Profiles and Minerals in Hypothyroidism
P.Kalpana1, K.Kayalvizhi2
1,2Department of Chemistry, IFET college of Engineering, Villupuram, India
Abstract : Thyroid hormone is considered as one of the important physiological regulators of
metabolic activities of tissues. Any alteration in its status leads to changes in basal metabolic
rate and effects cellular respiration. It has been suggested that activation of mitochondria respiration by thyroid hormone results in increased ROS production followed by oxidative
stress in several tissues of vertebrates. Thyroid hormone plays a major role in the maturation
of bone. Deficiency of Thyroid hormone in early life leads to both delay in the development of
an abnormal, stippled appearance of the epiphyseal centres of ossification. This study was revealed that the complete lipid profile, per oxidation of lipids, antioxidants and minerals
status in hypothyroidism. The levels of plasma lipid peroxidation were found to be markedly
increased in hypothyroid patients when compared to normal subjects. The levels of membrane TBARS was significantly elevated in hypothyroid patients as compared to normal subjects.
The vitamins levels in plasma and membranes were significantly reduced in hypothyroid
patients compared to normal subjects. Keywords: Bio-Chemical Status, Antioxidants, Lipid Profiles, Minerals in Hypothyroidism.
Introduction
The thyroid gland is the largest organ specialized for endocrine function in the human body. Its
function is to secrete a sufficient amount of thyroid hormones, primarily 3,5,3’5’-tetraiodothyronine (T4), and a lesser quantity of 3,5,3’- tridothyronine (T3). Thyroid hormones promote normal growth and development and
regulate a number of homeostatic functions, including energy and heat production (1).
The thyroid hormones triodthyronine (T3) and (T4) require the rare element iodine for biologic activity.
An extensive series of physiology and biochemical reactions has evolved to ensure that sufficient quantities of
iodide are available for (T3) and (T4) biosynthesis (2).
Diseases of the thyroid are among the most common afflictions involving the endocrine system.
Patients with thyroid disease will usually complain of (a) thyroid enlargement, which may be diffuse or nodular
(b) symptoms of thyroid deficiency or hypothyroidism (c) symptoms of thyroid hormone excess or hyperthyroidism (d) complications of a specific form of hyperthyroidism- graves diseases- which may present
with striting prominence of the eyes, rarely thickening of the skin over the lower legs. Diagnosis and therapy
are firmly based on the principles of thyroid hormone physiology and biochemistry. Lithium carbonate used in the treatment of manic- depressive in an area of low dietary iodide is associated with iodine deficiency goiter
(3, 4).
International Journal of ChemTech Research CODEN (USA): IJCRGG, ISSN: 0974-4290, ISSN(Online):2455-9555
Vol.10 No.3, pp 238-252, 2017

P.Kalpana et al /International Journal of ChemTech Research, 2017,10(3): 238-252. 239
Hypothyroidism:
Hypothyroidism is a clinical syndrome resultant from a deficiency of thyroid hormones, which is turn results in a generalised slowing down of metabolic processes. Hypothyroidism in infants and children results in
marked slowing of growth and development, with serious permanent consequences including mental
retardation. The symptoms of hypothyroidism in adults are largely reversible with therapy (1).
Pathogenesis:
Thyroid hormone deficiency affects every tissue in the body, so that the symptoms are multiple. Pathologically, the most characteristic finding is the accumulation of glycosaminoglycans mostly hyaluronic
acid in interstitial tissues, leads to an increase capillary permeability to albumin account for the interstitial
edema (1).
Clinical presentation & findings:
Hypothyroidism produces (a) cretinism in young (b) myxoedema in adults (1, 5).
A. Cretinism
1. The milestones of child development, such as holding up the head, sitting and dentition, standing, walking,
speech etc. Are all delayed.
2. Skeleton: stunted growth, deformed bones and teeth. 3. Skin: rough thick, dry and wrinkled.
4. Face: Bloated, broad nose with depressed bridge.
5. Abdomen: pot- bellied 6. Mental growth: often deaf and dumb.
7. Blood: low blood sugar, high sugar tolerance, low blood iodine.
8. Vitamins: Carotene accumulates sufficiently to cause yellowing of the skin but not the sclera.
B. Myxoedema
The disease occurs about 7-8 times more frequently in females then in males. Genetic factors are also of some importance in the genesis of some hypothyroid conditions.
1. Face ,skin and body 2. Sex
3. Mental condition
4. Gastro- intestinal tract and metabolism 5. Blood
6. Heart, circulation and respiration
7. Urine
Antioxidants are molecules that slow or prevent the oxidation of other chemicals. Low levels of
antioxidant molecules or inhibition of these antioxidant enzyme causes oxidative stress and may damage or kills
cells (Matill, 1947) (6). Reactive oxygen species molecules like hydrogen peroxide ions like the hypochloride ion radicals like the hydroxyl radical. A radical is a cluster of atoms one of which contains an unpaired electron
in its outermost shell of electrons. This is an extremely unstable configuration, and radicals quickly react with
other molecules or radicals to achieve the stable configuration of 4 pairs of electrons in their outermost shell. (Sen 2003) (7). Hydrogen peroxide is a harmful by- products of many normal metabolic processes. To manage
this problem the enzyme catalyse the decomposition of hydrogen peroxide into less reactive gaseous in nearly
all animal cells and organs and in aerobic microorganisms. (Gaetani et al, 1996) (8). Nevertheless, the cellular
system has been endowed with a number of defense mechanism, both enzymatic as well as non enzymatic to protect itself from the pernicious effects of the ROS (Halliwell et al, 2001) (9). Thyroid hormone has been
suggested that activation of mitochondria respiration by thyroid hormone results in increases ROS production
followed by oxidative stress in several tissues of vertebrates (Das et al 2004) (10).
In fact, the cardiac functional parameters are considerably an excellent index of the cellular action of
thyroid hormones (klein et al) (11). Iron is able to cycle between ferric and ferrous forms through the donation

P.Kalpana et al /International Journal of ChemTech Research, 2017,10(3): 238-252. 240
or acceptance of an electron. The end result is decomposition of lipid molecules with concominant effects on
the integrity of orgennes. One consequence of such damage is enzyme leakage from lysosomes and related
failure of cellular compartment , which can lead to cell death. Iron- induced oxidative damage can lead to cell death and fibrosis. (12).
Levels of calcium and phosphorous in serum are usually normal but calcium may be slightly elevated.
The alkaline phosphate level is usually below normal in juvenile hypothyroidism. Before density may be increased (Larsen etal, 2002) (13).
Materials and Methods
Patients and Blood Sample:
Fifteen hypothyroidism patients from private biochemical diagnostics centre (Dr. BAKAJRUSGBAB
CLINICAL LAB), Pattukkottai, Thanjavur District, were selected for the study. An equal number of normal
subjects were also investigated. The subjects were male ranging in age from 35-55 years.
COLLECTION OF BLOOD:
Blood was obtained by venous arm puncture in a heparinised tube. Plasma was separated by centrifugation at 3000 rpm for 15 minutes. The buffy coat was removed and packed cells washed thrice with
physiological saline. The RBC membrane was prepared as described by Dodge et al modified by Quist.
The following table shows the biochemical estimations carried out in normal and hypothyroid patients.
In the present study, we have analysed the levels of thyroid hormones lipid profile per oxidation lipids and
antioxidant status in plasma and RBC membrane of normal and hypothyroid patients.
Biochemical Estimations: Table-1
Parameters
HUMAN STUDIES I. THYROID HORMONES:
a) T3 b) T4 c) TSH
II. BLOOD PICTURE
a) Glucose b) Haemoglobin (Hb)
c) RBC count
III. PLASMA LIPID PROFILE a) Total cholesterol
b) Free cholesterol
c) High density lipoprotein d) Low density lipoprotein
e) Very low density lipoprotein
f) Phospholipids
g) Triglycerides h) Free fatty acids
IV. PLASMA LIPID PEROXIDATION
TBARS V. PLASMA ANTIOXIDANTS
Vitamin E and C
VI. RBC membrane LIPID PROFILE
a) Total cholesterol b) Free cholesterol
c) Phosphor lipid
VII. RBC MEMBRANE ANTIOXIDANT VITAMIN E
VIII. MINERALS STATUS
a) Iron b) phosphorus
P.Kalpana et al /International Journal of ChemTech Research, 2017,10(3): 238-252. 241
Determination of Free T3 Level – Enzyme Immuno Assay Method (18):
Rabbit anti goatlg G antibody are coated on to micro titration wells. Test sera are applied along with antibody reagent containing T3 to bind to the wells. T3 enzyme conjugate is added which compete with the
released serum T3 for available binding sites on this solid phase. After 2 hours of incubation at room
temperature, the wells are washed with water to remove any unbound T3 or T3 enzyme conjugate. On addition
of the substrate (TMB). Tetra methyl a colour developed only in those wells in (benzene) which the enzyme reaction is stopped by the addition of hydrochloric acid and the absorbance is measured at 450 nm.
Reagents and equipments:
1. Micro titration plate
2. Anti T3 conjugate concentrate. 3. Substance solution (TMB- tetra methyl benzene)
4. Antibody reagent
5. Stop solution (Hcl)
Estimation of Free T4 – Enzyme Immuno Assay Method (7) Method (19)
Principle:
Specific anti-T4 antibodies are coated on to micro titration wells. Test sera are applied, T4 with
Horseradish peroxide is added which competes with the released serum T4 for available binding sites on the solid phase. After 1 hour of incubation at room temperature, the wells are washed with water to remove any
unbound T4 or T4 enzymes conjugate. On addition of the substrate (TMB), a colour si developed only it those
wells in which the enzyme conjugate is present, indicating a lack of serum T4. The enzyme reaction is stopped by the addition of hydrochloric acid and absorbance is measured at 450nm.
Reagent and equipments:
1. Micro titration plate
2. Anti T4 conjugate concentrate.
3. Substance solution (TMB- tetra methyl benzene) 4. Conjugate diluents
5. Stop solution (Hcl)
Determination of TSH Level- Enzyme Immuno Assay Method (20)
Principle:
Specific anti TSH antibodies are
Isolation of Erythrocyte Membrane:
The erythrocyte membrane was prepared by the method of Dodge et al (21) with a change in buffer
according to Quist (22).
Reagents:
1. 310 mM isotonic TrisHCl buffer, pH 7.4
2. 20 mM hypotonic TrisHCl buffer, pH 7.2
Estimation of Hemoglobin:
Haemoglobin was estimated by the method of Shali’s (24).
Determination of Blood Sugar:
Blood sugar was estimated by using Ortho toluidine method (25).

P.Kalpana et al /International Journal of ChemTech Research, 2017,10(3): 238-252. 242
Principle:
A solution of Ortho toluidine in glacial acetic acid when heated with glucose produces a coloured product with an absorption maximum at about 620nm. The aldehyde group of glucose condenses with the
reagent to form glucosylamine and a shiff’s base which is the colour product. The urea is used a stabilizer.
Reagents:
1. Orthotoluidine:
1.5 gm of thio- urea in 950 ml of glacial- acetic acid and 500 ml of orthotoluidine. 2. 3% Trichloro acetic acidn(TCA)
3. Stock glucose (1%)
4. Working standard (1ml in 10 ml H2O).
Estimation of Protein:
The protein content was estimated by the method of lowry et al (26).
The CONH groups in the protein molecules react with the copper sulphate in alkaline media to give a
purple colour which is read at 640nm.
Reagents:
1. Alkaline copper reagent: 100ml of 2% sodium carbonate in 0.1N NaOH and 1 ml each of 1% copper
sulphate and 2% sodium potassium tartarate.
2. Folin – Ciocalteau reagent: 1:2 with double distilled water. 3. Standard bovine serum albumin (BSA): 100 mg /100ml water. Small quantities of alkali could be added to
make complete dissolution of BSA.
Extraction of Lipids:
The extraction was done by the method of folch et al (27).
To know volume of membrane preparation (2.5ml) or plasma (2.0ml), of plasma (2.0ml), 7.0 ml of
methanol was added.
Estimation of Total Cholestrol:
The total cholesterol was estimated by the method of Zlatkis, Zak and Boyle(28).
Principle:
Serum is treated with Ferric-chloride acetic acid reagent to precipitate the protein. The protein free
supernatant is treated with concentrated H2SO4. A reddish purple colour is developed which is measured at
560nm. Using a suitable standard and reagent blank.
Reagents:
1. Ferric chloride acetic acid reagent Stock: dissolve 50mg (0.05%) of ferric chloride to a 100 ml of glacial acetic acid
2. Working standard: dilute 5ml of stock to 100 ml with glacial acetic acid.
3. Concentrated sulphuric acid 4. Cholesterol stock 1ml/mg I.e.100 mg/ml. dissolve 50mg cholesterol in 50 ml of acetic acid stored in cold
condition.
Estimation of Free Cholestrol:
Free cholesterol was determined according to the procedure of sperry and web (29).
P.Kalpana et al /International Journal of ChemTech Research, 2017,10(3): 238-252. 243
Reagents:
1. Acetone-ethanol mixture (equal volumes) 2. Digitonin solution (0.5%)
3. Ether
Plasma high density lipoprotein (HDL) cholesterol:
The HDL cholesterol was estimated by the Heparinmanganese chloride precipitation method (30).
Reagents:
1. Heparin 2. Manganese chloride
3. Heparin- manganese chloride
167 manganese chloride and 1ml Heparine made upto 8ml with distilled water.
Estimation of Phospholipids:
Phospholipids were estimated usingFiske and subbarow method (31)
Principle:
Organic phospholipid phosphorous is converted to inorganic phosphorous which reacts with
ammonium molybdate to form phosphomolybdic acid. This on reduction with ANSA forms a stable blue
colour.
Reagents:
1. 2.5% Ammonium molybdate in 5N H2SO4
2. 1-amino-2-Napthol-4- sulphuric acidnreagent
3. Standard phosphate solution (stock)
35.1 mg of potassium di hydrogen phosphate was dissolved in water to this 1ml of 10N H2SO4 was
added and make up to 100ml with water.1ml of stock was diluted to 10 ml to get a working standard containing
8 mg phosphorous/ml
Estimation of Triglycerides:
The level of triglycerides was estimated by the process of rice (32).
Reagents:
1. Saturated sodium chloride solution
2. 0.2 N H2SO4 3. 0.4% potassium hydroxide in alcohol
4. 0.1 M sodium metaperiodate
5. 0.5 M sodium metaarsenite
6. Chromotrophic acid reagent 7. 7% thiourea in water
8. Standard tripalmitin
9. Activated silicic acid
Estimation of Free Fatty Acids:
Free fatty acid (FFA) was estimated by the method of falholf et al (33).
Reagents:
1. Extraction solvent: chloroform
P.Kalpana et al /International Journal of ChemTech Research, 2017,10(3): 238-252. 244
2. Phosphate buffer pH 6:4:4. 539 g/litre potassium dihydrogen phosphate and 5.9389 g disodium hydrogen
phosphate
3. Stock copper solution 4. Triethanolamine 1M
5. Sodium hydroxide 1M
6. Copper reagent
7. Diphenylcarbazole solution 8. Palmitic acid: 2mm/litre
Estimation of Lipid Peroxidation
Lipid peroxidation was estimated as evidenced by the formation of thiobarbituric acid reactive
substances
Principle:
Lipid peroxides in plasma were assayed by the method of yoga (34).
Reagents:
1. 0.083N sulphuric acid
2. 10% phosphotungstic acid
3. Thiobarbituric acid 4. Standard malondialdehyde stock solution
Estimation of Antioxidants:
a) Ascorbic acid: ascorbic acid level was estimated by the method of omaye et al (36).
Reagents:
1. 2-4- dinitrophenyl hydrazine- thiourea- copper sulphate
2. 10% TCA 3. 65% H2SO4
4. Standard solution: 10 mg/100 ml 5% TCA
b) VitamineE:Vitamine E was estimated by the method of Desai based on the classical Emmerie Engle
reaction (37).
Reagents:
1. Redistilled ethanol 2. Petroleum ether
3. Bathophenanothroline reagent
4. Ferric chloride: 0.01 M in absolute ethanol
5. Orthophosphoric acid: 0.001 M in absolute ethanol 6. Standard solution: 1g/ 100 ml absolute ethanol.
Estimation of Iron (Ramsay, 1952) (37)
Reagents:
1. Standard
48.9 g of ferric sulphate is dissolved in distilled water and 1 ml of concentrated sulphate is dissolved in distilled water and 1 ml of concentrated sulphuric acid is added and final volume is made up to 100 ml
using distilled water.
2. 2-2’ dipyridyl reagent
100 mg of 2-2’ dipyridyl reagent dissolved in 35 ml of glacial acetic acid to 100 ml.
P.Kalpana et al /International Journal of ChemTech Research, 2017,10(3): 238-252. 245
3. Sodium sulphite (0.1M)
1.26 g of anhydrous sodium sulphite dissolved in 100 ml of disstled water.
4. Serum sample
Estimation of Phophorous (Fiske and subbarow, 1925) (38)
Reagent:
1. Standard
35.04 g of potassium dihydrogen phosphate was dissolved in 1 ml of concentrated sulphuric acid and 100 ml of distilled water
2. Ammonium molybdate I:
25 g of ammonium molybdate dissolved in 500 ml of 10N sulphuric acid and diluted to 1 litre.
3. Ammonium molybdate II:
25 g of Ammonium molybdate dissolved in 300 ml of 10N sulphuric acid and diluted to 1 litre.
4. Amino naptholsulphonic acid:
0.5 g of amino napthol sulphuric acid dissolved in 195 ml of 15% sodium sulphate and 5 ml of 20% sodium sulphite.
5. 10%Trichloro acetic acid
6. 10N sulphuric acid
7. Sample preparation
Results:
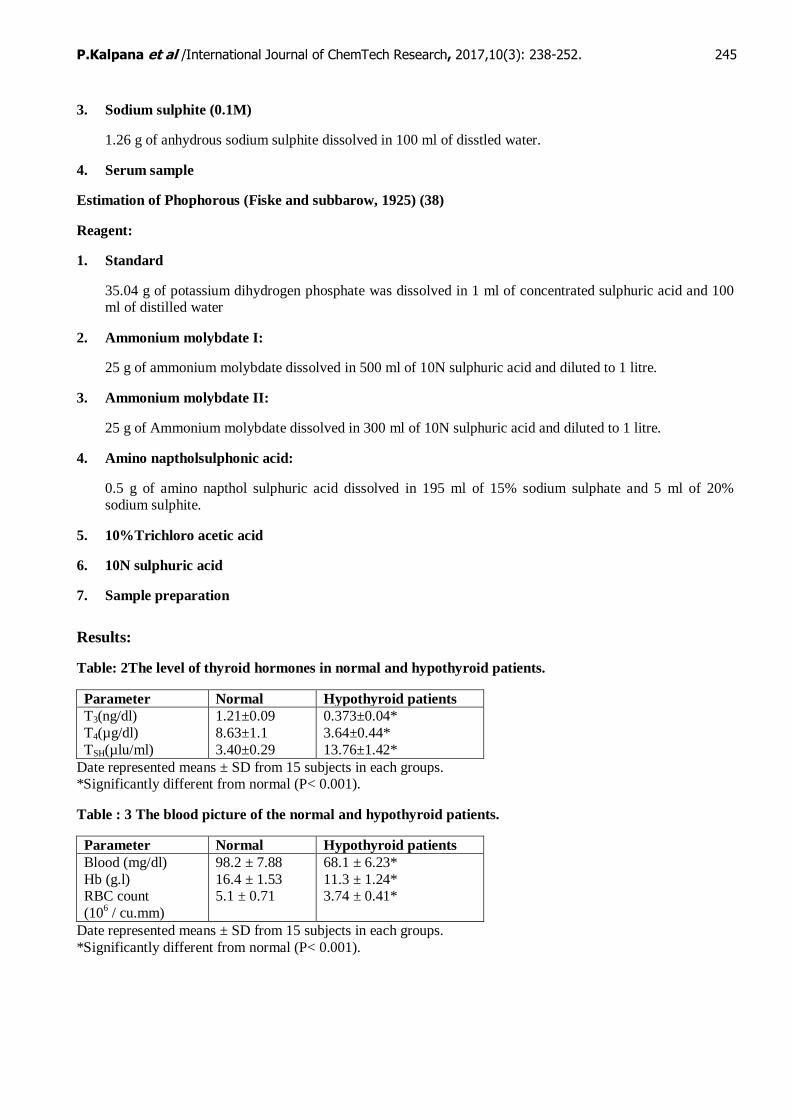
Table: 2The level of thyroid hormones in normal and hypothyroid patients.
Parameter Normal Hypothyroid patients
T3(ng/dl)
T4(µg/dl)
TSH(µlu/ml)
1.21±0.09
8.63±1.1
3.40±0.29
0.373±0.04*
3.64±0.44*
13.76±1.42*
Date represented means ± SD from 15 subjects in each groups. *Significantly different from normal (P< 0.001).
Table : 3 The blood picture of the normal and hypothyroid patients.
Parameter Normal Hypothyroid patients
Blood (mg/dl)
Hb (g.l) RBC count
(106 / cu.mm)
98.2 ± 7.88
16.4 ± 1.53 5.1 ± 0.71
68.1 ± 6.23*
11.3 ± 1.24* 3.74 ± 0.41*
Date represented means ± SD from 15 subjects in each groups.
*Significantly different from normal (P< 0.001).
P.Kalpana et al /International Journal of ChemTech Research, 2017,10(3): 238-252. 246
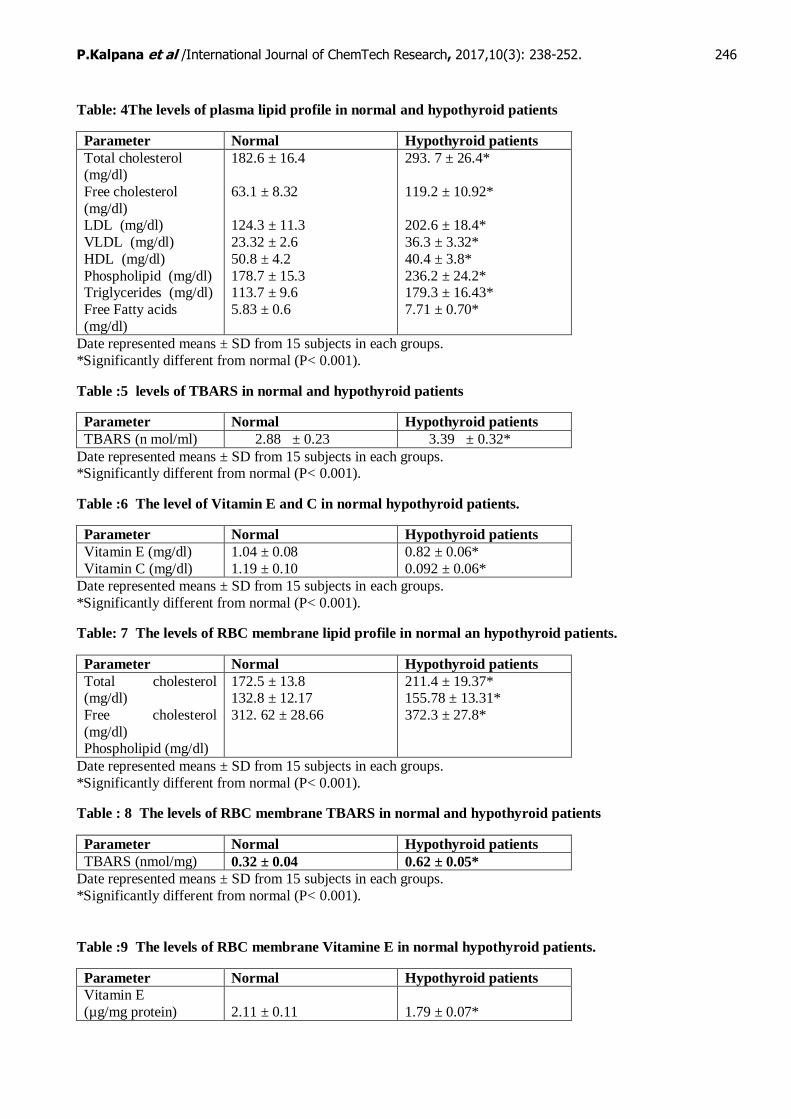
Table: 4The levels of plasma lipid profile in normal and hypothyroid patients
Parameter Normal Hypothyroid patients
Total cholesterol (mg/dl)
Free cholesterol
(mg/dl) LDL (mg/dl)
VLDL (mg/dl)
HDL (mg/dl)
Phospholipid (mg/dl) Triglycerides (mg/dl)
Free Fatty acids
(mg/dl)
182.6 ± 16.4
63.1 ± 8.32
124.3 ± 11.3
23.32 ± 2.6
50.8 ± 4.2
178.7 ± 15.3 113.7 ± 9.6
5.83 ± 0.6
293. 7 ± 26.4*
119.2 ± 10.92*
202.6 ± 18.4*
36.3 ± 3.32*
40.4 ± 3.8*
236.2 ± 24.2* 179.3 ± 16.43*
7.71 ± 0.70*
Date represented means ± SD from 15 subjects in each groups.
*Significantly different from normal (P< 0.001).
Table :5 levels of TBARS in normal and hypothyroid patients
Parameter Normal Hypothyroid patients
TBARS (n mol/ml) 2.88 ± 0.23 3.39 ± 0.32*
Date represented means ± SD from 15 subjects in each groups. *Significantly different from normal (P< 0.001).
Table :6 The level of Vitamin E and C in normal hypothyroid patients.
Parameter Normal Hypothyroid patients
Vitamin E (mg/dl)
Vitamin C (mg/dl)
1.04 ± 0.08
1.19 ± 0.10
0.82 ± 0.06*
0.092 ± 0.06*
Date represented means ± SD from 15 subjects in each groups.
*Significantly different from normal (P< 0.001).
Table: 7 The levels of RBC membrane lipid profile in normal an hypothyroid patients.
Parameter Normal Hypothyroid patients
Total cholesterol (mg/dl)
Free cholesterol
(mg/dl) Phospholipid (mg/dl)
172.5 ± 13.8 132.8 ± 12.17
312. 62 ± 28.66
211.4 ± 19.37* 155.78 ± 13.31*
372.3 ± 27.8*
Date represented means ± SD from 15 subjects in each groups.
*Significantly different from normal (P< 0.001).
Table : 8 The levels of RBC membrane TBARS in normal and hypothyroid patients
Parameter Normal Hypothyroid patients
TBARS (nmol/mg) 0.32 ± 0.04 0.62 ± 0.05*
Date represented means ± SD from 15 subjects in each groups.
*Significantly different from normal (P< 0.001).
Table :9 The levels of RBC membrane Vitamine E in normal hypothyroid patients.
Parameter Normal Hypothyroid patients
Vitamin E
(µg/mg protein)
2.11 ± 0.11
1.79 ± 0.07*

P.Kalpana et al /International Journal of ChemTech Research, 2017,10(3): 238-252. 247
Table:10 Levels of Iron and phosphorous in normal and hypothyroid patients
Parameter Normal Hypothyroid patients
Iron (µg/100ml) Phosphorous
(mg/100ml)
105.3 ± 3.46
3.91 ± 0.08
55.7 ± 2.27*
3.60 ± 0.06**
Results
The present study has estimated the levels of plasma and RBC membrane Lipoid profile per oxidation
of lipids and micronutrient status in 15 weeks hypothyroid patients and an equal number of age and sex matched normal subjects. The subjects were ranging in age from 35-55 years.
Table 2 shows the levels of thyroid hormones (T3, T4 and TSH) in normal and hypothyroid patients. The levels of T3, T4 and TSH were significantly decreased whereas TSH levels were significantly increased in
hypothyroid patients as compared to normal subjects.
Table 3 indicates the blood picture of the normal and hypothyroid patients. The levels of glucose, Hb, RBC count were found to be decreased in hypothyroid patients as compared to normal subjects.
Table 4 depicts the levels of plasma lipid profile in normal and hypothyroid patients. Total cholesterol, free cholesterol, LDL cholesterol, VLDL, phospholipids, TG and FFA were all found to be significantly
elevated whereas HDL cholesterol levels were found to be decreased in hypothyroid patients as compared to
normal subjects.
Table 5 illustrates the levels of plasma lipid per oxidation in normal and hypothyroid patients. The
levels were found to be markedly increased in hypothyroid patients when compared to normal subjects.
Table 6 shows the levels of vitamin E and C in normal and hypothyroid patients. The vitamins levels in
plasma and membrane were significantly reduced in hypothyroid patients compared to normal subjects.
Table 8 shows the levels of erythrocyte membrane lipid profile in normal and hypothyroid patients. The
levels were markedly increased in hypothyroid patients as compared to normal subjects.
Table 9 indicates the levels of membrane TBARS in normal and hypothyroid patients. The levels of
membrane TBARS was significantly elevated in hypothyroid patients as compared to normal subjects.
Table 10 indicates the levels of RBC membrane vitamin E in normal and hypothyroid patients.
Membrane vitamin E was noticed to be significantly declined in hypothyroid patients is compared to normal
subjects.
Table 11 shows the level of minerals (Iron, Phosphorous) was decreased significantly in hypothyroid
patients when compared to normal.
Discussion
Diseases of the thyroid are among the most common affections involved in the endocrine system. The pathophysiology many thyroid diseases results in hypothyroidism or hyperthyroidism.
In the present study, we have analysed the levels of thyroid hormone in hypothyroid patients. The levels of T3 and T4 were significantly decreased whereas the levels of TSH were significantly increased in
hypothyroidism patients. Inverse relationship between the levels of T3 and T4 and TSH has been well
documented. Hence, the low levels of T3, T4 may be due to inadequate production of T3 and T4 which in turn
stimulates increased secretion of pituitary TSH with compensatory hyperplasia and hypertrophy of the thyroid gland. If this defect is severe, hypothyroidism developed.
In the present study, we also analysed the levels of lipid in both plasma and RBC membrane of hypothyroid patients. Lipids constitute an integral part of bio-membrane which plays an important role in
determining the various function and properties of normal Red Blood cell such as maintaining the ultra structure

P.Kalpana et al /International Journal of ChemTech Research, 2017,10(3): 238-252. 248
of the cell surface electrical charge permeability and in the mechanism of maintenance of ionic radiant’s across
its surface. Any alternation in lipid composition of the membrane leads to the variety of biochemical
abnormalities and pathological conditions.
In the present study, significant elevation in the plasma lipid profile except HDL was noticed. The
major classes of plasma lipids are cholesterol, ester cholesterol, triglycerides and phospholipids.
Cholesterol, phospholipids and glycoplipids are arranged asymmetrically between the inner and outer
leaflet of the lipid bilayer, cholesterol is an important structural component of the membrane and of the outer
layer of plasma lipoprotein. An alteration in the phospholipids and cholesterol metabolism leads to several disorders such as hypercholesterolemia, hyperlipidemia, atherosclerosis, coronary artery diseases etc (2).
The increases cholesterol level observed in hypothyroid patients may be due to increase in LDL cholesterol, free cholesterol, or decrease in HDL cholesterol observed in the present study.
LDL, a cholesterol rich lipoprotein is the major corner of cholesterol to various tissues and cell membranes. The increase in LDL cholesterol may be due to decreased hepatic synthesis of LDL receptors,
thereby increase plasma LDL levels which in turn causes an increase in total cholesterol.
LDL is usually formed form VLDL breakdown and hence increased synthesis of LDL occurs when there is an increase in the conversion of VLDL remnants.
The increase in cholesterol may also be related to the diminished levels of vitamin E and C which have a direct relationship with cholesterol metabolism. Decreased levels of vitamin E and vitamin C have been
reported in subjects with hypercholesterolemia. (38,39). Hence the increase in cholesterol observed in the
present study may be due to diminished levels of vitamin E and C.
The plasma phospholipids bear a quite relationship to the cholesterol. Phospholipids increases in those
conditions in which there is an increase in cholesterol and this relationship has been reported in liver and bilary
tract diseases, diabetes mellitus and myxoedema. (40). Hence the increased phospholipids level noticed in hypothyroid patient may be due to increased plasma cholesterol level noticed in hypothyroid patient may be due
to increased plasma cholesterol level.
Inverse relationship between HDL and LDL, triglycerides has been well reported (41). Hence the
decreases in HDL observed in the present study may be due to increased VLDL or LDL or triglycerides
observed in the present study or vice versa.
Alterations in the plasma lipid profile induced by the decrease may be reflected in the lipid composition
of the membrane. Increased membrane cholesterol affects the shape of RBC. Cholesterol enrichment causes premature destruction of red cells by the spleen, resulting in anemia (42, 43). The decreased Hb and erythrocyte
count observed in the present study may due to the above phenomenon.
Low blood glucose levels observed the present study may be due to increased sugar tolerance by hypothyroid patients or may due to decreased hepatic gluconeogenesis and glycogenolysis.
Normal erythrocytes are unable to synthesis cholesterol or phospholipids and hence they exchange, cholesterol or phospholipids from plasma environment. Hence, the increased cholesterol and phospholipid
notice in the membrane of hypothyroid patient may be due to defect in exchange mechanism or be due to
increased plasma LDL or VLDL or decreased HDL which may indirectly inhibit cholesterol removal from cells causing its accumulation.
In the present study, we have also observed an increase in plasma and erythrocyte membrane TBARS
and decrease in plasma and erythrocyte membrane antioxidants.
Ascorbic acid, one of the important extra cellular antioxidant present in plasma and the diminished
levels has been reported in lipid per oxidation (44). Vitamin E, lipophilic antioxidant is important for the integrity of erythrocyte membrane was also shown to decline in oxidative stress (45). Hence, we feel that the
increased lipid per oxidation observed in the present study may be due to increased shedding of lipid peroxide
from the membrane or due to the diminished levels of vitamin E and C.

P.Kalpana et al /International Journal of ChemTech Research, 2017,10(3): 238-252. 249
Iron is a critical mineral for patients with thyroid disease. It plays a vita role in the formation of
haemoglobin which is the oxygen carrying molecules in the red blood cells. The causative importance of
deposition in thyroid disease associated with haemochromatosis was suggesting by the reversal of the sex ratio of the thyroid dysfunction. The frequency of the thyroid disorder in men with haemochromatosis is about 30
times that of men in general population (46). Iron helps to reduce goiter size. Excellent evidence is that iron is
critical for thyroid function and that iron- deficiency anemia is often an important factor in causing
hypothyroidism.
T3 can functionality regulated the iron regulated the iron response element (IRE) binding activity of the
iron regulatory protein (IRP). These observations provide evidence of a novel mechanism for T3 to hepatic ferritin expression (48). This shows that the ferritin metabolism is influenced by thyroid hormone as well as
iron and ferritin synthesis is not elevated in hypothyroidism (49). Iron deficiency may be a cofactor in anemia,
hypothyroidism (50). Due to iron deficiency, thyroid peroxide activity is decreased, thyroid hormone synthesis is reduced which in turn affects pituitary and results in hypothyroidism (51). The plasma thyroid hormone
kinetics in iron deficiency anemia is corrected by simply providing more thyroxin. The present studies suggest
that T3 maintain the normal level of Fe and also interlink with vice versa.
Several key observations have stimulated interest in the relationship between iron deficiency and
thermoregulations accompanying the impairment in thermoregulation were there is decrease in the rate of
thyroid hormone.
The physiological role for thyroid hormone in the control of phosphate homeostasis is that T3
stimulates Pi renal absorption to a level that is able to increase serum Pi concentration. Higher doses of T3 further increase Pi renal absorption and serum phosphate level. This effect is mediated by parallel increase in
the amount of Na/Pi co transporter in the brush border of proximal tubular epithelial cells. The specific increase
in protein content is, in turn, caused by an increase in the intracellular content of the specific NaPi-2 mRNA,
which was produced by stimulation of the transcription rat of the corresponding gene, NPT-2. These results point to the classic that the mechanism of thyroid hormone, acting through intracellular receptors and binding to
thyroid hormone response elements (TREs) in the corresponding gene promoters.
Hypothyroidism induces a substantial decrease in serum phosphate, as well as an inhibition of
phosphate transport, that is reversed by the exogenous physiological treatment with T3.
This could be explained as T3 being a major regulator, and/ or as the need of thyroid hormone presence
for a correct functioning of all other additional mechanism (52).
The basic physiological control of T3 is phosphate haemostasis. The large change in plasma
phosphorous level in vitamin D3 deficiency in response to T4 or T3 probably due to the renal retention of
phosphorous.
Hence in the present study, we have demonstrated profound biochemical alterations in both plasma and
RBC membrane of hyperthyroid patients.
Summary and Conclusion
The present study has estimated the levels of plasma and RBC membrane lipid profile, per oxidation of
lipids, antioxidants and minerals status in 15 male hypothyroid patients and an equal number of ages and sex matched normal subjects. The subjects were male ranging in age form 35-55 years.
Total cholesterol, free cholesterol, LDL cholesterol, VLDL, phospholipids, TG and FFA were all found to be significantly elevated whereas HDL cholesterol levels were found to be decreased in hypothyroid patients
as compared to normal subjects.
The levels of erythrocyte membrane lipid profile were markedly increased in hypothyroid patients as
compared to normal subjects.
Increased cholesterol observed in hypothyroid patients may be due to increased LDL, TG, VLDL and
FFA. Increased in plasma LDL may be due to decreased synthesis of LDL receptors. The decreased plasma
HDL (or) increased VLDL may be contributed to increased plasma triglycerides and LDL. The increased

P.Kalpana et al /International Journal of ChemTech Research, 2017,10(3): 238-252. 250
cholesterol levels cause an increase in plasma phospholipids in hypothyroid patients. Increased membrane
cholesterol may be due to the defects in exchange mechanism with plasma lipids.
The levels of plasma lipid per oxidation were found to be markedly increased in hypothyroid patients
when compared to normal subjects. The levels of membrane TBARS was significantly elevated in hypothyroid
patients as compared to normal subjects. The vitamins levels in plasma and membrane were significantly
reduced in hypothyroid patients compared to normal subjects.
The increase in plasma lipid per oxidation observed in the hypothyroid patients may be due to increased
membrane lipid peroxides which in turns shedding into circulation. The decreased plasma (or) membrane vitamins may be due to increased lipid per oxidation (or) as part of an overall breakdown of antioxidants
mechanisms.
Hence, in the present study we have demonstrated profound biochemical alterations in both plasma and
RBC membrane of hypothyroid patients. The present studies were also opened avenues for further research
especially with reference to membrane structure and function and might lead to the identification and
development of useful markers in hypothyroid patients.
T3 plays a role in maintaining normal level of antioxidants functions. T3 along with minerals (like Fe,
P) plays a mina role in maintenance and up regulate the metaloproteins and enzymes, and also regulate the normal level of RBC etc.
The present study supports the proposed hypothesis “hypothyroidism may have effect on the antioxidant enzymes and minerals variation at adults and middle age of people due to inadequate amount of
thyroid hormone secretion from thyroid gland is also one of the reasons.
Reference
1. Green Span, F.S. Baxter, J. D (1994) the thyroid gland In: Basic & Clinical Endocrinology 4-th (eds.)
162, Prentice – Hall International Inc. 2. Murray, R.K et al (1996) Thyroid Hormones In: Haper’s Biochemistry 24-th (eds), 537.
3. De Groot L.J. Diagnostic approach and management of patients exposed to irradiation to the thyroid
clinical review 2, JclinEndocrinolMetasol 1989: 69-925 4. Mehta M.P., et-al Radiation induced thyroid neoplasms 1920 to 1987: Int J RadiatOncol Biol. Physc.
1989: 16: 17471.
5. C.C. Chatterjee, 1994, endocrines In: Human Physiology, reprint edition 4-79.
6. Hoffenberg. R, Medicine 1978, 8: 392 (Kit method). 7. Matill HA (1947). Antioxidants. Annu, Rev.Bio-chem., 16: 177-192.
8. Sen CK (2003). The general case for redox control of wound repair, wound repair regeneration. 11:
431-438. 9. Halliwell B and Gutteridge JMC (2000). In: free radicals in biology and medicine. 3
rd edition (Oxford
University Press, New york).
10. Das K and Chainy GBN (2004). Thyroid hormone influences antioxidant defence in adult rat brain. Neurochem Res.29:1755.
11. Klein I and Ojamaa K (2001). Thyroid hormones- targeting the heart. Endocrinology,142:11
12. Cohen AR and Porter JB (2001). Transfusion and iron chelation therapy in thalassemia and sickle cell
anemia. In: Disorders of Hemoglobin: genetics, Physiology and clinical management. Cambridge University press Steinberg MH et al (eds): 979-1027.
13. Larsen P Reed and Terry F Davies (2002). Hypothyroidism and Thyroiditis. William text book of
endocrinology, Library of congress cataloguing-in-publication Data,10th edition, 424-449.
14. Randolph Ana. GD, Shelly Binkley MD and Rich Zelter MD 1999. T3 from the thyroid, immunology,
and the thymus. Endocrionology, Harpercollins college publishers, 170-194.
15. Utiger D Robert (1985). The thyroid: physiology, thyrotoxicosis, hypothyroidism and the painful
thyroid. Endocrinology and metabolism, Mcgraw Hill publisher, 3rd edition, 435-508.
16. Arumugam SN (2005). Hypothyroidism – induced changes in the Androgen and estrogen receptor
expression in the prostrate gland of adult rats. M.phil., Dissertation, University of madras, Chennai,
India.

P.Kalpana et al /International Journal of ChemTech Research, 2017,10(3): 238-252. 251
17. Hoffen et al., Medicine 1978,8:392(kit method)
18. Schuurs, A.J.W.M and Van weeman, B.K, Review Enzyme – immune assay. Clin, chem. Acta 81:1,
1977 (kit method) 19. SOOS M and Siddle, K.J. immune methods 1982: 51: 57 – 68. (kit method)
20. Dodge, J.F., MitChell, G, D.J., (1968) the preparation and chemical characterization of haemoglobin-
free ghosts of human red blood cells. Arch Biochem. Biophys 100, 119-30.
21. Quist E.H (1980) regulation of erythrocyte membrane shape by calcium ion. BiophysRes .commun, 92, 631 – 7
22. Sood, S.K (1988)Routine haematological tests, In. Medical laboratory Technology. A procedure manual
of Routine Diagnostic Tests, Muherjee, K.L (ed). PP- 228-307, tataMcgraw Hill Publ. Co.Ltd., New Delhi.
23. Quist and Dodge, 1984, Eythocyte membrane shap. Bio-chem, Blio-Physicals. 84,731 -2.
24. JayashreeGhosh (1991) In: Pharmaceutical chemistry specimen copy, 154 – 155. New Delhi.
25. Fings C.S Toltiff, C.R., Duonin, R.T (1970) Glucose determination by O- toluidine method using acetic acid. In: practical clinical chemistry. Javo,G and Ackerman, PG (eds) pp – 115- 118, little Brown and
Co., Boston
26. Lowery, O.H., Rosebrough, N.J., Farr, A.L and Randall, R.J.(1951) Protein measurement with Folin’s Phenol reagent J.Biol chem.. 193, 265 – 275
27. Folch.,J.Less, M and Sloane, G.H(1957) a simple method for the isolation and purifification of total
lipids from animal tissues. J. Bio –chem., 226, 497 – 509.s 28. Zlatkis, Zak., and Boyle, (1953) lipids In: Practical clinical Biochemistry., 4-th (eds) 309 – 326.
29. Sperry.W.N and Webb. M(1950)Revision of cholesterol determination J. Biochem.187.97-106.
30. Gidez.T.L., Miller. G.J., Burstein, M.Stage.S and Eder, H.A(1962) Separation and quantitation `of
subclasses of human plasma high density lipoprotein by simple precipitation procedure.J.Lip Res.23, 1206 – 1223.
31. Fiske and Subbarrow, (1925) calcium, phosphorous and phosphatistis In: practical clinical
Biochemistry,4th (eds)431 -467.
32. Rice, E.W. (1970) determination of triglycerides In: standard methods of clinical chemistry Roderick.P
and MacDonald.R.P (eds) 6, PP.215-222, Academic press, new York.
33. Falholf, K., Falholf.W and Lund.B (1973) all easy colorimeter method for routine determination of free fatty acids in plasma. Clin.chim.Acta, 46,105-111.
34. Yagi.K (1978) lipid peroxides and human disease, chem..physiol. Lip 45, 337- 351.
35. Donnan,S.K (1950). The thiobarbitutric acid test applied to tissues from rats treated in various ways,
J.Biol.chem., 182, 415-419. 36. Omaye, ST., Turnbill, T.D., Sauberlich.H.E., (1979) selected method for the determination of Ascorbic
acid in animal cells, tissues and fluids, McCormic. D.B and Wright.D.L.,(eds) methods Enzymol, 62,
PP, 3-11, Academic Press, Newyork. 37. Desai.F.D (1984) vitamin E analysis method for animal tissues Feischer.S. andPacker.L (eds) methods
for animal tissues Feischer.S and packer.L (eds) methods enzymol,105 PP 138-145, Academic press
new York.
38. Ginter.E (1975) Ascorbic acid in cholesterol and bile acid metabolism. Ann. N.Y. Acad.Sci.258,410 – 421.
39. Duel.H.J.Cox., J.R, Afin-slater.R.B and Ershoff.B.H (1955). The relationship between Vitamin E and
cholesterol metabolism. Ann.N.Y, Acad.Sci.258,410 – 421. 40. Harold variety,In: practical clinical biochemistry, 45
th (eds) 320.
41. Manoharan.S,1996, Evaluation of Biomarkers in human and experimental oral carcinogenesis, Ph.D.
thesis, department of Biochemistry, Annamalai University, Annamalainagar. 42. Cooper.R.A.,Leslie.M.H.Krigh.D and Detwieler.D.H (1980) Red cell enrichment and spur cellanemia
in dogs fed a cholesterol enriched aterogenic diet. J.Lip.Res., 21,1082 – 1089.
43. Cooper.R.A.(1977), abnormalities of cell membrane fluidity in the pathogenesis of disease, N.Eng.J.
Med, 297-371- 377. 44. Frei.B, England.L., and Ames.B.N (1989) Ascorbate is an outstanding antioxidant in human blood
plasma, proc, Natl., Acad Sci.86, 6377- 6381.
45. Wartanoric.Z.M, Pancenko – Kesouska.B, Ziemlankski .S Kowalska.M and Okolsaka.G (1984). The effect of tocopherol and ascorbic acid in the serum lipid peroxide level in elderly people. Ann Nutr.
Metab., 28, 186- 191.
P.Kalpana et al /International Journal of ChemTech Research, 2017,10(3): 238-252. 252
46. Edwards CQ, Kellyu TM, Ellwein.GandKushner.J.P (1983). Thyroid disease in haemochromatosis,
increased incidence in homozygous men 1983. Arch Inter Med., 143(10) : 1890-1893.
47. Zimmermaann.M, Adou.P, Torresani.T, Zeder.C and Hurrell.R. iron supplementation in goitours, iron deficient children improve their response to oral iodised oil 2000. Eur. J. Endocrinol., 142(3) 217- 223.
48. Leedman P.J, Stain.AR, Chin.W.W and rogers.J.T (1996). Thyroid hormone modulates the interaction
between iron regulatory proteins and the ferritin mRNA iron – responsive element.JBiolChem 17;
271(20). 12017 – 12023. 49. Despande UR and Nadkarin GD (1992). Relatino between thyroid status and ferritin metabolism in rats.
Thyridology 4(3) : 83 – 97.
50. LikSprava (1999). Iron deficiency anemia as a hematologic mask of myxedema (4): 148 – 150. 51. NeetuMathur, Suresh Chandra Joshi and SandeepMathur (2006). Effect of Dietary iron deficiency
anemia on TSH and peripartum thyroid function. University of rajasthan, Endocrine Abstracts. 12:
P123.
52. Ana I, Manuel Sarasa, Demetrio Raldua, Jose Aramayana, Rosa Morlaes, JurgBiner, HeiniMurer, Moshe Levi and Victor sorribas (1991). Role of thyroid hormone in regulation of renal phosphate
transport in young and aged rats. Endocrinology
*****