international journal of applied earth observation and
TRANSCRIPT
TI
Qa
b
c
d
a
ARA
KIPGTV
1
brtBtIIsia
ipIAotie
0d
International Journal of Applied Earth Observation and Geoinformation 12 (2010) 477–486
Contents lists available at ScienceDirect
International Journal of Applied Earth Observation andGeoinformation
journa l homepage: www.e lsev ier .com/ locate / jag
ight integration of GPS observations and persistent scatterernSAR for detecting vertical ground motion in Hong Kong
iang Chena, Guoxiang Liua, Xiaoli Dingb,∗, Jyr-Ching Huc, Linguo Yuanb, Ping Zhongb, M. Omurad
Department of Surveying Engineering, Southwest Jiaotong University, Chengdu 610031, ChinaDepartment of Land Surveying & Geo-Informatics, The Hong Kong Polytechnic University, Hong KongDepartment of Geosciences, National Taiwan University, Taipei 106, TaiwanDepartment of Environmental Science, Kochi Women’s University, Japan
r t i c l e i n f o
rticle history:eceived 18 July 2009ccepted 15 May 2010
a b s t r a c t
A method for tightly integrating GPS observations and the persistent scatterer (PS) interferometric syn-thetic aperture radar (InSAR) is proposed to detect vertical ground motion in Hong Kong, China. Thetropospheric zenith wet delays (ZWD) derived from GPS observations at sites in the SAR scenes are used
eywords:nSARersistent scatterersPSight integrationertical motion rates
first to model and correct for the tropospheric effects in the interferograms generated from the SARimages. The vertical motion rates (VMR) of the GPS sites determined based on the continuous GPS obser-vations obtained at the sites are then used as constraints in the PS InSAR solutions to further enhance thequality of the solutions. Data from 12 continuous tracking GPS sites in Hong Kong and 8 ENVISAT ASARimages acquired during 2006–2007 are used to demonstrate the application of the proposed method. Theresults from the example show that the method is capable of detecting accurately the vertical ground
motion.. Introduction
Satellite interferometric synthetic aperture radar (InSAR) haseen proven useful for measuring Earth surface deformationselated to, e.g., volcanic, earthquake, and urban subsiding activi-ies (e.g., Massonnet and Feigl, 1998; Pritchard and Simons, 2002;uckley et al., 2003; Ding et al., 2004). However, the spatial andemporal decorrelation between SAR acquisitions often makesnSAR less robust (e.g., Zebker and Villaseno, 1992). The accuracy ofnSAR measurements may also be significantly reduced by atmo-pheric phase artifacts that are difficult to be removed from SARnterferograms (e.g., Buckley et al., 2003; Ding et al., 2004; Ding etl., 2008).
Two main categories of approaches have been proposed tomprove the quality of InSAR measurements when affected by theroblems mentioned above, i.e., using auxiliary external data in the
nSAR solutions and using the persistent scatterer (PS) technique.uxiliary external data especially tropospheric products from GPS
bservations and from meteorological satellites have been usedo model and correct for the atmospheric phase artifacts in radarnterferograms (e.g., Janssen et al., 2004; Li, 2004; Li et al., 2004; Lit al., 2006a,b; Onn and Zebker, 2006). The PS technique analyzes∗ Corresponding author. Tel.: +852 27665965; fax: +852 23302994.E-mail address: [email protected] (X.L. Ding).
303-2434/$ – see front matter © 2010 Elsevier B.V. All rights reserved.oi:10.1016/j.jag.2010.05.002
© 2010 Elsevier B.V. All rights reserved.
phase data of PS pixels generated from a time series of SAR images(Ferretti et al., 2000; Ferretti et al., 2001; Berardino et al., 2002;Mora et al., 2003; Kampes and Hanssen, 2004; Hooper et al., 2004;Liu et al., 2008, 2009).
We propose in this paper a method that tightly integrates GPSobservations and the phase data of PS points for detecting verti-cal ground motion in Hong Kong. A continuously operating GPSnetwork of 12 stations in Hong Kong and 8 ENVISAT ASAR imagesacquired over 2006–2007 are used to demonstrate the use of themethod. The tropospheric effects in the SAR interferograms are firstmodelled and corrected for by using tropospheric zenith wet delays(ZWD) derived from the GPS observations. The known motion ratesof the GPS sites determined from the GPS observations are thenused as constraints in the PS solutions to further enhance theresults.
2. Study area and datasets
The ENVISAT ASAR scenes used for this study cover nearly theentire territory of Hong Kong (Fig. 1). The land area of Hong Kongis dominated by mountains that are up to over 900 m above the sea
level and generally covered by dense vegetations (Li et al., 2006c).The steep terrain features have forced over 90% of the nearly 7million inhibitants to live in about 165 km2 of the land area only,creating the highest population density in the world (Jiao et al.,2006). It is therefore a common practice in Hong Kong to reclaim
478 Q. Chen et al. / International Journal of Applied Earth Observation and Geoinformation 12 (2010) 477–486
of cov
ldesfmri
mu2c
Fcffi
Fig. 1. Geographical location of Hong Kong and the area
and from the sea to create more usable land. About 35% of theeveloped land in Hong Kong has been reclaimed from the sea (Jiaot al., 2006). The reclaimed land usually undergoes long periods ofubsidence that may affect building structures and undergroundacilities such as water supply and sewage systems. Ground defor-
ation has long been a problem in Hong Kong especially on theeclaimed land from the sea as well as some local landslides involv-ng the complete detachment and run out of debris.
Earlier ground monitoring campaigns have found local recla-
ation project for extending the land and some local slopesndergoing significant movement (Liu et al., 2001; Ding et al.,004). Monitoring of the progressive subsidence of reclaimed landan provide valuable information for assessing the impacts of
ig. 2. Locations of 12 GPS stations and their VMRs as indicated by the differentolours. The GPS sites are superimposed onto the SAR amplitude image averagedrom all the ASAR data available (For interpretation of the references to color in thisgure legend, the reader is referred to the web version of the article.).
erage of the ENVISAT SAR images (the rectangular area).
ground subsidence and improving future designs of land reclama-tion projects. The space-geodetic technologies like InSAR techniqueand GPS measurements provide powerful methods for monitoringthis significant zone.
Hong Kong has established a continuously operating GPS net-work, the Hong Kong Satellite Reference Network (SatRef), whichconsists of 12 stations that are about 10–15 km apart from eachother (Yuan et al., 2008) (Fig. 2). Nine of the stations are locatedon hilltops and the other are on rooftops of buildings. Each of thestations is equipped with a dual-frequency GPS receiver, a chokering antenna, a meteorological sensor and a tilt sensor. All the GPSreceivers operate continuously and collect data from all visible GPSsatellites at a data sampling interval of 5 s. The GPS data collectedbetween 1 January 2006 and 31 December 2007 from the stationsare used in this study.
There are 8 descending ASAR images acquired between Febru-ary 2006 and May 2007 by the C-band (radar wavelength = 5.6 cm)SAR sensor onboard the ENVISAT satellite. The area of coverage ofthe images is shown in Fig. 1 and the other related information ofthe images is given in Table 1. Each of the images covers an area ofabout 100 km × 100 km whose center is located at about 114◦18′Eand 22◦18′N. The IS-1 swath was selected for this study as it hasthe smallest nominal radar look angle of 18.9◦, leading to the high-
est interferometric sensitivity to the vertical ground motion to bedetected.Table 18 ENVISAT ASAR images used in the study.
Image Frame Orbit Imaging date(day/month/year)
Imaging time (UTC)
1 45 20770 19/02/2006 02:27:402 47 21772 30/04/2006 02:27:443 48 22273 04/06/2006 02:27:454 50 23275 13/08/2006 02:27:495 52 24277 22/10/2006 02:27:496 54 25279 31/12/2006 02:27:457 56 26281 11/03/2007 02:27:408 58 27283 20/05/2007 02:27:43

Q. Chen et al. / International Journal of Applied Earth Observation and Geoinformation 12 (2010) 477–486 479
Table 2VMRs and ZWDs at 12 GPS sites.
GPS sites Latitude (deg.) Longitude (deg.) VMR (mm/yr) ZWD (cm) corresponding to 8 SAR acquisitions
1 2 3 4 5 6 7 8
HKFN 22.4947 114.1382 1.77 ± 0.11 24.5 34.1 38.0 27.1 26.3 15.1 24.7 38.1HKKT 22.4449 114.0666 0.95 ± 0.10 24.5 34.2 38.0 26.1 26.3 14.3 24.8 38.4HKLT 22.4181 113.9966 1.40 ± 0.10 23.7 32.8 36.6 25.4 25.3 14.1 23.9 37.4HKMW 22.2558 114.0032 −0.12 ± 0.31 24.0 32.5 35.8 25.0 24.1 13.6 22.6 37.6HKNP 22.2491 113.8939 1.31 ± 0.39 22.4 30.8 33.8 23.2 22.1 13.3 21.3 a
HKOH 22.2477 114.2286 1.36 ± 0.37 25.0 33.0 36.9 25.2 23.2 14.0 22.6 37.4HKPC 22.2849 114.0378 2.23 ± 0.31 25.1 34.2 38.2 26.9 25.7 14.6 24.4 39.1HKSC 22.3222 114.1412 −0.57 ± 0.21 25.3 34.5 37.7 26.8 25.3 15.2 24.4 38.6HKSL 22.3720 113.9280 0.91 ± 0.11 23.9 33.7 36.3 26.2 25.4 14.2 23.9 38.1HKSS 22.4311 114.2693 −0.15 ± 0.29 25.0 33.9 38.1 27.3 26.0 14.7 24.1 37.7HKST 22.3953 114.1842 0.96 ± 0.12 23.4 31.6 35.2 25.0 23.9 13.4 22.3 35.9HKWS 22.4343 114.3354 0.15 ± 0.35 25.1 33.9 37.2 27.2 25.5 14.1 24.0 37.6
a Missing data due to no sufficient GPS measurements available for ZWD solution.
Fig. 3. Time series of ZWDs at GPS station HKST between 00:00 and 04:00 (UTC) on each of the imaging dates. One sigma error bars are also shown.

480 Q. Chen et al. / International Journal of Applied Earth Observation and Geoinformation 12 (2010) 477–486
d and
3
3
GsitaSataZCde
Fig. 4. 28 interferometric pairs forme
. Data preprocessing
.1. GPS data reduction
The GPS observations from the SatRef are processed with theIPSY software (Version 4.4) developed by NASA’s Jet Propul-ion Laboratory (JPL) (Zumberge et al., 1997). The data processings based on a square-root information filter (SRIF) that adjustshe nominal values of station coordinates, receiver clock drift,tmospheric delay in the zenith direction and other parameters.tudies have indicated that the dominant contributions to neutraltmospheric path delay fluctuations are resulted from the spa-iotemporal variation of the water vapour content in the lowertmosphere (e.g., Hanssen et al., 1999; Li et al., 2006a; Onn and
ebker, 2006). Hong Kong, situated just south of the Tropic ofancer, has a humid subtropical climate with its atmospheric con-itions varying rapidly at times (Li et al., 2004). We thereforestimate the tropospheric ZWD every 5 min for all the GPS stationsFig. 5. Topographic interferogram simulated for the 31/12/2006–
their temporal and spatial baselines.
as random-walk processes. The coordinates of all the GPS stationsare estimated daily by fixing the ambiguities. The daily solutionsare transformed into the ITRF2005 reference frame by using the 7transformation parameters determined by JPL (a reference?). Spa-tial filtering based on principal component analysis is applied toremove the common-mode signals (see Yuan et al., 2008).
The resulting time series of daily coordinates are used to esti-mate the velocities of the sites. Table 2 and Fig. 2 show the derivedvertical motion rates (VMR) (negative for subsiding and positive foruplifting) of the 12 GPS sites. It can be seen from the results that 9 ofthe sites are going up with a rate of between 0.65 and 2.23 mm/yrand 3 of the sites are subsiding with a rate of between 0.12 and0.57 mm/yr. The root mean square (RMS) errors of the estimatedrates range from 0.10 to 0.68 mm/yr. The uplifting of the GPS sites
may be due to tectonic activities of the Huanan plate (Feng et al.,1998).Linear interpolation of the time series of ZWD obtained from theGPS solutions is made to derive the ZWD at the time of ASAR image
11/03/2007 pair. The ambiguity height of the pair is 95 m.

Q. Chen et al. / International Journal of Applied Earth Observation and Geoinformation 12 (2010) 477–486 481
F corre2
aGioKtav
ig. 6. Maps of LOS tropospheric delays (in mm) due to tropospheric heterogeneity007. The black triangles represent the GPS sites.
cquisitions. As an example, Fig. 3 shows the time series of ZWD atPS station HKST between 00:00 and 04:00 (UTC) on each of the
maging dates. It is clear from the results that both the magnitudes
f the ZWD and their temporal variations are significant in Hongong. Table 2 lists the interpolated ZWD values of the GPS sites athe time of the 8 ASAR image acquisitions, which vary between 13nd 40 cm. It is evident that all the GPS sites exhibit the lowest ZWDalues in the winter season, e.g., around 14 cm on December 31,
sponding to the 6 interferometric pairs related to the image acquired on March 11,
2006 (the 6th image), and the highest ZWD values in the summerseason, e.g., around 35 cm on June 4, 2006 (the 3rd image) (seeTables 1 and 2).
3.2. Interferometric processing
Interferometric pairs are formed by combining any two imagesin the dataset. The number (M) of interferometric pairs thus formed

482 Q. Chen et al. / International Journal of Applied Earth Observation and Geoinformation 12 (2010) 477–486
F 03/20o ter bot
i
M
wnfii
ri
ig. 7. Interferograms generated from 0/04/2006–11/03/2007 and 31/12/2006–11/grams after the topographic effects are removed, and (c) and (f) interferograms afhe two interferometric pairs.
s
= C2N = N!
2! · (N − 2)!(1)
here N is the number of images available (8 in this case). Theumber of interferometric pairs formed from the dataset is there-
ore 28 as illustrated in Fig. 4, where both the temporal baselines
n days and the spatial (perpendicular) baselines in meters of thenterferometric pairs are given.It should be noted that we choose to use all the interferomet-ic combinations in the dataset instead of using a unique mastermage as proposed in the original PS InSAR technique in order to
07 interferometric pairs. (a) and (d) The initial interferograms, (b) and (e) interfer-th the topographic and the tropospheric effects are removed, all corresponding to
be able to obtain reliable PS InSAR solutions with a much reducednumber of SAR images. Mora et al. (2003) demonstrated that theresults obtained from only 7 SAR images with this approach are ingood agreement with those obtained from 23 SAR images with theoriginal PS InSAR technique.
The interferometric processing is carried out with the DORISsoftware that is freely available to the public (Kampes et al.,
2003). Interferograms are computed from the conjugate multiplica-tion of the co-registered complex SAR images. The interferometricphases thus derived are due to flat-earth trend, topography, groundmotion, atmospheric delay, and decorrelation noise (Massonnetand Feigl, 1998). The DEOS precise orbital data (Scharroo and Visser,
th Obs
1sat3
cpi
w�dtdt (
4
4
h
�
wtioputtc
taecfe2eamwm
�
wt
g
�
wp
Q. Chen et al. / International Journal of Applied Ear
998) and the Shuttle Radar Topography Mapping (SRTM) 3-arcecond (equivalent to about 90 m) digital elevation model (DEM)re used to reduce the orbital errors and remove the flat-earth andopographic effects. A topographic interferogram simulated for the1/12/2006–11/03/2007 pair is shown in Fig. 5 as an example.
When assuming that the DEM used has errors and the verti-al ground motion is linear in time, the differential interferometrichase at an arbitrary pixel with coordinates (x,y) from the kth
nterferogram can be modelled as
(x, y; Tk) = 4� · Bk⊥� · R · sin �
h(x, y) + 4��
v(x, y) · Tk · cos � + �a(x, y)
+�n(x, y) k = 1, 2, . . . ,28 (2)
here Bk⊥ is the perpendicular baseline; Tk is the temporal baseline;is the radar wavelength (5.66 cm for ASAR); R is the sensor-targetistance; � is the radar incidence angle; h is the elevation error; v ishe linear vertical motion rate (VMR); �a is the atmospheric phaseelay; and �n is the decorrelation noise. No spectral nor phase fil-ering is performed to avoid changing the phase data. In addition,
in Eq. (2) is a wrapped phase value in the principal interval of–�, �).
. Integrated modelling and least squares solution
.1. Removal of atmospheric effects
The phase shift in a radar interferogram due to troposphericeterogeneity can be modelled as
a(x, y) = 4�� · cos �
· [D(x, y, tm) − D(x, y, ts)] (3)
here D(x,y,t) is the ZWD to pixel (x,y); tm and ts denote the time forhe master and the slave SAR acquisitions, respectively; and 1/cos �s a mapping function that projects the ZWD to the radar line-f-sight (LOS) direction. For each interferogram, the atmospherichase shifts (APS) at the GPS sites can be estimated with Eq. (3)sing the corresponding ZWD values listed in Table 2. To facili-ate the subsequent data processing, the geodetic coordinates ofhe GPS sites (see Table 2) should be converted into the radar pixeloordinate system.
As the GPS sites are sparse and their distribution is irregular,he APS values of the GPS sites are interpolated to each pixel ofdifferential interferogram before correcting for the atmospheric
ffects. Studies have indicated that Kriging interpolator is a goodhoice for interpolating regionalized variables like APS in an inter-erogram that exhibit a spatial structure of autocorrelation (Ferrettit al., 2000; Ferretti et al., 2001; Janssen et al., 2004; Li et al.,004, 2006a). To quantify the spatial autocorrelation, we create anmpirical semivariogram using the APS values at the GPS sites topproximate the structure function of the APS (Cressie, 1993). Aodel that fits to the empirical semivariogram is then determinedith a least squares approach. Test runs have shown that a linearodel can fit to the semivariance �ij well at any given distance, i.e.,
ij = s · dij (4)
here dij is the distance between the two sites and s is the slope ofhe linear model.
The weighted sum of the GPS-derived APS values surrounding aiven point is computed as the predicted APS value of the point,
P∑
ˆ a(x0, y0) =i=1
�i · �a(xi, yi) (5)
here �̂a(x0, y0) is the APS value of pixel (x0,y0) from Kriging inter-olation; P is the number of GPS sites surrounding the pixel; and
ervation and Geoinformation 12 (2010) 477–486 483
�i is the weight coefficient. The weight coefficients can be resolvedfrom the following equation system⎧⎪⎪⎪⎪⎨⎪⎪⎪⎪⎩
P∑j=1
�j · �i,j + u = �i0, i = 1, . . . , P
P∑i=1
�i = 1
(6)
where is an unknown to be estimated.An APS map is computed for each of 28 differential interfer-
ograms (see Fig. 4) based on the method discussed above. Fig. 6shows as examples the APS maps corresponding to the 6 interfer-ometric pairs related to the image acquired on March 11, 2007,indicating LOS tropospheric delays caused by the tropospheric het-erogeneity. It is clear from the results that the delays vary fromseveral millimetres to about 150 mm. The 11/03/2007–04/06/2006interferometric pair has the most significant delays, with a meanvalue of 133.4 mm and a standard derivation of ±4.9 mm. TheAPS maps are then used to remove the atmospheric phasecontribution from the differential interferograms. Fig. 7 showsas examples two interferograms (30/04/2006–11/03/2007 and31/12/2006–11/03/2007) after removing the topographic andatmospheric effects.
4.2. PS identification and networking
Ferretti et al. (2001) suggested that PS pixels with high SNRphase measurements can be identified based on statistical anal-ysis of the amplitude values of a time series of SAR images when asignificant number of SAR images (e.g., over 25) is available. Moraet al. (2003) proposed to determine PS points based on interfero-metric coherence when only a limited number of SAR images areavailable. The latter approach is used for this study considering thatonly 8 SAR images are available.
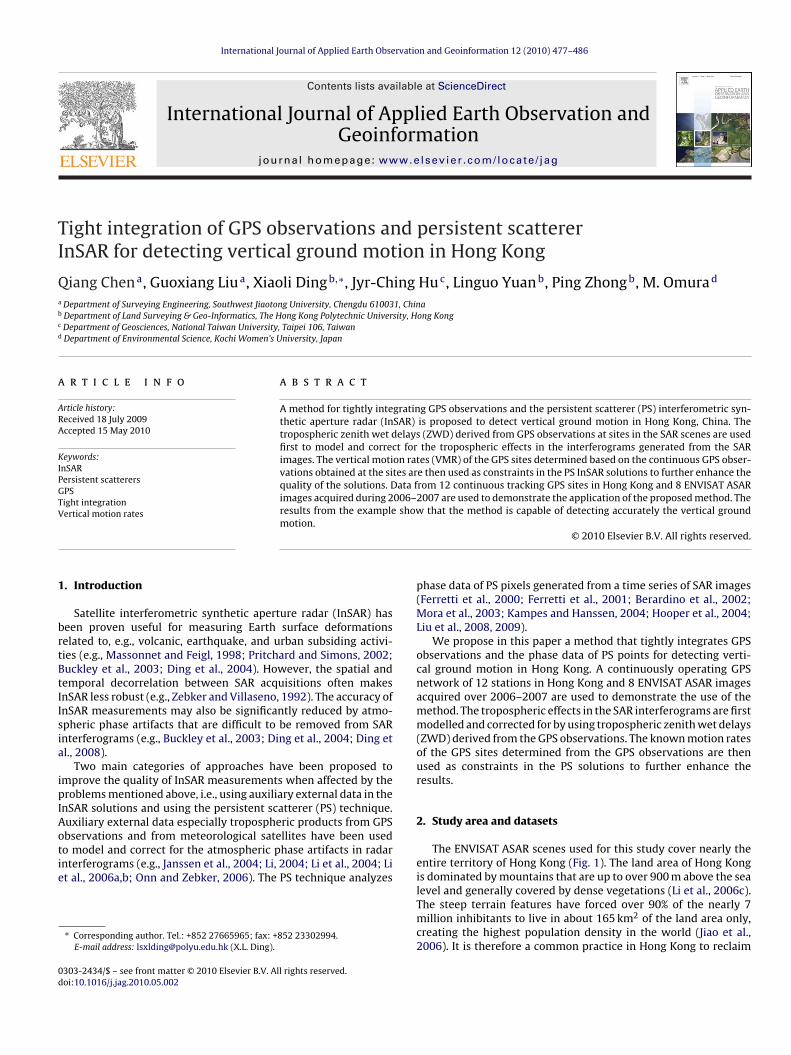
To estimate the coherence more accurately to avoid the prob-lems in detecting the PS, multilooking (i.e., downsampling) isneeded for the interferograms (Mora et al., 2003). Multilookingoperation can also enhance the SNR of the phase data although thespatial resolution of deformation measurement is degraded by mul-tilooking. The factors chosen for the multilooking operation are 4pixels in range and 20 pixels in azimuth. The mean coherence valueof the 28 coherence values is calculated for each pixel. We considera pixel as a PS candidate if the mean coherence value of the pixelis larger than the given threshold of 0.5, and thus resulting in 469PS points for the study area (see Fig. 8). The number of PS pointsidentified is about 40 times more than the number of GPS sites inthe area. A close inspection of Fig. 8 shows that all the GPS sites arequalified PS points as each of the GPS site has a large antenna poleand a concrete platform that form a good radar corner reflector.All the PS points are connected with the Delaunay triangulationmethod to form a triangular irregular network (TIN) as shown inFig. 8.
4.3. Network adjustment by least squares approach
Differential operation of the interferometric phase values alongeach side (referred to as connection hereafter for simplicity) of thetriangles is carried out to reduce the effects of spatially correlatederrors such as the residual atmospheric effects and orbital errors.
Although the atmospheric signals have been largely removed byusing the method described in Section 4.1, their short wavelengthcomponents may still remain in the differential interferograms. Forthe kth interferometric pair, the differential phase k betweenthe two PS points on a connection can be derived from Eq. (2) and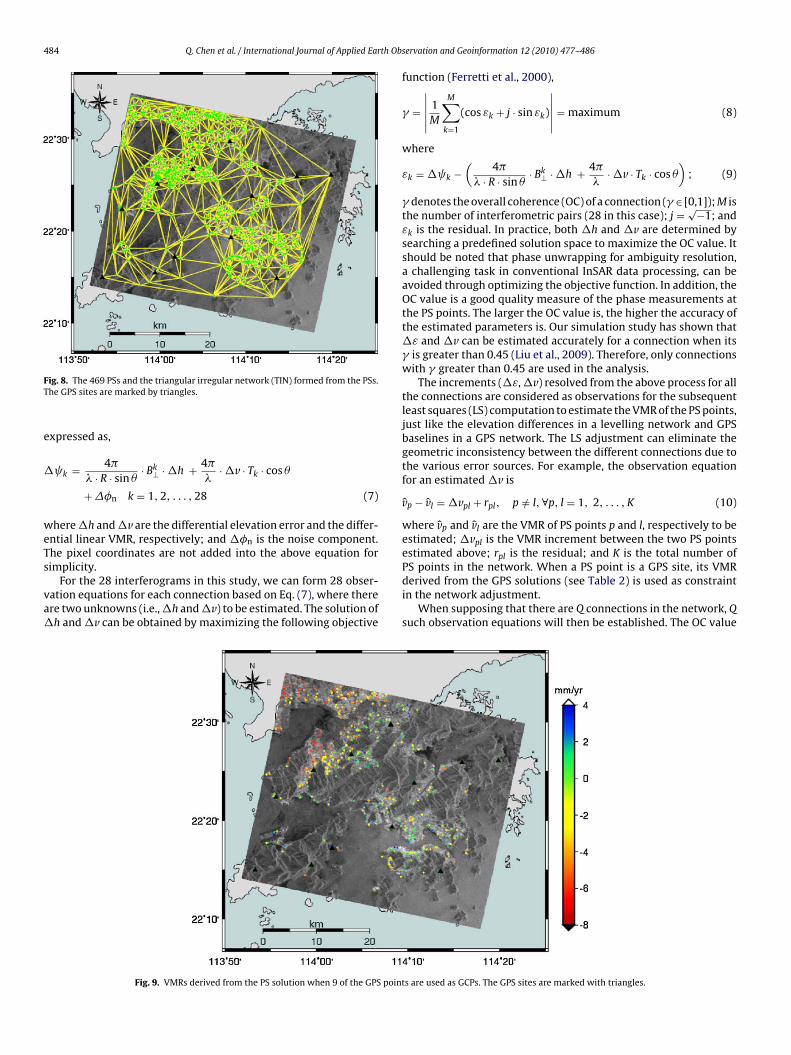
484 Q. Chen et al. / International Journal of Applied Earth Ob
FT
e
weTs
va
PS points in the network. When a PS point is a GPS site, its VMR
ig. 8. The 469 PSs and the triangular irregular network (TIN) formed from the PSs.he GPS sites are marked by triangles.
xpressed as,
k = 4�� · R · sin �
· Bk⊥ ·h + 4��
·v · Tk · cos �
+��n k = 1,2, . . . ,28 (7)
hereh andv are the differential elevation error and the differ-ntial linear VMR, respectively; and �n is the noise component.he pixel coordinates are not added into the above equation forimplicity.
For the 28 interferograms in this study, we can form 28 obser-ation equations for each connection based on Eq. (7), where therere two unknowns (i.e.,h andv) to be estimated. The solution ofh andv can be obtained by maximizing the following objective
Fig. 9. VMRs derived from the PS solution when 9 of the GPS point
servation and Geoinformation 12 (2010) 477–486
function (Ferretti et al., 2000),
� =∣∣∣∣∣
1M
M∑k=1
(cos εk + j · sin εk)
∣∣∣∣∣ = maximum (8)
where
εk = k −(
4�� · R · sin �
· Bk⊥ ·h + 4��
·v · Tk · cos �)
; (9)
� denotes the overall coherence (OC) of a connection (� ∈ [0,1]); M isthe number of interferometric pairs (28 in this case); j = √−1; andεk is the residual. In practice, both h and v are determined bysearching a predefined solution space to maximize the OC value. Itshould be noted that phase unwrapping for ambiguity resolution,a challenging task in conventional InSAR data processing, can beavoided through optimizing the objective function. In addition, theOC value is a good quality measure of the phase measurements atthe PS points. The larger the OC value is, the higher the accuracy ofthe estimated parameters is. Our simulation study has shown thatε and v can be estimated accurately for a connection when its� is greater than 0.45 (Liu et al., 2009). Therefore, only connectionswith � greater than 0.45 are used in the analysis.
The increments (ε,v) resolved from the above process for allthe connections are considered as observations for the subsequentleast squares (LS) computation to estimate the VMR of the PS points,just like the elevation differences in a levelling network and GPSbaselines in a GPS network. The LS adjustment can eliminate thegeometric inconsistency between the different connections due tothe various error sources. For example, the observation equationfor an estimatedv is
v̂p − v̂l =vpl + rpl, p /= l,∀p, l = 1, 2, . . . , K (10)
where v̂p and v̂l are the VMR of PS points p and l, respectively to beestimated; vpl is the VMR increment between the two PS pointsestimated above; rpl is the residual; and K is the total number of
derived from the GPS solutions (see Table 2) is used as constraintin the network adjustment.
When supposing that there are Q connections in the network, Qsuch observation equations will then be established. The OC value
s are used as GCPs. The GPS sites are marked with triangles.

Q. Chen et al. / International Journal of Applied Earth Observation and Geoinformation 12 (2010) 477–486 485
Table 3Comparison between GPS- and PS-derived VMRs at 12 GPS sites.
GPS sites VMR by GPS (mm/yr) VMR by PS solution (mm/yr) Difference (mm/yr) Remark
HKFN 1.77 1.77 0.00 GCPHKKT 0.95 0.97 −0.02 Check pointHKLT 1.40 1.40 0.00 GCPHKMW −0.12 −0.12 0.00 GCPHKNP 1.31 1.31 0.00 GCPHKOH 1.36 1.60 −0.24 Check pointHKPC 2.23 2.23 0.00 GCPHKSC −0.57 −0.57 0.00 GCPHKSL 0.91 0.91 0.00 GCPHKSS −0.15 −0.15 0.00 GCP
oavtaGtc
5
oacpa±tccpm
t5uiwt
aatTHifTwatr
ParOt
5161/06E), the Natural Science Foundation of China (Grant No.
HKST 0.96 0.90HKWS 0.15 0.15
f a connection is used as the weight for the connection, so thatweighted LS solution can be obtained to determine all the VMR
alues. Such a procedure can also be applied similarly to estimatehe elevation errors of the PS points (Ferretti et al., 2000; Ferretti etl., 2001). In the LS computations, the VMR and the elevations of thePS sites are used as control information to enhance the quality of
he solutions. Therefore, the GPS sites can be considered as groundontrol points (GCP) in the PS InSAR solutions.
. Results and analysis
Fig. 9 shows the map of VMR computed for all PS points whennly 9 of the GPS sites are used as GCP (see Table 3) in the LSdjustment computation. The remaining 3 GPS sites are used asheck points to verify the results. It can be seen that all the PSoints exhibit only slow vertical ground motions. The VMR havemean value of −2.2 mm/yr and a standard deviation (SD) of2.6 mm/yr. Table 3 lists both the GPS- and PS-derived VMR at
he 12 GPS sites for comparison. The VMR discrepancies at the 3heck points vary from −0.24 to 0.06 mm/yr. The RMS error of theheck points is 0.15 mm/yr. The results have verified that the pro-osed method is capable of detecting accurately very small groundotions.To assess the effects of the number of GCP on the accuracy of
he PS solution, we also carry out a LS adjustment in which onlyGPS sites are used as GCP, while the remaining 7 GPS sites are
sed as check points. The RMS error of the check points in this cases 0.69 mm/yr, larger than that (0.15 mm/yr) obtained when 9 GCP
ere used. This reveals understandably that the more GCP are used,he higher the accuracy of the PS solution can become.
The results in Fig. 9 indicate that the majority of the PS pointsre subsiding especially those located in the reclaimed areas whilesmall number of them are uplifting perhaps due to the regional
ectonic activities (Feng et al., 1998) and local site disturbances.he PS points in Tin Shui Wai region, the northwestern corner ofong Kong had experienced significant subsidence with subsid-
ng rates ranging from −3 to −8 mm/yr. This area was reclaimedrom the sea about 20 years ago (Liu et al., 2001; Ding et al., 2004).he subsidence rate is the highest near the sea (about −8 mm/yr)hile it decreases with the distance from the shore. The results
lso agree well with those from an earlier study based on conven-ional differential InSAR (Ding et al., 2004) for Fairview Park in theegion.
As a remark, we have observed from Fig. 9 that very few
S points have been detected in the mountainous regions thatre generally covered by dense broadleaf trees. Temporal decor-elation and geometric distortions in such regions are severe.n the contrary, PS points are much easier to be detected inhe built up regions such as the reclaimed areas as satisfactory
0.06 Check point0.00 GCP
radar coherence can be maintained in such regions for manyyears.
6. Conclusions
A method for tightly integrating GPS observations and PS InSARfor detecting ground motion has been presented. It has been pro-posed to first utilize the GPS-derived ZWD to model and correct forthe tropospheric effects in the SAR interferograms based on Kriginginterpolation. The PS points and the GPS sites are then connected bya TIN and the differential elevation errors and motion rates alongeach side of the triangles can be determined. Weighted LS solu-tions are finally carried out to estimate the elevation errors and themotion rates of all the PS points where the GPS-derived elevationsand motion rates are used as constraints in the solutions to furtherenhance the results.
An experiment conducted with 12 GPS sites and 8 ASAR imagesacquired during 2006–2007 over Hong Kong has shown thatthe method can estimate accurately the VMR of the PS points,despite the significant tropospheric delays experienced in someof the interferograms. The atmospheric effects can be significantlyreduced by both modelling the effects with the GPS-derived ZWDand by carrying out the differential operations along the sides ofthe TIN, thus improving significantly the accuracy of the VMR esti-mation. When 9 GCP were used in the PS solution, the RMS error ofthe estimated VMR from the check points was 0.15 mm/yr. Whenonly 5 GCP were used in the PS solution, the RMS error increasedto 0.69 mm/yr.
The results have indicated that the majority of the PS points weresubsiding especially those in the reclaimed areas. For example, ithas been found that the northwestern part of Hong Kong had beensubsiding at rates ranging from −3 to −8 mm/yr. A limitation of thisstudy is the short time span (just over 1 year) of the available SARdataset that has made it difficult to extract any nonlinear verticalmotions.
Acknowledgements
This work presented is partly supported by the Funda-mental Research Funds for the Central Universities (Grant No.SWJTU09CX010), the SWJTU Funds for Science and TechnologyDevelopment (2009), the Research Grants Council of the HongKong Special Administrative Region (HKSAR) (Grant No. PolyU
40774004) and an ESA Category 1 Project (No. 1232). The authorsare very grateful to the Survey and Mapping Office of the LandsDepartment of the HKSAR for providing the GPS observations, toJPL/NASA for providing the SRTM DEM and to DEOS for providingthe precise orbital data.

4 th Ob
R
B
B
C
D
D
F
F
F
H
H
J
J
K
K
L
86 Q. Chen et al. / International Journal of Applied Ear
eferences
erardino, P., Fornaro, G., Lanari, R., Sansosti, E., 2002. A new algorithm forsurface deformation monitoring based on small baseline differential SAR inter-ferograms. IEEE Transactions of Geoscience and Remote Sensing 40 (11),2375–2383.
uckley, S.M., Rosen, P.A., Hensley, S., Tapley, B.D., 2003. Land subsidence in Houston,Texas, measured by radar interferometry and constrained by extensometers.Journal of Geophysical Research 108 (B11), 2542, doi:10.1029/2002JB001848.
ressie, N.A.C., 1993. Statistics for Spatial Data. John Wiley & Sons, Inc., New York,pp. 105-134.
ing, X.L., Liu, G.X., Li, Z.W., Li, Z.L., Chen, Y.Q., 2004. Ground subsidence monitoringin Hong Kong with satellite SAR interferometry. Photogrammetric Engineering& Remote Sensing 70 (10), 1151–1156.
ing, X.L., Li, Z.W., Zhu, J.J., Feng, G.C., Long, J.P., 2008. Atmospheric effects on InSARmeasurements and their mitigation. Sensors 8, 5426–5448.
eng, H.J., Gu, D.S., Zhang, L., Zhao, J.L., Wang, X.K., 1998. The research on the earthcrust vertical movement characteristic and mechanism in eastern china. ActaGeodaetica et Cartographica Sinica 27 (1), 16–23.
erretti, A., Prati, C., Rocca, F., 2000. Non-linear subsidence rate estimation usingpermanent scatterers in differential SAR interferometry. IEEE Transactions onGeoscience and Remote Sensing 38 (5), 2202–2212.
erretti, A., Prati, C., Rocca, F., 2001. Permanent scatterers in SAR interferometry.IEEE Transactions on Geoscience and Remote Sensing 39 (1), 8–19.
anssen, R.F., Weckwerth, T.M., Zebker, H.A., Kless, R., 1999. High-resolutionwater vapor mapping from interferometric radar measurements. Science 283,1297–1299.
ooper, A., Zebker, H., Segall, P., Kampes, B.M., 2004. A new method for measuringdeformation on volcanoes and other natural terrains using InSAR persistent scat-terers. Geophysical Research Letters 31, L23611, doi:10.1029/2004GL021737.
anssen, V., Ge, L.L., Rizos, C., 2004. Tropospheric corrections to SAR interferometryfrom GPS observations. GPS Solutions 8, 140–151.
iao, J.J., Wang, X.S., Nandy, S., 2006. Preliminary assessment of the impacts of deepfoundations and land reclamation on groundwater flow in a coastal area in HongKong. China Hydrogeology Journal 14, 100–114.
ampes, B.M., Hanssen, R.F., Perski, Z., 2003. Radar interferometry with publicdomain tools. In: Proc. of FRINGE 2003 Workshop, December 1–5, Frascati, Italy.
ampes, B.M., Hanssen, R.F., 2004. Ambiguity resolution for permanent scattererinterferometry. IEEE Transactions on Geoscience and Remote Sensing 42 (11),2446–2453.
i, Z.W., 2004. Modeling Atmospheric Effects on Repeat-pass InSAR Measurements.Ph.D. Dissertation, Department of Land Surveying and Geo-Informatics, TheHong Kong Polytechnic University.
servation and Geoinformation 12 (2010) 477–486
Li, Z.W., Ding, X.L., Huang, C., Wadge, G., Zheng, D.W., 2006a. Modeling of atmo-spheric effects on InSAR measurements by incorporating terrain elevationinformation. Journal of Atmospheric Solar-Terrestrial Physics 68, 1189–1194,doi:10.1016/j.jastp.2006.03.002.
Li, Z.W., Ding, X.L., Liu, G.X., 2004. Modeling atmospheric effects on InSAR with mete-orological and continuous GPS observations: algorithm and some test results.Journal of Atmospheric and Solar-Terrestrial Physics 66, 907–917.
Li, Z., Fielding, E.J., Cross, P., Muller, J.P., 2006b. Interferometric synthetic apertureradar atmospheric correction: GPS topography-dependent turbulence model.Journal of Geophysical Research 111, B02404, doi:10.1029/2005JB003711.
Li, Z.L., Liu, G.X., Ding, X.L., 2006c. Exploring the generation of digital elevationmodels from same-Side ERS SAR images: topographic and temporal effects. ThePhotogrammetric Record 2006 21 (114), 124–140.
Liu, G.X., Ding, X.L., Chen, Y.Q., Li, Z.L., Li, Z.W., 2001. Ground settlement of Chek LapKok Airport, Hong Kong, detected by satellite synthetic aperture radar interfer-ometry. Chinese Science Bulletin 46 (21), 1778–1782.
Liu, G.X., Luo, X.J., Chen, Q., Huang, D.F., Ding, X.L., 2008. Detecting land subsidencein Shanghai by PS-networking SAR interferometry. Sensors 8, 4725–4741.
Liu, G.X., Buckley, S.M., Ding, X.L., Chen, Q., Luo, X.J., 2009. Estimating spatiotemporalground deformation with improved persistent-scatterer radar interferometry.IEEE Transactions on Geoscience and Remote Sensing 47 (9), 3209–3219.
Massonnet, D., Feigl, K.L., 1998. Radar interferometry and its application to changesin the Earth’s surface. Reviews of Geophysics 36 (4), 441–500.
Mora, O., Mallorqui, J.J., Broqustas, A., 2003. Linear and nonlinear terrain deformationmaps from a reduced set of interferometric SAR images. IEEE Transactions onGeoscience and Remote Sensing 41 (10), 2243–2253.
Onn, F., Zebker, H.A., 2006. Correction for interferometric synthetic aperture radaratmospheric phase artifacts using time series of zenith wet delay observa-tions from a GPS network. Journal of Geophysical Research 111, B09102,doi:10.1029/2005JB004012.
Pritchard, M.E., Simons, M., 2002. A satellite geodetic survey of large-scale deforma-tion of volcanic centres in the central Andes. Nature 418, 167–171.
Scharroo, R., Visser, P., 1998. Precise orbit determination and gravity fieldimprovement for the ERS satellites. Journal of Geophysical Research 103 (C4),8113–8127.
Yuan, L.G., Ding, X.L., Chen, W., Simon, K., Chan, S.B., Hung, P.S., Chau, K.T., 2008.Characteristics of daily position time series from the Hong Kong GPS fiducial
network. Chinese Journal of Geophysics 51 (5), 1372–1384.Zebker, H.A., Villaseno, J., 1992. Decorrelation in interferometric radar echoes. IEEETransactions on Geoscience and Remote Sensing 30 (5), 950–959.
Zumberge, J.F., Heflin, M.B., Jefferson, D.C., Watkins, M.M., Webb, F.H., 1997. Precisepoint positioning for the efficient and robust analysis of GPS data from largenetworks. Journal of Geophysical Research 102 (B3), 5005–5017.