international journal of applied aviation studies · paul bates griffith university, queensland,...
TRANSCRIPT

Volume 11, Number 1 2011
International Journal of Applied Aviation StudiesA Publication of the FAA AcademyOklahoma City, Oklahoma
20
11
Inte
rnatio
nal Jo
urn
al o
f Ap
plie
d A
via
tion
Stu
die
s Vo
lum
e 1
1, N
um
ber 1
Federal Aviation Administration

blank page

REVIEW PROCESS
The Federal Aviation Administration Academy provides traceability and over-sight for each step of the International Journal of Applied Aviation Studies (IJAAS). IJAAS is a peer-reviewed publication, enlisting the support of an international panel of consulting editors. Each consulting editor was chosen for his or her expertise in one or more areas of interest in aviation. Using the blind-review process, three or more consulting editors are selected to appraise each article, judging whether or not it meets the requirements of this publication. In addition to an overall appraisal, a Likert scale is used to measure attitudes regarding individual segments of each ar-ticle. Articles that are accepted are those that were approved by a majority of judges. Articles that do not meet IJAAS requirements for publication are released back to their author or authors.
Individuals wishing to obtain a copy of the IJAAS on CD may contact Kay Ch-isholm by email at [email protected], or by telephone at (405) 954-3264, or by writing to the following address:
International Journal of Applied Aviation Studies
Kay ChisholmAMA-800PO Box 25082Oklahoma City, OK 73125

POLICY AND DISCLAIMERS
Policy Statement: The Federal Aviation Administration (FAA) Academy strongly supports academic freedom and a researcher’s right to publish; therefore, the Federal Aviation Administration Academy as an institution does not endorse the viewpoint or guarantee the technical correctness of any of the articles in this journal.
Disclaimer of Liability: With respect to articles available in this journal, neither the United States Gov-ernment nor the Federal Aviation Administration Academy nor any of their employees, makes any war-ranty, express or implied, including the warranties of merchantability and fitness for a particular purpose, or assumes any legal liability or responsibility for the accuracy, completeness, or usefulness of any informa-tion, apparatus, product, or process disclosed, or represents that its use would not infringe privately owned rights.
Disclaimer of Endorsement: Reference herein to any specific commercial products, process, or ser-vice by trade name, trademark, manufacturer, or otherwise, does not constitute or imply its endorsement, recommendation, or favoring by the United States Government or the Federal Aviation Administration Academy. The views and opinions of authors expressed herein do not state or reflect those of the United States Government or the Federal Aviation Administration, and shall not be used for advertising or product endorsement purposes.

PUBLISHER
Academy Superintendent Sunny Lee-FanningDeputy Superintendent (Acting) William J. Mumper
PUBLICATION COMMITTEE
Manager, Regulatory Standards Division David LongManager, Technical Operations Training Division Jessie McMullenManager, Air Traffic Division William J. MumperManager, Airports & International Training Division Sherry Reese
EDITORIAL STAFF
Managing Editor Kay ChisholmAssociate Editor Deann KingIJAAS Founding Editor and Research Consultant Todd P. Hubbard
CONSULTING EDITORS
International
Ruwantissa I.R. Abeyratne ICAO, Montreal, CanadaAlireza Ahmadi Luleå University of Technology, Luleå, SwedenAlan A. Baker CRC-ACS, Victoria , AustraliaPierre R. Band Institut du Cancer de Montréal, Québec, CanadaJames Barker Dalhousie University, Halifax, Nova Scotia, CanadaPaul Bates Griffith University, Queensland, AustraliaSimon Bennett Institute of Lifelong Learning, Leicester, UKHenk Blom National Aerospace Laboratory NLR, Amsterdam, The NetherlandsRobert Bor Royal Free Hospital, London, UKGraham Braithwaite Cranfield University, Cranfield, UKPeter Brooker Cranfield University, Cranfield, UKBryan Burke Macquaire University, Sydney, AustraliaIng. F.J.L. Bussink National Aerospace Laboratory, Amsterdam, The NetherlandsPetr Cásek Honeywell International Advanced Technology Center, Czech RepublicMichael B. Charles Southern Cross University, Tweed Heads, NSW AustraliaKlaus Christoffersen Acuite, Hamilton, Ontario, CanadaScott Allen Cohen Bournemouth University, Dorset, UKOlja Čokorilo University of Belgrade, SerbiaDesmond M. Connolly QinetiQ, Farnborough, Hampshire, UKFinian Connolly Executive & Professional Training Inst., Drogheda, Co Louth, IrelandHugh David Eurocontrol, East Sussex, UKSidney Dekker Linköping Institute of Technology, Linköping, SwedenDavid Denyer Cranfield University, Bedford, UKTeresa C. D’Oliveira ISPA, Lisbon, PortugalRobert van Doorn Universiteit Maastricht, The NetherlandsÅsa Ek Lund University, Lund, SwedenAlois Farthofer Human Factors Research, St. Georgen, AustriaMassimo Felici University of Edinburgh, Edinburgh, UKRodney Fewings Cranfield University, Cranfield, Bedfordshire UKGerard J. Fogarty University of Southern Queensland, Toowoomba, AustraliaJarle Gimmestad Braathens Airlines, Fornebu, Norway

Stefan Gössling Linnaeus University, Växjö, SwedenEric L. Groen TNO Defence, Soesterberg, The NetherlandsGael P. Hammer Johannes Gutenberg-University, Mainz, GermanyDon Harris Cranfield University, Cranfield, Bedfordshire, UKGeraint Harvey Swansea University, Swansa, Wales, UKIrene Henley University of Western Sidney, Sidney, AustraliaIvonne A. Herrera SINTEF Technology & Society Safety Research, Trondheim, NorwayToshio Hirose Sendai Nishikicho Clinic & Occupational Health Center, Sendai, JapanEef Hogervorst Loughborough University, Leicestershire, UKAlexandra Holmes Clockwork Research Ltd., London, UKHans-Jürgen Hörmann Deutsches Zentrum für Luftund Raumfahrt (DLR), Hamburg, GermanyGraham Hunt Massey University, Auckland, New ZealandMagnus Jacobssen Linköping Institute of Technology, Linköping, SwedenMilan Janic Delft University of Technology, Delft,The NetherlandsLynn M. Jeffrey Massey University Auckland, Auckland, New ZealandChris W. Johnson University of Glasgow, Glasgow, ScotlandK. Wolfgang Kallus Karl Franzens University, Graz, AustriaMichael John Kay RMIT University, Melbourne, Victoria, AustraliaJörg Leonhardt Deutsche Flugsicherung GmbH, Langen, GermanyDirk Lehmkuhl University of St. Gallenm, St.Gallen, SwitzerlandGeorge Leloudas Gates and Partners Solicitors, London, UKMaria Chiara Leva Trinity College Dublin, Dublin, IrelandYuh-Shiow Li Chang Gung Institute of Technology, Taiwan, ROCWen-Chin Li National Defense University, Taipei, Taiwan, R.O.C.Christopher Lowe Liv Systems Ltd, Bristol, UKZaira Marioli-Riga Hellenic Aerospace Industry S.A., Schimatari, GreeceMonica Martinussen University of Tromsø, Tromsø, NorwayElizabeth Mathews Aviation English Services, Wellington, New ZealandJeremy Mell French Embassy, Washington, DCJim Mitchell University of Western Sydney, Penrith South, AustraliaKjell Mjøs Norwegian University of Science and Technology,Oslo, NorwayBrett Molesworth University of New South Wales, Sydney, AustraliaPatrick Murray Griffith University, Queensland, AustraliaDavid G. Newman Flight Medicine Systems PTY LTD, Victoria, AustraliaJan Noyes University of Bristol, Bristol, UKPaul O’Connor National University of Ireland, Galway, IrelandDavid O’Hare University of Otago, Dunedin, New ZealandEsther Oprins Air Traffic Control Netherlands, Schiphol Airport, NetherlandsGünther Ortmann Helmut-Schmidt-Universität, Hamburg, GermanyChristine Owen University of Tasmania, Tasmania, AustraliaStanislav Pavlin University of Zagreb, Zagreb, CroatiaMichal Pěchouček Czech Technical University, Prague, Czech RepublicStefanie Petrie Luftwaffe Institute of Aviation Medicine, Fürstenfeldbruck, GermanyAndrew Potter Cardiff University, Cardiff, UKTeemu Reiman VTT Technical Research Centre of Finland, Otaniemi, FinlandAndrew N. Rider The Defence Science and Technology Organisation (DSTO), Victoria , AustraliaAlfred Roelen National Aerospace Laboratory, Amsterdam, The NetherlandsJan Joris Roessingh National Aerospace Laboratory, Amsterdam, The NetherlandsJens Rolfsen Det Norske Veritas, Høvik, Norway Paul Roosens University of Antwerp, Antwerpen, BelgiumMichael Siegrist Institute for Environmental Decisions, Zurich, SwitzerlandT. Leigh Signal Massey University, Wellington, New ZealandAdrian Smith Aeromedical Centre, Dhahran, Kingdom of Saudi ArabiaRichard H. Y. So University of Essex, Colchester, UK

Manuel Soler Universidad Rey Juan Carlos, Madrid, SpainSybert Stroeve NLR Air Transport Safety Institute, Amsterdam, The NetherlandsShinji Suzuki University of Tokyo, Tokyo, JapanHakan Tarakci Melbourne Business School, Melbourne, AustraliaSteve Thatcher University of South Australia, Mawson Lakes, AustraliaM. “Mattie” Tops Leiden University, Leiden, The NetherlandsPernilla Ulfvengren Royal Institute of Technology, Stockholm, SwedenClaudia van de Wal VALK Foundation, NetherlandsLucas van Gerwen VALK Foundation, Netherlands Leo Vermeulen University of Pretoria, Pretoria, South AfricaJoachim Vogt Technische Universität Darmstadt, Darmstadt, GermanyAnthony S. Wagstaff Institute of Aviation Medicine, Oslo, NorwayStephen Walsh Interaction Training Associates, NetherlandsMark Wiggins Macquarie University, North Ryde, NSW, Australia Damien J. Williams University of Bristol, Bristol, UKRobert Wolfger Austrian Airlines, Strasshof, AustriaRogier Woltjer Linköping Institute of Technology, Linköping, SwedenNie Xiaofeng Nanyang Technological University, SingaporeJin-Ru Yen National Taiwan Ocean University, Keelung, Taiwan, ROCBeat Zimmermann Air Navigation Institute, Thun, Switzerland
U.S.A.
Robert I. Aceves St. Cloud State University, St. Cloud, MNMaheen M. Adamson Stanford/VA Aging Clinical Research Center, Palo Alto, CAVicki Ahlstrom FAA, William J. Hughes Technical Center, Atlantic City, NJAmy Alexander Aptima, Inc., Woburn, MA Steve Anderson St. Cloud State University, St. Cloud, MNRick Anglemyer SCSI, Colorado Springs, CODeak D. Arch Ohio University, Albany, OHAnthony R. Artino, Jr. Uniformed Services University, Bethesda, MDFrancis “Frank” Ayers Embry-Riddle Aeronautical University, Prescott, AZLarry Bailey FAA Academy, Oklahoma City, OKJack Barker Mach One Leadership, Miami, FLR. Kurt Barnhart Kansas State University, Salina, KS Robert Baron The Aviation Consulting Group, Myrtle Beach, SC Paul T. Bartone National Defense University, Ft. McNair, Washington, DCEllen Bass University of Virginia, Charlottesville, VAJ. Matthew Beaubien American Institutes for Research, Washington, DCJeffrey M. Beaubien Aptima, Inc., Woburn, MA Beth M. Beaudin-Seiler Western Michigan University, Battle Creek, MIWendy Beckman Middle Tennessee State University, Murfreesboro, TNSean Belcher NASA Ames Research Center, Moffett Field, CATheodore Beneigh Embry-Riddle Aeronautical University, Daytona Beach, FLDennis B Beringer Civil Aerospace Medical Institute, Oklahoma City, OK Robert O. Besco Professional Performance Improvement, Dallas, TX Aleta Best Department of Transportation, Washington, DC Kate Bleckley Civil Aerospace Medical Institute, Oklahoma City, OKJames P. Bliss Old Dominion University, Norfolk, VAErin E. Block-Bowen Purdue University, West Lafayette, IN Deborah Boehm-Davis George Mason University, Fairfax, VAPhilip Bos University of Central Missouri, Warrensburg, MOBrent Bowen Purdue University, W. Lafayette, IN Tim Brady Embry-Riddle Aeronautical University, Daytona Beach, FLJonathan Bricker University of Washington, Seattle, WA

Christopher R. Brinton Mosaic ATM, INC., Leesburg, VADana Broach Civil Aerospace Medical Institute, Oklahoma City, OKPhilip Budd Graduate Studies in Counseling, Bethany, OKJudith Bürki-Cohen Volpe National Transportation Systems Center, Cambridge, MAErnesto A. Bustamante University of Idaho, Moscow, IDJames N Butcher University of Minnesota, Minneapolis, MNPaul W. Buza Wuesthoff Medical Center, Melbourne, FLEvan Byrne National Transportation Safety Board, Washington, DCJohn H. Cain Florida Technology Institute, Melbourne, FLRaymond E. Cain, Jr. Florida Memorial University, Miami Gardens, FL John A. Caldwell Archinoetics, LLC, Honolulu, HI Lynn Caldwell Air Force Research Laboratory, Wright- Patterson AFB, OHWilliam Caldwell Southern Illinois University, Carbondale, ILKim Cardosi Volpe National Transportation Systems Center, Cambridge, MAThomas Q. Carney Purdue University, West Lafayette, INStephen M. Casner NASA Ames Research Center, Moffett Field, CAThomas R. Chidester Civil Aerospace Medical Institute, Oklahoma City, OK Robert H. Chisholm Support Systems Associates, Melbourne, FLAnna T. Cianciolo Command Performance Research, Inc., Champaign, ILDaniel W. Clark Critical Concepts Consulting, Olympia, WAMaria Consiglio NASA Langley Research Center, Hampton, VADavid Conway Southeastern Oklahoma State University, Durant, OKPaul A. Craig Middle Tennessee State University, Murfreesboro, TNJerry Crutchfield Civil Aerospace Medical Institute, Oklahoma City, OKThom Curtis University of Hawaii, Hilo, HI John Deaton Florida Institute of Technology, Melbourne, FLStephen Dedmon Embry-Riddle Aeronautical University, Daytona Beach, FLAsaf Degani NASA Ames Research Center, Moffett Field, CACarmen Delgado-Morales FAA Academy, Oklahoma City, OK Charles DeJohn Civil Aerospace Medical Institute, Oklahoma City, OK Chad Depperschmidt Oklahoma State University, Stillwater, OKJames DeVoll Office of Aerospace Medicine, Washington, DC Archie Dillard FAA National Headquarters, Washington, DCBrian G. Dillman Purdue University, West Lafayette, INKey Dismukes NASA Ames Research Center, Moffett Field, CARahul M. Dodhia Raven Analytics, Mountain View, CA Theresa A. Domagalski Western Carolina University, Cullowhee, NCNancy Dorighi NASA Ames Research Center, Moffett Field, CA Wayne Dornan Middle Tennessee State University, Murfreesboro, TND. Adrian Doss The University of West Alabama, Livingston, ALBoyd Falconer Russell Reynolds Associates, Chicago, IL Richard Fanjoy Purdue University, West Lafayette, INDouglas R. Farrow Federal Aviation Administration, Washington, DCJeffrey Forrest Metropolitan State College of Denver, Denver, COPaul M. Foster FAA Western-Pacific Regional Office, Lawndale, CAWai-Tat Fu University of Illinois, Savoy, ILKenneth H. Funk II Oregon State University, Corvallis, OR Peter C. Gardiner SCSI, Torrance, CA Kenneth Gardner FAA, Flight Standards, New Cumberland, PADevra L. Golbe Hunter College/CUNY, New York, NYA. F. Grandt Purdue University, West Lafayette, INMavis Green Utah Valley University, Provo, UTRegina A.Greenwood Nova Southeastern University, Fort Lauderdale-Davie, FLCarla A. Hackworth Civil Aerospace Medical Institute, Oklahoma City, OKMichele Halleran Embry-Riddle Aeronautical University, Daytona Beach, FL

Chris Hallman Great Circle Consulting, Inc., Newman, GASteven Hampton Embry-Riddle Aeronautical University, Daytona Beach, FLP. A. “Peter” Hancock University of Central Florida, Orlando, FL Jeffrey T. Hansberger George Mason University, Fairfax, VAFrederick D. Hansen Oklahoma State University - Tulsa, Tulsa, OKHernando Jimenez Georgia Institute of Technology, Atlanta, GARon A. Hess University of California, Davis, CAKevin High Western Michigan University, Battle Creek, MIJerry Higley FAA Academy, Oklahoma City, OKPatrick L. Hill University of Illinois at Urbana-Champaign, Champaign, ILAlan Hobbs NASA Ames Research Center, Moffett Field, CAJudy Holcomb FAA Academy, Oklahoma City, OKC.M. Holloway, NASA Langley Research Center, Hampton VAKent Holtorf Holtorf Medical Group, Torrance, CAWillem Homan Western Michigan University, Battle Creek, MIAmy Hoover Central Washington University, Ellensburg, WABruce Hoover Parks College, St. Louis University, St. Louis, MOTodd P. Hubbard Oklahoma State University, Stillwater, OK David R. Hunter Artis, LLC, Reston, VAPeter Hwoschinsky FAA National Headquarters, Washington, DC Kathi Ishimaru FAA, Northwest Mountain Regional Office, Renton, WAFrancine O. James Institutes for Behavior Resources, Inc. Baltimore, MDFlorian Jentsch University of Central Florida, Orlando, FLAlan W. Johnson Air Force Institute of Technology, Wright-Patterson AFB, OHJeffrey Johnson St. Cloud State University, St. Cloud, MNRobert Kaps Southern Illinois University, Carbondale, ILMerrill R. Karp Arizona State University, Mesa, AZKim Kenville University of North Dakota, Grand Forks, NDDavid King Nortwestern State University, Natchitoches, LADeann King FAA Academy, Oklahoma City, OK Raymond E. King Civil Aerospace Medical Institute, Oklahoma City, OKMike D. Kinney U.S. Dept of Energy, Natl Nuclear Security Admin. Las Vegas, NVWilliam Knecht Civil Aerospace Medical Institute, Oklahoma City, OKDavid A. Kolb Case Western Reserve University, Cleveland, OH Jefferson M. Koonce Technology Systems, Inc. Wiscasset, ME Bruce Kuhlmann FAA Academy, Oklahoma City, OKMary N. Kutz Oklahoma State University, Stillwater, OKFlorian Jentsch University of Central Florida, Orlando, FLSteven J. Landry Purdue University, West Lafayette, INJeff Lancaster Honeywell Aerospace Advanced Technology, Golden Valley, MNVictor LaSaxon The Boeing Company, Midwest City, OKJeffrey M. Lating Loyola University, Baltimore, MDDavid Lecraw Volpe Center, Cambridge, MATera D. Letzring Idaho State University, Pocatello, IDSuresh K. Lodha University of California, Santa Cruz, CALoukia Loukopoulos NASA Ames Research Center, Moffett Field, CAChien-tsung Lu Purdue University, W. Lafayette, INGary Luckenbaugh Lockheed Martin, Rockville, MDRebecca Lutte University of Nebraska at Omaha, Omaha, NENickolas D. Macchiarella Embry-Riddle Aeronautical University, Daytona Beach, FLDave MacDonald FAA Academy, Oklahoma City, OKMadhu S. Madhukar University of Tennessee, Knoxville, TNRichard L. Mangrum Kent State University, Kent, OHCarol Manning Civil Aerospace Medical Institute, Oklahoma City, OKRoderick “Rod” D. Margo Condon & Forsyth LLP, Los Angeles, CA

Steven Marks Oklahoma State University, Stillwater, OKLynne Martin NASA Ames Research Center, Moffett Field, CARoyce Ann Martin Bowling Green State University, Bowling Green, OHLuigi Martinelli Princeton University, Princeton, NJPatrick R. Mattson St. Cloud State University, St. Cloud, MNThomas C. Mawhinney University of Detroit Mercy, Detroit, MICeleste Mayer North Carolina State University, Raleigh, NCRaymon M. McAdaragh FAA, Hampton, VAMichael E. McCauley Naval Postgraduate School, Monterey, CAKathleen L. McFadden Northern Illinois University, DeKalb, IL Ole J. Mengshoel NASA Ames Research Center, Moffett Field, CARussell Mills FAA National Headquarters, Washington DCHarry Minniear Indiana State University, Terre Haute, INMarjo Mitsutomi University of Redlands, Redlands, CARichard H. Mogford NASA Ames Research Center, Moffett Field, CA John Morey Dynamics Research Corporation, Andover, MA Kathleen Mosier San Francisco State University, San Francisco, CAVahid Motevalli The George Washington University, Ashburn, VA Martin Mumenthaler Stanford University, Redwood City, CA Edward F. Murphy, Jr Embry Riddle Aeronautical University, Vacaville, CATom Nesthus Civil Aerospace Medical Institute, Oklahoma City, OKMary Niemczyk Arizona State University, Mesa, AZMark I. Nikolic The Boeing Company, Seattle, WAMichael S. Nolan Purdue University, West Lafayette, INGary J. Northam Embry-Riddle Aeronautical University, Prescott, AZRobert P. Olislagers, Arapahoe County Public Airport Authority, Englewood, CO Jim Oppermann Ohio State University, Columbus, OHKorhan Oyman Florida Institute of Technology, Melbourne, FLRaja Parasuraman George Mason University, Fairfax, VABonny Parke NASA Ames Research Center, Moffett Field, CAAllen J. Parmet Midwest Occupational Medicine, Kansas City, MO Harold Pashler University of California, San Diego, CAManoj Patankar Parks College, St. Louis University, St. Louis, MODonald A. Petrin Purdue University, West Lafayette, IN James J. Picano Mind Quest, LLC, Suisun, CAJean Potvin Saint Louis University, St. Louis, MOJulia Pounds Civil Aerospace Medical Institute, Oklahoma City, OK Thomas Prevot NASA Ames Research Center, Moffett Field, CARoni Prinzo Civil Aerospace Medical Institute, Oklahoma City, OK Michael D. Proctor University of Central Florida, Orlando, FLEdward Pugacz FAA, William J. Hughes Technical Center, Atlantic City, NJ Yandong Qiang Johns Hopkins University, Baltimore, MD Stephen M. Quilty Bowling Green State University, Bowling Green, OHWilliam B. Rankin II University of Central Missouri, Warrensburg, MOEsa M. Rantanen Rochester Institute of Technology, Rochester, NYWilliam G. Rantz Western Michigan University, Battle Creek, MI Raj M. Ratwani George Mason University, Fairfax, VAKeith Rayner University of California, San Diego, CADawna L. Rhoades Embry Riddle Aeronautical University, Daytona Beach, FLStephen Rice New Mexico State University, Las Cruces, NMRobert Ripley Auburn University, Auburn, ALVladimir Risukhin Western Michigan University, Kalamazoo, MICharles L. Robertson University of North Dakota, Grand Forks, NDBonnie L. Rogers Wichita State University, Wichita, KSEricka Rovira U. S. Military Academy, West Point, NY

Nicholas G. Rupp East Carolina University, Greenville NCJason J. Saleem Indiana Univ.-Purdue University, Indianapolis INChristian M. Salmon The George Washington University, Ashburn VASteven M. Samuels US Air Force Academy, Colorado Springs, CONadine Sarter University of Michigan, Ann Arbor, MI Ian Savage Northwestern University, Evanston, ILStewart W. Schreckengast Purdue University, West Lafayette, INDavid Schroeder Civil Aerospace Medical Institute, Oklahoma City, OKPete Schumacher University of North Dakota, Grand Forks, NDGregory L. Schwab Indiana State University, Terre Haute, INScott Shappell Clemson University, Clemson, SCJ. Anthony Sharp Elizabeth City State University, Elizabeth City, NCJohn W. Sheremeta, Jr. American Airlines, Lake Ronkonkoma, NY Mark A. Sherman Farmingdale State College, Farmingdale, NYLance Sherry George Mason University, Fairfax, VAL. James Smart Miami University, Oxford, OHGuy M. Smith Embry-Riddle Aeronautical University, Daytona Beach, FLKenneth Sperry The Boeing Company, Midwest City, OKJohn E. Stewart II U.S. Army Research Institute, Fort Rucker, ALEarl S. Stein William J. Hughes Technical Center, Atlantic City, NJThomas A. Stoffregen, University of Minnesota, Minneapolis, MNAlan J. Stolzer Embry-Riddle Aeronautical University, Daytona Beach, FLAllan Storm US Air Force, Arlington, VA Judith B. Strother Florida Institute of Technology, Melbourne, FLCraig Gerald Stroup American West Airlines, Phoenix, AZJoy L. Taylor Stanford/VA Aging Clinical Research Center, Palo Alto, CATerry von Thaden University of Illinois, Savoy, ILJeffrey M Thompson University of Minnesota, Minneapolis, MNPamela S. Tsang Wright State University, Dayton, OHJudith Foss Van Zante NASA Glenn Research Center, Cleveland, OHStephen Véronneau CAMI, Oklahoma City, OKKen Wallston Vanderbilt University, Nashville, TNRon Ward FAA Academy, Oklahoma City, OKCarl Washburn Greenville Technical College, Greenville, SCWilliam E. Weiss MITRE Corporation, McLean, Virginia Thomas Weitzel Embry-Riddle Aeronautical University, Daytona Beach, FLVictor Welzant International Critical Incident Stress Foundation, Inc. Ellicott City, MDMichael Wetmore Central Missouri State University, Great Falls, MTChristopher Wickens University of Illinois Urbana-Champaign, Urbana, ILMichael Wiggins Embry-Riddle Aeronautical University, Daytona Beach, FLCraig Williams Fort Wayne-Allen County Airport Authority, Fort Wayne, INKevin Williams Civil Aerospace Medical Institute, Oklahoma City, OKDale Wilson Central Washington University, Ellensburg, WADonna Forsyth Wilt Florida Institute of Technology, Melbourne, FLPeter Wolfe Professional Aviation Board of Certification, Washington, DCShawn R. Wolfe NASA Ames Research Center, Moffett Field, CARichard D. Wright Volpe National Transportation Systems Center, Weston, MAXidong Xu Boeing Research & Technology (BR&T), Seattle, WA John Young Purdue University, West Lafayette, IN
PHILOSOPHY STATEMENT
1 Cornelius Lanczos, a mathematician working in the field of applied analysis, expressed the history of mathematics in three phases:
1) A given physical situation is translated into the realm of numbers,
2) By purely formal operations with these numbers certain mathematical results are obtained, [and]
3) These results are translated back into the world of physical reality (1988, p. 1).1
Formal papers, in subjects related to aviation, roughly follow the same course. However, there appears to be a weakness in aviation research, that being the omission of the third phase.
It is not good enough that conclusions are drawn, if those conclusions fail to improve the system ob-served. Clearly, the observed have a say in implementing the conclusions of research, but their failure to implement the conclusions drawn by the researcher may be more indicative of a lack of understanding than a lack of desire. Researchers tend to peer into complex systems as through a soda straw, forming formal opinions on the finite without understanding the complete system. Industry, ever mindful of the complete system, may find research irrelevant, because it makes much to do about nothing.
The editorial staff, to include those listed as consulting editors, is committed to the improvement of all individuals within the aviation community. We seek to enhance existing systems bearing in mind that small improvements must not upset the delicate balance between too little and too much help. We also seek to promote safety, not by lip service, but by demonstration in how we execute our studies and how we report our findings.
We feel that the best way to translate results back to the physical world is to incorporate the viewpoints of people around the globe. Without the influence of a worldwide community, we deny the significance of diversity, and ignore the perspectives of gifted scientists from different countries. It is our hope that each reader will feel the same.
1 Lanczos, C. (1988). Applied Analysis. Mineola, NY: Dover Publications, Inc.

EDITOR’S NOTES
To support the FAA's efforts to reduce costs, the IJAAS will only be available from our web site at http://www.faa.gov/about/office_org/headquar-ters_offices/arc/programs/academy/journal/.
Papers
In our lead article, Role Playing in Flight In-structor Training: How effective is it?, Crow, Niem-czyk, and Andrews investigate the “role-playing” method of training. This research suggests that the method in which flight instructors are trained pro-duces behaviors that do not translate to real-world instruction, therefore potentially hindering the de-velopment of effective flight instructors.
Bowen, Sabin, and Patankar assess indicators of behavior prior to and following an MRM training program in Aviation Maintenance Human Factors in a Systems Context: Implications for Training. Structural equation modeling procedures found evidence to support using a systems framework to develop and assess safety training in industry.
In Safety Culture: The Perception of Taiwan’s Aviation Leaders, Lu, Young, and Schreckengast's study aims to discover the status of safety culture after the initiation of SMS in Taiwan. A list of recommendations is provided for the Civil Aero-nautics Administration of the Republic of China (CAAROC) to promote airport safety. This meth-odology would be applicable to other aviation or-ganizations as an initial indicator of their baseline safety culture.
Models created for the FAA to estimate total an-nual operations by general aviation (GA) airports have been recreated and examined by Black and Chimka in Re-estimating and Remodeling General Aviation Operations. Models were originally es-timated to predict the future size of airports, but research would go toward detection of unusual GA activity that might be due to a homeland security threat.
In Fanjoy and Gao's study, Learning Styles of Chinese Aviation Students, researchers admin-
istered the Kolb Learning Style Inventory (LSI) and a short biographical survey to 293 students. An analysis of the data suggest that over a four-year college curriculum learning style shifts from predominately assimilator and converger learning styles towards diverger and assimilator learning styles, These insights may be useful in the develop-ment of curricula for western flight training institu-tions tasked with the preparation of students from dissimilar cultures.
In An Analysis of Statistical Power in Avia-tion Research, Ison sought to evaluate the statisti-cal power of aviation research published in peer-reviewed journals. Guidance on ways researchers can improve power and/or reduce sample size re-quirements are provided. Suggestions for future re-search and policies are also provided.
Young and Molesworth's study, The Effects of Caffeine on Learning: A Pilot’s Perspective, inves-tigates whether caffeine can facilitate the rate at which individuals acquire and apply skills. These findings are discussed from a theoretical and op-erational perspective.
KC


International Journal of Applied Aviation Studies | xv
Volume 11, Number 1 2011
Papers
REVIEW PROCESS iiiPOLICY AND DISCLAIMERS ivPUBLICATION AND EDITORIAL STAFF vPHILOSOPHY STATEMENT xiiEDITOR’S NOTES xiii
Role Playing in Flight Instructor Training: How effective is it?
Brent Crow, Mary Niemczyk, Dee Andrews, and Patricia Fitzgerald 1
Aviation Maintenance Human Factors in a Systems Context: Implications for Training
Erin E. Bowen, Edward J. Sabin, and Manoj S. Patankar 13
Safety Culture: The Perception of Taiwan’s Aviation Leaders
Chien-tsung Lu, John Young, Stewart Schreckengast and Harry Chen 27
Re-estimating and Remodeling General AviationOperations
Ryan Black and Justin R. Chimka 47
Learning Styles of Chinese Aviation StudentsRichard O. Fanjoy and Yi Gao 57
An Analysis of Statistical Power in Aviation ResearchDavid Carl Ison 67
The Effects of Caffeine on Learning: A Pilot’s Perspective
Ricky Young and Brett R. C. Molesworth 85
International Journal of Applied Aviation Studies
A Publication
of the FAA
Academy
Oklahoma City,
Oklahoma
Delivering
Tomorrow's
Training Today

xvi | Table of Contents

International Journal of Applied Aviation Studies | 1
Role Playing in Flight Instructor Training: How
effective is it?
Abstract
Flight instructor training has remained largely unchanged since the beginning of aviation. The current method of training mostly involves the flight instructor trainee “role-playing” as the in-structor to their instructor who is “role-playing” as the student. An analysis of the behaviors of flight instructor instrument trainees exhibited while teaching their peers (other classmates) in-dicates that the behaviors are different than those used when teaching an actual instrument student. This research suggests that the method in which flight instructors are trained produces behaviors that do not translate to real-world instruction, therefore potentially hindering the development of effective flight instructors.
Role Playing in Flight Instructor Training: How effective is it?
Flight Instructors are as vital to aviation as teach-ers are to our educational system, providing training to the next generation of pilots. Rod Machado is a flight instructor with over 8,000 hours of aviation instruction experience. He is the Aircraft Own-ers and Pilots Association (AOPA) national flight instructor spokesman, as well as a National Acci-dent Prevention counselor appointed by the Fed-eral Aviation Administration (FAA) in Washington D.C. In a 2005 interview he was asked, “What is the most important thing for a student pilot to consider when they seek a flight instructor?” His answer was that the student must find a “good one” (Machado, 2005). Furthermore, Machado stated that finding the right instructor is so important that it is better to “spend three years looking for a good one, rather than spend three minutes with a bad one” (Machado, 2005). His statements seem to in-dicate that there are substantial differences among the many certificated flight instructors in the flight training industry.
Flight instructor training has remained largely unchanged since the beginning of aviation and is much more of an art form than a science (Wilt, Cain, & Antalffy, 2001). In a study focusing on flight instruction in Canada and Australia, Henley found that “despite the flight instructor’s key role in flight training, very little research has assessed the quality of civil flight instructor training and estab-
Brent Crow1,* Mary Niemczyk1, 1Arizona State University
*1402 E. Pryor RdSan Tan Valley, AZ 85140480-703-6096crowpbj[at]yahoo.com
Dee Andrews2, & Patricia Fitzgerald2
2Air Force Research Laboratory

2 |
lished ways of maximizing the instructor’s effec-tiveness in flight training” (Henley, 1991, p. 320). Although this research is centered in Australia and Canada, there is evidence of the same problems oc-curring in the United States (Wright, 2003; Wilt, et al., 2001). According to the FAA, there is an issue with whether the existing guidelines, standards, and curriculum are being used effectively or at all by the training community (Wright, 2003). This confirms the need to investigate the methods with which flight instructors are trained in the United States. Many issues have surfaced through scat-tered research projects regarding flight instructor training such as teaching-to-the-test, poor instruc-tors, inadequate examinations, and role playing (Henley, 1995; Wright, 2003).
While role-playing has been shown to be an effective and engaging tool in group instruction, there is very little evidence to support its use in the cockpit. Flight instructor trainees will typically role-play as an instructor, and their instructor will role-play as a student. This is done because the nature of the practical exam is nearly a role-play for the Designated Pilot Examiner (Henley, 1995). The practical exam for flight instructors consists of demonstrating to the Designated Pilot Examiner that the pilot applicant can teach while flying. The pilot applicant must teach certain tasks to the ex-aminer who role-plays as the student. Results of a survey by Henley (1995) suggest that this method of training may not be as effective as previously thought, therefore, a further look at the use of role-playing in flight instructor training is necessary. An analysis of the behaviors of instructor trainees while role-playing as an instructor, toward either an actual student or a person who is role-playing as a student, may shed light on this issue.
Scope
This investigation was an observational study in which the behaviors of flight instructor instrument trainees were analyzed to determine if there was a significant difference on trainee behaviors depend-ing on whether or not the student was a classmate (a peer instrument instructor trainee) or an actual
instrument flight student who was unfamiliar with the material.
Assumptions
This research assumed that the instructor train-ees all had the same level of training, and assumed the same with the actual instrument students. It also assumed that the behaviors of the student instruc-tors while instructing in a flight simulator could be generalized to flight training in an aircraft.
Literature Review
There is very little research available on flight instructor training. Researchers have been examin-ing many specific topics to improve flight training for students such as stress (Henley, 1991), learn-ing theories (Bye & Henley, 2003; Henley & Bye, 2003; Hunt, 2003; Karp, Turney, & McCurry, 1999; Moore, Lehrer, & Telfer, 1997; Moore, Lehrer, & Telfer, 2001; Wilt, et al., 2001), evaluation (Henley, 1995; Wright, 2003), and methods of debriefing (Blickensderfer, Schumacher, & Summers, 2007) but very little has been done in improving flight instructor training. This literature review provides information on the competencies flight instructors must demonstrate in order to be certified in the United States followed by a review of current re-search relating to flight instructor training.
Flight Instructor Competence
Although the aviation industry has changed sig-nificantly in the past 60 years, the framework for licensing pilots has changed very little since the 1940’s (Hunt, 2001). Currently, flight instructor competence is measured by the FAA which regu-lates the aviation industry in the United States. The Federal Aviation Regulations 14 CFR Part 61.181 outlines eligibility, aeronautical knowledge, and flight proficiency requirements for flight instructor applicants (FAA, 2011). It is important to note that flight instructor applicants must pass two written exams, one on the fundamentals of instructing and the other on general flight knowledge, as well as
Training Effective Flight Instructors

International Journal of Applied Aviation Studies | 3
pass a practical exam. The written tests are mul-tiple-choice and are available commercially to the public, which allows most applicants to memorize the correct answers (Casner, Jones & Irani, 2004). Nevertheless, flight instructor applicants are quizzed by a Designated Pilot Examiner during the oral exam portion of their practical test. The prac-tical exam is similar to a driver's test at the Depart-ment of Motor Vehicles, where an examiner rides along to determine if an individual is competent to receive his or her driver's license. Similarly, in the practical exam, the Designated Pilot Examiner has the responsibility for determining that the ap-plicant meets the acceptable standards of teaching ability, knowledge, and skill required in each of the tasks found in the Practical Test Standards (PTS) (FAA, 2006). The PTS outlines specific tasks and completion standards the applicant must perform in order to pass the practical test. Most of the tasks in the flight instructor PTS require that the appli-cant demonstrate instructional knowledge by being able to use the appropriate reference to provide the correlative level of knowledge of a subject, proce-dure, or maneuver (FAA, 2006).
In the Fundamentals of Instruction handbook published by the FAA, there are four levels of learning: rote, understanding, application, and cor-relation (FAA, 2008). Rote knowledge is simply being able to remember key items; whereas in the understanding level of learning, the student is able to comprehend the meaning of what they are re-membering or doing. When the student reaches the application level of learning he or she is able to apply knowledge that has been learned. Finally, when the student is able to associate what has been learned, understood, and applied with previous or subsequent learning, he or she has reached the cor-relative level of knowledge.
The applicant must also follow the recommend-ed teaching procedures and techniques explained in the Aviation Instructors Handbook (FAA, 2008). This handbook briefly outlines psychological ma-terial relating to learning and teaching. Most in-structor applicants come prepared to the practical test with a lesson plan outlining the objectives, elements, and completion standards for the lesson they will teach their Designated Pilot Examiner.
The applicant must satisfactorily pass the practical test on the areas of operation listed in 61.187(b) of the Federal Aviation Regulations and must dem-onstrate instructional knowledge in the elements and common errors of a maneuver or procedure (FAA, 2006).
Current Training Issues
One of the reasons the examining method de-scribed above may have hindered the training of the flight instructor population could be because flight instructors have been teaching to the test (Wright, 2003). Instructors typically know what examiners are looking for and often teach their students to simply pass the practical test, denying them the skills, knowledge, and attitudes neces-sary for daily flight (Hunt, 1997; Lintern, 1995; Moore, Lehrer, & Telfer, 1997). A look at Hen-ley’s research in Australia and Canada shows how instructors’ behaviors impaired their students’ ability to learn because they did not understand the factors that affect learning (Henley & Bye, 2003). Perhaps instructors should be teaching their in-structor applicants how to apply the fundamentals of instruction in a cockpit setting with a student who is new to the content being taught.
Many flight instructors simply mimic their past flight instructors, employing instructional be-haviors that they found helpful to them as a student and avoiding instructional behaviors they didn’t like (Henley, 1995). Unfortunately, behaviors in-structors found helpful when they were a student may not be beneficial to their particular student who may come from a different culture, gender, or learning style (Turney, Karp, Niemczyk, Green, Sitler & Bishop, 2001). In this example, instruc-tors are employing instructional behaviors without considering different learning styles (Moore, Leh-rer, & Telfer, 2001). Instruction at a deep level of understanding must be tailored to the diverse needs of any student (Henley & Bye, 2003).
Researchers have developed a multitude of learning style research studies which show that a student learns best when the instructor adapts their method of instruction to meet their learning style

4 |
needs (Bye & Henley, 2003; Henley & Bye, 2003; Karp, et al., 1999; Turney, et al., 2001). In avia-tion education, much of the literature focuses on using more of an androgogical approach to training adults rather than pedagogical. Androgogy is the belief that learners are of the age (i.e. adult) where they are self-motivated and self-regulated learners, whereas in pedagogy the students’ learning must be regulated and guided by the educator similar to educating children (Bye & Henley, 2003; Hunt, 2003; Karp, et al., 1999; Knowles, 1980; Moore, Lehrer, & Telfer, 2001; Niemczyk & Savenye, 2005; Thatcher, 1997; Wilt, et al., 2001).
Another hindrance to the training of flight in-structors may reside with the validity of the prac-tical test itself. Determination of the three main aspects of validity, content, criterion, and construct is critical to every assessment measure. Content validity assesses whether the test covers the ac-tual content necessary for the job (Blickensderfer, et al., 2007). Criterion validity assesses whether the measurement of the knowledge or skills can be generalized to actual job performance (Blick-ensderfer, et al., 2007). Both of these constitute two aspects of construct validity that are necessary for a test to yield meaning (Blickensderfer, et al., 2007; Messick, 1995).
Most of the maneuvers required on the practical test lack content and/or criterion validity (Blick-ensderfer, et al., 2007). The decision of whether or not an applicant passes the practical exam is at the discretion of the Designated Pilot Examiner who observes the applicant. Researchers have deter-mined that examiners have widely varying views of competency (Henley, 1995; Hunt, 2001). A sur-vey of 195 flight instructors and 40 examiners on the validity of the practical test for flight instructor applicants found that over 65 percent of the flight instructors in Canada, and over 85 percent of the flight instructors in Australia said that the practical test did not provide a reliable and valid measure of their competence as flight instructors (Henley, 1995). Most of those individuals surveyed indi-cated that the practical test was focused on pleas-ing the whims and biases of the examiners or stated that the value of the test depended on the examiner
(Henley, 1995). Even though these surveys were gathered through interviews in Canada and Aus-tralia, flight instructors in the United States share a very similar training process and may face the same problems (Wright, 2003; Blickensderfer, et al., 2007).
There are several different methods that have been used to measure flight instructor competence, from paper and pencil tests to surveys (Krumm, 1954). In December, 1954, Richard L. Krumm re-leased the findings of his investigation measuring the competency of flight instructors. He used pa-per and pencil questionnaires to assess and survey instructors, supervisors, and students on quality flight instruction. Based on the results of his inves-tigation, Krumm (1954) determined that his use of paper and pencil questionnaires did not accurately reveal flight instructor competencies. Henley and Bye (2003) also surveyed flight instructors, exam-iners, and students on their experiences during avi-ation instruction. The survey results revealed 40 percent of student pilots reported that the instructor was the major source of psychological stress during flight training (Henley, 2003). At the International Symposium on Aviation Psychology in Dayton, Ohio, Okdeh presented research on instructor and student behaviors while instructing in an airplane and a simulator (Okdeh, Bradshaw, Brou, & Do-ane, 2007). He expected the instructor behavior to synchronize with Graesser, Person, and Magliano’s (1995) five-step model for effective one-on-one in-struction, when in fact this model was non-exis-tent. This model, also called the “tutoring frame,” follows the following steps:
1. Tutor asks an initiating question
2. Student provides and answer
3. Tutor gives feedback on an answer
4. Tutor improves quality of answer through collaborative conversation
5. Tutor assesses students understanding of the answer. (Okdeh, et al. 2007)
In the first step the tutor asks an initiating ques-tion in order to narrow the focus of the content. In step two the student provides an answer which
Training Effective Flight Instructors
International Journal of Applied Aviation Studies | 5
helps the instructor gauge the student’s comprehen-sion of the problem. The instructor can then ask fol-low up questions and suggestions depending on the student’s response to the question. For example, if the instructor asks why lift decreases in a turn, and the student incorrectly responds with “because angle of attack increases,” the instructor might say, “remember what happens to the horizontal compo-nent of lift in a turn?” If the student is still strug-gling, the instructor may continue probing the stu-dent with questions in order to assess gaps in his or her knowledge. Based on the student’s response, the instructor will provide the necessary feedback in order to assist the student in acquiring the neces-sary knowledge in step three.
In step four, the student and instructor enter a collaborative conversation to further enhance the student’s understanding of the topic. Then, in the final step, the instructor determines whether the stu-dent has learned the material through questioning. Okdeh’s observations discovered that ninety-eight percent of the utterances were from the instructor and only two percent were from the student. Fur-ther examination revealed that the instructors never asked a question. Okdeh’s conclusion found that Graesser's tutoring model may not apply to flight instruction and that flight instructors received their feedback from the aircraft flight instruments rather than the student. This type of behavior could be the result of poor training on how to properly con-duct one-on-one instruction.
Another hindrance to the training of flight in-structors lies with role-playing, which when used correctly can be a powerful instructional and learn-ing tool. Most literature on role-playing describes its use in a classroom setting where students break into groups or work as a class to role-play (Billings & Halstead, 2005). There is no empirical research, however, that indicates role-playing is effective in aviation flight training where the instructor takes part in the role-play activity rather than acting as a facilitator. Flight instructors use role-playing to a large extent by pretending to be a student while their trainee pretends to be a flight instructor during training. Then, during the practical exam the Des-ignated Pilot Examiner role-plays as their student.
Role playing in this context is confusing, unreal-istic, and lacks flexibility and is understood by the FAA as a problem in the United States (Henley, 1995; Wright, 2003).
When an instructor or examiner is role-playing, guiding the instructor trainee with questions of-tentimes makes the applicant feel elementary and the questions artificial (Henley, 1995). Many in-structors from Henley’s research indicated that role-playing does not accurately portray the actual quality or ability of the instructor (Henley, 1995). Flight instructors should be cautious in regards to generalizing the results of role-playing from other fields, such as elementary education, clinical psychology, and medicine since the instructor in these fields typically do not participate in the role-playing exercise but serve as a facilitator (Kraus, 2008; Penny, 2008; Waters, 1992; ). Because of these issues found in flight instruction, it was nec-essary to conduct an investigation that could aid in the improvement in flight instructor training. This research, therefore, focused on the effect that role-playing may have on the behaviors exhibited by the flight instrument instructor trainee. The re-searchers hypothesized that the orientation of the student, whether he or she is an actual flight in-strument student or a fellow flight instrument in-structor candidate, will make a difference on the flight instructor trainee’s behavior.
Methodology
This study consisted of observing the behav-iors of student flight instructors while instructing actual students versus the behaviors used while instructing their peers. This study included video-recording student pilots while flying on an ELITE PI-126 Personal Computer Personal Computer-Aided Training Device (PCATD). The instruc-tional sessions were coded by watching the video and recording observed behaviors using Noldus Observer XT with keystrokes on a laptop. This program has been used in a previous study where researchers coded instructor behaviors in order to look for patterns of behavior (Fitzgerald, An-drews, Crow, Karp, & Anderson, 2008).

6 |
Participants
The instructors-in-training held a commercial certificate with an instrument rating and were working toward obtaining their Certified Flight Instructor (CFI) certificate. These instructors-in-training instructed either students or peers at the discretion of the course instructor. The students were aware they were being recorded for the pur-poses of this investigation. Consent forms were signed by all participants.
Instructional Sessions
The class sessions that were observed were part of a structured class that the researcher was granted permission to attend and observe. It was not possible for the researcher to modify any of the variables in this study other than when to re-cord and when not to record as the class was solely under the classroom instructor’s control. During a class period, an instructor trainee taught a les-son on an instrument skill such as a hold, instru-ment approach, or similar skill at the direction of the course instructor. Each lesson lasted about 25 minutes and included a five minute brief and a five minute debrief period.
Only the actual in-flight instruction was re-corded and subsequently coded. The study was conducted over two consecutive semesters dur-ing a Certified Flight Instructor Instrument (CFII) ground school. Fifty-two sessions of instructor trainees were observed. Thirty-seven of these sessions were instructor trainees teaching actual instrument students, and 15 were instructor train-ees teaching a classmate who was role-playing as a student. Peer students were not given any guidance by the course instructor for role-playing other than to pretend they were a beginning instru-ment student.
Behavior Codes
A set of essential instructor skills was devel-oped based on instructor competencies as defined by the International Board of Standards for Train-
Training Effective Flight Instructors
ing, Performance and Instruction (IBSTPI) during previous research (Fitzgerald et al., 2008; Klein, Spector, Grabowski, & de la Teja, 2004). IBSTPI gathered many different instructors from a variety of fields to develop a detailed description of the standards for instruction. The researchers gath-ered a list of observable behaviors that should be exhibited from instructors according to these stan-dards. These behaviors were modified to reflect behaviors specific to flight instruction that were identified through discussions with subject matter experts and through observation of flight instruc-tion on a simulator.
Finally, these behaviors have been defined in the Noldus Observer data collection software package for the coding of observations (See Table 1). The researcher used Noldus Observer XT to keep track of which behaviors were being exhib-ited during the simulator session. When viewing the recordings, the researcher would record these behaviors using keystrokes. For instance, if the instructor trainee asked a question the researcher would type “ip” for instructor pilot, and then “aq” for the behavior. The type of behavior in this case, “asks a question,” would be recorded as occurring at that particular time by the instructor.
Data Analysis and Results
Behavioral measurements are in rate per minute (RPM) because the simulator sessions are not all the same length. A multivariate analysis of vari-ance (MANOVA) was conducted with a 95 per-cent confidence interval. The MANOVA between the group of instructors who taught an actual stu-dent versus the group of instructors that taught a peer student revealed that the following behaviors were significantly different in their RPM of oc-currence: provides positive feedback, F(1)=4.863, p=0.032; clarifies, F(1)=10.125, p=0.003; provide direct, F(6.017), p=0.018; and reduce workload, F(1)=8.777, p=0.005. Overall, the two groups were significantly different, F(9,42)=3.220, p=0.005, R2=0.408 (See Table 2). Box’s Test to evaluate the variance and covariance among the dependent variables was significant, F(45, 2515.134)=1.633,

International Journal of Applied Aviation Studies | 7
p=0.005. This is due to the unequal sample size between the two groups which was uncontrollable by the researcher.
Descriptive statistics revealed the following top occurring behaviors for each group were different. The top three occurring behaviors for the group in-structing actual students were: provide direct (1.13 rate of occurrence per minute), direct instruction (1.08), and asks a question (0.53). The top three
occurring behaviors for the group instructing their peers were: direct instruction (1.10), provide direct (0.82), and reduce workload (0.61). See Tables 3 and 4 for descriptive statistics for each group. Table 3 shows the descriptive statistics in RPMs for the instructors who were teaching actual stu-dents. Table 4 shows the descriptive statistics for
Table 1.
Instructor Behavior Descriptions
Behavior Description
Acknowledgement Instructor makes a brief statement like “uh huh,” “Okay,” etc.
Responds to a question Instructor responds to a student question.
Asks a question Instructor asks a question.
Explains task Instructor explains an upcoming task.
Reduce workload Instructor configures something on the panel for the student.
Direct Instruct Instructor says a true statement such as, “we are over the airport,” “You’re heading 320,” etc.
Provide direct Instructor gives a command such as “turn to a heading of 320.”
Clarifies Instructor recognizes an area where a student seems weak and elaborates
Provides positive feedback Instructor gives positive feedback such as “great job on maintaining your altitude.”
Table 2.
Multivariate Analysis of Variance (MANOVA) on type of student
Source Value df F p
Type of student 0.408 9 3.220 0.005

8 | Training Effective Flight Instructors
Table 3.
Rate Per Minute (RPM) Instructor Behaviors for All 37 Actual Student Sessions
Behavior Average Minimum Maximum StandardDeviation
Acknowledgement 0.22 0.00 0.97 0.23
Responds to question 0.40 0.00 1.22 0.30
Asks a question 0.53 0.00 1.39 0.45
Explains task 0.20 0.00 0.57 0.19
Reduce workload 0.25 0.00 1.06 0.24
Direct instruct 1.08 0.34 2.37 0.49
Provide direct 1.13 0.11 2.16 0.53
Clarifies 0.13 0.00 0.39 0.12
Provide positive feedback 0.33 0.00 1.21 0.30
Table 4.
Rate Per Minute (RPM) Instructor Behaviors for All 15 Peer Student Sessions
Behavior Average Minimum MaximumStandard
DeviationAcknowledgement 0.17 0.00 0.48 0.17
Responds to question 0.37 0.00 1.13 0.35
Asks a question 0.35 0.00 0.68 0.20
Explains task 0.20 0.00 0.72 0.18
Reduce workload 0.61 0.00 1.74 0.48
Direct instruct 1.10 0.39 1.75 0.43
Provide direct 0.82 0.25 1.66 0.44
Clarifies 0.03 0.00 0.13 0.05
Provide positive feedback 0.16 0.00 0.58 0.16

International Journal of Applied Aviation Studies | 9
one instruction expected this behavior to be much more frequent, evidence that this research lends support to Okdeh’s et al. claim that Graesser’s tu-toring model may not apply to flight instruction. Overall, the group teaching the actual students used commands, true statements, and questions as their top three behaviors for instruction.
The group teaching their peers exhibited a dif-ferent order of behaviors. The most frequently occurring behavior was “direct instruct,” where the instructor shared a truism. The second most frequent behavior was “provide direct,” where the instructor gave a command, and the third most frequent behavior was “reduce workload” where the instructor did something on the console for the student. An example of reducing the student’s workload could be putting in frequencies for the student into the avionics or changing their heading bug. Overall, the top three behaviors exhibited by the instructor were true statements, commands, and reducing the workload for the student. It ap-pears that when compared to the group teaching actual students, this group worked more as crew-members than an example of instruction. The in-structor seemed to make general true statements regarding the aircrafts’ status in order to keep the crew on the same page, giving commands when necessary, and then aiding to reduce the workload when necessary.
The group of instructors that taught actual students seemed to give commands to direct the student, use true statements to guide their think-ing, and then ask questions to probe the students understanding. It is important to recognize these differences because instructor trainees are being trained in a role-playing environment similar to the instructor group teaching their peers. Based on these findings, it may be beneficial to modify the training environment since it appears to change their behavior.
Conclusion
In order to train flight instructors in a more re-alistic environment, it may be necessary to utilize a three person training structure consisting of a
the instructors who were teaching peers who were role-playing as students.
Discussion
The results seem to indicate that there was a statistical difference in the behaviors the instruc-tor used when teaching an actual student or a peer. A significantly different frequency of behaviors was observed when the instructor was teaching someone who was role-playing as a student. This frequency changed when they began instructing a student who was not role-playing. Recall that in-structor applicants are trained and examined in a role-play environment. After receiving their cer-tificate they begin instructing a real student. Since the behaviors exhibited in a role-play environment seem to be different than those when instructing a real student, it is questionable how well they may be prepared to train in this environment.
The instructor trainee’s behavior changed de-pending on whether their student was an actual student or a role-playing peer. Perhaps they were changing their instruction in order to meet the needs of a diverse student. If this is the case, however, it would be expected that they would use these same techniques when instructing someone who is role-playing. The data seems to indicate that the role-playing environment may not be realistic, as Hen-ley’s (1995) surveys have shown. A role-playing peer, examiner, or instructor may not behave like a real student causing the behaviors of the instructor to be different than if a real student were present.
Another interesting result of the investigation was the top three behaviors for each group. The most frequently occurring behavior for the group that instructed actual students was “provides di-rect.” This is a commanding behavior, where the instructor was telling the student to do some-thing. The other two top occurring behaviors for this group were “direct instruct” and “asks a ques-tion.” Direct instruction was any truism stated by the instructor such as, “We are over the VOR,” or “You are descending at 200 feet per minute.” Ask-ing a question was the third most popular behav-ior exhibited by this group. Okdeh’s et al. (2007) research on Graesser’s model of effective one-on-

10 |
behavior. Since flight instructors use role-play to train future instructors, it may be beneficial to fur-ther educate them on more effective techniques for applying role-play in the aviation context.
In conclusion, the results of statistical analyses revealed a significant difference in the behaviors of instructors depending on whether they taught an actual student or a peer who was role-playing as a student. The reason for this behavioral difference is not clearly evident from this research, but prior research from the industry indicates role-playing may be being applied in the aviation setting im-properly. It is suggested that a three person train-ing team consisting of a CFI, instructor trainee, and a student be utilized. Suggestions for further research include taking this type of research from the simulator to the cockpit, as well as observing expert flight instructor behaviors.
References
Billings, D.M., & Halstead, J.A. (2005). Teaching in nursing: A guide for faculty (2nd ed.). St. Louis, MO: Elsevier.
Blickensderfer, E. L., Schumacher, P., & Summers, M. (2007). Learner centered debriefing in gen-eral aviation training: Questions from the field and answers from research. In R. Jensen (Ed.), Proceedings of the 14th International Sympo-sium on Aviation Psychology (pp. 45-50). Day-ton, OH.
Bye, J., & Henley, I. (2003). Learning theories and their application to aviation education. In I. Henley (Ed.), Aviation Education and Train-ing. Hampshire, England: Ashgate Publishing Limited.
Casner, S. M., & Jones, K. M., & Irani, H. (2004). FAA pilot knowledge tests: Learning or rote memorization? (Technical Report No. NASA/TM-2004-212814). Moffett Field, California: NASA Ames Research Center.
FAA. (2006). Flight Instructor Practical Test Stan-dards. FAA-S-8081-6C. U.S. Department of
Certified Flight Instructor (CFI), the instructor ap-plicant, and an actual student. In this scenario, the instructor applicant would be practicing instruc-tion on an actual student while being mentored by a CFI. This could create a much more realistic training environment for the instructor applicant. A notion of a three person training structure was suggested by many interviewees in Henley’s afore-mentioned research (Henley, 1995). An added benefit to this training structure would be that both students could split the costs of the instructor and the airplane or simulator. Not all training aircraft can accommodate three people, so compromises would have to be made. This training structure is not intended to be used for every lesson in the in-structor applicant’s training, due to the fact that the applicant would need to first develop their skills to the point where they could be ready for the chal-lenges of teaching an actual student.
Future Research
The next step in this line of research is to ob-serve flight instructors as they conduct flight training in an actual aircraft in order to determine whether these observed behavioral changes trans-late into the flight environment. Since this is where flight instruction primarily resides, further research is necessary to observe flight instructors in this set-ting.
Analysis into the interaction of the student and the instructor could also reveal positive and nega-tive techniques for aviation instruction. Focus groups could analyze instructional techniques and determine which were more effective. They could also determine those that were not effective or used improperly. Gold Seal flight instructors have a pass rate of eight out of ten students on practi-cal exams and are considered experts in their field. Their behaviors could be coded to determine what behavioral patterns they exhibit, and they could be surveyed to determine how their training was different than the population of non-Gold Seal in-structors. The behaviors of struggling instructor trainees could be compared to those of Gold Seal instructors to determine differences in instructional
Training Effective Flight Instructors
International Journal of Applied Aviation Studies | 11
Aviation Education and Training. Ashgate Publishing Limited. Hampshire, England.
Karp, R., Turney, M., & McCurry, W. (1999). Learning style theory and aviation education. Proceedings of the 10th International Sympo-sium on Aviation Psychology. Columbus, OH.
Klein, J.D., Spector J.M., Grabowski, B., & de la Teja, I. (2004). Instructor competencies: stan-dards for face-to-face, online, and blended set-tings. Greenwich, CT: Information Age Pub-lishing.
Knowles, M. S. (1980). The magic of contract learning. Training and Development Journal. June. pp. 76-78.
Kraus, R. (2008). You must participate: violating research ethical principles through role-play. College Teaching. Summer, 2008.
Krumm, R. L. (1954). The development of a mea-sure of pilot instructor proficiency based on the critical requirements of the instructors job. Air Force Personnel and Training Research Center. Air Research and Development Com-mand, Goodfellow Air Force Base, TX.
Lintern, G. (1995). Flight instruction: The chal-lenge from situated cognition. International Journal of Aviation Psychology, 5(4), pp. 327-350.
Machado, R. (2005). Flight training interview. Retrieved October 20, 2006 from http://www.rodmachado.com/Articles/Interview-1.htm
Messick, S. (1995). Standards of validity and the validity of standards in performance assess-ment. Educational Measurement: Issues and Practice. Winter, 1995.
Moore, P. J., Lehrer, H. R., & Telfer, R. A. (1997). Instructor perspectives on learning in aviation. Proceedings of the 9th International Sympo-sium on Aviation Psychology (pp. 1252-1255). Dayton, OH.
Moore, P. J., Lehrer, H. R., & Telfer, R. A. (2001). Quality training and learning in aviation: problems of alignment. Journal of Air Trans-portation, 6(1).
Transportation, Federal Aviation Administra-tion (FAA), Washington, DC.
FAA. (2008). Aviation Instructors Handbook. FAA-H-8083-9A. U.S. Department of Trans-portation, Federal Aviation Administration (FAA), Washington, DC.
FAA, (2011). Federal Aviation Regulations (FAR), 14 CFR U.S.C. 61.181 (July 15, 2011).
Fitzgerald, P., Andrews, D., Crow, B., Karp, M., & Anderson, J. (2008). Student flight instructor competencies. In J. Wall (Chair), Interservice/Industry Training, Simulation, and Education Conference (I/ITSEC), Orlando, FL.
Graesser, A.C., Person, N.K., & Magliano, J.P. (1995). Collaborative dialog patterns in natu-ralistic one-on-one tutoring. Applied Cognitive Psychology, 9, pp. 359-387.
Henley, I. (1991). The development and evalua-tion of flight instructors: A descriptive survey. The International Journal of Aviation Psychol-ogy, 1(4), pp. 319-333.
Henley, I. (1995). Flight instructor test – Is it a valid and reliable assessment of an instructor’s teaching competence? In R. Jensen (Ed.), Pro-ceedings of the 8th International Symposium on Aviation Psychology. Dayton, OH.
Henley, I., & Bye, J. (2003). Learning styles, mul-tiple intelligences, and personality types. In Henley, I (Ed.) Aviation Education and Train-ing. Ashgate Publishing Limited.
Hunt, G. J. F. (2001). On becoming professional: Research issues for professional aviation ac-complishment. In R. Jensen (Ed.), Proceed-ings of the 11th International Symposium on Aviation Psychology. Dayton, OH.
Hunt, L. M. (1997). The specification of compe-tencies for the professional aviation instructor. Proceedings of the 9th International Sympo-sium on Aviation Psychology (pp. 1223-1227). Dayton, OH.
Hunt, L. M. (2003). The role of learning strate-gies in the learning process. In I. Henley (Ed.),

12 |
Niemczyk, M., & Savenye, W. C. (2005, Winter). Self-regulation in a computer literacy course. In M. Pierson’s (Ed.) Academic Exchange Quarterly. pp. 55-61.
Okdeh, A., Bradshaw, G., Brou, R., Doane, S. (2007). Learn to fly: instructor and student in instrument flight instruction. Proceedings of the 13th International Symposium on Aviation Psychology (pp. 486-491). Dayton, OH.
Penny, K. (2008). HIV/AIDS Role-play activity. Journal of Nursing Education. September, 2008.
Thatcher, S. J. (1997). Flight instruction or flight facilitation: a foundation for crew resource management. In R. Jensen (Ed.), Proceedings of the 9th International Symposium on Avia-tion Psychology. Dayton, OH.
Turney, M. A., Karp, M. R., Niemczyk, M., Green, M. F., Sitler, R. L., & Bishop, J. (2001). Re-taining women in collegiate aviation by imple-menting learning style considerations. Colle-giate Aviation Review. 19(1), pp. 92-101.
Waters, E. (1992) Role play: a versitile coopera-tive learning activity. Contemporary Educa-tion, 63, Spring, 1992. pp. 216-218
Wilt, D. F., Cain, J. H., Antalffy, M. (2001). Initial CFI training: shortcomings in pedagogy. In R. Jensen (Ed.), Proceedings of the 8th Inter-national Symposium on Aviation Psychology. Dayton, OH.
Wright, R. A. (2003). Changes in general aviation flight operations and their impact on system safety and flight training. In Proceedings of the International Air and Space Symposium and Exposition; the next 100 years, pp. 957-964.
Training Effective Flight Instructors

International Journal of Applied Aviation Studies | 13
Aviation Maintenance Human Factors in a Systems
Context: Implications for Training
Erin E. Bowen Edward J. Sabin Manoj S. Patankar
Department of Technology Department of Psychology Department of Aviation ScienceLeadership and Innovation Saint Louis University Saint Louis UniversityPurdue University401 N. Grant St.West Lafayette, IN 47907eebowen[at]purdue.edu
Acknowlegement
This research was funded by FAA grant #2003-G-013. A special thank you to Dr. Matt Grawitch for his comments on an early draft of the manu-script, and to Dr. Brent Bowen for additional com-ments and review. Thanks are also extended to the Federal Aviation Administration for their support.
Abstract
Previous evaluation efforts in maintenance resource management (MRM) training programs in the aviation industry have taken a piecemeal approach that fails to consistently consider training in an organizational systems context. Here, indicators of behavior prior to and following an MRM training program in place at a commercial air carrier’s maintenance facilities were assessed. Of particular interest was whether a previously established systems model could be applied in order to provide more effective training implementation. Structural equation modeling procedures found evidence to support using a systems framework to develop and assess safety training in industry.
Aviation Maintenance Human Factors in a Systems Context:
Implications for Training
Training in technical or industrial organizations can be a unique challenge. Trainers must often deal with not only presenting the desired mate-rial, but also doing so across multiple employee shifts and within the constraints of government or union regulations. Trainers who must teach “soft skills”, such as those addressing human factors er-rors and issues in the aviation industry, have the additional challenge of presenting information to an organizational culture that often prides itself on being able to “tough it out” and remain task-focused regardless of the situation. This does not mean, however, that human factors issues should be de-emphasized in these settings; to the contrary, it is just in these types of organizations that there is the greatest need for a clear and empirical under-standing of how to train and assess human factors issues and their contributions to safety and errors. Aviation organizations are significantly invested in identifying and appropriately measuring factors that may affect safety performance. One example of this is the significant growth of interest in in-tra- and interpersonal human factors as sources of error (Patankar and Taylor, 2008).
“Human factors” refers to the science and ap-plication of human performance findings in an operational system, incorporating methods and principles from several sciences and including the

14 |
study of variables that influence individual and team performance (Air Transport Association, 2002). Examples of these variables may include stress/fatigue, the physical nature of the work en-vironment, interpersonal communication patterns, relationships with supervisors, and other social, psychological, and contextual variables.
The increased concern with the role of human factors in aviation incidents, accidents, and errors has led to the development of several human-fac-tors related training programs. There is Crew Re-source Management (CRM) for flight crews, and more recently, Maintenance Resource Manage-ment (MRM) training has been developed for avi-ation maintenance technicians. Reviews of a series of notable aircraft accidents in the 1970s (NTSB, 1973; Roitsch, Babcock, & Edmunds, 1977; NTSB, 1979) spurred the development of crew resource management (CRM) training for pilots and flight crews (Helmreich, Merritt, & Wilhelm, 1999), and maintenance resource management (MRM) training for aviation maintenance workers. These training programs intended to address the inter- and intra-personal issues underlying a significant percentage of the aircraft accidents at that time, between 60 and 80 percent (FAA, 1990).
Development and Assessment of MRM Training
According to Taylor and Patankar (2001), the first reported CRM program designed for avia-tion maintenance workers began in November 1989; this and other programs eventually became known as MRM programs after the term “Mainte-nance Resource Management” was coined in 1992 (Taylor & Christensen, 1998). The FAA defines the concept of MRM as a “process for improving communication, effectiveness and safety in aircraft maintenance operations” (2000, p. 6), that was de-veloped to address “teamwork deficiencies within the aviation maintenance environment” (p. 6).
The fourth (and most recent) generation of MRM training programs reviewed by Taylor and Patankar (2001) has attempted to correct the weak-nesses of previous iterations by incorporating orga-
nizational systems theory, focusing on active error reduction, and promoting a structured communi-cation process. As Taylor and Patankar (2001) de-scribe, interest in systems theory has grown in the aviation industry, particularly with regard to MRM training. Many MRM researchers have called for the implementation of systems-based approaches to describing and evaluating MRM, and stressed the importance of viewing maintenance human fac-tors issues as depending on, and interacting with, environmental and contextual factors (e.g., Lator-ella & Prabhu, 2000; Taylor, 2000a). MRM train-ers are encouraged by the FAA to teach organiza-tional systems theory to maintenance technicians, in order to put human factors in the context of the larger organization (FAA, 2000). Additionally, the FAA stresses systems theory particularly for main-tenance technicians because of their greater likeli-hood (compared to flight crews) to commit latent (rather than active) errors, mistakes that may nei-ther have an effect for weeks or even months fol-lowing the incident, nor become evident for crews during normal operation (FAA, 2000).
The general goal of contemporary MRM train-ing, then, is to integrate the existing technical skills of maintenance employees with interpersonal skills and human factors knowledge; this should in turn improve communication effectiveness and in turn enhance safety in maintenance operations (FAA, 2000). The FAA suggests that a successful MRM training program not only teaches error avoidance, but also the adoption of attitudes that support a culture of safety. Because MRM training should incorporate a systems perspective (FAA, 2000), all levels of employees are encouraged to partici-pate and receive MRM training, and evaluations of MRM training should attempt to capture changes in attitudes that may contribute to latent as well as active errors.
MRM Training Evaluation
Based on the development and goals of CRM training programs, the Cockpit Management At-titudes Questionnaire (CMAQ) was developed to assess flight crew attitudes regarding human fac-tors issues, and has been found useful for train-
Maintenance Resource Management Training

International Journal of Applied Aviation Studies | 15
ing, evaluation, and research in CRM (Helmreich, Foushee, Benson, & Russini, 1986). Just as MRM evolved from initial efforts involving flight crews, so too did evaluation methodologies for MRM training evolve from those initially created to as-sess flight crew changes following CRM. Taggart (1990) was among the first to adapt CRM evalu-ation methods for the maintenance environment, revising the Cockpit Management questionnaire for use with aviation maintenance employees. Tay-lor and Robertson (1995) then modified Taggart’s revision, calling their survey the Crew Resource Management/Technical Operations Questionnaire, later renamed the Maintenance Resource Manage-ment/Technical Operations Questionnaire (MRM/TOQ).
Research on the CMAQ (Gregorich, Helmreich, & Wilhelm, 1990; Sherman, 1992) confirmed four constructs that were predicted to appear based on the survey items given to flight crews: communica-tion/coordination, shared command responsibility, recognition of stress effects, and avoidance of in-terpersonal conflict, though Gregorich et al. found that the conflict avoidance factor was inconsistent in their sample of CRM data and discarded it in subsequent analyses. Gregorich et al. also found a positive post-training shift in attitudes among par-ticipants, as well as a decrease in the variability of responses following CRM training; these re-sults indicated a positive effect of the CRM train-ing program on this sample of flight crew mem-bers. Helmreich, et al. (1986) similarly found the CMAQ to be useful, reporting a substantial link between attitude change measured by the CMAQ and line flying performance behaviors.
Aviation industry accident/incident reviews (such as those conducted by the National Trans-portation Safety Board and internal industry re-viewers) suggest that behaviors related to these four constructs underlie many of the human factors errors that have occurred in the past. In addition, these four constructs do incorporate aspects of a systems approach to promoting safety by attempt-ing to gauge alignment among organizational fac-tors such as leadership with interpersonal factors such as communication and conflict avoidance. The CMAQ, and later, the MRM/TOQ were both
designed to measure changes in these four attitude constructs prior to and immediately following re-source management training.
While the four attitude constructs that make up the primary MRM training assessment tool have been identified and described, the relationships among these constructs have not yet been clearly determined. If systems theory is indeed an impor-tant basis for understanding the implications of human factors errors (as suggested by the FAA, 2000), research must move beyond analyzing the components of MRM training and work to under-stand how those components interact with one an-other, as they do in organizations, to affect change intentions and overall training outcomes.
Utility of the MRM/TOQ
Data collected on CRM training has been con-nected to specific organizational and individual performance/outcome variables and task behav-iors (e.g., Helmreich et al., 1986), but little work has been done to similarly connect MRM training to particular outcome measures. Much of the re-search conducted using the MRM/TOQ (e.g., Tay-lor, 2000a; Taylor, 2000b; Taylor & Thomas, 2003) has focused on identification of the four factors and the relevant items to measure each; however, the interrelationships among the four factors have not yet been closely examined, nor have there been any systematic attempts to understand how these four critical areas of human factors training might fit into existing frameworks of aviation safety and performance (e.g., quality as described by Bowen & Headley, 2009).
One exception to these statements is the work of Fogarty (2003) and Fogarty, Saunders, and Collyer (2001), which focused on developing and testing a multilevel model to predict aviation maintenance performance. Their model (initially described in Fogarty et al., 1999) indicates that workplace fac-tors such as coworker support, supervision, and feedback affect employee morale and health, which in turn affect job intentions and maintenance errors. These authors do not use the MRM/TOQ to assess employee attitudes, relying instead on the Main-

16 |
tenance Environment Scale (MES), developed for their study. This survey asks few direct questions about attitudes, and focuses instead on contextual factors that may affect performance. The work of Fogarty and his colleagues provide support for the notion that individual and organizational-level vari-ables may impact safety; however, their research has not studied the impact of human factors train-ing on these variables, nor has it measured changes in MES variables over time (for example, the attitu-dinal changes measured by the pre-training MRM/TOQ and post-training MRM/TOQ).
A comprehensive model for training allows de-velopment, implementation, evaluation, and even-tually return on investment to be integrated into a single process, facilitating assessment of the effi-cacy of these types of programs in reducing human factors errors and improving safety. There are mod-els already found in the aviation literature that may fill this need. The maintenance performance model created by Fogarty et al. (1999) and the purpose-alignment-control (PAC) model created by Patan-kar, Bigda-Peyton, Sabin, Brown, and Kelly (2005) may be the most well-suited of these models to be adapted from a more general safety focus to serve as training-specific systems models.
The PAC model gets its name from the three concepts that are theorized to tie the model’s com-ponents together. Purpose refers to the ability of teams to collapse constraints, self-organize, and focus on goals. Alignment refers to the necessity of coordinating both individual and organizational resources when a purpose is clearly defined; while control refers to the notion that individuals and teams are willing and able to maintain alignment toward problem resolution when they believe that they have control over the outcomes. Patankar et al. suggest that the components listed in the model are those that need to first be “purposefully aligned” in order for subsequent components to come into alignment, and that a sense of control with regard to the components is a critical aspect of an active approach to safety. Early, partial tests of the PAC model with flight crew-related safety data (Block, Sabin, & Patankar, 2007) indicate the model has substantial potential to describe and eventually
predict safety-related attitudes and behaviors in an aviation setting.
Purpose of the Present Study
There are several conceptual similarities be-tween the PAC model and the Fogarty et al. (1999) maintenance model. Both models begin with orga-nizational input factors; however, the PAC model splits these contextual variables into “organiza-tional” and “team” factors, and suggests that the former affects the latter, while the Fogarty et al. model keeps all of these conditions grouped into a single factor. Because both models are attempts to provide a framework for discussing safety in avia-tion, the present study compares the various per-spectives within each model to determine which general model is most appropriate as a framework for improving MRM training. Partial tests of the PAC model and the Fogarty et al. (1999) model may improve understanding of the nature of the relationships among the variables and factors, and may provide guidance as to which model may best benefit from additional development for future hu-man factors training.
Both of these models have several advantages for analysis relevant to the remaining purposes of the present study: (1) both were developed using aviation organizations (minimizing the need for translation to specific organizational facets of the organization used in the present study), (2) both specify a number of individual and organizational variables as potential inputs (consistent with sys-tems theory), and (3) both are grounded in past dis-cussions of CRM and MRM training. The devel-opment of empirical support for a systems model (such as these) may also provide a necessary first step in identifying key leverage points for incor-porating MRM training as a tool to improve safety culture.
The present study begins the process of filling this substantial gap in aviation maintenance re-search by empirically integrating a systems frame-work into maintenance training implementation. In addition, the work of Gregorich et al. (1990) with regard to CRM among flight crews should be
Maintenance Resource Management Training

International Journal of Applied Aviation Studies | 17
replicated in a maintenance setting if their work is to continue to serve as the basis for maintenance training tools. Gregorich et al. (1990) conducted confirmatory factor analyses across three different samples to assess the factor structure of the CMAQ with flight crew employees. Similar exploratory work by Taylor (2000b), found different results than those presented by Gregorich et al. (such as strong evidence for the conflict avoidance factor among maintenance workers), increasing the level of ambiguity regarding the four factors that result from evaluations of resource management train-ing.
The present study has a threefold purpose: (1) to confirm or disconfirm the factor structure iden-tified by Taylor (2000b); (2) to test whether the pattern of attitude change identified by Gregorich et al. (1990) for flight crews is consistent with at-titude change patterns in aviation maintenance em-ployees, and (3) to partially test two models that describe the relationships among pre-and post-training employee attitudes, general satisfaction, and intentions for behavioral change following safety-related training, in order to identify which model best fits the relevant maintenance training data. Selection of a best-fitting model provides the foundations for developing an evidence-based systems framework for assessing and improving maintenance human factors training programs.
Research Design
Maintenance Technicians
Participants were 1458 employees at seven aircraft maintenance and line repair centers for a United States-based airline, who had participated in MRM training within the past 14 months. Par-ticipants were asked to complete the MRM/TOQ immediately before the MRM class started, and again at the end of the day (immediately following training). The MRM training program was con-ducted during the mechanics’ normal work sched-ule and lasted for approximately eight hours. The mean age of respondents was 49.74 years (SD = 8.03), mean years in maintenance at the current
organization was 17.55 (SD = 7.07), and most par-ticipants were male (96.6%).
Maintenance Resource Management/Technical Operations Questionnaire (MRM/TOQ)
Data were collected using the Maintenance Resource Management/Technical Operations Questionnaire (MRM/TOQ). The MRM/TOQ is a 17-item questionnaire developed to measure the attitudes and intentions of participants in airline maintenance communication and safety training workshops (Taylor, 2000b). Reliability and valid-ity of the MRM/TOQ were previously assessed by Taylor (2000b), who reported adequate reliability (with regard to both stability and consistency) as well as evidence of good concurrent and construct validity in the instrument. Measurement of Cron-bach’s alpha as a gauge of internal consistency ranged between 0.51 and 0.77 per scale for the four attitude areas among aircraft maintenance techni-cians.
Results
Basic demographic information and broad dif-ferences among groups were initially evaluated to ensure that results found in subsequent analyses were not based on pre-existing differences (e.g., differences found among the various work sites on other variables were not affected by significant differences in mean age or years of experience). Analysis of variance (ANOVA) results indicate that there were no differences among the seven sites on mean age (F7, 608 = 1.81, ns). There were significant differences in years at the organization across the seven sites (F7, 1362 = 7.323, p < 0.05). Post hoc analyses (Scheffé procedure) indicated that these significant differences were between site one (N = 646) and sites two (N = 279) and five (N = 90), and between site four (N = 132) and site five. Post hoc (Scheffé) results indicate site five partici-pants report significantly fewer years’ experience compared to sites one, three, and seven. No other differences among the sites on this variable were

18 |
found when sample size discrepancies were taken into account, and each of the seven sites demon-strated comparable demographic information.
Factor Comparisons
Confirmatory factor analyses (CFA) using the LISREL statistical software program were conduct-ed for both the pre- and post-training data to ascer-tain if the four-factor structure (communication/
coordination, relational supervision, recognition of stress effects, and conflict avoidance) described by Taylor (2000b) for maintenance employees us-ing the MRM/TOQ was consistent with the present data sample (Block, et al., 2009). Results of these factor analyses are presented in Table 1. For pre-MRM training data Taylor’s four-factor structure failed to converge when all items were included. Eliminating the weakest item (“A truly professional team member can leave personal problems behind when working”) allowed a four-factor structure to
Table 1
Pre-Post Training Data Confirmatory Factor Analysis - Three Factor Structure
Pre-Training Post-Trainingλ R2 λ R2
Communication/CoordinationEmployees should make the effort to foster open, honest, and sincere communication.
0.82 0.67 0.88 0.78
We should always provide both written and verbal turnover to the on-coming shift.
0.77 0.59 0.86 0.74
My work impacts passenger satisfaction/safety. 0.79 0.62 0.87 0.76A debriefing and critique of procedures and decisions after a significant task is completed is an important part of developing and maintaining effective crew coordination.
0.72 0.52 0.82 0.68
Having the trust and confidence of my coworkers is important. 0.70 0.49 0.77 0.59Start of shift maintenance crew meetings are important for safety and for effective crew management.
0.65 0.42 0.73 0.53
My coworkers value consistency between words and actions. 0.54 0.30 0.62 0.39Relational SupervisionMy supervisor can be trusted. 0.77 0.59 0.83 0.70My supervisor protects confidential or sensitive information. 0.74 0.54 0.79 0.63Mechanics' ideas are carried up the line. 0.57 0.33 0.67 0.45My suggestions about safety would be acted on if I expressed them to my lead or supervisor.
0.62 0.38 0.74 0.55
I know the proper channels to route questions regarding safety prac-tices.
0.54 0.29 0.55 0.30
Conflict AvoidanceIt is important to avoid negative comments about the procedures and techniques of other team members.
0.81 0.65 0.75 0.56
Maintenance personnel should avoid disagreeing with one another. 0.56 0.31 0.71 0.50
Maintenance Resource Management Training

International Journal of Applied Aviation Studies | 19
converge, but still indicated poor item loadings for the two remaining items related to “recognition of stress effects” (λ = 0.15 and -1.55). Complete elimination of the stress effects factor did not de-crease the fit of the data: root mean square error of approximation (RMSEA) = 0.046, Tucker-Lewis index = 0.98, and comparative fit index = 0.98 (for three-factor structure).
For post-training data the initial four-factor so-lution converged, but again indicated poor lambda values for “recognition of stress effects” (λ = 0.05, -0.19, and -0.25); the CFA procedure was re-run with a three-factor structure, and results of this may also be seen in Table 1. Eliminating the stress effects factor contributed to a slight improvement in the RMSEA (from 0.061 to 0.056); other fit in-dices were unchanged by the removal of this fac-tor: Tucker-Lewis index = 0.98, and comparative fit index = 0.98 for the three-factor structure. The data indicate the factor that should be eliminated or modified when evaluating maintenance training is not conflict avoidance (as suggested by Grego-rich et al., 1990, for flight crew data), but rather recognition of stress effects.
Pre-Post Training Comparisons
Reliability of items within each factor was also measured, using Cronbach’s alpha. Gregorich et al. (1990) reported moderate reliability levels in the flight crew data for the three factors on which they focused (Cronbach’s alpha ranging between 0.47 and 0.67). Reliability scores for the present data sample were good for two of the four factors (communication/coordination, α = 0.82 before and α = 0.86 after training; relational supervision, α = 0.73 before and α = 0.80 after training). Reliability for the areas of conflict avoidance and stress rec-ognition, however, varied from moderate to very weak: conflict avoidance, α = 0.54 before and α = 0.62 after training; stress recognition, α = 0.29 before and α = 0.28 after training.
In order to facilitate analysis of the four factors identified in the CFA procedure, composite scores were created by summing participants’ responses to items within each factor (a procedure also con-
ducted by Gregorich et al. (1990) for their analysis of flight crew data). Responses for items 1 (“main-tenance personnel should avoid disagreeing with one another”); 2 (“even when fatigued, I perform effectively during critical phases of work”); 5 (“it is important to avoid negative comments about the procedures and techniques of other team mem-bers”), and 9 (“a truly professional team member can leave personal problems behind when work-ing”) were reverse-scored, so that higher responses following training would be indicative of effective MRM training. To test whether the same pattern of significant pre- and post-training attitude changes would be represented in the present data as was found by Gregorich et al. (1990), a repeated-mea-sures ANOVA procedure was performed on each pair of pre- and post-training composite scores, in-cluding site location and type of maintenance job held by participants as potential interacting vari-ables. This is similar to the cross-organization and cross-job title analyses conducted by Gregorich et al.
Results of analysis showed a significant main effect of training for two of the four factors: com-munication/coordination (F1,1249 = 4.48, p < 0.05) and conflict avoidance (F1,1249 = 17.42, p < 0.05). Analysis of the remaining two factors showed marginally significant change following training: F1,1249 = 3.12, p = 0.07 for relational supervision; F1,1249 = 3.75, p = 0.053 for recognition of stress effects. These results, however, may be due more to the large sample size contributing to the liber-ality of the F-test rather than to the presence of meaningful post-training differences (e.g., the net change in the composite score on relational super-vision from pre- to post-training is 0.54, slightly more than one-half of one scale point). None of the interactions between any of the four factors and site locations or job type were significant.
According to Gregorich et al. (1990), if resource management training was successful there should be diminished response variation following train-ing; and if training enhanced pre-existing attitudes, response variation is likely to have increased fol-lowing training. To determine whether such a vari-ance reduction had occurred in the present sample, a t-test for the difference between correlated vari-

20 |
ances (e.g., testing for heterogeneity of variance) (Gregorich et al., 1990; Ferguson, 1971; Howell, 2002) was computed for each pair of pre- and post-training factor scores. Contrary to results obtained by Gregorich et al., only the relational supervision and conflict avoidance factors showed a significant change in variability following training, and both of those factors actually demonstrated increased variability following MRM training, rather than the anticipated decrease in mean variability. Prior to MRM training, the mean variability (Howell, 2002) for the relational supervision factor was s2 = 18.55; following training the mean variability was s2 = 20.00 (t 1457 = -2.595, p < 0.01). Prior to MRM training the mean variability for conflict avoidance was s2 = 4.98; following training the mean vari-ability for this factor was s2 = 5.89 (t1457 = -5.378, p < 0.001).
Model Tests
To ascertain whether the PAC model provides better overall fit with the MRM/TOQ results (com-pared to Fogarty et al.’s 1999 model), partial tests of both models were conducted using structural equation modeling (SEM). When using SEM, judging model fit through use of a single index is considered insufficient (Schumacker & Lomax, 2004), as each index has various strengths/weak-nesses. Fit indices used in the present study are the goodness of fit index (GFI), root mean square er-ror of approximation (RMSEA), and comparative fit index (CFI). The GFI is a general fit index that measures the amount of variance and covariance in a sample matrix that is predicted by the reproduced matrix. The RMSEA is a global measure of model fit; and finally, the comparative fit index compares the hypothesized model with a null model in which all latent constructs are assumed to be uncorrelated (Schumacker & Lomax, 2004). Additionally, stan-dardized path coefficients indicate the strength of the relationship among the latent constructs.
In tests of Fogarty et al.’s (1999) model, the four post-training attitude areas from the MRM/TOQ provide data analogous to the “workplace” factor described by Fogarty et al. Morale in the model is
defined by three items related to outcomes of train-ing (“this training has the potential to increase avi-ation safety and crew effectiveness”; “this training will be useful for others”; and “is the training going to change your behavior on the job”).
Lambda values for each item suggest that a por-tion of the items serve as reasonable indicators of their respective constructs (though items related to the factor ‘recognition of stress effects’ exhibited λ values below 0.29). Overall fit indices indicated a moderate amount of fit with the data: goodness of fit index (GFI) = 0.86, root mean square error of approximation (RMSEA) = 0.054, and compara-tive fit index (CFI) = 0.98.
Observation of the standardized path coeffi-cients (betas), however, suggests that the Fogarty et al. model is not the best structure for this data. Even after correcting the model to exclude weak items and the entire recognition of stress effects factor, the paths between the three remaining fac-tors and morale decreased (for relational supervi-sion, β = 0.21; for communication/coordination, β = 0.53; and for conflict avoidance, β = 0.05).
The PAC model (Patankar et al., 2005) was initially tested as described with two of the four MRM/TOQ attitude areas loading onto the orga-nizational factors latent construct and two loading onto the team factors construct through a process of purposeful alignment (Patankar et al., 2005); how-ever, organizing the four attitude areas in this way did not provide a valid model based on the data. Because the previously reported factor analyses di-vided MRM/TOQ items into four distinct attitude areas (even with weak items for the fourth factor), it was thought that the reason for non-convergence may lie in the attempt to create a second-order fac-tor structure (“organizational” and “team” factors) out of these relatively independent attitude areas.
To further clarify the model and ensure align-ment with both the MRM/TOQ factor analyses as well as the theoretical concepts behind the PAC model, the PAC model was then retested with “or-ganizational factors” consisting of the communi-cation/coordination items of the MRM/TOQ and “team factors” consisting of the three supervisory trust items (“my supervisor can be trusted”; “my
Maintenance Resource Management Training

International Journal of Applied Aviation Studies | 21
suggestions about safety would be acted on if I expressed them to my lead or supervisor”; and “my supervisor protects confidential or sensitive information”). Contributing to the team factors construct was conflict avoidance, which contained two items (“maintenance personnel should avoid disagreeing with one another”; and “it is important to avoid negative comments about the procedures and techniques of other crew members”). Adding conflict avoidance as a separate factor contributing to supervisory trust (the team factor) maintains the distinctions between these two constructs present in the confirmatory factor analysis while still link-ing them theoretically as is described in Patankar et al.’s (2005) PAC model. This new construct thus predicted the team factors construct, but did not directly measure team factors. This also seems to better fit the relationships hypothesized by Patan-
Table 2
Item Weights for Items Tested in PAC mode
Outcomes λ18. This training has the potential to increase aviation safety and crew effectiveness. 0.9619. This training will be useful for others. 0.96Communication/Coordination 8. Having the trust and confidence of my coworkers is important. 0.7610. We should always provide both written and verbal turnover to the oncoming shift. 0.8611. Employees should make the effort to foster open, honest, and sincere communication. 0.8813. My work impacts passenger satisfaction/safety. 0.8714. A debriefing and critique of procedures and decisions after a significant task is completed is an im-portant part of developing and maintaining effective crew coordination.
0.83
17. Start of shift maintenance crew meetings are important for safety and for effective crew manage-ment.
0.73
Team Factors (Relational Supervision) 3. My suggestions about safety would be acted on if I expressed them to my lead or supervisor. 0.70 4. My supervisor protects confidential or sensitive information. 0.8412. My supervisor can be trusted. 0.85Conflict Avoidance 1. Maintenance personnel should avoid disagreeing with one another. 0.71 5. It is important to avoid negative comments about the procedures and techniques of other team mem-bers.
0.74
kar et al. with regard to the components of orga-nizational and team factors needing alignment to have a controlled influence on outcome variables. Items with poor fit and any related to “recognition of stress effects” were eliminated from the final model test. Lambda values for each of the MRM/TOQ items can be seen in Table 2.
Results of this final PAC model analysis offered improved support for the general structure of the PAC model while providing a more parsimonious model of the data. As can be seen in Figure 1 (page 22), while relationships among the three general constructs (organizational factors, team factors, and outcomes) remained very similar compared to the initial PAC model, the factor structure shown in the figure is now more consistent with the struc-

22 |
ture of the MRM/TOQ attitude areas. Additionally, by dividing items for the team factors area into the attitude areas conceptually and empirically iden-tified by both Taylor (2000b) and Patankar et al. (2005) and confirmed in the present study, value on the GFI has improved to 0.92, while the RM-SEA improved to 0.047, and the CFI improved to 0.99. The chi-square value decreased from χ2149 = 931.49 to χ260 = 197.30 with the adjustment of the model to incorporate the conflict avoidance factor and eliminate poor items (those with λ values be-low 0.70).
Discussion
Understanding the role of human factors in the aviation industry is a complex challenge, balanc-ing individual attitudes with systemic organiza-tional and inter-organizational factors. This study sought to explore the attitude changes occurring in a real-world training situation, and to discuss the application of enhanced training assessments to improve MRM training, human-factors based safety attitudes, and the measurement of training effectiveness.
Attempts to confirm the four-factor structure identified by Taylor (2000b) and provide additional support for the use of the MRM/TOQ in assess-
ing MRM training produced mixed results. While the conflict avoidance factor (characterized by the items “maintenance personnel should avoid dis-agreeing with one another” and “it is important to avoid negative comments about the procedures and techniques of other team members”) has been found to be inconsistent and under-identified in samples of flight crews (Gregorich et al., 1990), both Taylor (2000b) and the present study found consistent responses for this factor among mainte-nance employees.
There are several possible reasons for this dis-tinction between the two broad categories of avia-tion employees. Perhaps maintenance employees perceive interpersonal disagreements and pro-cedural disagreements as highly similar types of conflict, whereas flight crews make a distinction between the two – this may cause the items to diverge and contribute to inconsistent results for flight crews on this factor. Additionally, the format of conflict training for maintenance employees may differ in approach from that used with flight crews, leading to discrepancies in interpretation of this factor. These results emphasize the need to properly tailor both the training programs and the evaluation methods to the desired audience to maximize training effectiveness.
Figure 1. PAC model
Conflict Avoidance
Communication & Coordination
Team Factors
Outcomes
0.18
0.30
0.54
0.22
Maintenance Resource Management Training

International Journal of Applied Aviation Studies | 23
The present study found little support for con-tinued inclusion of the “recognition of stress ef-fects” factor in MRM training assessments, at least in its current format. Confirmatory factor analysis indicated a poor degree of item fit for the three items intended to measure stress recognition, inter-item reliability was quite low, and the factor con-tributed little to the systems-based training model tested. The observed data on this factor strongly suggest that modifications are warranted for either 1) items used in the MRM/TOQ to measure under-standing and agreement with the stress recognition portion of human factors training; or 2) the method of presentation of stress recognition information in the MRM courses. The data on this factor in-dicate a conceptual disconnect between the teach-ing of stress recognition as it is currently provided in MRM training courses and the understanding of stress recognition as it is captured by the cur-rent MRM/TOQ. Perhaps maintenance employees do not perceive the relationship between the stress and safety outcomes, questionnaire items are being misinterpreted, or the material is not being clearly explained during training. If the industry wishes to continue emphasizing the importance of stress recognition as a component of MRM training, the measurement methods for this factor or the meth-odology of instruction for this factor must be re-viewed and corrected to improve the quality and accuracy of assessment, and the congruence be-tween training and measurement.
Conclusions
Analysis of the systems-based model for training assessment presented here (via the combination of confirmatory factor analysis and structural model-ing analysis) identified key areas in MRM training that require either program or assessment modifi-cation in order to optimize the training and evalu-ation of maintenance employees. While results suggest that MRM training offers many benefits to employees who participate, the discovery of poor consistency between flight crews and maintenance in the measurement of conflict avoidance training, and the poor item fit and reliability for the three items designed to measure stress recognition train-
ing suggest that these factors should be revised if the MRM/TOQ is to continue to be used to assess training outcomes.
The differences in the consistency of the con-flict avoidance factor between flight crews and maintenance employees may indicate that there are differences in the material emphasized for flight crews and the material emphasized for main-tenance employees (such that conflict avoidance is given more time/weight in MRM courses), that flight crews and maintenance employees have dif-ferent mental concepts for “conflict avoidance”, or that conflict avoidance is a more relevant concept for maintenance employees. Alternatively, these differences in the order and consistency of the factor structure for these items suggest that there are different characteristics of the flight crew and maintenance populations, and that these differ-ences should be taken into account when modeling attitude change, developing resource management training, or making comparisons on outcomes be-tween the two groups.
In its present state, the stress recognition items do not contribute unique information about the im-pact of MRM training. Assuming that stress recog-nition is indeed an important component of safety-related human factors training for the organization (which it should be), modification of the items is needed to assess the success of stress training ini-tatives. Replication of analyses conducted by Gre-gorich et al. (1990) found several areas in which maintenance and flight crew employees responded in similar fashion to resource management training. The difference in factor structure between the two populations, however, suggests the presence of un-derlying differences in perception of or approach to training that should be considered when industry leaders take existing training programs and pres-ent them to new audiences. There is clearly a need for substantive modifications to such programs if they are to achieve maximum effectiveness in ad-dressing the organization’s training goals for that audience.
The partial tests of the PAC model presented here provide evidence suggesting that many of the relationships described by Patankar et al. (2005) as

24 |
factors-related safety attitudes in aviation and oth-er high-consequence industries, and the need for training programs that properly present and assess these attitudes in a way useful to the organization, can only truly be understood when examined us-ing a systems-theory based approach. The model and results of this study provide a new step in this key direction.
References
Air Transport Association of America. (2002). Maintenance human factors program guide-lines. Washington, DC: Air Transport Associa-tion of America, Inc.
Block, E. E., Sabin, E. J., & Patankar, M. S. (2009, April). Training to reduce aviation mainte-nance error: Assessing maintenance resource management programs in commercial aviation. Proceedings of the 15th International Sympo-sium on Aviation Psychology, Dayton, OH.
Block, E. E., Sabin, E. J., & Patankar, M. S. (2007). The structure of safety climate for ac-cident free flight crews. International Journal of Applied Aviation Studies, 7, 46-59.
Bowen, B., Headley, D. (April 2009). The Airline Quality Report 2008. W. Frank Barton School of Business Monograph Series. Wichita, KS: Wichita State University, 45pps.
Federal Aviation Administration. (1990). Profile of operational errors in the national airspace system, calendar year 1988. Washington, DC: FAA, U.S. Department of Transportation.
Federal Aviation Administration. (2000). Mainte-nance resource management training. (AC No. 120-72).
Ferguson, G. A. (1971). Statistical analysis in psychological education. New York: McGraw-Hill.
Fogarty, G. J. (2003). Errors, violations, and re-porting behaviour in aviation maintenance. In R. Jensen (ed), Proceedings of the Twelfth In-
indicative of a safety culture are present in safety-related training. While the present study was lim-ited in the availability of data that could be entered into tests of the model (e.g., no objective outcome data, the availability of only a portion of the data for each of the three main constructs in the mod-el), even these partial tests of the model indicate its utility as a systems-based framework for the design and evaluation of future MRM training programs. Given the increasing demand within the aviation industry for comprehensive approaches to training design and assessment (described above), such a model is a key first step in understanding the nature of successful human factors training programs.
Future Research
These findings indicate a clear need for contin-ued follow-up of MRM training programs using a comprehensive, systems-based approach to evalu-ation. In addition, systems-based training includes the ability to link attitude changes that occur in MRM training programs to on-the-job behavioral change; these linkages can begin to be measured and understood based on the relationships theo-rized in the PAC model. Additional research is greatly needed to link such training programs to multiple concrete outcomes, as well as linking back to the training methods and materials used in presenting MRM, using the PAC model as the conceptual framework for an iterative design-as-sess-redesign process.
The results presented here may provide the im-petus for additional research on the PAC model and encourage the gathering of data to test a more complete version of the model. Results of the pres-ent study should also encourage aviation organiza-tions to review their methodology for measuring the impact of MRM training, and to make appro-priate revisions to their assessment tools in order to provide the most useful and accurate data. In addition, the need for frequent and systemically-oriented approaches to the review and modifica-tion of the training programs themselves for the various employees groups has been highlighted by these findings. The critical nature of human
Maintenance Resource Management Training

International Journal of Applied Aviation Studies | 25
Howell, D. C. (2002). Statistical methods for psychology. (5th ed.). Belmont, CA: Duxbury Press.
Kozlowski, S. J. & Salas, E. (1997). A multilevel organizational systems approach for the imple-mentation and transfer of training. In Ford, J.K., Kozlowski, S., Kraiger, K., Salas, E., Teachout, M. (eds), Improving training effec-tiveness in work organizations. Mahwah, NJ: Erlbaum, 247-287.
Latorella, K. A. & Prabhu, P. V. (2000). A review of human error in aviation maintenance and inspection. International Journal of Industrial Ergonomics, 26, 133-161.
Montesino, M. U. (2002). Strategic alignment of training, transfer-enhancing behaviors, and training usage: A posttraining study. Human Resource Development Quarterly, 13, 89-108.
National Transportation Safety Board (2002). Avi-ation accident synopses world wide web page (Available on-line: http://www.ntsb.gov/Info/gils/gilssyn.htm). Retrieved 10-05-2007.
National Transportation Safety Board (1979). Air-craft accident report - American Airlines, Inc., McDonnell-Douglas DC-10-10, N110AA, Chi-cago, Illinois, May 25, 1979. Washington, D.C. (NTSB No. NTSB-AAR-79-7).
National Transportation Safety Board (1979). Air-craft accident report - United Airlines, Inc., McDonnell-Douglas DC-8-61, N8082U, Port-land, Oregon, December 28, 1978. Washing-ton, D.C. (NTSB No. NTSB-AAR-79-17).
National Transportation Safety Board (1975). Air-craft accident report - Eastern Air Lines, Inc., Douglas DC-9-31, N8984E, Charlotte, North Carolina, September 11, 1974. Washington, D.C. (NTSB No. NTSB-AAR-75-9).
National Transportation Safety Board (1973). Air-craft accident report - Eastern Air Lines, Inc., L-1011, N310EA, Miami, Florida, December 29, 1972. Washington, D.C. (NTSB No. NTSB-AAR-73-14).
ternational Symposium on Aviation Psycholo-gy, p. 385-390. April 14-17, Dayton, OH: Ohio State University.
Fogarty, G. J., Saunders, R., & Collyer, R. (2001, March). The role of individual and organisa-tional factors in aviation maintenance. Paper presented at the Eleventh International Sympo-sium on Aviation Psychology, Columbus, OH.
Fogarty, G. J., Saunders, R., & Collyer, R. (1999). Developing a model to predict aircraft main-tenance performance. In R. Jensen, B. Cox, J. Callister, and R. Lavis (eds), Proceedings of the Tenth International Symposium on Aviation Psychology. Columbus, OH: Ohio State Uni-versity.
Gregorich, S. E., Helmreich, R. L., & Wilhelm, J. A. (1990). The structure of cockpit manage-ment attitudes. Journal of Applied Psychology, 75, 682-690.
Gregorich, S. E. & Wilhelm, J. A. (1993). Crew resource management training assessment. In E.L. Wiener, B.G. Kanki, & R.L. Helmreich (eds), Cockpit Resource Management, 173-198.
Helmreich, R. L. & Foushee, H. C. (1993). Why crew resource management? Empirical and theoretical bases of human factors training in aviation. In E.L. Wiener, B.G. Kanki, & R.L. Helmreich (eds), Cockpit Resource Manage-ment. San Diego, CA: Elsevier Press, 3-45.
Helmreich, R. L., Foushee, H. C., Benson, R., & Russini, W. (1986). Cockpit resource manage-ment: Exploring the attitude-performance link-age. Aviation, Space, and Environmental Medi-cine, 57, 1198-1200.
Helmreich, R. L., Merritt, A. C., & Wilhelm, J. A. (1999). The evolution of crew resource man-agement training in commercial aviation. In-ternational Journal of Aviation Psychology, 9, 19-32.
Helmreich, R. L., & Wilhelm, J. A. (1991). Out-comes of crew resource management training. International Journal of Aviation Psychology, 1, 287-300.

26 |
Patankar, M. S., Bigda-Peyton, T., Sabin, E., Brown, J., & Kelly, T. (2005). A comparative review of safety cultures. Federal Aviation Administration: ATO-P Human Factors Research and Engineer-ing Division (Grant No. 5-G-009).
Patankar, M. S. & Taylor, J. C. (2008). MRM train-ing, evaluation, and safety management. The In-ternational Journal of Aviation Psychology, 18, 61-71.
Richman-Hirsch, W. L. (2001). Posttraining inter-ventions to enhance transfer: The moderating effects of work environments. Human Resource Development Quarterly, 12, 105-120.
Roitsch, P. A., Babcock, G. L., & Edmunds, W. W. (1977). Human factors report on the Tenerife Ac-cident. Aircraft accident report from the Air Line Pilots Association. Washington, D.C. Available on-line at http://www.project-tenerife.com/en-gels/PDF/alpa.pdf.
Schumacker, R. E., & Lomax, R. G. (2004). A be-ginner’s guide to structural equation modeling (2nd ed.). Mahwah, NJ: Lawrence Earlbaum Publishers.
Sherman, P. J. (1992). New directions of CRM train-ing. Proceedings of the Human Factors Society Thirty-sixth Annual Meeting. Santa Monica, CA: HFS.
Taggart, W. (1990, November). Introducing CRM into maintenance training. Proceedings of the Third Federal Aviation Administration Meeting on Human Factors Issues in Aircraft Mainte-nance and Inspection - Training Issues. Wash-ington, D.C.
Taylor, J. C. (2000a). The evolution and effec-tiveness of maintenance resource management (MRM). International Journal of Industrial Er-gonomics, 26, 201-215.
Taylor, J. C. (2000b). Reliability and validity of the maintenance resources management/technical operations questionnaire. International Journal of Industrial Ergonomics, 26, 217-230.
Taylor, J. C. & Christensen, T. D. (1998). Airline Maintenance Resource Management: Improv-
ing Communication. Warrendale, PA: Society of Automotive Engineers.
Taylor, J. C. & Patankar, M. S. (2001). Four gen-erations of maintenance resource management programs in the United States: An analysis of the past, present and future. The Journal of Air Transportation World Wide, 6, 3-32.
Taylor, J. C. & Robertson, M. M. (1995). The effects of crew resource management (CRM) training in airline maintenance: Results following three years experience. NASA Contractor Report 196696/Contract NCC2-812. Washington, D.C., National Aeronautics and Space Administra-tion.
Taylor, J. C. & Thomas III, R. L. (2003). Toward measuring safety culture in aviation mainte-nance: The structure of trust and professional-ism. International Journal of Aviation Psychol-ogy, 13, 321-343.
Maintenance Resource Management Training
International Journal of Applied Aviation Studies | 27
Safety Culture: The Perception of Taiwan’s Aviation
Leaders
Chien-tsung Lu1, John Young1, Stewart Schreckengast1, & Harry Chen2
1Department of Aviation Technology 2Flight Safety Foundation TaiwanPurdue University 2F., No. 340-10, Dunhua N. Rd.W. Lafayette, IN 47907 Taipei, Taiwan ROC 10599ctlu[at]purdue.edu harry[at]flightsafety.org.tw jpy[at]purdue.eduswschrec[at]purdue.edu
Abstract
One of the outcomes of implementing Safety Management Systems (SMS) is to improve and reinforce the safety culture for an organization. Since 2003, the International Civil Aviation Orga-nization (ICAO) has promoted SMS implementa-tion in its contracting States and introduced a safe-ty management guidebook in 2006, namely Doc. 9859 Safety Management Manual (SMM) (ICAO, 2006). Furthermore, these obligations were enact-ed into the ICAO Annexes requiring SMS imple-mentation in their international airlines, airports, air traffic control, accident investigation and air-craft maintenance facilities before January 2010. This study aims to discover the status of safety cul-ture after the initiation of SMS in 2008 in Taiwan. Using convenient sampling and Delphi technique, survey participants were selected from attendees of an SMS recurrent workshop in Taipei, Taiwan in July 2010. The findings identified the status of safety culture according to the four categorized sub-cultures: Informed, Reporting, Just and Learn-ing cultures. The results show many critical issues such as excessive top-down pressure, disregarding reported hazards, low-usage of the hazard report-ing system, and skeptical managerial capability. A thorough list of findings and recommendations are provided in this paper for the Civil Aeronautics Administration of the Republic of China (CAA-ROC) to promote airport safety. This methodology would be applicable to other aviation and high risk organizations as an initial indicator of their base-line safety culture.
Background
The International Civil Aviation Organiza-tion (ICAO) has required its contracting States to implement Safety Management Systems (SMS) within the international airport system according to the ICAO Annex 14 (ICAO, 2008). In 2004, the U.S. Federal Aviation Administration (FAA) be-gan distributing its own System Safety Handbook and related safety management documents (AC 120-92, 2006; AC 150/5200-37, 2007; Adminis-trative Order 8000.1, 2006; and Order 8000.367, 2008) to the aviation community to improve the overall quality of safety metrics. In 2010, the U.S. Congress enacted the “Airline Safety and Federal Aviation Administration Extension Act of 2010.” The new law not only requires a higher pilot train-ing standard, but also mandates airlines to imple-ment SMS (Government Accountability Office [GAO], 2010). Currently, the four SMS underpin-ning components – Safety Policy, Risk Manage-ment, Safety Assurance, and Safety Promotion – are guiding the industry toward future integra-tion of aviation safety management programs. As noted in the results of ICAO Safety Audits, many airports have already spent significant resources to comply with the requirements of ICAO SMS.
Taiwan has a rapidly growing air transporta-tion industry, especially the cross Taiwan Straight flights to and from China. Although Taiwan is not an official member of ICAO, Taiwan’s aviation authority adopts most guidelines, standards, best practices and recommendations from the interna-tional community for achieving the highest level

28 |
of safety. The SMS implementation is no excep-tion to this observation. Noticeably, Taiwan has been the test-bed for some new safety programs that will eventually be implemented in China. The integration of SMS in Taiwan’s airport industry and safety culture will be a great show-case example for the booming Greater China aviation commu-nity. In 2008, two aviation professors from Pur-due University were invited to Taiwan to conduct a 5-day ICAO-FAA SMS workshop for airline and airport managers and government officials. The SMS workshop has created a baseline for future safety culture measurements. It had been two years since the last SMS workshop, and therefore a status review of SMS in Taiwan was recommended. On July 20th, 2010, two Purdue University professors were again invited to Taiwan to conduct a survey to discover airport employees’ perceptions of safety culture and consequently assess SMS implemen-tation outcomes. This paper reviews that process and the summary findings.
Literature Review
Human error and accidents will continue to challenge the aviation industry. With this in mind, continuously providing safety education to airport operators is a fundamental means to identify and mitigate unforeseen hazards. The ICAO Safety Management Manual (SMM) is a guidebook for all contracting States to systematically design and im-plement SMS for airport operations. Based on sys-tem safety concepts, the contents of ICAO SMM cover basic safety theories to an overall roadmap of SMS implementation (ICAO, 2006). The ultimate outcomes of the ICAO SMM are an integration of safety systems and a positive safety culture within an organization. As addressed in the SMM, the content includes: the definition of risk, acceptable level of risk, responsibility assigned to personnel, regulatory compliance, safety performance, safety education and management, risk management and hazard reporting system, risk analysis and investi-gation, periodic audit and monitoring, and avail-able safety management tools (ICAO, 2006).
Human Elements in a Safety System
According to Military Standard 882D (MIL-STD-882D) Standard Practice for System Safety,
a system is defined as “an integrated composite of people, products, and processes that provide a ca-pability to satisfy a stated need or objective” (De-partment of Defense [DoD], 2000, p.2). Human operators are considered an essential component within a system and are vital to the success of a safety management system. Human factors are the most dynamic aspect in an aviation safety program because humans react to new ideas, environmen-tal change, societal movements, interactions, and significant insights (Petersen, 1988; Wiegmann & Shappell, 2003; Wood, 2003). Furthermore, hu-mans change positions and occasionally react dif-ferently to similar stimuli. Moreover human be-havior is constantly being affected by culture, peer pressure, environment, physical condition, training, education, level of satisfaction, personal beliefs, etc. Human behavior is different from individual to individual based on various factors occurring at any given time. For example, emotional state, mental status, preoccupation mindset, motivation factors, complacency tendency, and personality traits can vary due to the living standard, life style, educational level, or even someone’s childhood, which can have an indeterminable effect (Orlady & Orlady, 1999; Petersen, 1988; Wood, 2003).
Another way human behavior is influenced is through modeling, the so-called learning through imitation (Petersen, 1988). According to Dan Pe-tersen’s model, if one would like to maximize learning in workers, one must exhibit the behavior himself/herself (Petersen, 1988). Thus, manage-ment must set the example if they want the em-ployees to behave within acceptable limits. The old phrase “leadership by example” is definitely applicable. In a high-consequence industry, such as airport and airline operations, the workers’ will-ingness to respond effectively is critical to ensure safety (Reason, 1997). Petersen (1988) has also shown the positive correlation between attitudes and safety results. In the current system safety con-cept, management’s commitment is identified to be the foundation to an effective safety system (FAA, 2006, 2007; ICAO, 2006; Reason, 1997).
Besides, the human-machine interface will always be a concern under the discussion of hu-man factors. The human-machine interface can be either a successful design or a trap, depending on many operational factors such as mission de-mands, supervisory pressure, adequacy of supervi-
Safety Culture: Perception of Taiwan’s Aviation Leaders

International Journal of Applied Aviation Studies | 29
an organization” (Piers, Montijn, & Balk, 2009, p.2.). Without a doubt, the core accomplishment of SMS is to create a better safety culture to maintain and further improve the entire system’s safety. In 2010, the Office of the Auditor of the City and County of Denver, Colorado conducted an audit on safety culture across different work-ing units under the Department of Aviation. The itemized audit was based on SMS criterions and had revealed that safety culture is a positive ele-ment at Denver International Airport (DIA). DIA possesses the design of safety policy, implementa-tion of safety training, conduction of job hazard analysis and creation of airport safety committee to identify, analyze and mitigate potential hazards (City and County of Denver, 2010). However, some challenges were also recommended such as ascertaining management commitment, improving employee collaboration, elevating the recognition of safety programs, building a no-fault near-miss reporting system, and identifying a better way to collect and disseminate safety information (City and County of Denver, 2010). A key indicator of management’s commitment to safety is the ade-quacy of resources, including financial support and empowerment from the top management (Simon & Cistaro, 2009). Of course, a bottom-up sup-port from union workers is equally critical (Liss & Wagner, 2004). Establishing a management struc-ture, assigning responsibility and accountability, and allocating appropriate resources must be con-sistent with the organization’s stated safety objec-tives (FAA, 2007). The FAA’s recommendation has been echoed by the Society of Petroleum En-gineers (2008) and many others. Discussing safety must begin with the analysis and understanding of an existing culture. Safety is the status of a haz-ard-free condition. Culture is a behavioral norm consisting of beliefs, attitudes, and common val-ues of an organization (Lu, Przetak, & Wetmore, 2005). The culture is more concrete and embraces the structures, practices, controls, and policies that an organization possesses and employs (Reason & Hobbs, 2003). Thus a safety culture is the engine that drives the organization towards the goal of maximum attainable operational safety regardless of any formats of resistances, obstacles and pres-sures.
A positive safety culture instills respect among the employees and managers of the organization
sion, leadership, communication, teamwork, and competency (Ericson, 2005; Vincoli, 1993; Wells & Rodrigues, 2004). Designing a system, includ-ing a safety system, to minimize and anticipate human/operator errors is a priority. To further ad-dress safety, it is extremely important to determine methods to assist operators or workers identify, re-port, and mitigate observed hazards or voluntarily make hazards visible to managers (Bowen & Lu, 2000). This effort needs a positive safety culture supported by the top management people. As top management’s support is a critical component of a successful safety system, knowing how manage-ment prioritizes and leverages available informa-tion or systems to promote additional safety cul-ture improvements is essential (ICAO, 2006; FAA, 2006 & 2007; Wood, 2003).
The Publications of Safety Management Systems (SMS)
In addition to many tailored SMS manuals published by various countries, in the U.S. there are several publications related to SMS that the airport industry can utilize to enhance safety performance. These publications are: 1) Advisory Circular (AC) 150/5200-37 Introduction to Safety Management System for Airport Operators, 2) AC 120-92 Intro-duction to Safety Management Systems for Air Op-erators, 3) ICAO Doc. 9859 Safety Management Manual (SMM), 4) FAA System Safety Handbook (FAA, 2000), and 5) MIL-STD-882D Standard Practice for System Safety. In addition, Purdue University’s previous project (Lu, Bos, Caldwell, 2007) proposed a preliminary SMS model (see Appendix A) to build up the needed safety culture (with four sub-cultures: informed, reporting, just, and learning/adaptive) for airports, air carriers, manufacturers, fix-based operators, traffic control system, regulatory agencies, and higher education institutions.
Building Up the Safety Culture
The Safety Culture “refers to the personal dedi-cation and accountability of individuals engaged in any activity that has a bearing on the safe provi-sion” (FAA, 2005, p.5). “Safety Culture is the set of enduring values and attitudes regarding safety issues, shared by every member of every level of

30 |
overcome before a reporting culture can be fully shaped. The first barrier is the natural attitude of ridicule. The second barrier is the suspicion that the report may go on record and act as a form of potential backlash. The third is skepticism of the data application. If one makes an observation on a weakness, people want to know that manage-ment will respond to the submission. The fourth barrier is resignation, which is a feeling of lack of empowerment or contribution. With this in mind, an effective feedback loop and righteous process must be in place.
A safe culture is a learning (adaptive) culture in which both reactive and proactive measures are used to guide continuous education and wide-reaching system improvements rather than mere local fixes. A learning culture is ineffective with-out reporting, informed, and just cultures so as to acquire current data and monitor past trends that may recur. This culture is always aware of the potential risks and is aware of the past risks asso-ciated with any given procedure (Reason, 1997).
Changing Culture
A culture change is an organizational trans-formation of a company’s beliefs. It involves the changing of values and norms among employees in order to improve productivity, both in military and public sectors. A safety policy should first be adopted to provide a fundamental guideline and blueprint that will be embraced within an organi-zation. A safety policy further defines the organi-zation’s commitment to safety and overall safety vision (ICAO, 2006; FAA, 2006 & 2007). ICAO further requires the identification of an account-able executive from the top executives (an iden-tifiable person having the responsibility for the effective and efficient performance of the organi-zation). This person has the authority to assign resources to fulfill the obligations of the Safety Management System with resources for this SMS leadership position (ICAO SMM, 2009, p.8-4). Implementing a culture change is introspective, so imposing a cultural change in an organization may meet with substantial resistance. It is also essential to commit resources for the long term and to clearly identify a phased implementation approach. Using existing forms, structures, man-power and active roles from the bottom-up within
that operational hazards and errors should be an-ticipated. A safety culture is therefore an informed culture in which administration, management, and front-line employees are aware of the current sta-tus of operation. An informed culture is a known process in which people are familiar with the ele-ments of a company setting such as plans, policies, procedures, guidelines, programs, personnel, pos-sible hazards, and, of course, safety expectations. This informed culture also recursively measures the performance of the safety practice (Reason, 1997; Reason & Hobbs, 2003).
A good safety culture of an organization is also a reporting culture that can only be achieved by creating an atmosphere of trust in which people are willing to divulge their errors as well as near misses. Utilizing the analogy of an iceberg, it has been determined that top management is aware of only about 4% of the significant safety problems, with line managers aware of only 9% and super-visors aware of about 74% (ICAO, 2006). Thus, identifying untold safety deficiencies is essential to having an accurate view of the safety system of an organization. Only by collecting, analyzing, and disseminating information about past events and close calls, can the organization locate where boundaries between safe and unsafe acts originate (Reason & Hobbs, 2003; Lu, Bos, & Caldwell, 2007). In a reporting culture, management needs to implement protection for employees. Also, the process of data collection and analysis, feedback, appreciation, and ease of making a valid report are critical (Reason, 1997; Reason & Hobbs, 2003; Wood, 2003). One must also be on the lookout for overly aggressive reports associated with adverse conditions that are judged fairly.
A culture is a just culture when it agrees and understands the difference between unintentional and intentional acts. Intentional negligence war-rants a punishment approach, while unintentional errors require a non-punitive resolution. The posi-tive recognition in addition to punitive measures should be clearly established to facilitate the growth of a reporting culture and a firm belief of fairness. Creating a trustworthy and just environ-ment will promote safety performance and effica-cy and should be one of the organization’s goals/objectives (DoD, 2000; Lu, Wetmore & Przetak, 2006; Reason, 1997; Reason & Hobbs, 2003). Even with a just culture, there are many barriers to
Safety Culture: Perception of Taiwan’s Aviation Leaders

International Journal of Applied Aviation Studies | 31
as the risk severity provides a resultant safety indi-cation. Risk assessment is used to establish priori-ties for corrective actions, resolutions of identified hazards, and notification to management of the identified and significant risks (DoD, 2000).
Research Question
What is the status of Taiwan’s airport safety culture after the implementation of the ICAO Doc. 9859, FAA AC 150-5200/37 and Civil Aeronautics Administration’s (CAA) safety programs?
The main research question contained 69 sub-questions covering four sub-cultures and four SMS components/pillars (See Appendices B & C).
Merits of the study
A safe airport would provide a better working environment for its employees, tenants such as air-lines, fixed base operators (FBOs), traffic control-lers, business vendors, and of course passengers. Therefore, a periodic safety review of an airport’s safety culture, based on international standards, is merited.
Research MethodologyParticipants
Purposive sample was applied due to the con-venience of data collection and the advanced ex-perience of research participants, namely Key Informants (KIs). A KI is an expert for a specific research area who has been involved in the daily activities within an operational setting. Therefore, the collected data from KIs are deemed creditable. In addition, the authors used Delphi technique which provides respondents the preliminary find-ings for verification in order to gain the reliability of the collected data. Delphi technique is “an in-teractive process to collect and distill the anony-mous judgments of experts using a series of data collection and analysis techniques interspersed with feedback” (Skulmoski, Hartman, & Krahn, 2007, p. 1). The Delphi technique uses a “survey-review-survey” cycle to refine collected data from research participants and finalize the data credit-ability and reliability (Ali, 2005).
the organization could ease some of the resistance (Bos & Lu, 2007; Lu & Asfoor, 2008; Wood, 2003). Meanwhile, management must continue showing strong support for SMS which reinforces safety behaviors to be fully embraced as a norm. Due to Hawthorne Effect (Landsberger, 1958), there could be temporarily increased safety awareness and safety climate simply because the employees are aware of the ongoing supervisor’s involve-ment. A culture cannot be created overnight; thus changing the mindset and behavioral norm would take some time and needs continuous communica-tion between management personnel and employ-ees. What the eyes and ears observe, the mind and heart will gradually follow to get the momentum developed to initiate the cultural change.
The implementation of SMS in an organization has generated benefits. For example, Moncton Flight College (MFC) in New Brunswick imple-mented SMS and has realized a $25,000 annual savings with a 22% reduction in insurance premi-ums along with a significant reduction in regula-tory audit findings. “SMS has been a critical fac-tor in the success of MFC and had a significant influence on the number and size of the training contracts signed” (FAA, 2009). Another way to change safety culture is empowerment which gives responsibility and authority to all and to provide a horizontal safety hierarchy so as to treat every input equal to others (Bos & Lu, 2007). The feel-ing of involvement would motivate users of the SMS to contribute insights to safety performance (Wood, 2003). Some balance needs to be used in development of safety awards and promotional programs in order not to distract production with excessive emphasis on reporting for private recog-nition or gain.
MIL-STD-882 Risk Matrix
The key to developing most risk assessment tools is the characterization of a risk itself by se-verity and probability. The highest system safety precedence is to eliminate hazards by re-designing a system (Petersen, 1988); therefore a risk assess-ment procedure considering only risk severity could generally suffice during the early design phase. When all hazards cannot be eliminated during the early design phase, a risk assessment procedure based upon the risk probability as well
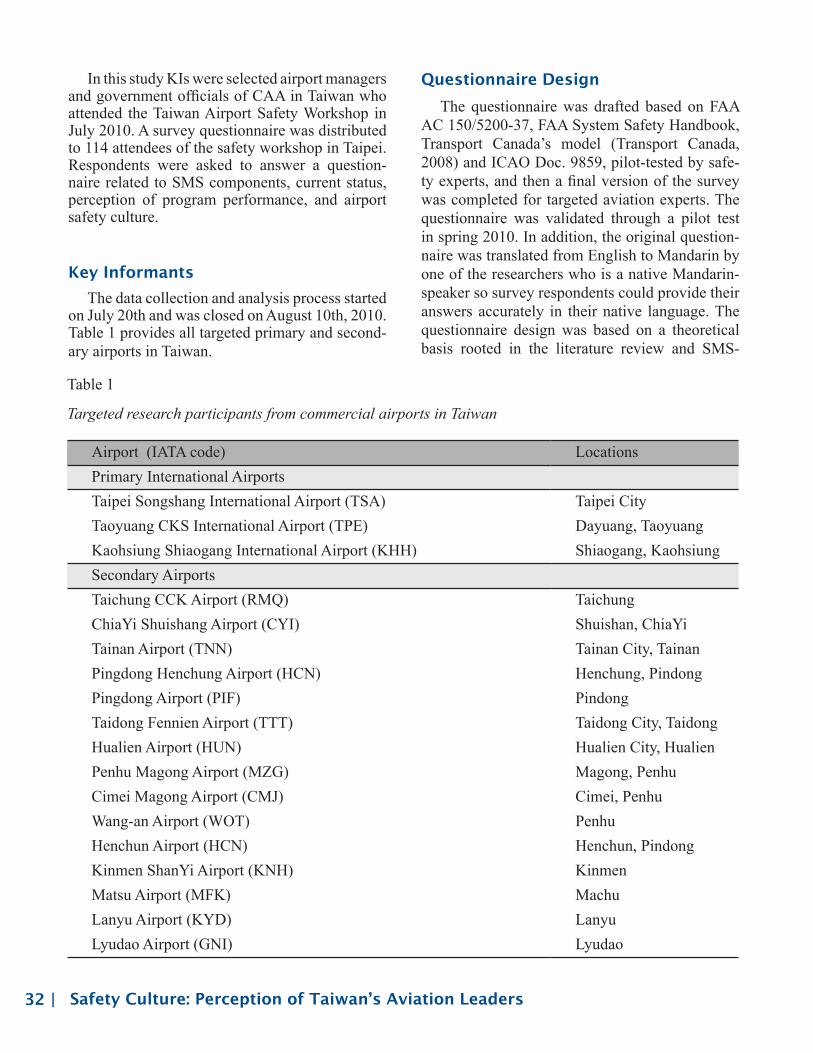
32 | Safety Culture: Perception of Taiwan’s Aviation Leaders
In this study KIs were selected airport managers and government officials of CAA in Taiwan who attended the Taiwan Airport Safety Workshop in July 2010. A survey questionnaire was distributed to 114 attendees of the safety workshop in Taipei. Respondents were asked to answer a question-naire related to SMS components, current status, perception of program performance, and airport safety culture.
Key Informants
The data collection and analysis process started on July 20th and was closed on August 10th, 2010. Table 1 provides all targeted primary and second-ary airports in Taiwan.
Table 1
Targeted research participants from commercial airports in Taiwan
Airport (IATA code) LocationsPrimary International AirportsTaipei Songshang International Airport (TSA) Taipei CityTaoyuang CKS International Airport (TPE) Dayuang, TaoyuangKaohsiung Shiaogang International Airport (KHH) Shiaogang, KaohsiungSecondary AirportsTaichung CCK Airport (RMQ) TaichungChiaYi Shuishang Airport (CYI) Shuishan, ChiaYiTainan Airport (TNN) Tainan City, TainanPingdong Henchung Airport (HCN) Henchung, PindongPingdong Airport (PIF) PindongTaidong Fennien Airport (TTT) Taidong City, TaidongHualien Airport (HUN) Hualien City, HualienPenhu Magong Airport (MZG) Magong, PenhuCimei Magong Airport (CMJ) Cimei, PenhuWang-an Airport (WOT) PenhuHenchun Airport (HCN) Henchun, PindongKinmen ShanYi Airport (KNH) KinmenMatsu Airport (MFK) MachuLanyu Airport (KYD) LanyuLyudao Airport (GNI) Lyudao
Questionnaire Design
The questionnaire was drafted based on FAA AC 150/5200-37, FAA System Safety Handbook, Transport Canada’s model (Transport Canada, 2008) and ICAO Doc. 9859, pilot-tested by safe-ty experts, and then a final version of the survey was completed for targeted aviation experts. The questionnaire was validated through a pilot test in spring 2010. In addition, the original question-naire was translated from English to Mandarin by one of the researchers who is a native Mandarin-speaker so survey respondents could provide their answers accurately in their native language. The questionnaire design was based on a theoretical basis rooted in the literature review and SMS-

International Journal of Applied Aviation Studies | 33
related documents published by ICAO, the U.S. FAA, and Transport Canada in addition to FAA AC 120-92, AC 150/5200-37, VC Order 8000.1, VC Order 8000.367 leading to the safety culture check-lists developed by Purdue University researchers. Comments and answers from airport managers and tenants were stored in a secured database using Purdue University’s QUALTRIICS online survey and data analysis system (see Appendix B).
The research activities include the investigation of an airport’s SMS implementation results regard-ing:
SMS gap analysis per ICAO/FAA or man-1. datory contents from local government
SMS airport policy and mission2.
SMS internal publication(s) and manual(s)3.
SMS ongoing hazard report(s) and manage-4. ment
SMS risk analysis, format(s), and 5. mechanism(s)
SMS audit standard(s) and assurance 6. study(ies)
SMS educational/training program(s)7.
SMS continuous system and sub-system 8. quality assurance
SMS networking and information sharing 9. means
SMS safety culture evaluation tool(s)10.
SMS recurrent seminar(s), meeting(s), and 11. conference(s)
SMS safety award program(s)12.
SMS committee setting13.
SMS collaborative effort and synergy with-14. in the company
Findings
In order to accurately report the survey results, the research findings followed the questions listed on the questionnaire (both in English and Manda-
rin). There were two components of this section: 1) findings that needed a follow-up study and 2) find-ings that reflected a positive safety culture. Due to the lengthy narrative, this report provides the top 10 safety concerns and the top 10 indicators of pos-itive perceptions of the safety culture.
Basic Information
A majority of survey respondents (80%) were from three primary commercial airports, namely Taipei Songshang International Airport, Taoyuang CKS International Airport and Kaohsiung Interna-tional Airport. Overall, 39% of respondents held management positions from airports, airlines, and government. With the assistance from Flight Safe-ty Foundation―Taiwan and Civil Aeronautics Ad-ministration the respondent rate was 56.1%. Delphi technique was used to gain the research reliabil-ity and creditability, therefore, on September 15, 2010, the initial analytical finding was sent back to Taiwan and was distributed to research participants for their further comments. A QUALTRICS survey was prepared for additional comments, and the online commenting mechanism was closed on Oc-tober 20, 2010. Additional comments had resulted in some wording changes per se but no significant comments had altered the initial findings.
Top 10 cultural items recommended for follow up study
Table 2 provides the results of the top 10 concerns regarding airport safety culture, while Appendix C presents additional ranking results as-sociated with other questions.
Additional comments regarding respondents’ safety concerns are as follows (translated from Mandarin to English):
Strengthening jet bridge maintenance. Bro-• ken jet-bridge should not happen again which affects the national image.
I am worried about airport Foreign Object • Damage (FOD) events and jet bridge fail-ure.

34 | Safety Culture: Perception of Taiwan’s Aviation Leaders
We have a preventive data analysis but not • proactive. Currently, it is more like a reac-tive system.
My airport will be privatized. If my air-• port employs too many foreign low-quality workers, safety could be affected.
X-ray machine’s effectiveness is problem-• atic. Security personnel quality is also ques-tionable. Alternative/backup security mea-sures should be in place once the system is defective.
The training and understanding of airport • security must be enforced.
I am worried about apron, worker and air-• craft safety.
Regardless of a professional decision-mak-• ing capability, political involvement, un-realistic purchasing budget, and top-down enforcement do happen. As a result, the government must take the responsibility if any undesired events happen.
Political influence and media distortion • about the airport safety status is a concern.
Outdated and high failure rate of the equip-• ment. Maintenance standard and schedule do not meet the current mandatory require-ment.
Table 2
Top 10 airport safety culture concerns
Rank Questions Concern %
1 “I feel top down pressure from top man-agement” 81% respondents agree with the statement
2 “My airport values my hazard reports” 68% respondents do not support the statement
3 “I have used airport hazards reporting system” 67% respondents do not support the statement
4 “I am worried about the quality of air-port managers”
65% respondents were worried about the quality of airport managers
5 “My airport accepts occasional mis-takes” 64% respondents do not support the statement
6“My airport promptly adopts new safe-ty standards without going through the lengthy bureaucratic process”
63% respondents do not support the statement
7 “My airport provides sufficient safety education” 62% respondents do not support the statement
8“Airport management cares about man-power and organizational accident is-sues”
61% respondents do not support the statement
9 “I believe that whistle blowers can be protected” 60% respondents do not support the statement.
10 “I am worried about airport safety train-ing facilities”
58% respondents do worry about airport safety training facilities.

International Journal of Applied Aviation Studies | 35
Please provide more safety education and • training to staffs. Staffs must clearly under-stand their own safety responsibility and role.
Findings that Reflect Positive Indicators for Future Safety Culture Change in Taiwan
While the safety culture survey reflected short-falls and areas needing an improvement in the pre-vious section, there were also findings that were plausible and need to be maintained (see Table 3).
A high turnover rate on the top manage-• ment would weaken the managerial perfor-mance.
Airport managers need more safety educa-• tion and training.
Top management must receive training • (safety and management). Policymaking cannot be controlled by the media or press. We should focus on safety performance and efficiency. A long term safety investment is needed.
Table 3
Top 10 positive indicators on airport safety culture change
Rank Issues Positive indicator %
1“Government must protect the whistle blowers using the hazard reporting sys-tem”
95% respondents support the statement
2“Airport safety tasks must be assigned to a person with quality and experience and be provided compatible stipend”
95% respondents support the statement
3 “Mission is more important than airport safety”
94% respondents do NOT support the state-ment
4 “A hazard reporting system would benefit an airport’s long term development” 94% respondents do support the statement
5 “I support the hazard reporting system at my airport” 94% respondents do support the statement
6 “Safety analysis must include proactive data and reactive data”
92% respondents do support the posted state-ment
7 “Erroneous decision-making could lead to undesired events”
90% respondents do support the posted state-ment
8“An effective airport safety management depends on an effective data collection, analysis, and information distribution”
89% respondents do support the posted state-ment
9 “Occasional mistakes must be mitigated immediately” 89% respondents do support the statement
10 “My airport has a long-term plan for safety education” 89% respondents support the statement
Additional safety culture perceptions are presented in Appendix D.

36 |
Removing organizational accidents was an 6. important task which needed an immedi-ate solution. However, the lengthy bureau-cratic process/red-tape did concern most respondents.
More than half of the respondents (54%) 7. noted that airport safety culture was not good.
The recent jet-bridge accident at a major 8. airport had triggered an intensive investi-gation and the media closely scrutinized an airport’s operational safety. As a result, political influence could have outweighed professional recommendations regarding the decision-making process.
There were other concerns related to an air-9. port’s operational safety including outdated equipment, foreign object damage (FOD) cases, high turnover rate of the top manage-ment personnel, lack of safety education to top management and staffs, poor airport security mechanisms, unclear non-punitive policy, and unqualified airport workers.
There were also some positive findings related to airport safety. They were:
Airport safety-related meetings were peri-1. odically held and represented by different sectors of the airport system including proj-ect contractors.
Respondents agreed that erroneous de-2. cision-making could lead to undesired events.
Safety data collection (proactive) was es-3. sential and critical to a safe airport opera-tion.
Airport authorities did possess sufficient 4. safety budgets.
Respondents indicated that being assigned 5. with a safety related job was an honor and appointed safety inspectors must show qual-ity and experience and should be awarded a compatible stipend.
Safety Culture: Perception of Taiwan’s Aviation Leaders
Analysis
Purdue University’s QUALTRICS system pro-vided additional analytical functions, such as cross-tabulation analysis. This analysis showed that:
From the perception of respondents, airport 1. management personnel did not effectively support safety programs or allocate suffi-cient resources to accomplish determined safety goals. A proactive fashion of hazard collection was lax and decision-making processes needed to be improved. Thus, a process to resolve the prioritized potential hazards for a more cost-effective safety in-vestment is urgently needed.
Safety training curricula, facilities, edu-2. cation and the quality of newly hired em-ployees and managers were critically con-cerned.
Unintentional mistakes were not acceptable 3. and could be punished which would dis-courage reporting of hidden hazards. Mean-while, the airport policy did not fully en-courage safety comments or clearly define an unintentional mistake, which reflected the low usage of the hazard reporting sys-tem.
There were 31% of respondents who were 4. not aware of the existence of the airport hazard reporting system. Even if 69% re-spondents had recognized the existence of a hazard reporting system, 67% respondents did not use it. The reason may be that most respondents did not believe that: 1) the whis-tle blower of the reporting system could be protected, 2) the hazard report system was confidential, and 3) the investigation pro-cess of a reported hazard was investigated fairly. Because most respondents did not trust the reporting system, the situation may have led to the lack of usage of the safety information, alerts or notices.
Top down managerial pressure did exist 5. which could reflect the resistance of using a hazard reporting system.

International Journal of Applied Aviation Studies | 37
Recommendations
This study revealed the perceived status of safe-ty culture in Taiwan’s airport system as of August 2010. In this section, the authors categorized and summarized the previous findings using the four safety sub-cultures and the four pillars of SMS to yield the following recommendation list.
Reporting culture ― Database expansion 1. and analysis is needed so a more cost-ef-fective safety investment can be forged. The non-punitive policy must be clear to all employees.
Informed culture ― Hazard reports must 2. be encouraged because these support a feeling of contribution and recognition by the contributors and facilitate the data col-lection. A periodic summary report must be distributed to airport employees so they can be aware of the safety concerns, standards, priority and performance objectives.
Just culture ― The hazard reporting system 3. must be a trusted, confidential, and anony-mous. The immunity policy associated with unintentional behaviors must be passed and promoted by the government so as to en-courage and collect more hazard reports as well as safety suggestions.
Adaptive and learning culture ― Promot-4. ing a proactive hazard collection system to airport employees and initiating an orienta-tion regarding the current hazard reporting system and possible benefits is important. The benefit of using the hazard report-ing system cannot be limited to front line workers, but also needs to be extended to top management personnel.
Policy ― Most respondents did not trust the 5. reporting system. Thus most of them did not use the system leading to the ignorance of safety information, alerts and notices. Top management’s support must be visible and physically tangible to airport workers. The lengthy bureaucratic red-tape should be avoided if safety issues are involved.
Mission and airport safety may encounter 6. conflicts but most respondents believed that safety should be the priority.
When choosing to use the hazard reporting 7. system, most respondents were not worried about peer pressure. They also believed that the hazard report would not damage group harmony. They believed that the hazard re-porting system would benefit an airport’s long term development.
Most respondents made mistakes. They also 8. supported a hazard reporting system but government must protect the whistle blower of a hazard reporting system. Also the haz-ard reporting system must be confidential so they could feel more confident to report their own errors.
Most respondents agreed that safety edu-9. cation was a long term effort and lessons learned from events were very useful for them to improve safety. They also adopted new safety guidelines and standards prompt-ly vis-à-vis the manner of the top manage-ment personnel.
Most respondents understood the difference 10. between an intentional and unintentional act. Thus, most of them accepted discipline, including punishments, when an undesired event was due to an intentional act. Interest-ingly, most respondents believed that a large amount of reported hazards were uninten-tional mistakes.
Risk Matrix had been utilized by airports 11. to judge reported hazards so proper safety measures could be enacted.
Although some undesired events happened 12. and outdated equipment did exist, most re-spondents believed airport equipment and facilities were currently functional. But a backup system was recommended.

38 |
airports in Taiwan. Through a third-party assess-ment, Taiwan’s aviation administration agency was able to identify the performance gaps of SMS implementation from the experts’ perceptions of the current safety culture. This study simultane-ously identified the airports’ readiness, achieve-ment and/or difficulties needing the government’s assistance per international criterions. With this information, Taiwan’s Civil Aeronautics Admin-istration can prioritize resources for a more cost-effective safety investment. In all, airports and government oversight systems must closely col-laborate in order to mitigate misunderstandings and achieve an acceptable level of safety within available time and financial resources.
Follow-Up Study
In order to continuously support Taiwan’s airport community in improving its safety culture after implementing SMS, a tangible, creditable, and reliable international research network must be formed to approach these safety goals. Furthermore, this process is applicable to many high consequence entities. Therefore, a similar safety study should be considered for other transportation industries developing safety management systems and safety culture.
References
Ali, A. K. (2005). Using Delphi technique to search for empirical measures of local planning agency power. The Qualitative Report, 10(4), 718-744.
Bos, P. & Lu, C-t. (August/September, 2007). Safety management systems: A primer. AAAE Airport Magazine, 44-48.
Bowen, B., & Lu, C-t. (Oct. 2000). Advocating the implementation of an airline safety in-formation system. Public Works Manage-ment & Policy, 5(2), 91-96.
Safety Assurance ― A two-way communi-6. cation channel must be established between management level and front line supervi-sors in order to minimize any conflict be-tween mission and safety emphasis. While periodic safety audits are useful, effective communication supports continuous safety compliance and assurance.
Risk management ― Recent incidents, 7. such as the collapsed jet-bridge and traffic controller’s carelessness at an airport, do reflect the lack of a proactive risk analysis, education and control. Any undesired events cause the media’s attention. It is highly rec-ommended that the airport administration or government agency strengthen the role of public relations personnel in order to properly deal with the media and the law makers.
Safety promotion ― Reducing FOD cases, 8. improving ground/apron operation safety, creating a redundant airport security mech-anism, enforcing safety policy, and em-ploying more qualified, educated workers would reduce potential hazards associated with an airport’s operation.
As part of the safety knowledge associated with upper-level airport managers, an advanced recruitment program should be established. Also, a malleable and pedagogical method to provide safety education, skills and appropriate attitudes toward safety awareness and implementation is needed. Several programs are available through the American Association of Airport Executives (AAAE), International Air Transportation As-sociation (IATA), Airport Council International (ACI), and International Civil Aviation Organiza-tion (ICAO).
Conclusion
This study surveyed Taiwan’s aviation (airport and airline) leaders’ perceptions about the cur-rent status of safety culture at major commercial
Safety Culture: Perception of Taiwan’s Aviation Leaders

International Journal of Applied Aviation Studies | 39
Lu, C-t, Przetak, R., & Wetmore, M. (June 2005). Discovering the non-flight hazards and suggesting a safety training model. Inter-national Journal of Applied Aviation Sci-ence, 5(1), 135-152.
Lu, C-t., Wetmore, M., & Przetak, R, (Oct., 2006). A new approach to enhance airline safety: Using system safety techniques. Journal of Air Transportation, 11(2), 113-139.
Lu, C-t., Bos, P., & Caldwell, W. (2007). System safety application: Constructing a com-prehensive aviation system safety man-agement model (ASSMM). International Journal of Applied Aviation Studies, 7(1), 28-45.
Orlady, H. W., & Orlady, L. M. (1999). Human factors in multi-crew flight operations. Brookfield, VT: Ashgate.
Petersen, D. (1988). Safety management: A human approach (2nd ed.). Goshen, NY: Al-oray.
Piers, M., Montijn, C., & Balk, A. (March, 2009). Safety culture framework for the ECAST SMS-WG. European Strategic Safety Ini-tiative. Safety Management System and Safety Culture Working Group (SMSWG). Cologne, Germany: European Aviation Safety Agency.
Reason, J. (1997). Managing the risks of organi-zational accidents. Burlington, Vermont: Ashgate.
Reason, J., & Hobbs, A. (2003). Managing main-tenance error. Burlington, VT: Ashgate.
Simon, S. I., & Cistaro, P.A. (April 2009). Trans-forming safety culture: Grassroots-led/Management-supported change at a major utility. Professional Safety, 54(4), 28-35.
Skulmoski, G.J., Hartman, F.T., & Krahn, J. (2007). The Delphi method for graduate research. Journal of Information Technol-ogy Education, 6, 1-21
Transport Canada (2008). Score your safety cul-ture. Publication TP 13844. Canada: Au-thor.
City and County of Denver (August 2010). De-partment of Aviation Safety Culture per-formance audit. Denver: CO: Office of the Auditor, City and County of Denver.
Dept. of Defense (2000). MIL-STD-882D Standard practice for system safety. Washington, D.C.: Author.
Ericson, C.A., III (2005). Hazard analysis tech-niques for system safety. Hoboken, NJ: Wi-ley & Sons.
FAA. (1996). FAA Order 8040-4 Safety risk man-agement. Author.
FAA (2000). System safety handbook. Washington, DC: Author.
FAA. (2004). Safety Management System Manual. Washington, DC: FAA.
FAA. (2006). AC 120-92 Introduction to safety management systems for air operators. Washington, DC: FAA.
FAA. (2007). Introduction to safety management systems (SMS) for airport operators. (NTIS No. DOT/FAA/AC150-5200-37) Washing-ton DC: U.S. Government Printing Office.
ICAO. (2006). ICAO Doc 9859 Safety management manual (SMM). Montreal, Canada: ICAO.
ICAO. (2009). ICAO Doc 9859 Safety manage-ment manual (SMM) (2nd ed.). Montreal, Canada: ICAO.
Landsberger, H. A. (1958). Hawthorne revisited: Management and the worker, its critics, and developments in human relations in indus-try. Cornell Studies in Industrial and Labor Relations, (9). Ithaca Cornell University.
Liss, H. J., & Wagner, R. J. (2004). GE’s crash course in cultural change. Retrieved on July 10, 2010 from http://www.culturechange.com/GEJan2005.pdf
Lu, C-t., & Asfoor, M. (2008). Validating the SMS for airport management – Gap analysis. Paper submitted to FAA Airport Design Competition 2008.
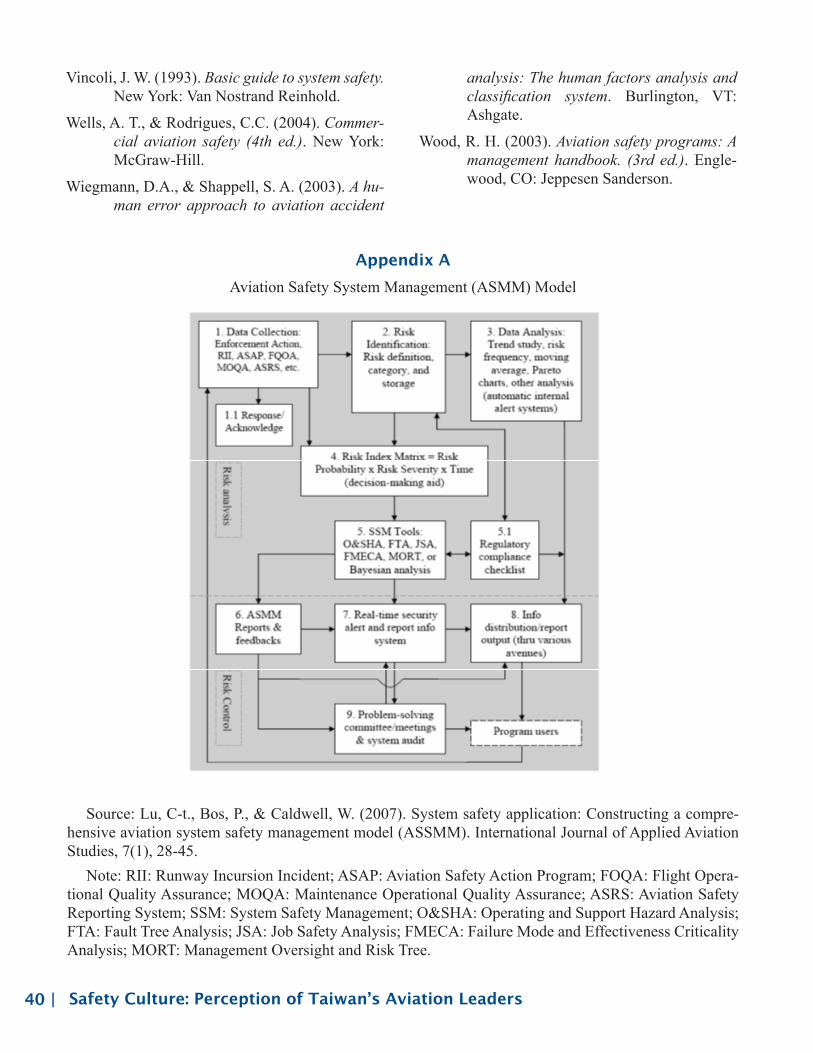
40 |
analysis: The human factors analysis and classification system. Burlington, VT: Ashgate.
Wood, R. H. (2003). Aviation safety programs: A management handbook. (3rd ed.). Engle-wood, CO: Jeppesen Sanderson.
Vincoli, J. W. (1993). Basic guide to system safety. New York: Van Nostrand Reinhold.
Wells, A. T., & Rodrigues, C.C. (2004). Commer-cial aviation safety (4th ed.). New York: McGraw-Hill.
Wiegmann, D.A., & Shappell, S. A. (2003). A hu-man error approach to aviation accident
Safety Culture: Perception of Taiwan’s Aviation Leaders
Appendix A
Aviation Safety System Management (ASMM) Model
Source: Lu, C-t., Bos, P., & Caldwell, W. (2007). System safety application: Constructing a compre-hensive aviation system safety management model (ASSMM). International Journal of Applied Aviation Studies, 7(1), 28-45.
Note: RII: Runway Incursion Incident; ASAP: Aviation Safety Action Program; FOQA: Flight Opera-tional Quality Assurance; MOQA: Maintenance Operational Quality Assurance; ASRS: Aviation Safety Reporting System; SSM: System Safety Management; O&SHA: Operating and Support Hazard Analysis; FTA: Fault Tree Analysis; JSA: Job Safety Analysis; FMECA: Failure Mode and Effectiveness Criticality Analysis; MORT: Management Oversight and Risk Tree.

International Journal of Applied Aviation Studies | 41
Appendix B
Safety Culture Survey Questions
The following items are genuine components of the ICAO-FAA Safety Management System (SMS) that will guide an airport to meet the basic international standard. Please click on the item(s) that your airport currently possess and operate. In-dicate your level of agreement using the scale of 1 through 5 where « 1 » represents Strongly Dis-agree and « 5 » Strongly Agree. Your responses will remain confidential and be stored in a secu-rity-enacted database. The data will be used only for the analysis of this study. Thank you for your assistance in completing this survey and for im-pacting the safety awareness of the global aviation community.
(5) Strongly Agree
(4) Agree (3) Fair (2) Dis-agree
(1) Strongly Disagree
Airport top management are committed to • enhancing airport safety, and provide ad-equate resources to achieve this goalAirport safety meeting is always the prior-• ity at a meetingAirport safety meeting is always held on a • regular basisAirport management conducts a thorough • understanding of the airport incident, les-sons learned, as a whole airport reformThe unintentional cause of the accidents • does not receive punishmentAirport executives actively (proactively) • maintain airport safety (such as found fre-quent minor errors and remove it)Airport top management’s decision-making • errors can lead to accidentsHigh-level decision-makers invest inten-• sive efforts to reduce errorsI believe that the organizational factors • (training equipment, understaffed, not con-tinuous training, poor airport design, etc.) can lead to accidents
I believe that the organizational factors • (training equipment, understaffed, incom-plete training) are easier to improveAirport executives understand the orga-• nizational factors in the event (training equipment, insufficient training) are easier to improveAn effective management of airport safety • depends on the collection, analysis and dis-semination of relevant safety informationSafety data analysis must be combined • with active (proactive) and passive (reac-tive) data meansI am positive that my airport collect safety • dataMy airport will identify important safety • indicators in advance then provides reme-dial measures.I am worried about airport safety training • facilitiesI am worried about airport safety training • courseI am worried about airport safety budget• I am worried about the quality of airport • worker selectionsI am worried about the quality of the airport • managersAirport Safety Committee representatives • are from different sectors (airlines, airports, etc.) of an airportAirport contractors must participate in • safety meetingsAssigned to an airport safety-related work • (e.g.: safety management inspection) is an honorAnd airport safety-related work assignment • must be based on adequate experience, quality and gain relative stipendMission and airport safety may conflict• I think airport safety is as important as the • mission
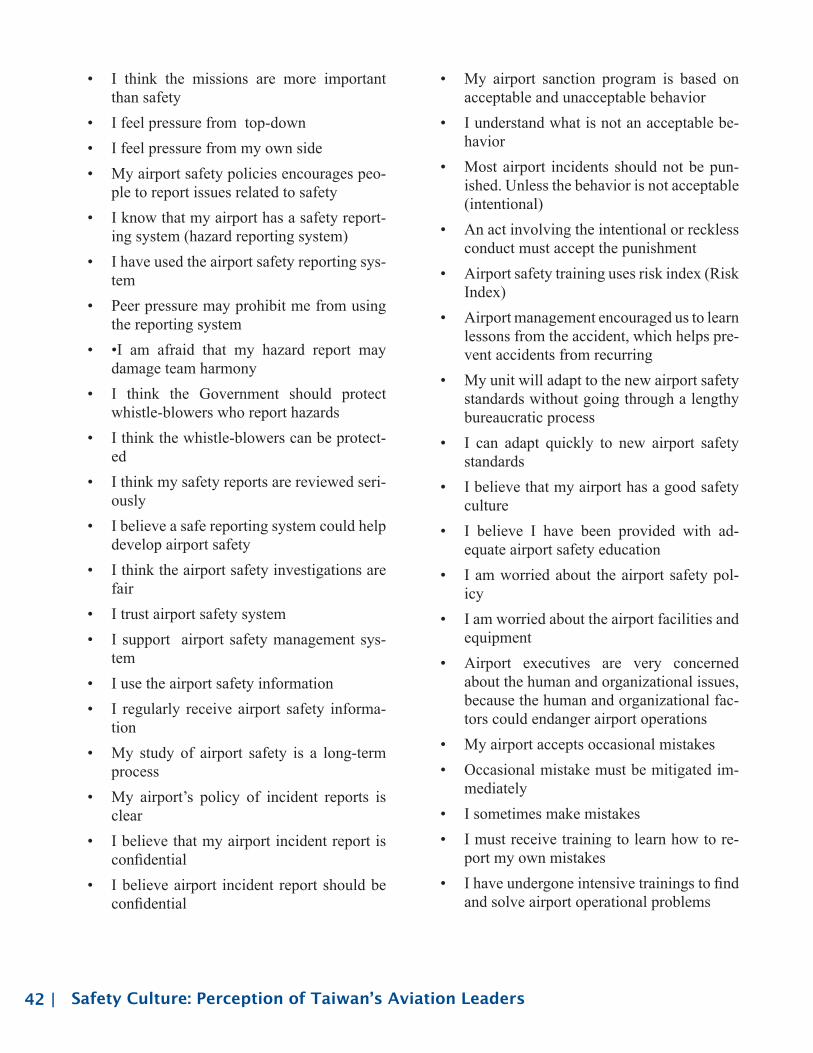
42 |
My airport sanction program is based on • acceptable and unacceptable behavior I understand what is not an acceptable be-• havior Most airport incidents should not be pun-• ished. Unless the behavior is not acceptable (intentional)An act involving the intentional or reckless • conduct must accept the punishmentAirport safety training uses risk index (Risk • Index)Airport management encouraged us to learn • lessons from the accident, which helps pre-vent accidents from recurringMy unit will adapt to the new airport safety • standards without going through a lengthy bureaucratic processI can adapt quickly to new airport safety • standardsI believe that my airport has a good safety • cultureI believe I have been provided with ad-• equate airport safety educationI am worried about the airport safety pol-• icy I am worried about the airport facilities and • equipmentAirport executives are very concerned • about the human and organizational issues, because the human and organizational fac-tors could endanger airport operationsMy airport accepts occasional mistakes• Occasional mistake must be mitigated im-• mediatelyI sometimes make mistakes• I must receive training to learn how to re-• port my own mistakesI have undergone intensive trainings to find • and solve airport operational problems
I think the missions are more important • than safety I feel pressure from top-down • I feel pressure from my own side• My airport safety policies encourages peo-• ple to report issues related to safetyI know that my airport has a safety report-• ing system (hazard reporting system)I have used the airport safety reporting sys-• temPeer pressure may prohibit me from using • the reporting system•I am afraid that my hazard report may • damage team harmonyI think the Government should protect • whistle-blowers who report hazardsI think the whistle-blowers can be protect-• edI think my safety reports are reviewed seri-• ouslyI believe a safe reporting system could help • develop airport safetyI think the airport safety investigations are • fairI trust airport safety system• I support airport safety management sys-• temI use the airport safety information• I regularly receive airport safety informa-• tionMy study of airport safety is a long-term • processMy airport’s policy of incident reports is • clearI believe that my airport incident report is • confidentialI believe airport incident report should be • confidential
Safety Culture: Perception of Taiwan’s Aviation Leaders

International Journal of Applied Aviation Studies | 43
Appendix C
Airport Safety Culture Concerns
Rank Issue * Concern %11 “I am worried about the quality of airport
employees” 57% respondents were worried about the quality of airport employees.
12 “A reported hazard is confidential at my airport”
56% respondents do not support the statement.
13 “My airport prioritizes safety issues and mitigates them accordingly”
55% respondents do not accept the posted state-ment.
14 “I receive airport safety information peri-odically”
55% respondents do not support the statement.
15 “I use the hazard reports” 54% respondents do not support the statement.16 “My airport has a good safety culture” 54% respondents do not support the statement.17 “Airport management proactively main-
tains airport safety by frequently discover-ing and mitigating small errors and mis-takes”
53% respondents do not accept the posted state-ment.
18 “I am worried about airport safety training curriculum”
53% respondents were worried about airport safety training curriculum.
19 “My airport collects proactive safety data”
52% respondents do not accept the posted state-ment.
20 “Top management believes that organiza-tional factors (lack of safety equipment, personnel, training, airport design etc.) are easier to be corrected”
52% that do not accept the posted statement.
21 “After an accident investigation, personal unintentional acts are not punished”
49% respondents do not accept the posted state-ment.
22 “The investigation of a reported hazard is systemic and fair”
47% respondents do not support the statement.
23 “Airport management investigates any un-desired events and adopts lessons learned to improve safety”
43% respondents do not accept the posted state-ment
24 “I believe that organizational factors (lack of safety equipment, personnel, training, airport design etc.) are easier to be cor-rected”
43% respondents do not accept the posted state-ment.
25 “The pressure is from myself” 43% respondents do not support the statement.26 “The immunity policy of accidents or inci-
dents at my airport is very clear” 41% respondents do not support the statement.
27 “Top management actively reduces erro-neous decision-making”
39% respondents do not accept the posted state-ment.

44 | Safety Culture: Perception of Taiwan’s Aviation Leaders
Rank Issue * Concern %28 “The top management has closely involved
to promote airport safety and invested suf-ficient resources to achieve the determined safety goals”
37% respondents do not accept the posted state-ment.
29 “I trust the hazard reporting system at my airport”
37% respondents do not support the statement
30 “I know that there is a hazard reporting system at my airport”
31% respondents do not support the statement.
31 “Airport safety policy encourages us to provide safety comments”
31% respondents do not support the statement
32 “Airport safety related meetings are al-ways a priority on the meeting agenda”
31% respondents do not accept the posted state-ment.
Appendix D
Positive Airport Safety Culture Indicators
Rank Issue * Indicators (%)11 “I know sometimes, I make mistakes” 87% respondents do support the statement12 “I must be trained well to discover prob-
lems and solve them”87% respondents do support the statement
13 “I must be trained well to report my own errors”
86% respondents do support the statement
14 “Airport safety meetings are represented by different sectors of airport employees”
86% respondents support the statement
15 “Intentional mistakes must be pun-ished”
85% respondents do support the statement
16 “Airport project contractors must attend safety meetings”
84% respondents support the statement
17 “Being assigned with safety related jobs is an honor”
84% respondents support the statement
18 “Airport safety related meetings are regularly conducted”
80% respondents support the statement
19 “My airport use Risk Matrix to judge a reported hazard”
80% respondents support the statement
20 “Airport management encourages me to learn from errors including my own mis-takes”
80% respondents support the statement
21 “I understand the difference between an intentional and unintentional act”
79% respondents support the statement
22 “A reported hazard must be kept confi-dentially”
79% respondents support the statement

International Journal of Applied Aviation Studies | 45
Rank Issue * Indicators (%)23 “Most reported hazards are unintention-
al”74% respondents support the statement
24 “Mission completion and airport safety may encounter conflicts”
73% respondents support the statement
25 “Mission completion and airport safety are equally important”
73% respondents support the statement
26 “I can promptly adopt new safety stan-dards”
72% respondents do support the statement
27 “The punishment policy at my airport is based on intentional or unintentional acts”
71% respondents do support the statement
28 “I am worried about airport safety train-ing budget”
69% respondents do NOT worry about airport safety training budget.
29 “My hazard report may damage group harmony”
68% respondents do NOT support the state-ment
30 “Peer pressure may prohibit me from using the hazard reporting system”
66% respondents do NOT support the state-ment
31 “I am worried about airport safety pol-icy”
63% respondents do NOT support the state-ment
32 “I am worried about airport equipment and facilities”
43% respondents do NOT support the state-ment
* The percentage was a combination from “Strongly Agree” and “Agree”

46 | Safety Culture: Perception of Taiwan’s Aviation Leaders

International Journal of Applied Aviation Studies | 47
Re-estimating and Remodeling General Aviation
Operations
Ryan Black and Justin R. Chimka
University of Arkansas
Author Note
This material is based upon work supported by the U.S. Department of Homeland Security under Award Number: “2008-ST-061-TS0003.” The views and conclusions contained in this docu-ment are those of the authors and should not be interpreted as necessarily representing the official policies, either expressed or implied, of the U.S. Department of Homeland Security.
Abstract
Models previously created by GRA, Inc. for the Federal Aviation Administration to estimate total annual operations by general aviation (GA) airports have been recreated and examined by the authors. Models were originally estimated by GRA to predict the future size of airports, but research described here would go toward detection of un-usual GA activity that might be due to a homeland security threat. Toward this end, the authors have systematically discovered a statistical model of GA operations that is more efficient than what the literature describes.
Re-estimating and Remodeling General Aviation Operations
Since September 11, many steps have been tak-en to improve security against attacks on commer-cial aviation, but relatively little has been done to secure general aviation (GA). One reason for the security gap is that GA operates differently than the commercial aviation industry making it difficult to borrow improvements. Another reason for lower GA security standards is that many people did not perceive GA as a serious threat, since planes carry much less fuel and are much smaller than their commercial counterparts. However, in February 2010 a suicide attacker crashed a single-engine plane onto an Austin IRS building killing one em-ployee and injuring thirteen others. “Thousands of civilian aircraft fly within the general aviation system every day. But there are few regulations, laws, or security procedures that would prevent a pilot with ill intentions from using a plane for evil purposes (Lubold, 2010).”
To accommodate the need for improved GA security, one goal should be to integrate a vari-ety of relevant data formats, “and transform raw data into useful and understandable information that enables productive and efficient analysis (IDS University Affiliate Center for Multimodal Infor-mation Access and Synthesis).” Our objective is to understand the variation associated with usual GA activity and operations, so unusual activity can be detected, analyzed, and resolved. General
48 |
techniques include estimation and design of rele-vant statistical model-based quality control charts. This opportunity to specialize in model-based con-trol for an applied context should eventually result not only in contributions to GA security but also to quality engineering. The research described here improves upon previously existing models of GA operations data and would make possible improved monitoring and detection for GA security.
Motivation
The Homeland Security Advisory Council’s publication Top Ten Challenges Facing the Next Secretary of Homeland Security includes the fol-lowing: “Continue to improve intelligence and in-formation sharing (Homeland Security Advisory Council, 2008).” However, while the University Affiliate Centers to the Institute for Discrete Sci-ences (IDS) were established by Department of Homeland Security (DHS) for advanced methods research in information analysis, IDS activities fo-cus on common author identification, influenza sur-veillance, and text analysis. What is described here is part of ongoing activities that will adopt and/or develop tools to derive knowledge specific to po-tential attacks against general aviation (GA). Ad-ditional activities would extend regression models of GA operations to the most appropriate of other contexts chosen among highway, maritime trans-portation systems, mass transit, pipeline systems, and rail.
Commercial examples relevant to GA include Incident Reports and Surveillance Detection Re-ports filed by Federal Air Marshals (FAM) and analyzed by law enforcement organizations in a Tactical Information Sharing System (TISS). FAM also place in TISS incident reports by airline em-ployees, and the Screening Passengers by Observa-tion Techniques (SPOT) program identifies unusual activity by utilizing behavioral analysis.
In the GA domain, the Transportation Security Administration (TSA) and the Aircraft Owners and Pilots Association have implemented an Airport Watch Program using pilots for reporting suspi-cious activity. TSA and the National Response
Center (U.S. Coast Guard) have implemented the GA Hotline for airport operators, technicians, and pilots to report suspicious activity. However, there are not more formal information reporting and sharing systems available to GA. In order to design such effective systems, and make GA a more equal partner in homeland security, the following would seem to be important exploratory activities.
Consider what is relevant about commercial 1. examples to GA and make recommenda-tions for improved intelligence and informa-tion sharing which originates at GA landing facilities.
Reference the Airport Characteristics Mea-2. surement Tool (Transportation Security Administration, 2004) to develop report-ing standards and analyze information that would come from reports.
Estimate and/or identify models of usual 3. GA activity that could be used to detect po-tential attacks.
Extend the philosophy that if we can esti-4. mate good models of usual activity associ-ated with transportation, then we can effec-tively monitor operations and detect unusual activity that may indicate a security threat.
Identify the other (in addition to GA) con-5. texts that make the most sense physically for extension of lessons learned from GA. These would seem to be the ones to be most likely affected by unscheduled activity.
Explore the concept of a simultaneous, 6. multi-context monitor that would integrate not only information from disparate sources within mode but also information across modes to enhance transportation security.
The research described here is most relevant to exploratory activity 3. Estimate and/or identify models of usual GA activity that could be used to detect potential attacks.
General Aviation Operations
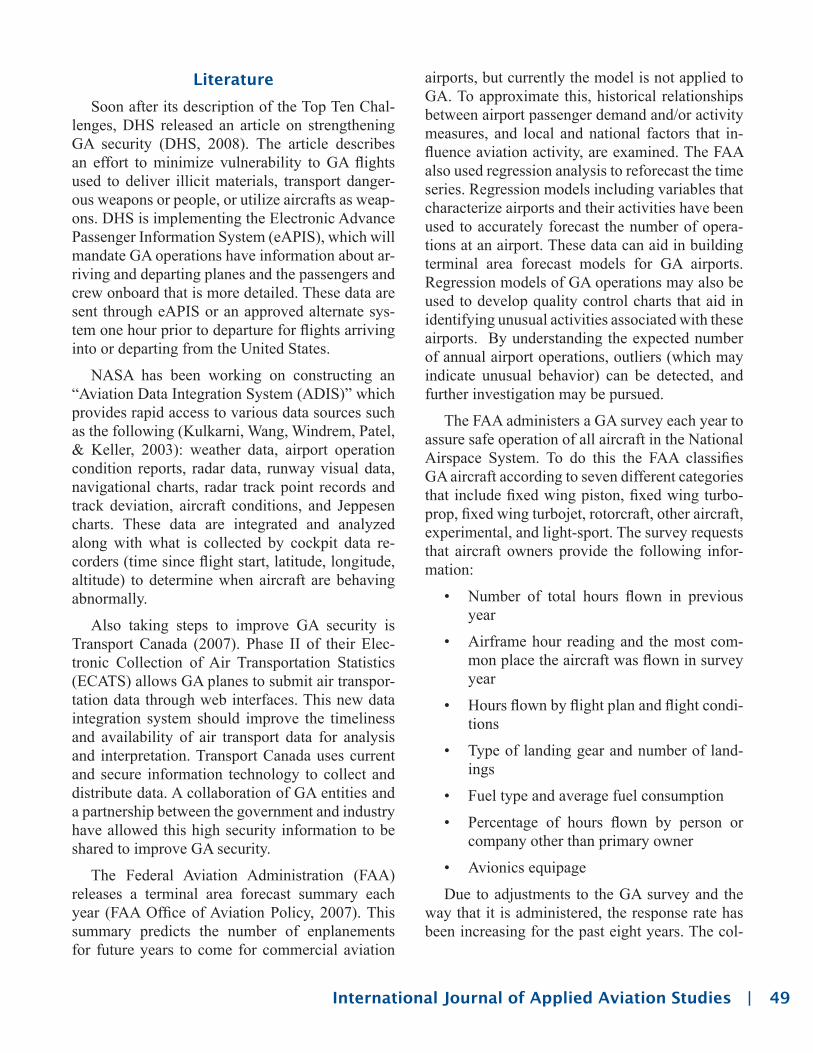
International Journal of Applied Aviation Studies | 49
airports, but currently the model is not applied to GA. To approximate this, historical relationships between airport passenger demand and/or activity measures, and local and national factors that in-fluence aviation activity, are examined. The FAA also used regression analysis to reforecast the time series. Regression models including variables that characterize airports and their activities have been used to accurately forecast the number of opera-tions at an airport. These data can aid in building terminal area forecast models for GA airports. Regression models of GA operations may also be used to develop quality control charts that aid in identifying unusual activities associated with these airports. By understanding the expected number of annual airport operations, outliers (which may indicate unusual behavior) can be detected, and further investigation may be pursued.
The FAA administers a GA survey each year to assure safe operation of all aircraft in the National Airspace System. To do this the FAA classifies GA aircraft according to seven different categories that include fixed wing piston, fixed wing turbo-prop, fixed wing turbojet, rotorcraft, other aircraft, experimental, and light-sport. The survey requests that aircraft owners provide the following infor-mation:
Number of total hours flown in previous • year
Airframe hour reading and the most com-• mon place the aircraft was flown in survey year
Hours flown by flight plan and flight condi-• tions
Type of landing gear and number of land-• ings
Fuel type and average fuel consumption•
Percentage of hours flown by person or • company other than primary owner
Avionics equipage•
Due to adjustments to the GA survey and the way that it is administered, the response rate has been increasing for the past eight years. The col-
Literature
Soon after its description of the Top Ten Chal-lenges, DHS released an article on strengthening GA security (DHS, 2008). The article describes an effort to minimize vulnerability to GA flights used to deliver illicit materials, transport danger-ous weapons or people, or utilize aircrafts as weap-ons. DHS is implementing the Electronic Advance Passenger Information System (eAPIS), which will mandate GA operations have information about ar-riving and departing planes and the passengers and crew onboard that is more detailed. These data are sent through eAPIS or an approved alternate sys-tem one hour prior to departure for flights arriving into or departing from the United States.
NASA has been working on constructing an “Aviation Data Integration System (ADIS)” which provides rapid access to various data sources such as the following (Kulkarni, Wang, Windrem, Patel, & Keller, 2003): weather data, airport operation condition reports, radar data, runway visual data, navigational charts, radar track point records and track deviation, aircraft conditions, and Jeppesen charts. These data are integrated and analyzed along with what is collected by cockpit data re-corders (time since flight start, latitude, longitude, altitude) to determine when aircraft are behaving abnormally.
Also taking steps to improve GA security is Transport Canada (2007). Phase II of their Elec-tronic Collection of Air Transportation Statistics (ECATS) allows GA planes to submit air transpor-tation data through web interfaces. This new data integration system should improve the timeliness and availability of air transport data for analysis and interpretation. Transport Canada uses current and secure information technology to collect and distribute data. A collaboration of GA entities and a partnership between the government and industry have allowed this high security information to be shared to improve GA security.
The Federal Aviation Administration (FAA) releases a terminal area forecast summary each year (FAA Office of Aviation Policy, 2007). This summary predicts the number of enplanements for future years to come for commercial aviation

50 |
GA operations at an airport and the annual number of GA operations per based aircraft at an airport (GRA, Inc., 2001). In July 2001, the GRA modi-fied Hoekstra’s model to estimate more accurately the number of GA operations for non-towered air-ports based on data from towered airports. To do this many of the same independent variables were reused, and several were added. The variables used for the regression analysis appear in Table 1.
lection of these data would seem vital to under-standing baseline GA operations. The information obtained by these surveys can be used to estimate a statistical model of annual number of operations at a GA airport where an operation is defined as a landing or a takeoff.
After a literature review it has been determined that little research has examined the development of statistical regression models to estimate GA activity. However, Hoekstra (2000), developed a methodology for estimating the annual number of
General Aviation Operations
Table 1
Variables
Variable DescriptionOPS Annual GA Operations at an airport (landings and takeoffs)BA Total Based Aircraft at an airport Pop100 1998 Population within 100 milesWACAORAK Categorical variable, 1 if state is CA, OR, WA, or AK, 0 otherwiseBA2 Total Based Aircraft at an airport squaredIN50MI Percentage of based aircraft among based aircraft at GA airports within 50 miPop25/100 Ratio of Pop25 to Pop100IN100MI Percentage of based aircraft among based aircraft at GA airports within 100 mi
FAR139 Categorical variable, 1 if airport is certificated for commercial air carrier service, 0 otherwise
POP County population where airport is located in 1999Se BA/BA Single engine based aircraft/All based aircraftTOWDUM Categorical variable, 1 if airport is towered airport, 0 otherwiseVITFSNUM Number of FAR141 certificated pilot schools at an airportPCI Per Capita Income in the county in which the airport is located in 1999EMP Non-agricultural Employment in the airport’s county in 1999WSTAK Categorical variable used in place of WACAORAK in Hoekstra’s modelWST Categorical variable, 1 if airport is located in FAA Western Region, 0 otherwiseAAL Categorical variable, 1 if airport is located in Alaska, 0 otherwise
R12 Categorical variable, 1 if airport is located in FAA New England Region or FAA East-ern Region, 0 otherwise
VITFS Categorical variable, 1 if airport has FAR141 certified pilot school, 0 otherwiseVITFSEMP Employees of FAR141 certificated pilot schools at an airportPop50 1998 Population within 50 milesPop25 1998 Population within 25 miles

International Journal of Applied Aviation Studies | 51
Dataset•
Number of airports included•
Whether or not a dummy variable was in-• cluded to distinguish between towered and non-towered airports
Number of independent variables•
R-squared value•
R-squared value of the associated GRA • model
Adjusted R-squared value•
Methods
Model Recreation
To understand relationships among airport characteristics and the annual number of airport operations better, attempts were made to recreate linear regression models previously constructed by GRA. An equation summary analysis is provided in Table 2. (Appendix A contains an equation ma-trix that describes each equation in terms of the independent variables included.) Each equation is described in Table 2 according to the following.
Table 2
Model Summary
Eq. Dataset Airports Dummy? Ind. Vars. R2 GRA R2 Adj R2
1 Towered 127 No 1 0.556 0.556 0.553
2 Towered 127 No 2 0.640 0.640 0.634
3 Towered 127 No 3 0.666 0.664 0.658
4 Towered 127 No 4 0.703 0.703 0.693
5 Towered 127 No 5 0.723 0.723 0.712
6 Towered 127 No 6 0.735 0.735 0.722
7 Towered 127 No 7 0.744 0.744 0.728
8 Towered 127 No 6 0.742 0.742 0.729
9 Towered 127 No 7 0.748 0.748 0.733
10 All 232 No 8 0.711 0.717 0.700
11 Towered 127 No 8 0.727 0.727 0.709
12 Non-towered 105 No 8 0.645 0.648 0.615
13 All 232 Yes 8 0.739 0.743 0.729
14 Towered 127 No 7 0.748 0.748 0.733
15 Non-towered 105 No 7 0.563 0.569 0.531

52 |
two variables were not included in any of the GRA models. (Equation 1 of Appendix B shows more details of this new regression model.)
Introducing Second Order Terms
Many of the p-values for this model were above 0.10; however disregarding their interac-tion with other variables would be unwise. On the other hand, a full second order model is not practical because it would leave the observation to variable ratio at less than two. In order to consid-er interaction in an efficient manner, we decided to use original continuous independent variables with a p-value greater than 0.10 for the regression model. The variables that satisfied this rule were VITFSNUM, VITFSEMP, IN50MI, IN100MI, Pop50, and Pop25. (Rather than include the newly introduced demographic variables PCI and EMP in the interaction terms we instead continued to arbitrarily control for them simply as main effects throughout the rest of the study.) Remember an explanation of these variables can be found in Ta-ble 1. We created fifteen new variables by taking the products between each of those named above. The variable FAR139 was also removed because it had a large p-value in the previous model and was not continuous. Next a regression model was estimated which included the fifteen additional variables that were created in order to assess in-teraction. The adjusted R2 value improved from 0.7220 to 0.7753. (This equation is recognized as equation 2 in Appendix B.) The small p-values of many interaction terms justify their inclusion to the model.
Results
The next step in our analysis was to determine what variables contributed appreciably to the mod-el and what variables might still be contributing to relatively inefficiency. Examination of p-value for each independent variable in the regression model revealed that VITFSEMP was the only variable remaining that was not statistically significant as a main effect, nor were any of the interaction terms including it. Therefore, the variable VITFSEMP and the second order variables that included VITF-
General Aviation Operations
Similar results were found for all regression models that used the towered data set. Howev-er, for models involving non-towered airports R-squared values are slightly yet inexplicably differ-ent from the ones estimated by GRA. Equation 13, which includes both the towered and non-towered data set, is GRA’s best model. The adjusted R-squared value for this model is 0.729, and the fol-lowing is a mathematical representation of this re-gression model: OPS = 372.32 (BA) – 0.47 (BA2) – 44,075.55 (IN100MI) – 46.65 (VITFSNUM) + 0.001 (Pop100) – 9149.68 (WACAORAK) + 26,602.72 (POP25/100) + 13,748.7 (TOWDUM) – 728.
New Variable Creation
To further improve the efficiency of our mod-els, we revised those of GRA by creating and in-cluding some new variables. Instead of including a ratio of single engine aircraft to total based air-craft (Se BA/BA), a simpler single engine based aircraft (Se BA) variable was created. This vari-able was created using the data values from the total based aircraft and the ratio of single engine aircraft to total based aircraft (a redundant variable in the GRA analysis). Physical redundancy among variables may cause inter-correlation that makes it difficult to identify what is important to the re-sponse. Therefore, removing redundant variables and using more raw forms of data should make the model more efficient and practical.
A new regional variable was also created to de-scribe the location of GA airports more efficiently. In the GRA models, four dummy variables are used to describe location. It was found, control-ling for relevant independent variables, that sig-nificant differences between locations existed only where Alaska is involved. In other words, dummy variables that describe location in detail greater than Alaska versus not Alaska would not contrib-ute to efficient statistical models of GA operations. Therefore, categories other than Alaska were col-lapsed. Next, a new regression model was created that included new variables AAL and SEBA. Also, the demographic variables PCI and EMP were added back to the model in order to determine if they contributed significantly to the model. These

International Journal of Applied Aviation Studies | 53
pared to that of GRA is presented in Table 3. The coefficient estimates and p-values of the variables used in our final model are displayed in Table 4. In other words, the expected value of OPS is a linear function of systematically chosen first and second order terms relevant to the response.
SEMP were removed from the model. This regres-sion model is displayed as equation 3 in Appendix B. When the regression model was re-estimated without these variables, the adjusted R2 value sur-prisingly decreased from 0.7753 to 0.7734. The dropped variables apparently contributed to the ef-ficiency of the model in less than obvious ways, and they were retained to be included in the finally recommended regression model. A summary of the results from the final regression model as com-
Table 3
Final Model Comparison with GRA
# Of Airports # Of Independent Var. R2 R2adj
GRA’s Best Model (eq. 13) 232 8 .7386 0.7292
Black-Chimka Best Model 232 29 .8036 0.7753
Table 4
Final Regression Variable’s Coefficients and P-Values
Variable Coefficient P-value
TOWDUM 13901.43 0.000
BA 162.48 0.033
POP -17.58 0.032
PCI 0.26 0.137
EMP 43.00 0.018
AAL -17229.20 0.038
VITFSNUM 774.60 0.438
VITFSEMP 285.41 0.618
IN100MI 4083.09 0.914
IN50MI 33887.68 0.001
Pop100 0.002 0.000
Pop50 -0.003 0.162
Pop25 0.008 0.055
Continued

54 |
total annual operations. For another example the coefficient of the variable BA, for total based air-craft at an airport, has a large coefficient, which seems valid since one might expect an airport with a large fleet of total based aircraft to have a large number of annual operations.
Conclusions and
Future Considerations
The research conducted in this report has pro-duced a more accurate and efficient model for estimating the annual number of operations at a GA airport. This information can be used to cre-ate better terminal area forecast summaries for GA airports, which could be a great benefit to civic planners. Comparison of predicted values with observed values goes toward validation of the regression model for GA airports of various
Variable Coefficient P-value
VITFSNUM * VITFSEMP 1.16 0.995
VITFSNUM * IN50MI 31407.45 0.025
VITFSNUM * IN100MI -61379.23 0.020
VITFSNUM * POP50 -0.0005 0.038
VITFSNUM * POP25 0.0005 0.038
VITFSEMP * IN50MI -540.39 0.753
VITFSEMP * IN100MI -899.46 0.640
VITFSEMP * POP50 -0.00002 0.950
VITFSEMP * Pop25 0.000547 0.375
IN50MI * IN100MI -64341.07 0.165
IN50MI * Pop50 -0.07 0.045
IN50MI * POP25 0.06 0.473
IN100MI * Pop50 0.344 0.000
IN100MI * Pop25 -0.290 0.109
Pop50 * Pop25 -7.73E-10 0.004
[Constant] -6641.06 0.123
General Aviation Operations
Next, face validity of the coefficients was con-sidered in hopes to make some logical and physi-cal sense of the model and to confirm there is no evidence of interpretation problems related to inter-dependence among independent variables. The regional variable AAL, which is a categori-cal variable that represents whether an airport is located in Alaska, has a large negative coefficient. This means that if an airport is located in Alaska, then it will most likely have a very small num-ber of total annual operations. Perhaps this makes sense because Alaska is sparsely populated. An-other variable named IN50MI, which represents the percentage of based aircraft among based air-craft at GA airports within 50 miles, has a large positive coefficient. This seems consistent if we should expect prominent airports (airports with high percentage of based aircraft at GA airports within 50 miles) to also have a large number of
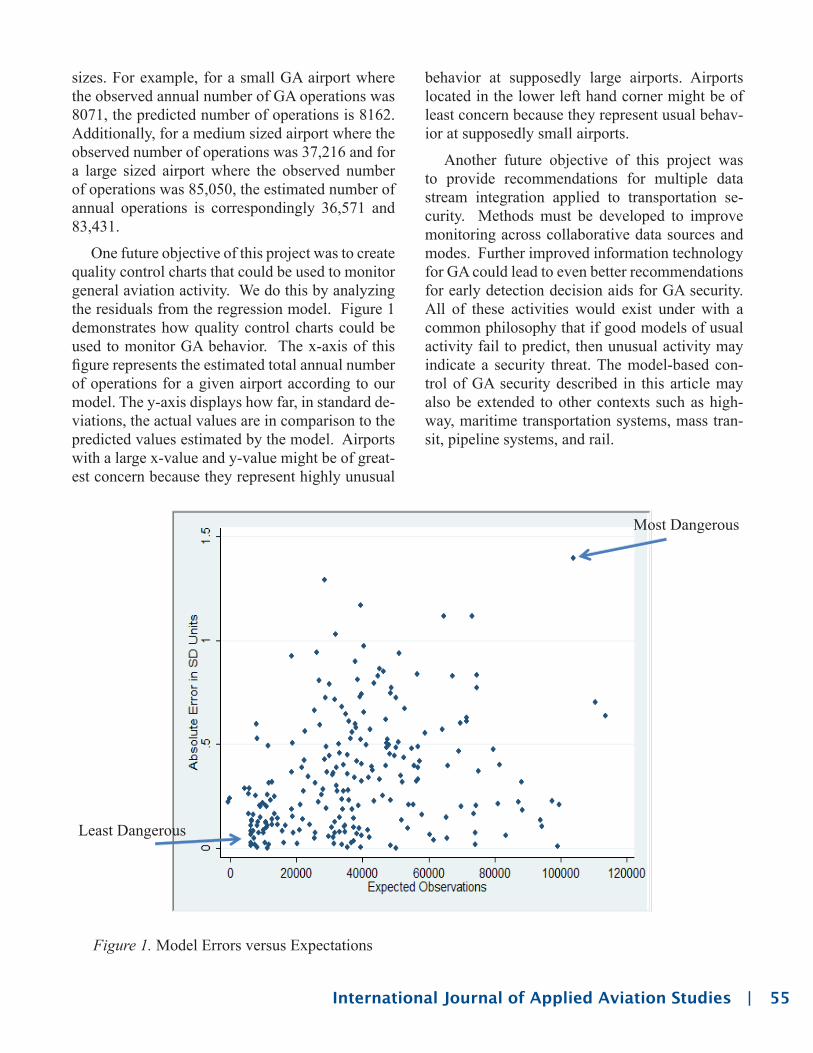
International Journal of Applied Aviation Studies | 55
behavior at supposedly large airports. Airports located in the lower left hand corner might be of least concern because they represent usual behav-ior at supposedly small airports.
Another future objective of this project was to provide recommendations for multiple data stream integration applied to transportation se-curity. Methods must be developed to improve monitoring across collaborative data sources and modes. Further improved information technology for GA could lead to even better recommendations for early detection decision aids for GA security. All of these activities would exist under with a common philosophy that if good models of usual activity fail to predict, then unusual activity may indicate a security threat. The model-based con-trol of GA security described in this article may also be extended to other contexts such as high-way, maritime transportation systems, mass tran-sit, pipeline systems, and rail.
sizes. For example, for a small GA airport where the observed annual number of GA operations was 8071, the predicted number of operations is 8162. Additionally, for a medium sized airport where the observed number of operations was 37,216 and for a large sized airport where the observed number of operations was 85,050, the estimated number of annual operations is correspondingly 36,571 and 83,431.
One future objective of this project was to create quality control charts that could be used to monitor general aviation activity. We do this by analyzing the residuals from the regression model. Figure 1 demonstrates how quality control charts could be used to monitor GA behavior. The x-axis of this figure represents the estimated total annual number of operations for a given airport according to our model. The y-axis displays how far, in standard de-viations, the actual values are in comparison to the predicted values estimated by the model. Airports with a large x-value and y-value might be of great-est concern because they represent highly unusual
Figure 1. Model Errors versus Expectations
Least Dangerous
Most Dangerous

56 |
of Canada, Ottawa, Canada. Retrieved from website: http://www.upac.ca/pdf/TC_Presenta-tion_ECATS_GA_Roundtable.pdf
Transportation Security Administration (2004). Security Guidelines for General Aviation Air-ports (Information Publication A-001). Re-trieved from website: http://www.tsa.gov/assets/pdf/security_guidelines_for_general_aviation_airports.pdf
References
Department of Homeland Security (2008). Fact sheet: General aviation. U.S. Retrieved from http://www.dhs.gov/xnews/releases/ pr_1226955842674.shtm
Federal Aviation Administration (2007). Terminal area forecast summary: Fiscal Years 2007-2025. Retrieved from FAA Office of Policy, International Affairs and Environment web-site: http://www.faa.gov/about/office_org/headquarters_offices/apl/ aviation_forecasts/taf_reports/media/TAF%20Summary%20Re-port%20FY%202008-2025.pdf
GRA, Inc. (2001). Model For Estimating Gen-eral Aviation Operations at Non-Towered Air-ports Using Towered and Non-Towered Airport Data. Retrieved from FAA Office of Aviation Policy and Plans website: http://www.faa.gov/data_research/aviation_data_statistics/ gener-al_aviation/media/GAModel3F.doc
Hoekstra, M. (2000). Model for estimating gener-al aviation operations at non-towered airports. Federal Aviation Administration, Washington, D.C.
Homeland Security Advisory Council (2008). Top ten challenges facing the next secretary of homeland security. U.S. Department of Home-land Security website: http://www.dhs.gov/xli-brary/assets/hsac_dhs_top_10_challenges_re-port.pdf
Kulkarni, D., Wang, Y., Windrem, M., Patel, H., & Keller, R. (2003, September). Aviation data in-tegration system. In Proceedings of SAE Con-ference ‘Advances in Aviation Safety’, Montre-al, Canada, paper number 2003-01-3009
Lubold, G. (2010, February 18). Plane crash in Austin points to vulnerabilities from small planes. Christian Science Monitor. Re-trieved from http://www.csmonitor.com/USA/ 2010/0218/Plane-crash-in-Austin-points-to-vulnerabilities-from-small-planes
Transport Canada (2007). General Aviation Eco-nomic Footprint – Measurement. Roundtable discussions of the Air Transport Association
General Aviation Operations

International Journal of Applied Aviation Studies | 57
Learning Styles of Chinese Aviation Students
Yi Gao
Swinburne University of TechnologyPO Box 218 (Mail H38)Hawthorn,Victoria 3122, Australia
Richard O. Fanjoy
Department of Aviation TechnologyPurdue UniversityWest Lafayette, IN 47907-2015
Abstract
The rapid expansion of the Chinese civil avia-tion industry has led to increasing numbers of Chi-nese students receiving flight training in western institutions. The growth of western flight training schools that service those students as well as the different cultural aspects of that population, in-cluding a preponderance of single child families, suggests a need to understand how learning styles of Chinese aviation students compare with their western counterparts. Researchers have evaluated several student populations to identify learning styles and thereby understand how training curri-cula might be adapted to engender a higher level of comprehension. In the present study, research-ers administered the Kolb Learning Style Inven-tory (LSI) and a short biographical survey to 293 students enrolled in an aviation curriculum at a Chinese university. An analysis of the resulting data suggests that this population, over a four-year college curriculum, shifts from predominately as-similator and converger learning styles towards diverger and assimilator learning styles, implying a developed preference for reflective observation over abstract conceptualization This finding is different from earlier studies of western aviation student populations that suggested assimilator and converger learning styles predominate across all year groups in a four-year aviation program, reflecting a preference for abstract conceptual-ization. These insights may be useful in the de-
velopment of curricula for western flight training institutions that are tasked with the preparation of students from dissimilar cultures.
Learning Styles of Chinese Aviation Students
The need for commercial airline pilots in China currently outstrips pilot production in that country. Industry forecasts predict that China’s commercial air fleet will expand to more than 5,000 aircraft by 2029, leading to a dramatic shortfall in pilots (Boe-ing, 2010). Although China is in the process of expanding their pilot production capability, a large portion of their commercial pilot training is cur-rently outsourced to western nations. Literature suggests that academic formats in Chinese educa-tional institutions are significantly different from their western counterparts (Fanjoy & Gao, 2007). Accordingly, western flight training institutions may have to deal not only with language barriers but also differences in student comprehension pat-terns. Although learning styles have been investi-gated in many western job domains over the years, little work has been done with learning styles of Asian cultures, particularly in a context of flight training.
Several studies suggest that national culture has an impact on individual learning or cognitive style

58 |
suggested that converger and assimilator styles, as identified by the Kolb learning style protocol, predominate in all college year groups, but that the percentage of those styles increases slightly throughout the college experience. It is unclear from earlier research whether that shift is driven by student adjustment to existing aviation train-ing structures, reflects missing population data on students who departed the training cohort be-fore program completion, or occurs due to some other factors. Studies of military and airline pi-lot groups by Kanske (1998/1999) suggest that a preponderance of converger learning styles is the normal state of the professional pilot population. It should be noted that research questions of the present study do not focus on the cause of learn-ing style shifts, but on what learning styles exist in a Chinese aviation program and whether Chinese aviation student learning style shifts do occur over a four-year collegiate aviation program.
An interesting consideration of this study is the unusual family structure in China. China is the only major country in the world to adopt a one child per family policy (which began in the 1970s). As a re-sult, many students born in the 1980s and 1990s are the only child in their families. Hou, Zhang and Wang (2007) conducted a survey of Chinese students (seventh grade to ninth grade) to study their thinking and coping styles. Students were divided into two groups based on their dialectic (logical evaluation) thinking styles. The research-ers found that among subjects with high dialectic thinking styles, students who were from single child families adopted more self-aware coping styles, compared with students who had siblings. And among students with low dialectic thinking styles, those who were an only child adopted less self-aware coping styles. Chen, Miao, Wang, and Xiao (2007) used the Myers-Briggs Type Inven-tory (MBTI) questionnaire to study the difference in personality characteristics among aviation ca-det students from a Chinese air force academy. Subjects were divided into three groups based on whether they were the only child of the family and whether they were from cities or countries. These groups are: only child city group, non-only child city group, and only child country group. The
preferences. Dunn et al. (1990) compared the mean scores of African-American, Chinese-American, Greek-American, and Mexican-American fourth, fifth, and sixth graders on the Group Embedded Figures Test (GEFT), and found that students from different cultural groups had different pre-ferred learning strategies. Abramson Lane, Na-gai, & Takagi (1993) employed the Myers-Briggs Type Inventory (MBTI) to suggest that Japanese and Canadian MBA students had different domi-nant cognitive styles. Mitsis and Foley (2005) found that certain combinations of the Hofstede Cultural Dimensions were indicators of student-driven learning preferences. More recently, Joy and Kolb (2009) studied 533 Kolb Learning Styles Inventory online users born in and currently resid-ing in seven different countries. They found that the effect of culture is significant in determining individual preferences between abstract conceptu-alization and concrete experience. However, they also concluded that the effect of culture on pref-erence for active experimentation over reflective observation is only marginal. Although none of these studies addressed aviation-related popula-tions, each study provides insight to cultural im-plications of learning style preference.
As exemplars of eastern and western cultures respectively, the culture of China is significantly different from that of the United States in terms of power distance, individualism, and long-term orientation, as measured by Hofstede’s Cultural Dimensions (Hofstede & Hofstede, 2005). When students from a particular cultural background are educated in a different cultural context, the impact of the cultural difference should be considered to identify any potentially negative influence. The purpose of the present research was designed to investigate the learning styles of Chinese aviation students and assess differences between that popu-lation and corresponding western aviation student populations.
Earlier studies have suggested there is a rela-tionship between aviation students’ learning styles and the length of time in an aviation program. Research by Kanske and Brewster (2001), with a sample of American collegiate aviation students,
Learning Styles of Chinese Aviation Students

International Journal of Applied Aviation Studies | 59
Data Collection
A survey instrument was administered that in-cluded demographic questions and questions from the Kolb Learning Style Inventory (LSI). Both survey sections were provided to respondents in a Chinese language format to minimize confusion associated with interpreting questions in an un-familiar language. Questions in the demographic section of the survey focused on age, single child status, and year of admission to the flight program. Students, who were transfers from other programs or institutions, were asked to provide information about their previous enrollment. Seniors who had already completed overseas flight training were asked about aircraft types they had flown and flight hours accumulated. Experiential data was collected but not used in the present analysis.
The Kolb Learning Styles Inventory (LSI) was used to assess individual learning styles. The Kolb LSI is a popular survey instrument widely adopted by many researchers to address issues regarding learning styles of various populations. A criti-cal reason for using this instrument in the current study is that similar studies in the domain of avia-tion were conducted with the Kolb LSI (Kanske, 2001; Kanske & Brewer, 2001; Kanske, Brewer, & Fanjoy, 2003). By using the same instrument, a comparison can be properly made to address re-search questions regarding the difference in learn-ing styles of Chinese and American aviation stu-dents.
The LSI was translated into Mandarin with per-mission from the Hay Group who owns a copyright for the instrument. The translation was examined for wording errors and expression bias by US-based graduate students whose native language is Mandarin. Survey instruments were administered in a classroom setting to all students except se-niors. A month later the instruments were admin-istered in a dormitory setting to seniors who had just returned from overseas flight training. In both instances, students were informed in advance that survey completion was voluntary and they could refuse participation without penalty. Survey ques-tionnaires were anonymously completed so that participating individuals could not be identified.
study found that students from the only child city group scored significantly higher on the Sensing-Intuition and Think-Feeling dimensions than the other two groups. In light of the preceding inves-tigations, another research question of the present study is whether there is a relationship between learning styles and aviation students who are the only child of their families.
Method
Subjects
Subjects of the present study were students en-rolled in the flight program of the Civil Aviation University of China (CAUC) during 2008, ranging from freshmen to seniors. Subjects included stu-dents who started the flight program as freshman at CAUC as well as students who had transferred into the flight program at CAUC from other degree pro-grams or institutions. Students who enter the flight program at CAUC are required to complete general education courses and aviation ground courses dur-ing the first five semesters at the main campus. At the beginning of the sixth semester they are sent overseas, usually to Australia or the United States, to receive flight training and qualify for a commer-cial pilot license. For the eighth (final) semester, students return to CAUC to complete their bach-elor’s degree program (Fanjoy & Gao, 2007).
Freshmen and sophomores participating in the present research enrolled in CAUC after high school graduation and successful completion of the National College Examination (Fanjoy & Gao, 2007). CAUC juniors who participated in the study were a mix of transfer students who had previously majored in engineering or science disciplines and continuing students who were preparing to depart for flight training abroad. Transfer students study aviation ground courses at CAUC for two semes-ters and then complete flight training at overseas locations. Seniors who participated in the present survey had completed flight training abroad and had just returned to CAUC for their final semester. Seniors included those who started the flight pro-gram as freshmen at CAUC as well as those who had transferred from other academic programs.

60 |
flective Observation (RO) axis and a second grid score on the Concrete Experience (CE) to Abstract Conceptualization (AC) axis for each subject. The intersection of the two grid scores was used to identify the subject’s predominant learning style as accommodating, diverging, assimilating, or converging. Figure 1 depicts the Kolb LSI type grid used in the analysis. For example, if the LSI of a subject resulted in an AE-RO value of 2 and an AC-CE value of 3, then the associated learning style would be plotted in the first quadrant on the Kolb LSI type grid, which indicates a “diverging” learning style.
Data Analysis
A descriptive analysis was completed on bio-graphical data collected from study participants. In addition, survey participants were asked to rank their preferred answers to LSI questions designed to determine the degree to which people are ac-tive or reflective observers when learning or solv-ing problems as well as the degree to which they prefer to learn through direct concrete experience or abstract conceptualization. LSI survey data was analyzed with a rubric obtained from the Hay Group (Kolb & Kolb, 2005) that yielded a grid score on the Active Experimentation (AE) to Re-
Learning Styles of Chinese Aviation Students
Figure 1. Learning Style Type Grid. (Kolb & Kolb, 2005)

International Journal of Applied Aviation Studies | 61
All 293 students who participated in the survey with valid survey questionnaires were male. This was because only male students were enrolled in the flight program at CAUC when the surveys were completed. Among these 293 subjects, 195 students were the only child of their families. In terms of age, 52 students were between the 18 and 19, 184 students were between 20 and 21, 53 stu-dents were between 22 and 23, and four of them were older than 23 years when the survey was conducted.
Among the 293 subjects, 106 (36.2 %) were freshmen, 124 (42.3%) were sophomores, 26 (8.9%) were juniors, and 37 (12.6%) were seniors. Stratified sampling was used in this study because students from the same year group had acquired a similar curricular experience at the target institu-tion. Smaller numbers of surveys for the junior and senior year groups was caused by limited subject availability and incomplete survey instru-ments. As a result, generalization of results from those year groups is limited.
The scores for AC-CE and AE-RO were cal-culated for each subject using the LSI rubric, and then a corresponding learning style of each sub-ject was determined using the LSI type grid. Of the 293 students in the sample, 85 were found to adopt the diverging style, 99 students were judged as assimilating, 49 were accommodating, and the remaining 60 students were viewed as converging. Table 1 depicts the learning styles employed by students in each year group.
Students with accommodating learning styles prefer to learn primarily through “hands-on” expe-rience, to work with others, and to do field work. Students with diverging styles have broad cultur-al interests and prefer to work in groups, listen-ing with an open mind to different points of view. Students with assimilating styles prefer readings, lectures, exploring analytical models, and having time to think things through. Students who adopt a converging style prefer to deal with technical tasks and problems rather than with social issues and interpersonal issues (Kolb & Kolb, 2005).
Results
Overall Description
Of the 399 survey questionnaires that were distributed and collected, 106 of them either had questions that were either left blank or inappropri-ately answered. Accordingly, those 106 data sets were not included in the following analysis. The overall response rate was 73.4%, and response rates from different year groups were: freshmen - 97.2%, sophomores - 73.8%, juniors - 96.3%, and seniors - 38.9%. The exceptionally high response rates for freshmen and juniors resulted because the instrument was administered in classes with required attendance. The low response rate for se-nior resulted because the instrument was adminis-tered in student dormitories.
Table 1
Learning Styles by Year Group
Accommodating Assimilating Converging Diverging
Freshmen 19 (18%) 44 (42%) 30 (28%) 13 (12%)
Sophomores 22 (18%) 37 (30%) 20 (16%) 45 (36%)
Juniors 3 (11%) 8 (31%) 7 (27%) 8 (31%)
Seniors 5 (14%) 10 (27%) 3 (8%) 19 (51%)

62 |
accommodating or diverging learning style (pref-erence for learning through concrete experience) with students who adopt an assimilating or a con-verging (preference for learning through abstract conceptualization) learning style may suggest a trend over the course of a four year aviation pro-gram. It can be seen from the data of the current research that the combined percentage of accom-modating and diverging learning styles is higher in the seniors group of the sample, while the com-
Learning Styles of Chinese Aviation Students
Statistical Analysis
To address the learning style difference among student year groups, a one-way ANOVA was con-ducted to compare mean AC-CE values of subject year groups. The test resulted in F (3, 289) = 4.24 with a p-value of 0.0059 indicating a significant difference between year groups. A further Bon-ferroni pair-wise multiple comparison suggested significant differences in mean AC-CE values of freshmen and sophomores, and of freshmen and
seniors. A one-way ANOVA was also used to compare group means for AE-RO, with a resulting F(3, 289) = 1.16 and p-value of 0.3253, suggest-ing no significant differences exist between year groups for Active Experimentation to Reflective Observation values. See Table 2 for a combined learning style means and standard deviations by year group.
Because a significant difference was found in mean AC-CE values for students of different grades, a comparison of students who adopt an
bined percentage of assimilating and converging is lower for the seniors group. If juniors are not in-cluded in the analysis due to the presence of many transfers from science or engineering programs, a trend of learning style change over the years in the aviation program becomes even more evident. See Table 3 for a comparison of combined learn-ing styles.
A high percentage of seniors in the sample were found to adopt an accommodating or a diverging style. Seniors in this study had just completed
Table 2
Combined Learning Style Sample Means and Standard Deviations by Year Group
Year Groups Freshman Sophomore Junior Senior Total
AC CE− 9.10 5.14 8.46 3.81 6.70
( )SD AC CE− 9.64 10.31 7.08 12.41 10.30
AE RO− 4.40 2.53 2.46 1.89 3.12
( )SD AE RO− 9.92 8.49 8.44 8.29 9.02
Table 3
Combined Learning Styles Comparison
Freshmen Sophomore Juniors Seniors
Accommodating & Diverging 32 (30%) 67 (54%) 11 (42%) 24 (65%)
Assimilating & Converging 74 (70%) 57 (46%) 15 (58%) 13 (35%)

International Journal of Applied Aviation Studies | 63
Conclusion
In this study of Chinese aviation students, a sta-tistical analysis suggested that learning styles of freshmen were different from those of sophomores and seniors in the dimension of concrete experi-ence to abstract conceptualization. That dimen-sion reflects students’ preference between learning by experiencing and learning by thinking. Study findings suggest the freshman sample preferred abstract conceptualization, while sophomores and seniors preferred concrete experiencing. Although learning styles of freshmen in this sample were heavily weighted towards assimilators and con-vergers, by the second year in the program there appears to be a shift towards accommodating and diverging learning styles. Generalization of this result is very limited, and further investigation is warranted to see if such a shift can be explained by the nature of the flight program. Flight train-ing traditionally emphasizes hands-on experience and implementation which may shape the learn-ing environment as well as the learning styles that students employ.
The difference between mean learning styles of freshmen and seniors in the study was more dra-matic than the difference between freshmen and sophomores. There was no significant difference between freshmen and junior mean learning styles. Senior student subjects had been in the flight pro-gram longer than the sophomores, and unlike the sophomores, the seniors had hands-on flight train-ing experience. Many juniors in this study were students who had just transferred from other ma-jors when the study was conducted. The impact of the aviation learning environment on their learn-ing styles was not obvious because of their rela-tively short experience in the program.
An analysis of the entire sample and each year group in the sample suggests that the majority of Chinese aviation students tend to adopt diverging or assimilating learning styles that employ reflec-tive observation (RO). The finding of reflective observation preference by the Chinese sample is different from findings in a study of western avia-tion students completed by Kanske, Brewster, and Fanjoy (2003). Table 4 compares means of AC-CE
their training in the United States. These students worked individually with flight instructors, gained practical experience in an aircraft, and communi-cated with people from different cultures. The ex-perience of western flight training may have had a significant influence on their learning styles.
By comparison, freshmen and sophomores had no flight experience when they completed the survey. The education they received was pre-dominately theory related and in a lecture format. These students had limited opportunity to develop communication or social skills during their study in the aviation program. This may explain why a large percentage of freshmen and sophomores in the study sample adopted assimilating or converg-ing learning styles.
The juniors group is similar to the freshmen group in that both groups scored higher on AC-CE than other groups, which suggests that juniors prefer learning through abstract conceptualiza-tion. Considering the fact that a large portion of junior students participating in this survey trans-ferred from science or engineering programs and had no flying experience, the preference of abstract conceptualization suggests that juniors remained most comfortable with theoretical study, which is common in science and engineering education in China. And this is similar to the circumstance of the freshmen group.
A final analysis was conducted to identify the re-search question that addressed only-child influence on learning styles. Students were divided into two groups based on whether they were the only child of a family or not. Two tests were used to evaluate the significance of only-child status by comparing these two groups. Both tests used “only child or not” as an independent variable. In the first test, the dependent variable was AC-CE. The p-value for that test was 0.9086. The p-value for the second test, whose dependent variable was AE-RO, was 0.3150. Neither test result suggested a relationship between only-child status and scores for AE-RO and AC-CE. These results suggest that the effect of being an only child on learning style preference is not significant.

64 |
explained by cultural differences and dissimilar lecturing/learning environments. Although it was noted that many students in this study came from single child families, the analysis did not suggest that circumstance had any impact on adopted learn-ing styles. Further study is needed to determine the exact causes of the learning style difference. However, findings of the present study are useful to researchers and educators who are interested in Chinese aviation education, and may provide in-sights to the learning styles of Chinese aviation students. Western training providers may be able to use the findings of this study to align their syl-labi and teaching philosophies to better suit the characteristics of this aviation student population.
and AE-RO between the Chinese student sample of the present study and American student sample as used by Kanske, Brewster, and Fanjoy (2003). That study suggested students from eight differ-ent aviation programs in the United States were more likely to use abstract conceptualization (AC) as a learning style. All year groups of the western student sample were dominated by assimilators and convergers. An earlier study by Kanske and Brewster (2001) of four different American aca-demic aviation programs also found a tendency towards an abstract conceptualization learning style.
The difference between Chinese aviation stu-dents and their American counterparts might be
Learning Styles of Chinese Aviation Students
Table 4
LSI Scale Comparison between Chinese Students and American Students (Kanske et al., 2003)
Year Group Freshmen Sophomores Juniors Seniors Total
CHN USA CHN USA CHN USA CHN USA CHN USA
AC CE− 9.10 6.01 5.14 6.71 8.46 8.07 3.81 9.40 6.70 7.50
AE RO− 4.40 4.07 2.53 6.66 2.46 4.61 1.89 6.08 3.12 5.20

International Journal of Applied Aviation Studies | 65
Kanske, C. A., & Brewster, L. T. (2001). The learning styles of college aviation students. Collegiate Aviation Review, 19(1), 62-70.
Kanske, C. A., Brewster, L. T., & Fanjoy, R. O. (2003). A longitudinal study of the learning styles of college aviation students Interna-tional Journal of Applied Aviation Studies, 3(1), 79-89.
Kolb, A. Y., & Kolb, D. A. (2005). The Kolb learn-ing style inventory-Version 3.1:2005 Technical specifications. Boston, MA: The HayGroup.
Mitsis, A., & Foley, P. (2005). The effect of stu-dents' cultural values on their student-driven learning preference. In M. Abbott, J. Tan, M. Roberts, C. Doucouliagos & L. Cornwell (Eds.), AIS St Helens Centre for Research in International Education Research Series. Auckland, New Zealand.
References
Abramson, N. R., Lane, H. W., Nagai, H., & Tak-agi, H. (1993). A Comparison of Canadian and Japanese Cognitive Styles: Implications for Management Interaction. Journal of Interna-tional Business Studies, 24(3), 575-587.
Boeing. (2010). Current Market Outlook 2010-2029 - Boeing. Retrieved from http://www.boeing.com/commercial/cmo/pdf/Boeing_Current_Market_Outlook_2010_to_2029.pdf
Chen, J., Miao, D., Wang, Y., & Xiao, X. (2007). Personality characteristics of 1921 cadets in an air force academy shown by the MBTI-G. Chinese Mental Health Journal, 21(11), 777-808.
Dunn, R., Gemake, J., Jalali, F., Zenhausern, R., Quinn, P., & Spiridakis, J. (1990). Cross-cul-tural difference in learning styles of elementa-ry-age students from four ethnic backgrounds. Journal of Multicultural Counseling & Devel-opment, 18(2), 68-93.
Fanjoy, R. O., & Gao, Y. (2007). Collegiate avia-tion in China: Opportunities and challenges. Journal of Aviation Aerospace Education and Research, 17(1), 11-18.
Hofstede, G., & Hofstede, G. J. (2005). Cultures and organizations: Software of the mind (2nd Rev. ed.). New York, NY: McGraw-Hill.
Hou, Y., Zhang, M., & Wang, X. (2007). The re-lationship between adolescents' thinking style and their coping style. Chinese Mental Health Journal, 21(3), 158-161.
Joy, S., & Kolb, D. A. (2009). Are there cultural difference in learning style? International Journal of Intercultural Relations, 33(1), 69-85.
Kanske, C. A. (1998/1999). The learning styles of pilots currently qualified in United States Air Force aircraft (Unpublished Doctoral disser-tation). Oklahoma State University, Stillwater, OK.

66 |

International Journal of Applied Aviation Studies | 67
An Analysis of Statistical Power in Aviation Research
David Carl Ison
Rocky Mountain College1511 Poly DriveBillings, MT [email protected]
Abstract
This study sought to evaluate the statistical power of aviation research published in four prom-inent peer-reviewed journals (Collegiate Aviation Review, Journal of Air Transportation Worldwide, Journal of Aviation/Aerospace Education and Research, and International Journal of Applied Aviation Studies). Further, this study investigated whether power was mentioned or calculated as well as if articles included details on effect size(s). The study yielded 128 articles that included statistical testing and provided enough information to calcu-late power. From these articles a total of 1,692 sta-tistical tests were analyzed. The average power of these tests was .277 considering a small effect size, .685 when considering a medium effect size, and .874 when assuming a large effect size. Consider-ing that a medium effect size is generally utilized when there is no research-based reason to use an alternative level and that the accepted minimum power value is .80, aviation research appears to be underpowered. Also, only 5.6% of articles conduct-ed an a priori power analysis whilst 11.9% men-tioned power. Among studies that included statisti-cal testing, only 4.2 % calculated effect size. Thus aviation research commonly fails to provide critical research data. Guidance on ways researchers can improve power and/or reduce sample size require-ments are provided. Suggestions for future research and policies are also provided.
An Analysis of Statistical Power in Aviation Research
Null hypothesis significance testing (NHST) dominates the focus of research studies in a va-riety of fields with aviation being no exception (Borkowski, Welsh, & Zhang, 2001; Ferrin et al., 2007; Jones & Sommerlund, 2007). NHST inves-tigates research problems by determining which of two alternatives – the first that there is a difference between groups (termed the alternative hypothesis or H1), or the second, that there is no difference between groups (termed the null hypothesis or H0) – is apparently true (Jones & Sommerlund, 2007; Stevens, 2007). Ferrin et al. (2007) described this model as one in which a researcher “calculates the test statistic, and if it is sufficiently large and the p-value is sufficiently small, the null hypothesis is rejected and the corresponding alternative hypoth-esis is accepted” (p. 87). This method of inquiry arose from the efforts of Neyman and Pearson in the early 20th century and has been widely adopted since (Cohen, 1992; Sedlmeier & Gigerenzer, 1989; Spanos, 1999). Not surprisingly, researchers put forth a tremendous amount of effort to seek statis-tical significance of a certain level in order to claim a difference, or lack thereof, between or among groups. The generally accepted norm for statistical significance is α = 0.05 (Coladarci, Cobb, Minium, & Clarke, 2007; Stevens, 2007).
Even in light of its prevalence in the research literature, there are noteworthy concerns about

68 |
avoided by conducting a power analysis during the research design process. Further, the findings of research can be scrutinized in terms of the actual power, i.e. studies that report “insignificant” find-ings but are determined to have low power should be viewed with skepticism (Ferrin et al., 2007).
Cohen (1962) first reported his concerns that “the problem of power is occasionally approached indirectly” and studies overwhelmingly pay “care-ful attention to issues of significance, and typical-ly no attention to power” (p. 145). Kosciulek and Szymanski (1993) recognized similar deficiencies in research noting that “statistical power analysis is a desirable and necessary ingredient in planning and conducting effective research. Unfortunately, however, it is an underused tool in […] research” (p. 212). Over the last 50 years, there has been lit-tle improvement in the inclusion of power analysis in research. Investigations into studies conducted in areas such as psychology, medicine, behavioral accounting, business, and education found a large percentage had low power values or neglected power entirely (Aguinis, Beaty, Boik, & Pierce, 2005; Borkowski, Welsh, & Zhang, 2001; Ferrin et al., 2007; Jones & Sommerlund, 2007; Osborne, 2008). The absence of power testing raised con-cerns at the American Psychological Association (APA) which convened a Task Force on Statisti-cal Inference which defined “guidelines indicative of good research” which included “the reporting of effect size estimates and confidence intervals for any effect size involving principal outcomes as well as consideration of statistical power and sample size in the design of studies” (Ferrin et al., 2007, p 88). The Publication Manual of the Amer-ican Psychological Association (6th ed.) clearly notes that researchers should “provide evidence the study has sufficient power to detect effects of substantial interest” (APA, 2010, p. 30).
In light of the practical and statistical impor-tance of power analysis, it is critical that research inquiries include such data. Several studies have been conducted in a variety of subject areas in ef-forts to determine the level of inclusion of power analysis to help shed light on the general quality of research and statistical analysis that exists in
the appropriateness and utility of NHST. Fagley (1985) noted that if researchers were to ardently adhere to a veritable definition of the null hypoth-esis, it would always be determined to be false. Kline (2004) also noted that there are many fal-lacies within the literature about p values being equated to effect sizes and the false assumptions that if the null hypothesis is not rejected then it has to be true. Also, Kline (2004) displayed con-cern that only when the null-hypothesis is rejected are the findings considered of value to the research community.
Fisher (1966) disagreed with an a priori deter-mination of a significance level (α), instead ad-vocating the use of a sliding scale of significance proportionate to the p-value resultant from the conducted research. Cohen (1992) found that in most studies involving statistical tests, “the chance of obtaining a significant result was about that of tossing a head with a fair coin” (p. 155). Along the same lines, Ferrin et al. (2007) remarked that “un-fortunately, knowing the p-value reveals nothing about either the magnitude of the effect or about the width of the interval on the distribution line (confidence interval), or about power; nor does it provide information about the practical or clinical significance of the finding” (pp. 87-88). It is not uncommon that details such as effect sizes, which are arguably just as important as p-values, if not more so, are regularly missing from research find-ings (Osborne, 2008).
Another problem that has been noted concern-ing archetypical significance testing is its focus on avoiding a Type I error, i.e. the rejection of a null hypothesis when in fact it is true (Cohen, 1962; Stevens, 2007). This concentration on the probability of performing a Type I error (α) often leads to the neglect of Type II (β) error avoidance. This oversight may lead to researchers having an undesirable chance of accepting a null hypothesis that is instead actually false. Simply, the probabil-ity of a study successfully detecting a difference among groups in order to reject a null hypothesis, known as power, is often very low. What is espe-cially problematic about the prevalence of studies with low power is that these blunders can be easily
An Analysis of Statistical Power in Aviation Research

International Journal of Applied Aviation Studies | 69
Determinants of Statistical Power
Statistical power is most easily defined by the formula 1 – β, however, there are several addi-tional factors that are involved in the calculation of power. There are five determinants of power: significance level, homogeneity of samples, sam-ple size, effect size, and directionality. The sig-nificance level, or alpha (α), is the probability of rejecting a true null hypothesis (Type I error). This is commonly set at 0.05 meaning there is a 5% chance of committing a Type I error. Some studies go as far as using a higher α standard such as 0.01. Yet it is important to recognize the relationship be-tween α and β. When a researcher demands a more stringent α, they simultaneously allow for a larger chance of committing a Type II error (β) (Stevens, 2007). Therefore Cohen (1988) suggested weigh-ing the importance of α versus β during the re-search design process vis-à-vis arbitrarily setting α = 0.05. The recommended procedure is to divide β by α to determine a ratio that ideally does not exceed 4 : 1. For example, if α = 0.05 and β = 0.20, the resultant ratio would be 4 : 1. The power in this case would of course be 0.80 (1 – 0.20), i.e. there would be an 80% chance that the study would be able to correctly identify a difference among in-vestigated groups. In sum, as α is strengthened, power is reduced, therefore it is no surprise that Stevens (2007) stated that “it is not always wise to set α as low as 0.05 or 0.01.” (p. 105). Refer to Figures 1 and 2 (page 70) for a comparison of power when α = 0.05 versus α = 0.01.
Another factor in determining the power of a statistical test is the reliability or homogeneity of samples which can be observed through the stan-dard error of a statistic (SEx ) which is defined by a relationship between the population variance es-timate (s2) and the sample size (n) (Cohen, 1988):
SEx = √s2/n
As is obvious with a constant sample size, a re-duction in variance nets a lower standard error. The standard error of tests utilizing dependent samples is lower than if independent samples are utilized. This is due to the fact that “the standard error of the difference between means is modified to take
a body of research. As aviation research has con-tinued to expand and become more mainstream, it becomes ever more critical that it comply with general research standards, but what is even more essential is that the research being published pro-vides meaningful and well-founded findings de-termined by competent research and analysis methods. Therefore this study analyzed the statis-tical power of quantitative aviation research stud-ies found within four prominent aviation-related peer-reviewed academic journals – the Collegiate Aviation Review, the Journal of Air Transportation World Wide, the Journal of Aviation/Aerospace Education and Research, and the International Journal of Applied Aviation Studies. Two related publications, the Journal of Aviation Management and Education and the International Journal of Professional Aviation Training Testing Research, were omitted as these journals had a very limited quantity of articles to analyze.
Statistical Power
The power of a statistical test is defined as “the probability, given that H0 is false, of obtaining sam-ple results that will lead to the rejection of H0” (Co-ladarci, Cobb, Minium, & Clarke, 2008, p. 403). More simply, power refers to the chance of a statis-tical test to detect a difference between or among groups being analyzed. Discussions about power normally mention the Type II error (β), which is the “probability of retaining the null hypothesis when it is false” (Coladarci, Cobb, Minium, & Clarke, 2008, p. 404) therefore power can be determined by the formula 1 – β. The resultant number can be viewed as the percent chance that the statistical test will be able to rightfully reject a false null hypoth-esis, e.g. a power of 0.33 means that the test has a 33% chance of succeeding to reject a false null hypothesis. Obviously, a study that only has a 33% chance at success is not very viable nor would one want to take findings of a study with such a level of power too seriously (Cohen, 1992; Ferrin et al., 2007).

70 |
Figure 1. Comparison of Power (1 – β) between α = 0.05 (top) and α = 0.01 (bottom). Created in G*Power. Note: Power is indicated by the un-shaded region underneath the dashed curve.
Figure 2. Comparison of Power (1 – β) between a t-test utilizing independent samples (top) and dependent samples (bottom). Cre-ated in G*Power. Note: Power is indicated by the un-shaded region underneath the dashed curve.
An Analysis of Statistical Power in Aviation Research
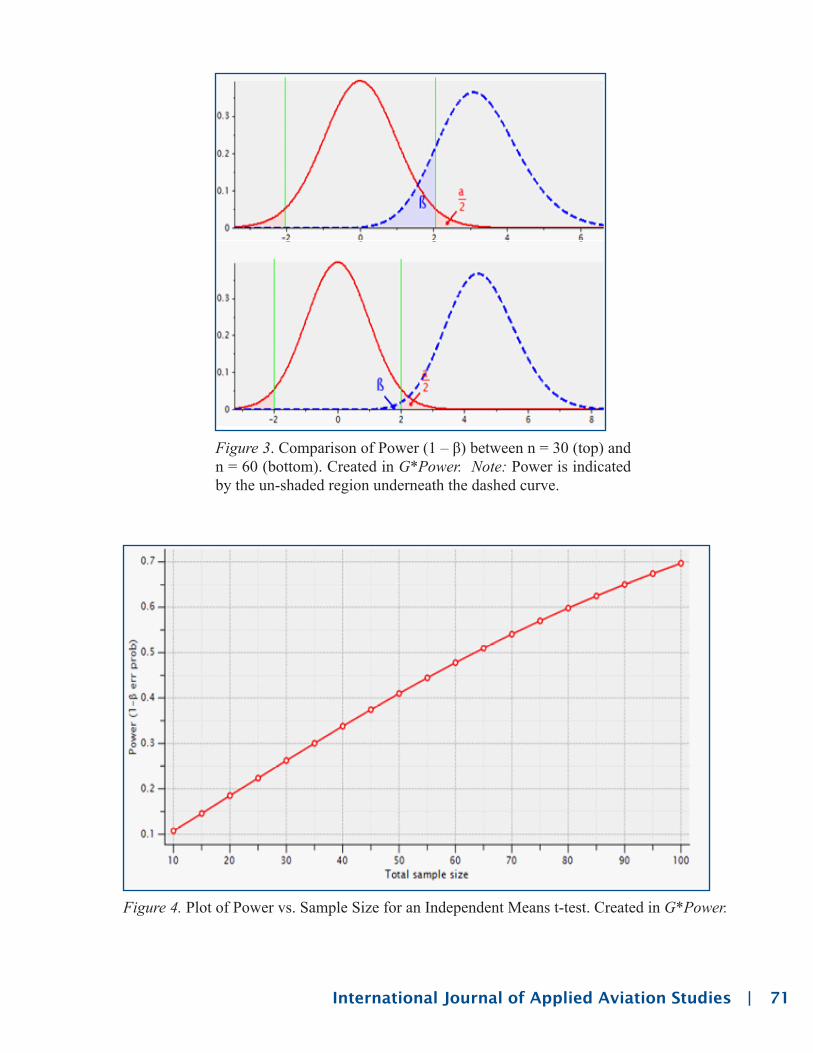
International Journal of Applied Aviation Studies | 71
Figure 3. Comparison of Power (1 – β) between n = 30 (top) and n = 60 (bottom). Created in G*Power. Note: Power is indicated by the un-shaded region underneath the dashed curve.
Figure 4. Plot of Power vs. Sample Size for an Independent Means t-test. Created in G*Power.

72 |
Another manipulator of power is effect size which Stevens (2007) defines as “how much of a difference the treatments make, or the extent to which the groups differ in the population on the dependent variable” (p. 106). Alternatively, Cohen (1988) defines effect size “as an index of degree of departure from the null hypothesis” (p. 10). Math-ematically, effect size (δ) is calculated by dividing the difference between the means of investigated populations divided by the population standard deviation and is represented by the formula (Cola-darci, Cobb, Minium, & Clarke, 2007):
δ = (µ1- µ2)
σ
When all other factors remain constant, as ef-fect size increases power also increases (see Fig-ure 5).
into account the degree of correlation between the paired scores” (Coladarci, Cobb, Minium, & Clarke, 2007, pp. 310-311). If standard error is re-duced, the result is an increase in power. The use of dependent or homogeneous samples results in larger power value (Coladarci, Cobb, Minium, & Clarke, 2007).
Also, as the aforementioned formula indicates, as sample size increases the standard error would also be reduced. Therefore considering a constant variance, power increases with an increase in sam-ple size (see Figures 3 and 4). An example of the influence of sample size on power can be seen if one utilizes a t-test for independent means. Keep-ing all other factors constant (two tailed, α = 0.05, effect size of 0.50), the power of a study with n = 30 in each group would be 0.47 whilst if n were increased to 100 in each group power would grow to 0.94 (Cohen, 1988).
Figure 5. Comparison of Power (1 – β) between small d (top) and large d (bottom). Created in G*Power. Note: Power is indicated by the un-shaded region underneath the dashed curve.
An Analysis of Statistical Power in Aviation Research

International Journal of Applied Aviation Studies | 73
An example of the influence of effect size is if a t-test is performed with independent means, α = 0.05 and n = 100 in each group (note that effect size in t-tests is referred to as “d”) (Cohen, 1992). If the researcher used a small d (0.20), the resultant power is 0.29. In contrast, if the recommended me-dium d (0.50) were used, the resultant power would be 0.94. When performing statistical analysis, re-searchers can select a one or two-tailed measure. If the researcher proposes a one-tailed measure and correctly identifies the directionality of the hypoth-esis, the critical area will be larger thus there is a
This is due to the fact that the presence of a larger difference among groups would, in theory, be easier to detect (Cohen, 1988). The problem re-sides in the fact that “effect size is rarely known in advance” (Borkowski, Welsh, and Zhang, 2001). To assist in the selection of an effect size to use in power analysis, three general categories have been adopted: small, medium, and large. Cohen (1988) stated that:
‘small’ effect sizes must not be so small that seeking them amidst the inevitable operation of measurement and experimental bias and lack of
fidelity be a bootless task [… and] large effects must not be defined so large that their quest by statistical methods is wholly a labor of super-erogation (p. 13).
In most cases, it is logical to select “medium” effect so as to avoid one extreme or another. As Cohen (1988) described, medium effects would be perceptible to the naked eye. But because certain statistical test yield different levels of accuracy, individual tests have different δ values equating to designations of small, medium, and large. Ef-fect sizes for common statistical tests are given in Table 1.
Table 1.
Type of Statistical Test and Associated Acceptable Effect Sizes.
Effect Sizes
Test Type Small Medium Large
1. t-test (independent means) 0.20 0.50 0.80
2. t-test (product-moment correlation) 0.10 0.30 0.50
3. Difference between two r values 0.10 0.30 0.50
4. Test vs. population proportion (P) = 0.50 0.05 0.15 0.25
5. Chi square – goodness of fit 0.10 0.30 0.50
6. One way ANOVA 0.10 0.25 0.40
7. Multiple correlation 0.02 0.15 0.35
Note: Adopted from Cohen (1992).
higher likelihood that the null hypothesis will be rejected. As such, when all other factors remain constant, a one-tailed test will have a greater power than a two-tailed version (see Figure 6, page 74) (Coladarci, Cobb, Minimum, & Clarke, 2007). This advantage only exists, however, if the researcher surmises the correct direction (Cohen, 1988). The difference in power between a one-tailed and a two-tailed t-test of independent means (α = 0.05, n = 50 in each group, and d = 0.50) is 0.79 and 0.69 respectively.

74 |
the researcher time, money, and effort (Osborne, 2008).
Kosciulek and Szymanski (1993) outlined a pre-test power analysis plan that should be utilized by researchers during their methodology design process. The first step is to evaluate the literature to determine a reasonable effect size that can be expected when dealing with the subject at hand and the proposed experimental design. Next, the researcher should select an appropriate statistical test. With this information, the researcher can use power tables or statistical analysis software to de-termine the required sample size. The researcher can then estimate the power of the study. If the power is determined to be at or above 0.80, then the researcher can confidently move forward. If the power is below the desired level, the research-er can re-evaluate the sample size, alpha level, the proposed statistical test, or other aspects of the methodology for possible revision (Borkowski, Welsh, & Zhang, 2001; Kosciulek & Szymanski, 1993).
Uses of Power: Incorporating Power into Research Design and Evaluation
There are two primary instances when statisti-cal power analysis can be used in research – a pri-ori and a posteriori. Ideally, researchers conduct a power analysis before partaking in their study so as to insure a reasonable chance of correctly rejecting a null hypothesis (Osborne, 2008). Co-hen (1992) stated that a power of 0.80 or greater is acceptable. It is logical to perform this impor-tant step in research design because if a researcher determines that the power of the proposed study falls below 0.80, an amendment is in order to correct the deficiency. A common a priori use of power is the determination of sample size. Clearly researchers should determine the minimum num-ber of participants in a particular study in order to have adequate power. At the same time, it may be advantageous to determine that fewer individu-als are necessary to sufficiently undertake a study with a minimum power of 0.80 potentially saving
Figure 6. Comparison of Power (1 – β) between a two-tailed test (top) and a one-tailed test (bottom). Created in G*Power. Note: Power is indicated by the un-shaded region underneath the dashed curve.
An Analysis of Statistical Power in Aviation Research

International Journal of Applied Aviation Studies | 75
purpose of power analysis, the criterion values for a medium effect are […] convention” (Cohen, 1962, p. 153) and the minimum power deemed ac-ceptable by Cohen (1962; 1988; 1992) is 0.80, the reviewed research fell well short of the desirable power levels.
Sedlmeier and Gigerenzer (1989), using the work of Cohen (1962; 1988) as a model, investi-gated the power of a much broader range of jour-nals in subject areas including psychology, educa-tion, communication, sociology, forensics, speech and hearing, communications, journalism, and marketing. When viewed with the assumption of a small effect size, only one journal had a mean power above 0.50. With a medium effect, two jour-nals mean powers above 0.80 with more than half concentrated around the 0.50 mark. Even when considering large effects, five groups of journals did not meet the recommended power threshold of 0.80. Sedlmeier and Gigerenzer (1989) also ana-lyzed 56 articles for their inclusion of power and discussions of why significance levels and sample sizes were selected. Only two mentioned power and in only four articles “alpha was mentioned, ei-ther by saying that it was set at a certain level (0.05) before the experiment or by referring to the danger of alpha inflation” (p. 311). No articles were found to include reasoning behind why a particular alpha levels or sample sizes were utilized.
Kosciulek and Szymanski (1993) examined 150 rehabilitation counseling studies containing 32 statistical tests. Within this literature, it was discovered that:
100% of the studies did not have a 50-50 chance of detecting small effect sizes. Fur-thermore, only 12 had a 1 in 2 change of find-ing significant results assuming medium ef-fects. A comparatively small 9% of the studies showed less than a 50-50 chance of detecting large effects, and a miniscule 3% showed less than 3 in 10 chances (p. 212).
A study of accounting related literature was con-ducted by Borkowski, Welsh, and Zhang (2001) and included articles from three journals over a period between 1993 and 1997. In total, 258 ar-ticles with over 14,000 statistical tests within them
It is important to note that if a study uncovers statistically significant findings, either the study must have had sufficient power or a Type I er-ror occurred. While this is true, it is important to consider that if the researcher in this case did not conduct an a priori power analysis, they were es-sentially blindly seeking results without any idea how likely they may be to find it, which is clearly an attribute of poorly designed research. Also, the consideration and inclusion of essential aspects re-lated to power, such as effect size, are still critical to the presentation and analysis of findings (Cohen 1992; Kline, 2004; Osborne, 2008).
A posteriori approaches to power allow for more of an evaluation of the quality of research findings by peers. If a post hoc power analysis reveals low power in a study in which the null hypothesis was not rejected, “it is unclear whether a Type II error has occurred” (Osborne, 2008, p. 153). Equally, if a study that fails to reject the null hypothesis is re-vealed to have power of 0.80 or greater, readers can have a confidence that the study came to right conclusion (Osborne, 2008).
Previous Studies on Power Analysis in Research
Because of the crucial importance of adequate power among studies, there has been an assortment of research that has analyzed literature in an array of fields. The seminal study of power in research literature was conducted by Cohen (1962) in which 78 articles in Volume 61 of the Journal of Abnor-mal and Social Psychology were examined. Eight articles were found to be missing statistical testing and were omitted. Cohen (1962) then calculated power for each of the remaining articles. When considering small effect sizes, the mean calculated power among the studies was 0.18. “When one posits medium effects in the population (generally of the order of twice as large as small effects) the studies average[d] slightly less than a 50-50 chance of successfully rejecting their major null hypoth-esis” (Cohen, 1962, p. 150). When calculated as-suming a large effect, the mean power rose to 0.83. Considering that “in the absence of any basis for specifying an alternative to the null hypothesis for

76 |
Method
The journals included in this study were select-ed as they are representative of the research being conducted on subjects specific to aviation. This study includes the Collegiate Aviation Review, the Journal of Air Transportation World Wide, the Journal of Aviation/Aerospace Education and Re-search, and the International Journal of Applied Aviation Studies. Two related publications, the Journal of Aviation Management and Education and the International Journal of Professional Avi-ation Training Testing Research, were omitted as there were too few articles in each from which to make meaningful conclusions. The date ranges of the journal issues that were included in this study are listed in Table 2. These journals yielded 459 research articles. Each of these articles was care-fully examined to determine whether or not they contained any type of statistical tests. All types of inferential statistics were included, e.g. parametric analyses such as tests of mean differences, correla-tion, regression, etc. Non-parametric analyses, e.g. chi square, Mann Whitney U, etc., were also in-cluded. Further, if the article came in Adobe PDF, Microsoft Word, or other searchable text document, the keyword “statistic” was used to serve as a con-firmation that all statistical data were detected.
G*Power 3.1 and PASS 2008 software were used to conduct a post hoc power analysis for each test identified within the included articles. This calculation was based upon the statistical test used, sample size, and alpha level provided in the article. Power analysis was conducted at small, medium,
were analyzed. The average power among all jour-nals over the five year period evaluated was 0.23 considering a small effect size, 0.71 when using a medium effect size, and 0.93 for large effect size.
Bezeau and Graves (2001) found slightly more encouraging results through a scrutiny of 66 clini-cal neuropsychology studies among three jour-nals between 1998 and 1999. It was found that the mean power for studies assuming a 0.50 ef-fect size to be 0.50, with those at the 0.80 effect size power was 0.768, and for those with an effect size of 1.35, the mean power was 0.957. Yet this study identified general deficiencies in statistical methods that were used noting that “few studies appear[ed] to conduct a priori power analyses; only 3% of the reviewed studies reported such an analysis [… and] only 9% of the reviewed […] studies explicitly reported the effect size of their results” (Bezeau & Graves, 2001, p. 403).
The plethora of research supporting the calcu-lation of power prompted Osborne (2008) to at-tempt to identify if the inclusion of such statistical analysis has improved over time. The power val-ues discovered by Cohen (1962) were compared to 96 educational psychology journal articles from 1998-1999. The findings indicated “significant but modest differences in observed power” (Osborne, 2008, p. 156) however a majority of articles still failed to surpass the desirable 0.80 power level. Among the more recent articles, the mean power presuming a small effect was 0.27, with a medium effect it was 0.71, and with a large effect it was 0.89. Only 2% of articles in the study discussed power and only 16.7% reported effect size.
Table 2.
Issues/Date Ranges of Included Journals.
Journal Name Date RangeCollegiate Aviation Review 1985 – Spring 2010Journal of Air Transportation World Wide 1996 – 2004Journal of Aviation/Aerospace Education and Research 1990 – 2003aInternational Journal of Applied Aviation Studies 2003 – Summer 2010
An Analysis of Statistical Power in Aviation Research

International Journal of Applied Aviation Studies | 77
yses. A total of 580 statistical tests were conduct-ed within these studies with an average of 16.5 tests per article. Within the issues of the Journal of Air Transportation World Wide (JATW), there were 104 articles of which 29 included statistical tests. In the JATW there were 4 (13.7%) articles in which power analyses were not possible leav-ing at total of 25 articles that could be utilized. In these remaining articles there were 463 tests with an average of 18.5 tests per article. The Journal of Aviation/Aerospace Education and Research (JAAER) contained 40 articles of which 7 includ-ed statistical testing. However, 1 (14.2%) article lacked sufficient data to calculate power, thus 6 ar-ticles were able to be analyzed leaving 29 overall statistical tests resulting in an average of 4.8 tests per article. The International Journal of Applied Aviation Studies (IJAAS) included 160 studies with 65 containing statistical data. Three (4.6%) articles in the IJAAS had inadequate data to exam-ine power leaving 62 articles to be studied. Within these articles, there were 620 tests conducted with an average of 10.0 tests per article. Across the 4 journals included in this study, the total number of articles that included the necessary information to conduct power analyses was 128. Within these articles there were 1,692 statistical tests conducted (see Table 3).
Each article identified to have statistical tests within it was examined so as to extract the neces-sary information to calculate power. Next, power analyses were conducted at the small, medium, and large effect sizes for each identified statistical test. In all but a few limited cases, G*Power 3.1 was sufficient to calculate power. In the instances that G*Power was lacking an applicable calculation, PASS 2008 was utilized. In the limited number of cases in which neither software package offered a solution (e.g. for MANCOVA), per the recom-mendations of Cohen (1962) and Dattalo (2008), substitutions were made for tests that were cal-culable by available software. Such substitutions have the tendency to slightly overrate the power (Cohen, 1962). For each individual publication, all of the power analyses for each statistical test were averaged for the small, medium, and large
and large effect sizes as outlined by Cohen (1988; 1992) with the value of effect size being tailored for each specific type of statistical test that was conducted. Unless an article specifically noted that a one tailed test was conducted, power analyses were calculated assuming a two tailed test.
An example of the calculation process follows. Assume a study utilized a two tailed t-test to analyze the difference between two independent means. Within this study, the researcher selected an alpha level of 0.05 and had two independent samples both of which included 30 individuals. Using the guid-ance of Cohen (1992), power for the effect sizes of small (0.20), medium (0.50), and large (0.80) can each be evaluated. For a small effect size, pow-er would be 0.118 and for a medium effect size, power would be 0.477. As a medium effect size is generally considered a reasonable level, this study would have poor power. In fact, there is less than a 50% chance that the study will correctly identify a difference between means if it exists. Only a study assuming a large effect size would have adequate power, in this case it would be 0.861.
Articles were also analyzed to determine if the authors had conducted an a priori power analysis. Further, each article was evaluated to establish whether or not power was mentioned or consid-ered. Lastly, articles were assessed for the presence of effect size calculations. These three details were uncovered through a thorough reading of the arti-cle. Further, if the article came in Adobe PDF, Mi-crosoft Word, or other searchable text document, the keywords “power” and “effect size” were used to serve as a confirmation that the appropriate mea-sures were detected.
Results
The Collegiate Aviation Review (CAR) included 155 articles with 41 containing statistical analysis. As the data were analyzed, it was discovered that there were several articles that failed to provide enough detail to conduct a power analysis. Among the CAR articles with statistical tests, 6 (14.6% of articles having statistical tests) omitted key details resulting in 35 articles that allowed for power anal-

78 |
Table 3.
Summary of Articles and Statistical Tests Included in this Study
Journal Name # Articles (%) # Stat. Tests (%)
Collegiate Aviation Review 35 (27.3) 580 (34.3)
Journal of Air Transportation World Wide 25 (19.5) 463 (27.4)
Journal of Aviation/Aerospace Education and Research 6 (4.7) 29 (1.7)
International Journal of Applied Aviation Studies 62 (48.5) 620 (36.6)
Total Averages (All Journals) 128 (100) 1,692 (100)
Table 4.
Summary of Power Analyses per Each Level of Effect Size for Each Journal.
Journal Name Small ES Medium ES Large ES
Collegiate Aviation Review .156 .697 .915
Journal of Air Transportation World Wide .428 .749 .906
Journal of Aviation/Aerospace Education and Research .144 .410 .623
International Journal of Applied Aviation Studies .274 .614 .796
Total Averages (All Journals) .277 .685 .874
Table 5.
Percent of Articles Including A Priori Power Analysis, Mention of Power, and Mention of Effect Size.
Journal Name A Priori Power Men-tioned ES Mentioned
Collegiate Aviation Review 0.6% 1.3% 0.6%
Journal of Air Transportation World Wide 0.0% 0.0% 3.4%
Journal of Aviation/Aerospace Education and Research 2.5% 2.5% 2.5%
International Journal of Applied Aviation Studies 9.5% 22.2% 4.8%
Average % (All Journals) 5.6% 11.9% 4.2%
An Analysis of Statistical Power in Aviation Research
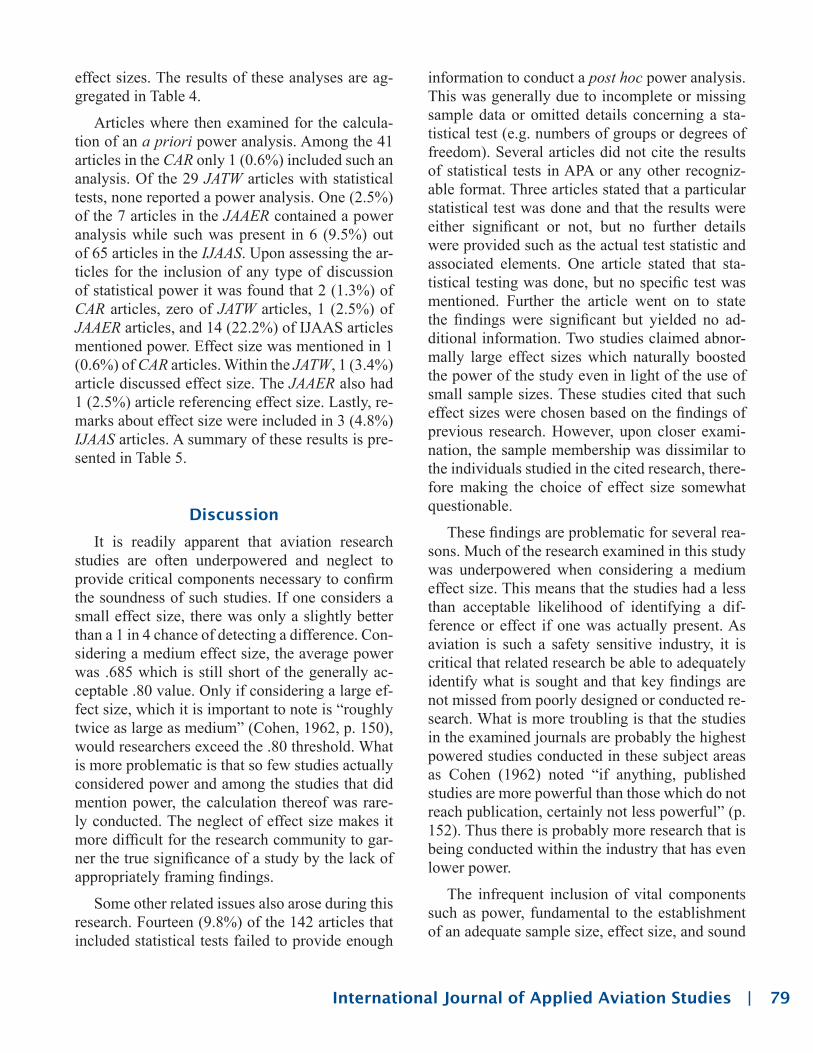
International Journal of Applied Aviation Studies | 79
information to conduct a post hoc power analysis. This was generally due to incomplete or missing sample data or omitted details concerning a sta-tistical test (e.g. numbers of groups or degrees of freedom). Several articles did not cite the results of statistical tests in APA or any other recogniz-able format. Three articles stated that a particular statistical test was done and that the results were either significant or not, but no further details were provided such as the actual test statistic and associated elements. One article stated that sta-tistical testing was done, but no specific test was mentioned. Further the article went on to state the findings were significant but yielded no ad-ditional information. Two studies claimed abnor-mally large effect sizes which naturally boosted the power of the study even in light of the use of small sample sizes. These studies cited that such effect sizes were chosen based on the findings of previous research. However, upon closer exami-nation, the sample membership was dissimilar to the individuals studied in the cited research, there-fore making the choice of effect size somewhat questionable.
These findings are problematic for several rea-sons. Much of the research examined in this study was underpowered when considering a medium effect size. This means that the studies had a less than acceptable likelihood of identifying a dif-ference or effect if one was actually present. As aviation is such a safety sensitive industry, it is critical that related research be able to adequately identify what is sought and that key findings are not missed from poorly designed or conducted re-search. What is more troubling is that the studies in the examined journals are probably the highest powered studies conducted in these subject areas as Cohen (1962) noted “if anything, published studies are more powerful than those which do not reach publication, certainly not less powerful” (p. 152). Thus there is probably more research that is being conducted within the industry that has even lower power.
The infrequent inclusion of vital components such as power, fundamental to the establishment of an adequate sample size, effect size, and sound
effect sizes. The results of these analyses are ag-gregated in Table 4.
Articles where then examined for the calcula-tion of an a priori power analysis. Among the 41 articles in the CAR only 1 (0.6%) included such an analysis. Of the 29 JATW articles with statistical tests, none reported a power analysis. One (2.5%) of the 7 articles in the JAAER contained a power analysis while such was present in 6 (9.5%) out of 65 articles in the IJAAS. Upon assessing the ar-ticles for the inclusion of any type of discussion of statistical power it was found that 2 (1.3%) of CAR articles, zero of JATW articles, 1 (2.5%) of JAAER articles, and 14 (22.2%) of IJAAS articles mentioned power. Effect size was mentioned in 1 (0.6%) of CAR articles. Within the JATW, 1 (3.4%) article discussed effect size. The JAAER also had 1 (2.5%) article referencing effect size. Lastly, re-marks about effect size were included in 3 (4.8%) IJAAS articles. A summary of these results is pre-sented in Table 5.
Discussion
It is readily apparent that aviation research studies are often underpowered and neglect to provide critical components necessary to confirm the soundness of such studies. If one considers a small effect size, there was only a slightly better than a 1 in 4 chance of detecting a difference. Con-sidering a medium effect size, the average power was .685 which is still short of the generally ac-ceptable .80 value. Only if considering a large ef-fect size, which it is important to note is “roughly twice as large as medium” (Cohen, 1962, p. 150), would researchers exceed the .80 threshold. What is more problematic is that so few studies actually considered power and among the studies that did mention power, the calculation thereof was rare-ly conducted. The neglect of effect size makes it more difficult for the research community to gar-ner the true significance of a study by the lack of appropriately framing findings.
Some other related issues also arose during this research. Fourteen (9.8%) of the 142 articles that included statistical tests failed to provide enough

80 |
tistical analysis, yet aviation research is apparently lagging in the reporting of effect sizes.
The question that remains is what can be done to improve future aviation research? Considering that most studies tend to use α = 0.05 and, assum-ing a medium effect size (as many studies do not have a known or defined effect size), the problem appears to lie with sample size. As Cohen (1962) noted “if we then accept the diagnosis of general weakness of the studies, what treatment can be prescribed? Formally, at least, the answer is sim-ple: increase sample sizes” (p. 151). Of course, there will be times when sample sizes are limited due to a variety of constraints, for example fiscal or practical limits. It is not uncommon for aviation program populations to be so small that extracting ample numbers for samples, particularly if mul-tiple groups are required, is not possible.
Considering that small sample sizes are com-mon in aviation research, lamenting the need to increase sample size is not practical and provides no solutions to aviation researchers. Instead, re-searchers need a toolbox to access during their re-search design process in order to maximize power even if it does not reach the minimums advocated in the literature.
One method to increase power is to accept a larger alpha level. In studies that do not have im-mediate safety or large financial implications, a higher tolerance for Type I errors could be accept-ed. Thus diversions from what is generally consid-ered “the norm” may be viable options in certain situations. Leahey (2005) rigorously argued that blindly selecting the .05 significance level is prob-lematic and the individual research setting should be considered when selecting alpha levels. There are instances when it is certainly reasonable to use a “non-standard” alpha of .10. According to the University of New England (2000), there are even cases where an alpha of .20 may be reasonable. Regardless of the choice of alpha, “at a minimum, the reporting of β would [help to] complement and interpret the true value of a reported α in any given study” (Cohen, 1962, p. 82). As is true with any well conducted study, all decisions in research design such as determining sample size, α, and β
statistical reporting is extremely disconcerting. As Spybrook (2008) stated:
for reviewers to be able to confidently assess whether a study has adequate power, the pa-rameters required to conduct a power analysis must be included […]. The failure to report these parameters causes two problems: (a) the reviewers cannot replicate the analysis and (b) the reviewers cannot judge the appropriate-ness of the parameters used in the analysis. (p. 230)
Again this disserves the aviation industry. While the lack of the mention of power analysis does not guarantee that it was not appropriately assessed, its omission leaves readers to wonder if the researcher did in fact consider it. The merit of research is directly related to the ability to recon-struct a particular study. Missing information calls the dependability of such research into question. Moreover, in order for the aviation industry to make improvements and gains in understanding, stakeholders need to be provided with sound, well-conceived research.
It is clear that aviation research is often under-powered and frequently underreports effect size and power however this should be kept in perspec-tive. The performance of aviation research should be compared to other subject areas in recent re-search. The Borkowski, Welsh, and Zhang (2001) study of over 14,000 accounting articles yielded an average power of 0.71 with medium effect size. Osborne (2008) similarly found that educational psychology articles in 96 journals had the same av-erage power, 0.71, at the medium effect size. Re-call that the average power calculated in this study was .685 which is closely comparable. Bezeau and Graves (2001) found that 3% of neuropsychology articles that were examined mentioned power and 9% calculated effect size. Osborne (2008) discov-ered that 2% of educational psychology articles in the study mentioned power while 16.7% reported effect size. This study found that aviation research mentioned power in 11.9% of articles and effect size was calculated in 4.2% of cases. So in the case of power, aviation research is at least performing better in recognizing this important aspect of sta-
An Analysis of Statistical Power in Aviation Research

International Journal of Applied Aviation Studies | 81
tween the two types of analysis are marginal when sample sizes are large, there are noticeable differ-ences when dealing with small samples. Since gen-erally the problem is the sample size is too small, parametric analyses should be chosen if possible. Such advice does come with the caveat that small samples often do not fit the assumptions of para-metric tests, so caution is necessary to insure that the attributes of the sample are examined for com-pliance with such assumptions.
It is important to note that even if an a priori power analysis comes up short of the recommend-ed .80, that in itself is not a reason to abandon the research project. If the value is still lower than the .80 or other value selected by the researcher after every effort has been made to improve power, the research can still move forward with the research but should note the power issue as a potential sig-nificant limitation. Also, if the null-hypothesis ends up being retained, the researcher would need to ex-plain that this could be attributed to the study being underpowered. Researchers should still feel confi-dent in submitting such studies for publication be-cause much can be learned from the design, imple-mentation, sampling, analysis, and findings, or lack thereof. And since there still is a limited amount of aviation literature available to the research com-munity, such studies can be enlightening on how to design and conduct future studies as well as iden-tifying areas that call for additional investigation. See appendix A for a checklist on ways to improve power or reduce sample size.
The findings here can also assist individuals other than researchers. The evidence presented here should serve as an encouragement to journal editors and reviewers to pursue the recommenda-tions of the APA Task Force on Statistical Infer-ence by requiring the inclusion of evidence of power analysis and effect sizes in submissions. A wide range of journals now require such data in all submissions (Ferrin et al., 2007). This movement could help standardize the reporting of research making it easier for interpretation and evaluation results. This should help align aviation research with mainstream research. Perhaps the most posi-tive effect would be that “with an understanding of effect size estimates and confidence intervals, […]
levels should be backed with ample and appropri-ate citation support.
Another potential way to manage power and sample size is to further investigate or reconsider the effect size that is expected. Whilst it is often not possible to know what the effect size is going to be, it is worth digging into existing literature to see if anything similar has been done in the area of interest. If a larger effect size can be used in the power calculation, a smaller sample size or lower power would be required.
Researchers can also consider the use of a one-tailed test in lieu of a two-tailed test. Again, this choice should be supported by evidence in the lit-erature or if a critical component of the proposed inquiry. If a researcher can justify that there is an inclination for a directional hypothesis, e.g. look-ing for an increase rather than simply a difference between groups, then they can gain power or take the advantage of lowering the required sample size.
Another way that researchers can reduce their sample size burden or boost power is to design the study using dependent samples. Because of the lower variance between these groups, research-ers gain the aforementioned benefits. Clearly, not all studies lend themselves to be changed to this design, but it is worthy of consideration when pressed for power or sample size.
Researchers should be aware that different formulas are used in the calculation of power for each type of statistical test, therefore there is some variance in the power demands among individ-ual tests. Complex statistical analysis requires a larger sample size or, alternatively, lowers power. For example, a smaller sample is required when running a t-test versus an ANOVA with multiple groups. Although complex designs should not be abandoned if the research necessitates it, this cer-tainly should be part of the consideration to insure the highest probability of success with the goals of the research.
One more way to improve power or lower sam-ple size needs is to use parametric analyses instead of nonparametric types. While the differences be-

82 |
tors journals that likely would have large amounts of statistical analysis.
2. Editors and reviewers of aviation research journals should begin the discussion of raising data reporting standards to include appropriate sample size calculation, power analysis, the inclu-sion of effect sizes, and additional standards rec-ommended by the APA Task Force on Statistical Inference.
3. Editors and reviewers of aviation research journals may want to begin to accept research methods and best practices articles. These could help disseminate research-based guidance on how to conduct power analyses, calculate effect sizes, use and interpretation of confidence intervals, and how to appropriately cite statistical findings. Such “how-to” articles are common in many other fields of study and are certainly scholarly in nature as they are entirely rooted in the available research literature.
4. Aviation researchers should include evi-dence based reasoning for the selection of sample size, appropriate consideration of power, and the considered effect size. Further, researchers should insure that they report their statistical findings in a recognized, standard format (e.g. APA). If a study is underpowered, this should be clearly explained as a limitation and efforts to mitigate the effects of this on the study should be discussed.
5. Considering the small sample sizes that are common in some aviation studies, there should be a call for collaboration among aviation pro-grams to further enhance the body of research by boosting available sample sizes. These enhanced samples may provide more compelling results and perhaps make findings more generalizable.
6. Research sponsors such as the FAA and NASA should require the reporting of power and effect size for funded research projects.
7. Editors should supply a checklist of re-quirements to submitters that would include stan-dards for statistical reporting, e.g. the inclusion of power and effect size as well as reporting all data in a standardized (APA) format.
researchers can go beyond the reporting of statisti-cal significance (p-value) and report on practical significance” (Ferrin et al., 2007, p. 99) thus find-ings within aviation studies would be able to have enhanced meaning and applicability by allowing stakeholders to go beyond the typical dichotomous findings of hypothesis testing to find deeper, more pragmatic utility of results and conclusions. Edi-tors and reviewers could use the findings and rec-ommendations in this study to analyze the appro-priateness of methods used by researchers. Even if a study is found to be underpowered, reviewers and editors should determine if the researcher rec-ognized this limitation and made efforts to mitigate its effects on the study. As long as any limitations are properly recognized, the article should still receive consideration for publication keeping in mind the potential utility of the study in expanding the research literature even if the study is under-powered.
In sum, the aviation research studied here ap-pears to fall short of minimum desirable statistical power levels. This body of research infrequently discussed or calculated power and commonly ne-glected to present effect sizes. These facts call into question the sample size strategies used in these studies. Further, the validity of the conclusions made upon statistical analyses could therefore be debatable. In spite of this, aviation research does appear to be on par on most levels with current re-search in other subject areas. As these other fields call for higher standards for the reporting of re-search findings, aviation research must keep pace by doing the same. Moreover such improvements in research design and data analysis will provide for more complete, easier to understand, replica-ble, and meaningful research.
Recommendations
The findings of this research call for sugges-tions for consideration and for future investigation. These include:
1. An expanded study should be conducted on a wider range of aviation publications that includes subject areas such as psychology and human fac-
An Analysis of Statistical Power in Aviation Research

International Journal of Applied Aviation Studies | 83
Ferrin, J., Bishop, M., Tansey, T., Frain, M. Swett, E., & Lane F. (2007). Conceptual and practical implications for rehabilitation research: Effect size estimates, confidence intervals, and pow-er. Rehabilitation Education, 21(2), 87-100.
Fisher, R.A. (1966). The design of experiments (8th ed.). Hafner: Edinburgh, UK. (Original work published 1935)
Jones, A., & Sommerlund, B. (2007). A critical dis-cussion of null hypothesis significance testing and statistical power analysis within psycho-logical research. Nordic Psychology, 59(3), 223-230.
Kline, R. B. (2004). Beyond significance testing: Reforming data analysis methods in behavior-al research. Washington, DC: American Psy-chological Association.
Kosciulek, J., & Szymanski, E. (1993). Statisti-cal power analysis in rehabilitation counseling research. Rehabilitation Counseling Bulletin, 36(4), 212.
Leahey, E. (2005). Alphas and asterisks: The de-velopment of statistical significance testing standards in Sociology. Social Forces, 84(1), 1-24.
Osborne, J. W. (2008). Sweating the small stuff in educational psychology: how effect size and power reporting failed to change from 1969 to 1999, and what that means for the future of changing practices. Educational Psychology, 28(2), 151-160.
Sedlmeier,P., & Gigerenzer, G. (1989). Do studies of statistical power have an effect on the power of studies? Psychological Bulletin, 105(2), 309-316.
Stevens, J. P. (2007). Intermediate statistics: A modern approach (3rd ed.). New York: Law-rence Erlbaum Associates.
Spanos, A. (1999). Probability theory and statisti-cal inference: econometric modeling with ob-servational data. Cambridge, UK: Cam-bridge University Press.
8. Further research should be conducted into the quality of statistical reporting in aviation re-search.
References
American Psychological Association (APA). (2010). Publication Manual of the American Psychological Association (6th ed.). Washing-ton, DC: Author.
Aguinis, H., Beaty, J., Boik, R., & Pierce, C. (2005). Effect size and power in assessing moderating effects of categorical variables using multiple regression: A 30-year review. Journal of Ap-plied Psychology, 90(1), 94-107.
Bezeau, S., & Graves, R. (2001). Statistical power and effect sizes of clinical neuropsychology re-search. Journal of Clinical and Experimental Neuropsychology, 23(3), 399-406.
Borkowski, S. C., Welsh, M. J., & Zhang, Q. M. (2001). An analysis of statistical power in be-havioral accounting research. Behavioral Re-search in Accounting, 13, 63-84.
Cohen, J. (1962). The statistical power of abnor-mal-social psychological research: A review. Journal of Abnormal and Social Psychology, 65(3), 145-153.
Cohen, J. (1988). Statistical power analysis for the behavioral sciences (2nd ed.). New York: Psychological Press.
Cohen, J. (1992). A power primer. Psychological Bulletin, 112(1), 155-159.
Coladarci, T., Cobb, C., Minium, E., Clarke, R. (2007). Fundamentals of statistical reasoning in education (2nd ed.). Hoboken, NJ: John Wiley & Sons, Inc.
Dattalo, P. (2008). Determining sample size: Bal-ancing power, precision, and practicality. New York: Oxford University Press.
Fagley, N. S. (1985). Applied Statistical Power Analysis and the Interpretation of Nonsignifi-cant Results by Research Consumers. Journal of Counseling Psychology, 32, 391-396.

84 |
Spybrook, J. (2008). Are power analyses reported with adequate detail? Evidence from the first wave of group randomized trials funded by the Institute of Education Sciences. Journal on Research Educational Effectiveness, 1, 215-255.
University of New England. (2000). What α-level? Retrieved from http://www.une.edu.au/Web-Stat/unit_materials/c5_inferential_statistics/what_alpha_leve.html
Blank page
An Analysis of Statistical Power in Aviation Research

International Journal of Applied Aviation Studies | 85
The Effects of Caffeine on Learning: A Pilot’s
Perspective
University of New South WalesDepartment of AviationUNSW Sydney NSW [email protected]
Abstract
Caffeine is known for its performance enhanc-ing properties. The majority of research focuses on the immediacy effect of caffeine on performance. In contrast, there appears to be limited understand-ing of the effect of caffeine on the rate at which in-dividuals acquire or learn information. As a result, the present study sought to investigate whether caffeine can facilitate the rate at which individuals acquire and apply skills. Forty-five participants (all pilots) were randomly divided into three groups (0mg/kg, 3mg/kg & 5mg/kg of caffeine) and were asked to complete twelve sessions on a complex computer-based game titled Space Fortress. Fol-lowing two familiarization trials, administration of caffeine, and a 30-minute distracter task, all par-ticipants completed ten consecutive sessions on Space Fortress. Data relating to individual perfor-mance on the ten sessions were analyzed in four separate areas – Total Score, Control, Speed, and Accuracy. The results revealed a trend where the 3mg/kg group outperformed both the 0mg/kg and the 5mg/kg groups. The results also suggest that caffeine in dosages equivalent to 5mg/kg have the potential to hinder effective learning. These find-ings are discussed from a theoretical and opera-tional perspective.
The Effects of Caffeine on Learning: A Pilot’s Perspective
As a drug - albeit legal, caffeine is the most widely consumed behaviorally active substance in the world (Fredholm, Battig, Holmen, Nehlig, & Zvartau, 1999). Caffeine is most commonly con-sumed in the form of tea or coffee. However, it is present in a large (but not all) number of other consumable products such as chocolate, candy, medication, and some energy drinks (Daly, 1993). The benefits of consuming caffeine include: reduc-ing the effects of fatigue (Petrie & Dawson, 1997; Caska & Molesworth, 2007), improving alertness (Caldwell, 1997), enhancing vigilance (Smith, Kendrick, Maben, & Salmon, 1994), enhancing physical performance (Wiles, Colemand, Teg-erdine, & Swaine, 2006) and improving decision-making (Lyvers, Brooks, & Matica, 2004).
Within the aviation industry, pilots commonly use caffeine in the form of coffee as a coping strat-egy during critical phases of flight to mitigate the effects of fatigue (Petrie, & Dawson, 1997; Taneja, 2007). In one study that was designed to under-stand the effects of fatigue among aircrew of the Indian Air Force, 82% of respondents reported us-ing caffeine in the form of tea or coffee as their preferred fatigue countermeasure (Taneja, 2007). In everyday life outside of flying, pilots and other professionals alike rely on caffeine for the same
Ricky Young and Brett R. C. Molesworth

86 |
Castellano, 1996; Si, Zhang, & Maleszka, 2005; Caska & Molesworth, 2007).
In contrast to the single-test design studies, there appears to be limited research that examines the effect of caffeine over multiple trials, hence rate of learning. The two most cited studies em-ploy cross-sectional surveys focusing on the long-term relationship between self-reported caffeine use and human performance (Jarvis, 1993; Box-tel, Schmitt, Bosma, & Jolles, 2003). While the results of both studies conclude that habitual caf-feine intake improves reaction time, their findings disagree in terms of cognitive enhancement. Spe-cifically, while Jarvis (1993) found after control-ling for confounding variables such as age, sex, class, and education level, a person who drank six or more cups of coffee or tea a day scored between 4 and 5% higher on an incidental verbal memory and a visuo-spatial reasoning task in comparison to a person who abstained from drinking tea or coffee, Boxtel et al. (2003) found no such effect. Therefore, the main aim of the present research was to examine the effects of caffeine on the rate of learning, over a period more reflective of the operational environment in aviating.
Since the majority of research examining the effects of caffeine on human performance con-cludes in favor of higher dosages in a dose-depen-dent manner (Kaplan et al., 2000; Erikson et al., 1985), the present study sought to investigate both a low (3mg/kg) and moderate (5mg/kg) dosage of caffeine. The significance of the lower dosage of caffeine is evident in the applied environment. Specifically, pilots and other professionals alike consume caffeine in the form of coffee or tea in dosages equivalent to three milligrams per kilo-gram of body weight. This roughly equates into one large strong cup of coffee, or two average-sized cups, opposed to a five milligram per kilo-gram dose (see Caska & Molesworth, 2007). Fi-nally, pilots were selected for the research namely because: they self-report high levels of caffeine consumption directly prior to crucial phases of flight, such as landing (Petrie & Dawson, 1997; Taneja, 2007), and the hierarchical structure on most flight decks reflects that of a trainer-trainee
performance enhancing properties. Consider an adult learning environment such as tertiary educa-tion or work related training/education course. It is not uncommon for caffeine in the form of tea, cof-fee or an energy drink to be consumed during such events. The use of caffeine in these circumstances forms the basis of this research. Specifically, the main aim of the present research is to examine the effect of caffeine on learning.
While the relative immediacy of caffeine on hu-man performance appears reasonably understood (Kaplan, Greenwood, Winocur, & Wolever, 2000; Erikson et al., 1985; McLellan, Bell, & Kamimori, 2004 Smith, Kendrick, Maben, & Salmon, 1994; Busch, Taylor, Kanarek, & Holcomb, 2002; Tucha et al., 2006, Molesworth & Young, 2008), there appears to be limited understanding of the effect of caffeine on the rate at which individuals acquire or learn information. According to White, (1988) cognitive enhancement occurs as a result of im-proving the components involved in mental activi-ties or brain functions, which in turn contribute to controlling observable behavior. Such components include, although not limited to the processes in-volved in perception, attention, memory (storage and retrieval), cognitive mapping and high-level motor integration. Memory appears to play a lead-ing role in this process (Jarvis, 1993; Gold, 2006). Facilitating memory permits the integration of previous with present material, hence improving performance.
A review of the research literature in the area of caffeine and learning suggests no shortage of studies. When consumed in moderate to high dos-ages (between 4 and 7 milligrams per kilogram (mg/kg)) the effects of caffeine frequently reveal a dose-dependent relationship (Kaplan et al., 2000; Erikson et al., 1985). In contrast, the effect of caf-feine in low dosages is less clear (Smit & Roger, 2000; Gillingham, Keef, Keillor, & Tikusis, 2003; Tucha et al., 2006). However, the vast majority of these studies employ single-test designs, thereby focusing on the immediate effect of caffeine on information retention or learning, opposed to how it facilitates in information acquisition (Cestari &
Effects of Caffeine on Learning

International Journal of Applied Aviation Studies | 87
lemons. Additional material included: one person-al computer with an optical two-button mouse, one Saitek Cyborg ST90 joystick, Sartorius Analytic scales (to weigh caffeine), digital personal scales (to weigh participants), and Space Fortress.
Space Fortress is a computer-based game that was designed as a research tool at the University of Illinois - Cognitive Psychophysiology Labora-tory for the study of complex skills and its acqui-sition (Mane & Donchin, 1989). The objective of the game is to destroy the space fortress located in the centre of the screen. This is achieved by fir-ing missiles from a space ship under the control (speed and direction) of the operator. The process of destroying the fortress involves first making it vulnerable, followed by a burst of rapid fire. In order to make the fortress vulnerable, the operator needs to hit the fortress ten times with at least 250 msec between each hit. Once this is achieved, it can then be destroyed by two quick shots within an interval of less than 250 msec.
The fortress is however not defenseless. The fortress defends itself by returning fire. It also pos-sesses a second line of defense which involves the use of mines. The mines can either be ‘friendly’ or ‘foe’. The operator is able to distinguish be-tween the type of mine based on a letter which accompanies the mine when presented. Prior to each game a series of letters are presented to the operator which are used to identify the status of the mine. Friendly mines should not be destroyed as they ‘energize’ the ship. In contrast, foe mines should be destroyed. In order to do this, the op-erator needs to switch between weapon systems by pressing a button twice within an interval of between 250 and 400 msec and then ensuring they score a direct hit.
Points are awarded when the operator hits a hostile element or deducted when their ship is damaged, destroyed, or when a missile fails to hit a target. At the commencement of the game players are provided 100 missiles. Throughout the game, numerous opportunities are presented for the play-er to obtain more missiles. These predominately occur as a result of the player completing a sec-ondary task such as pressing certain buttons when
relationship (Captain/Co-pilot) where co-pilots of-ten polish their skills under the watchful eye of the Captain. Therefore, this study sought to determine whether caffeine might have a beneficial effect in facilitating the rate of information acquisition or development of skills. Specifically, it was hy-pothesized that caffeine would have a dose-depen-dent effect on the rate at which participants/pilots learned.
Method
Participants
Forty-five participants were recruited from the University of New South Wales (UNSW) Aviation flight training school located at Bankstown airport. All participants were required to hold a current Class 1 Aviation Medical Certificate, indicating they were medically fit for flying. While failure to hold a Class 1 Aviation Medical Certificate served as an exclusion criterion by default, five others were employed. They included: female pilots who indicated that they were pregnant or breast feeding; pilots in general who indicated that they had previ-ously experienced an adverse reaction to caffeine; pilots who indicated they had consumed caffeine within six hours prior to the research; or pilots who had consumed food within one hour prior to the research (no pilots excluded). The participants were randomly divided into three groups (0mg/kg, 3mg/kg & 5mg/kg). The mean age was 20.60 (SD = 2.18) years, the mean total flight experience was 132.04 (SD = 77.76) hours and the mean total hours in the past 90 days was 13.70 (SD = 23.44). The study protocol was approved in advance by UNSW’s Human Research Ethics Committee, and student participation in the research was entirely voluntary (i.e., no research participation payments or course credits awarded).
Apparatus and Stimulus
The material comprised: information and con-sent forms, demographics questionnaire, Epworth Sleepiness Scale, Zuckerman’s Sensation Seeking scale, Hunter Risk Perception scale 1 and 2, phar-maceutical grade caffeine, distilled water, and fresh

88 |
drug (i.e., irregular heart beats (arrhythmia), in-crease blood pressure, respiratory problems, renal and nervous system problems; Daly, 1993). While this process is not unique to this research (see Kamimori, Johnson, Thorne, & Belenky, 2005; Smit & Rogers, 2000; Lyvers et al., 2004) it is important to acknowledge the potential ‘placebo effect’ which may have resulted.
Since caffeine withdrawal has been identified as a factor that impacts on the results of caffeine studies (Yeomans, Ripley, Davies, Rusted, & Rod-gers, 2002), participants were also asked to abstain from consuming caffeine products for a period of six hours prior to the research. The benefit of this timeframe was threefold. Specifically, since the half-life of caffeine is between three and seven hours, there should be negligible, if any, residual effects. For habitual caffeine users, the positive stimulant effect of caffeine is reversed soon after the drug is ceased (D’Anci & Kanarek, 2006). Fi-nally, withdrawal symptoms associated with the discontinued use of caffeine begin 12 to 24 hours post last administration (Dews, O’Broem, & Berg-man, 2002).
For all pilots who agreed to volunteer for the study, a mutually suitable time between the hours of 0900 and 1100 was arranged with the research-er to partake in the study. This is also important as it ensured that the effects of circadian rhythms did not adversely impact on the study (Kirkcaldy, 1984).
On the day of the research, participants were initially weighed and then asked to complete pre-experiment demographics and consent forms. Based on the self-reported information in these forms, no participants were excluded from the study as all indicated that they abstained from caf-feine consumption for a period of six hours prior to the experiment and food consumption one hour prior, as requested.
Participants were then provided two practice games on Space Fortress. The first practice game was accompanied by instructions, while the second practice game provided the participants an oppor-tunity to become familiar with the game. Follow-ing the practice games, and depending on which
a specific symbol is presented (i.e., dollar sign). Therefore, a player can obtain a positive score re-flecting some level of mastery in the area of per-ceptual, cognitive, and motor skills, to a negative score indicating deficiencies in these areas (Mane, & Donchin, 1989).
According to designers of Space Fortress, there are 50 parameters which shape and form the game (Mane, & Donchin, 1989). As a result, perfor-mance can be measured at various levels. The most obvious is overall proficiency which is reflected in ‘Total Score’. At a sub-level, researchers are able to determine the speed at which participants’ iden-tify and destroy mines that appear on the screen (Speed). This is said to be an indirect measure of participants’ memory and reaction time. Research-ers are also able to determine participants’ psycho-motor skills through the accuracy of their shots, in terms of hitting hostile elements (Accuracy). Re-searchers are also able to determine participants’ hand-eye coordination and dexterity through how well they maintained control over the ship (Con-trol) (Mane, & Donchin, 1989; Shebilske et al., 2005).
Design
The experiment comprised a single blind be-tween subjects mixed methods experimental de-sign. The aim of the experiment was to examine the effect of caffeine on pilot learning. The study comprised one independent variable with three levels (0mg/kg, 3mg/kg and 5mg/kg of caffeine). The Dependant Variables (DV) included partici-pants’ Total Score (main DV), Control, Speed, and Accuracy during 10 consecutive games on Space Fortress.
Procedure
Participants were informed about the study dur-ing academic classes at UNSW Kensington cam-pus and during flight theory classes at Bankstown aerodrome. This included information about the exclusion criteria as well as limited but necessary details about the research. Moreover, since the re-search concerned the use of a drug, albeit legal, all participants were informed about the potential risks associated with the administration of this
Effects of Caffeine on Learning

International Journal of Applied Aviation Studies | 89
Pre-Screening
The effects of sleepiness. Since the effect of daytime sleepiness has previously been identified as a factor which influences performance, a univariate analysis of variance was employed to determine whether differences existed between groups as self reported using the Epworth Sleepiness Scale (ESS). The results failed to reveal a difference between group (0mg/kg, 3mg/kg & 5mg/kg), in terms of self reported sleepiness F(2, 42) = 1.68, p = 1.99, η2 = .074. These results suggest that all participants experienced the same level of arousal.
The effects of prior gaming experience. Similar to examining the effects of daytime sleepiness across groups, it was also important to examine whether groups varied as a result of prior gaming experience. Since computer-based video games largely fall into two categories, namely video game with consoles and video games with joysticks, two separate univariate analyses were performed. With alpha set a .05, the results of two univariate analysis of variances failed to reveal any statistically significant differences between group and gaming experience, largest F, F(2, 42) = .43, p = .65, η2 = .020. As a result, it can be concluded that the three groups were not significantly different in terms of their computer-based gaming experience.
Main Data Analyze
Rate of learning. The main aim of the current experiment was to examine the effect of caffeine on the rate at which individuals (pilots) acquire and apply knowledge and skills - rate of learning. Rate of learning is expected to be a function of performance. Thus in the present study, any increase in performance is reflected in an increase in score. Remember, a player can obtain a positive score reflecting some level of mastery in the area of perceptual, cognitive, and motor skills. Similarly a player can obtain a negative score indicating deficiencies in these areas. In order to
group participants were randomly assigned, they were asked to consume a lemon based solution containing either, zero, three, or five milligrams of caffeine per kilogram of body weight. The lemon, which was freshly squeezed, served to mask the bitter taste of the caffeine. Since the caffeine was pharmaceutical grade in the form of white soluble powder, no smell was present.
Following consumption of the lemon based solution, participants were provided a distracter task that took approximately 30 minutes and in-volved completing Zuckerman’s Sensation Seek-ing scale and Hunter’s Risk Perception scale 1 and 2. The purpose of the distracter task was to allow sufficient time for the caffeine administered to be absorbed (Arnaud, 1993; D’Anci & Kanarek, 2006) and reflected a time consistent with caffeine consumption on the flight deck prior to landing. After the distracter task, participants were asked to complete 10 consecutive games on Space For-tress. Each game took approximately three min-utes to complete. Hence, the testing phase of the experiment lasted for approximately 30 minutes, well within the half-life estimates (e.g. three to seven hours) of caffeine (D’Anci & Kanarek, 2006). At the conclusion of the ten games, partici-pants were offered a glass of water to counter the possible dehydration effect of caffeine, debriefed, and thanked for their participation.
Results
Analyses
The main aim of the study was to examine the effect of caffeine on pilot learning ability. This involved measuring and comparing pilots’ perfor-mance in terms of Total Score, in addition to three sub categories: Control, Speed, and Accuracy over 10 consecutive games. Prior to analyzing the re-sults of each game across the four dependent vari-ables, it was important to first establish that the re-sults being examined were not influenced by any external factors such as the effects of sleepiness or prior gaming experience. Therefore, a series of univariate analyses of variance were conducted in these areas.

90 |
SLRL). This result suggests that caffeine in 3mg/kg dosages facilitates in the rate of learning op-posed to abstaining from caffeine, whereas 5mg/kg appears to degrade performance (i.e., learning) compared to caffeine abstinence or 3mg/kg.
Once performance plateaus, as seen post-test 6, the SLRL is more subdued. Specifically, the SLRL for the 3mg/kg group was 46.67, for the 0mg/kg group 25.95, and 34.60 for the 5mg/kg group. Ex-trapolating this data (tests 7 - 10), the results sug-gest that any improvement in performance evident up to this point is maintained across group.
In order to determine if caffeine had a greater impact on one aspect of learning opposed to an-other, participants’ performance was examined on the three key sub-levels of Total Score for tests 1 to 6. Consistent with the previous analyses, SLRL
examine if this was the case, multiple time series analyses were employed.
As seen in Figure 1, data1 relating to partici-pants’ performance over the ten test games appear to fall into two categories, based on the number of tests completed. Specifically, participants’ perfor-mance across all groups, up to and including test 6, appear curvilinear, whereas participants’ per-formance post-test 6 appear linear, reflecting the x-axis (i.e., plateau). Figures 2 – 4 (scatter plots) illustrate the dispersion of scores in each group during this period of heightened learning (i.e., tests 1 - 6). An inspection of the Slope of the Linear Re-gression Line (SLRL) for the first 6 tests revealed the 3mg/kg groups’ (270.90 – SLRL) rate of learn-ing was higher than the 0mg/kg groups’ (205.70 – SLRL), as well as the 5mg/kg groups’ (125.22 –
1 The results of an ANOVA failed to reveal a statisti-cal difference between the three groups during the first test F(2, 42) = 1.01, p = .38, η2 = .046, suggest-ing all groups performed equally.
Figure 1. Total score for each treatment group over the ten tests.
-3000
-2000
-1000
0
1 2 3 4 5 6 7 8 9 10Test Session
Scor
e
0mg/kg 3mg/kg 5mg/kg
Effects of Caffeine on Learning

International Journal of Applied Aviation Studies | 91
Figure 2. Test scores from the 0mg/kg group, including line of best fit over test sessions 1 - 6.
Figure 3. Test scores from the 3mg/kg group, including line of best fit over test sessions 1 - 6.
Figure 4. Test scores from the 5mg/kg group, including line of best fit over test sessions 1 - 6.

92 |
was reviewed across group for Control, Speed, and Accuracy. Table 1 displays the SLRL and the percent it represents of the total for each group (0mg/kg, 3mg/kg, & 5mg/kg caffeine) across the three sub-levels (Control, Speed and Accuracy) of Total Score. As evident from this table, the 5mg/kg consistently performed below the 0mg/kg and 3mg/kg groups. In contrast, the 0mg/kg out per-formed the 3mg/kg group on the Accuracy sub-level, while the reverse was true for the two other sub-levels. Overall, this data reflects a trend which suggests caffeine in dosages equivalent to 5mg/kg degrades performance in terms of skill acquisi-tion in the area of hand-eye coordination control (control), memory and reaction time (speed), and psychomotor skills (accuracy), while the reverse is true for caffeine in dosages equivalent to 3mg/kg.
Discussion
The main aim of the present study was to exam-ine the effects of caffeine on pilot learning. Spe-cifically, how caffeine influences the rate at which pilots acquire and apply information/knowledge. Pilots were asked to complete ten consecutive games on Space Fortress, thirty minutes post treat-ment (0mg/kg, 3mg/kg, or 5mg/kg of caffeine in a lemon based solution). Participants’ performance
throughout the games were measured and com-pared between groups in four areas. Specifically, data relating to participants’ Total Score and three sub-levels - Control, Speed, and Accuracy were compared and analyzed. It was hypothesized that caffeine would have a dose-dependent effect on the rate at which participants/pilots learned. The results overall failed to support the hypothesis. An inspection of the results revealed a relationship between caffeine and rate of learning. Specifical-ly, pilots who consumed 3mg/kg of caffeine ap-peared to acquire and apply knowledge and skills faster than those participants who abstained from caffeine or those participants who consumed 5mg/kg of caffeine. The most notable difference was observed with those participants who consumed the highest dosage of caffeine - 5mg/kg. Specifi-cally, participants who consumed 5mg/kg experi-enced what could only be described as learning detriment when compared to participants who ab-stained from caffeine.
Once the rate of learning appeared to plateau, this trend appeared to remain. Moreover, the 3mg/kg group, having appeared to learn faster and to a higher level, was able to sustain this advantage over the two other groups; the most notable being the 5mg/kg group. Similarly, the 0mg/kg group mirrored this result in comparison to the 5mg/kg group. The implication of these finding are far reaching. Consider the example proposed earlier
Table 1.
Slope of linear regression line and percent it represents of the total for each treatment group distributed across the three sub-level variables for test sessions 1 - 6.
Sub-Level of Total Score
Control (%) Speed (%) Accuracy (%)
0mg/kg 82.78 (34) 24.15 (36) 2.63 (49)
3mg/kg 105.94 (44) 37.35 (56) 2.13 (39)
5mgkg 53.93 (22) 5.43 (8) .65 (12)
Effects of Caffeine on Learning

International Journal of Applied Aviation Studies | 93
involving attending a conference, university lec-ture or training event and consuming caffeine in the form of tea or coffee. While there are a number of reasons for drinking caffeine, such as social or habit, the effect caffeine has on individuals’ ability to acquire information from such an event remains largely untested. Based on the results of the present study, it would appear drinking approximately one large cup of coffee (approximate caffeine equiva-lent to 3mg/kg) has a positive impact on both the rate at which individuals acquire information as well as their ability to maintain this superior per-formance when compared to caffeine abstinence or drinking in excess of 3mg/kg. If fact, the results suggest drinking in excess of 3mg/kg can only be described as detrimental to performance.
Performance decrements from caffeine con-sumption are not new. The medical profession, and specifically surgeons, have long known about the negative effects of caffeine on fine motor skills (see Urso-baiarda, Shurey, & Grobbelaar, 2007). However, the implication of this within the avia-tion industry appears largely unexplored. With the introduction of electronic interface flight con-trols, otherwise known as fly-by-wire (centre or side) controls (similar to a traditional computer joystick, except with the support of more sophis-ticated hardware and software), in a number of modern jet aircraft such as the Airbus A340 and A380 as well as some military jets, a reduction in pilots’ psychomotor skills may translate into an inability to complete fine or minor adjustments of the flight control. That said, there is little evidence to suggest that pilots consume caffeine in quanti-ties equivalent to the 5mg/kg tested in the present research.
Limitations and Future Research
The results of the present study should be in-terpreted with the presence of certain limitations. From an operational perspective, the most notable being the generalizability of the results. As dis-cussed above, this is as a direct result of the strict experimental parameters applied to the research. While such conditions facilitate in the objective
measure of the dependent variable, they do not re-flect those typically experienced in the operational environment. From a methodological perspective, and while there is no evidence to suggest that em-ploying a single-blind experiment design negatively impacted the results, it would be prudent to ensure that all future experiments consider employing a double-blind experimental design to reduce the po-tential of any researcher bias.
Future research should also attempt to obtain an object measure of caffeine levels (i.e., caffeine plasma levels) prior to experimentation to confirm self-reported caffeine abstinence. In addition, fu-ture research should attempt to tease out the effects of long-term (habitual) caffeine use on performance in terms of rate of learning. While the mean age of participants in the present study was 20 years, far less than that examined by Jarvis, (1993) and Box-tel et al., (2003) the effects of continual caffeine consumption at this age on rate of learning remains unknown and is indeed an area for future research.
Not negating the above limitations, it would be prudent to investigate the longevity of the effect seen in the present research. Moreover, future re-search should investigate whether the superior per-formance illustrated by 3mg/kg group is sustained over the long term or whether this performance is eroded once the stimulant effects of caffeine wear-off. Future research should also be directed towards investigating the underlying cognitive mechanisms resulting in the performance variations. Specifi-cally, while memory has been identified as a key component in cognition (Jarvis, 1993; Gold, 2006), the extent to which performance improvements in terms of rate of learning can attributed to memory alone remains unknown. Similarly, how caffeine impacts perception, attention, and decision-making in this area also requires further investigation.
Conclusion
In summary, caffeine is regularly used on the flight deck to enhance performance (Petrie & Daw-son, 1997; Taneja, 2007). From a trainee’s perspec-tive (i.e., co-pilot) the beneficial effects of caffeine potentially extend beyond the immediate and facil-

94 |
itates performance over the long-term, most likely through enhancements in memory. However, em-pirically there appears to be no known study to support this conclusion. As a result the present study sought to examine the effects of caffeine in facilitating the rate of learning. The results of the present study suggest that caffeine in low dosages equivalent to 3mg/kg facilitates in not only the rate of learning but maintaining this higher level of performance, albeit over a short period of time as seen in the present research. Importantly, when compared to abstaining from caffeine or drinking one large cup of coffee/tea (equivalent to 3mg/kg), dosages in excess of this result in performance determents. Additional research is required to in-vestigate this finding further, as the significance of dexterity within aviation becomes increasing important with the increasing number of commer-cial aircraft employing fly-by-wire stick (joystick) controls.
REFERENCES
Arnaud, M. J. (1993). Metabolism of caffeine and other components of coffee. In: S. Garattini (Ed) Caffeine, coffee, and health (pp. 43-95). New York: Raven Press.
Boxtel, M. P. J., Schmitt, J. A. J., Bosma, H., & Jolles, J. (2003). The effects of habitual caf-feine use on cognitive change: a longitudinal perspective. Pharmacology, Biochemical and Behavior, 75, 921-27.
Busch, C. R., Taylor, H. A., Kanarek, R. B., & Holcomb, P. J. (2002). The effects of a con-fectionery snack on attention in young boys. Physiology & Behavior, 77, 333-40.
Caldwell, J. A. (1997). Fatigue in the aviation environment: An overview of the causes and effects as well as recommended countermea-sures. Aviation Space and Environmental Medicine, 68, 932-938.
Caska, T. J., & Molesworth, B. R. C. (2007). The effects of low dose caffeine on pilot perfor-mance. International Journal of Applied Avia-tion Studies, 7, 244-55.
Cestari, V., & Castellano, C. (1996). Caffeine and cocaine interaction on memory consolidation in mice. Archives Internationales de Pharma-codynamie et de Therapie, 331, 94-104.
Daly, J. W. (1993). Mechanisms of action of caf-feine. In: S. Garattini (Ed.). Caffeine, coffee, and health (pp. 97-150). New York: Raven Press.
D’Anci, K.E., & Kanarek, R. B. (2006). Caf-feine, the methylxanthines and behavior. In J Worobey, D. J. Tepper, & R. B. Kanarek, (Eds.) Nutrition and behavior: A multidisci-plinary approach (pp. 179-94). Cambridge, MA: Cabi.
Dews, P. B., O’Broem, C.P., & Bergman, J. (2002). Caffeine: behavioural effects of withdrawal and related issues. Food and Chemical Toxi-cology, 40, 1257-1261.
Erikson, G. C., Hager, L. B., Houseworth, C., Dungan, J., Petros, T., Beckwith, B. E. (1985). The effects of caffeine on memory for word-lists. Physiology & Behavior, 35, 47-51.
Fredholm, B. B., Battig, K., Holmen, J., Nehlig, A., & Zvartau, E. E. (1999). Actions of caf-feine in the brain with special reference to factors that contribute to its widespread use. Pharmacological Reviews 51, 83-133.
Gillingham, R., Keefe, A. A., Keillor, J., & Tikui-sis. P. (2003). Effect of caffeine on target de-tection and rifle marksmanship. Ergonomics, 46, 1513-1530.
Gold, P. E. (2006). The many faces of amnesia. Learning and Memory, 13, 506-514.
Jarvis, M. J. (1993). Does caffeine intake enhance absolute levels of cognitive performance? Psy-chopharmacology, 110, 45-52.
Kamimori, G., Johnson, D., Thorne, D., & Belenky, G. (2005). Multiple caffeine doses maintain vigilance during early morning operations. Aviation Space and Environmental Medicine, 76, 1046-1050.
Kaplan, R. J., Greenwood, C. E., Winocur, G., & Wolever, T. M. S. (2000). Cognitive perfor-
Effects of Caffeine on Learning

International Journal of Applied Aviation Studies | 95
mance is associated with glucose regulation in healthy elderly persons and can be enhanced with glucose and dietary carbohydrates. American Journal of Clinical Nutrition, 72, 825-36.
Kirkcaldy, B. D. (1984). Performance and circa-dian rhythms. European Journal of Applied Physiology, 52, 375-379.
Lyvers, M., Brooks, J., & Matica, D. (2004). Ef-fects of caffeine on cognitive and autonomic measures in heavy and light caffeine consum-ers. Australian Journal of Psychology, 56, 33-41.
Mane, A., & Donchin, E. (1989). The Space For-tress game. Acta Psychologica, 71, 17-22.
McLellan, T. M., Bell, D. G., & Kamimori, G. H. (2004). Caffeine improves physical per-formance during 24h of active wakefulness. Aviation Space and Environmental Medicine, 75, 666-672.
Molesworth, B., & Young, R. (2008). Caffeine: Mitigating the effects of fatigue on the flight deck? Proceedings of the Human Factors and Ergonomics Society 52nd Annual Meeting (pp. 1-5). New York. Human Factors and Ergonom-ics Society. ISBN 978-0-945289-32-6.
Petrie, K. J., & Dawson, A. G. (1997). Symptoms of fatigue and coping strategies in interna-tional pilots. International Journal of Aviation Psychology, 7, 251-258.
Shebilske, W. L, Volz, R. A., Gildea, K. M., Work-man, J. W., Nanjanath, M., Cao, S., & Whet-zel, J. (2005). Revised Space Fortress: A Vali-dation study. Behavior Research Methods, 37, 591-601.
Si, A., Zhang, S-W., & Maleszka, R. (2005). Ef-fects of caffeine on oldfactory and visual learning in the honey bee (Apis mellifera). Pharmacology, Biochemistry and Behavior, 82, 664-672.
Smit, H. J., & Rogers, P. J. (2000). Effects of low doses of caffeine on cognitive performance, mood and thirst in low and higher caffeine
consumers. Psychopharmacology, 152, 167-173.
Smith, A., Kendrick, A., Maben, A., & Salmon, J. (1994). Effects of breakfast and caffeine on cognitive performance, mood and cardiovascu-lar functioning. Appetite, 22, 39-55.
Taneja, N. (2007). Fatigue in aviation: A survey of the awareness and attitudes of Indian Air Force pilots. International Journal of Aviation Psy-chology, 17, 275-284.
Tucha, O., Walitza, S., Mecklinger, L., Stasik, D., Sontag, T-A., & Lang, K. W. (2006). The ef-fect of caffeine on handwriting movements in skilled writers. Human Movement Science, 25, 523-35.
Urso-baiarda, F., Shurey, S., & Grobbelaar, A. O. (2007). Effect of caffeine on microsurgical technical performance. Microsurgery, 27, 84-87.
White, N. M. (1988). Cognitive enhancement: An everyday event? International Journal of Psy-chology, 33, 95-110.
Wiles, J. A., Coleman, D., Tegerdine, M., & Swaine, I. L. (2006). The effects of caffeine ingestion on performance time, speed and power dur-ing a laboratory-based 1km cycling time-trial. Journal of Sports Sciences, 24, 1165-1171.
Williams, A. M., Davids, K., & Williams, J. G. (1999). Visual perception and action in sport. London: Spon Press.
Yeomans, M. R., Ripley, T., Davies, L. H., Rusted, J. M., & Rodgers, P. J. (2002). Effects of caf-feine on performance and mood depend on the level of caffeine abstinence. Psychopharma-cology, 164, 241-249.

96 |

International Journal of Applied Aviation Studies | 97

20
11
Inte
rnatio
nal Jo
urn
al o
f Ap
plie
d A
via
tion
Stu
die
s Vo
lum
e 1
1, N
um
ber 1
International Journal of Applied Aviation StudiesVolume 11, Number 1ISSN Number: 1546-3214Copyright © 2011 FAA Academy1st Printing September, 2011