international journal of applied aviation studies · alexandra holmes clockwork research ltd.,...
TRANSCRIPT

Volume 11, Number 2 2011
International Journal of Applied Aviation StudiesA Publication of the FAA AcademyOklahoma City, Oklahoma
20
11
Inte
rnatio
nal Jo
urn
al o
f Ap
plie
d A
via
tion
Stu
die
s Vo
lum
e 1
1, N
um
ber 2
Federal Aviation Administration

blank page

REVIEW PROCESS
The Federal Aviation Administration Academy provides traceability and oversight for each step of the International Journal of Applied Aviation Studies (IJAAS). IJAAS is a peer-reviewed publication, enlist-ing the support of an international panel of consulting editors. Each consulting editor was chosen for his or her expertise in one or more areas of interest in aviation. Using the blind-review process, three or more consulting editors are selected to appraise each article, judging whether or not it meets the requirements of this publication. In addition to an overall appraisal, a Likert scale is used to measure attitudes regarding individual segments of each article. Articles that are accepted are those that were approved by a majority of judges. Articles that do not meet IJAAS requirements for publication are released back to their author or authors.
Individuals wishing to obtain a copy of the IJAAS on CD may contact Kay Chisholm by email at [email protected], or by telephone at (405) 954-3264, or by writing to the following address:
International Journal of Applied Aviation Studies
Kay ChisholmAMA-800PO Box 25082Oklahoma City, OK 73125

POLICY AND DISCLAIMERS
Policy Statement: The Federal Aviation Administration (FAA) Academy strongly supports academic freedom and a researcher’s right to publish; therefore, the Federal Aviation Administration Academy as an institution does not endorse the viewpoint or guarantee the technical correctness of any of the articles in this journal.
Disclaimer of Liability: With respect to articles available in this journal, neither the United States Gov-ernment nor the Federal Aviation Administration Academy nor any of their employees, makes any war-ranty, express or implied, including the warranties of merchantability and fitness for a particular purpose, or assumes any legal liability or responsibility for the accuracy, completeness, or usefulness of any informa-tion, apparatus, product, or process disclosed, or represents that its use would not infringe privately owned rights.
Disclaimer of Endorsement: Reference herein to any specific commercial products, process, or ser-vice by trade name, trademark, manufacturer, or otherwise, does not constitute or imply its endorsement, recommendation, or favoring by the United States Government or the Federal Aviation Administration Academy. The views and opinions of authors expressed herein do not state or reflect those of the United States Government or the Federal Aviation Administration, and shall not be used for advertising or product endorsement purposes.

PUBLISHER
Academy Superintendent Sunny Lee-FanningDeputy Superintendent William J. Mumper
PUBLICATION COMMITTEE
Manager, Regulatory Standards Division Roger HeardManager, Technical Operations Training Division Jessie McMullenManager, Air Traffic Division Brian HarmelinkManager, Airports & International Training Division Sherry Reese
EDITORIAL STAFF
Managing Editor Kay Chisholm
CONSULTING EDITORS
International
Ruwantissa I.R. Abeyratne ICAO, Montreal, CanadaAlireza Ahmadi Luleå University of Technology, Luleå, SwedenAlan A. Baker CRC-ACS, Victoria , AustraliaPierre R. Band Institut du Cancer de Montréal, Québec, CanadaJames Barker Dalhousie University, Halifax, Nova Scotia, CanadaPaul Bates Griffith University, Queensland, AustraliaSimon Bennett Institute of Lifelong Learning, Leicester, UKHenk Blom National Aerospace Laboratory NLR, Amsterdam, The NetherlandsRobert Bor Royal Free Hospital, London, UKGraham Braithwaite Cranfield University, Cranfield, UKPeter Brooker Cranfield University, Cranfield, UKBryan Burke Macquaire University, Sydney, AustraliaIng. F.J.L. Bussink National Aerospace Laboratory, Amsterdam, The NetherlandsPetr Cásek Honeywell International Advanced Technology Center, Czech RepublicMichael B. Charles Southern Cross University, Tweed Heads, NSW AustraliaKlaus Christoffersen Acuite, Hamilton, Ontario, CanadaScott Allen Cohen Bournemouth University, Dorset, UKOlja Čokorilo University of Belgrade, SerbiaDesmond M. Connolly QinetiQ, Farnborough, Hampshire, UKFinian Connolly Executive & Professional Training Inst., Drogheda, Co Louth, IrelandHugh David Eurocontrol, East Sussex, UKSidney Dekker Linköping Institute of Technology, Linköping, SwedenDavid Denyer Cranfield University, Bedford, UKTeresa C. D’Oliveira ISPA, Lisbon, PortugalRobert van Doorn Universiteit Maastricht, The NetherlandsÅsa Ek Lund University, Lund, SwedenAlois Farthofer Human Factors Research, St. Georgen, AustriaMassimo Felici University of Edinburgh, Edinburgh, UKRodney Fewings Cranfield University, Cranfield, Bedfordshire UKGerard J. Fogarty University of Southern Queensland, Toowoomba, AustraliaJarle Gimmestad Braathens Airlines, Fornebu, NorwayStefan Gössling Linnaeus University, Växjö, Sweden
Eric L. Groen TNO Defence, Soesterberg, The NetherlandsGael P. Hammer Johannes Gutenberg-University, Mainz, GermanyDon Harris Cranfield University, Cranfield, Bedfordshire, UKGeraint Harvey Swansea University, Swansa, Wales, UKIrene Henley University of Western Sidney, Sidney, AustraliaIvonne A. Herrera SINTEF Technology & Society Safety Research, Trondheim, NorwayToshio Hirose Sendai Nishikicho Clinic & Occupational Health Center, Sendai, JapanEef Hogervorst Loughborough University, Leicestershire, UKAlexandra Holmes Clockwork Research Ltd., London, UKHans-Jürgen Hörmann Deutsches Zentrum für Luftund Raumfahrt (DLR), Hamburg, GermanyGraham Hunt Massey University, Auckland, New ZealandMagnus Jacobssen Linköping Institute of Technology, Linköping, SwedenMilan Janic Delft University of Technology, Delft,The NetherlandsLynn M. Jeffrey Massey University Auckland, Auckland, New ZealandChris W. Johnson University of Glasgow, Glasgow, ScotlandK. Wolfgang Kallus Karl Franzens University, Graz, AustriaMichael John Kay RMIT University, Melbourne, Victoria, AustraliaJörg Leonhardt Deutsche Flugsicherung GmbH, Langen, GermanyDirk Lehmkuhl University of St. Gallenm, St.Gallen, SwitzerlandGeorge Leloudas Gates and Partners Solicitors, London, UKMaria Chiara Leva Trinity College Dublin, Dublin, IrelandYuh-Shiow Li Chang Gung Institute of Technology, Taiwan, ROCWen-Chin Li National Defense University, Taipei, Taiwan, R.O.C.Christopher Lowe Liv Systems Ltd, Bristol, UKZaira Marioli-Riga Hellenic Aerospace Industry S.A., Schimatari, GreeceMonica Martinussen University of Tromsø, Tromsø, NorwayElizabeth Mathews Aviation English Services, Wellington, New ZealandJeremy Mell French Embassy, Washington, DCJim Mitchell University of Western Sydney, Penrith South, AustraliaKjell Mjøs Norwegian University of Science and Technology,Oslo, NorwayBrett Molesworth University of New South Wales, Sydney, AustraliaPatrick Murray Griffith University, Queensland, AustraliaDavid G. Newman Flight Medicine Systems PTY LTD, Victoria, AustraliaJan Noyes University of Bristol, Bristol, UKPaul O’Connor National University of Ireland, Galway, IrelandDavid O’Hare University of Otago, Dunedin, New ZealandEsther Oprins Air Traffic Control Netherlands, Schiphol Airport, NetherlandsGünther Ortmann Helmut-Schmidt-Universität, Hamburg, GermanyChristine Owen University of Tasmania, Tasmania, AustraliaStanislav Pavlin University of Zagreb, Zagreb, CroatiaMichal Pěchouček Czech Technical University, Prague, Czech RepublicStefanie Petrie Luftwaffe Institute of Aviation Medicine, Fürstenfeldbruck, GermanyAndrew Potter Cardiff University, Cardiff, UKTeemu Reiman VTT Technical Research Centre of Finland, Otaniemi, FinlandAndrew N. Rider The Defence Science and Technology Organisation (DSTO), Victoria , AustraliaAlfred Roelen National Aerospace Laboratory, Amsterdam, The NetherlandsJan Joris Roessingh National Aerospace Laboratory, Amsterdam, The NetherlandsJens Rolfsen Det Norske Veritas, Høvik, Norway Paul Roosens University of Antwerp, Antwerpen, BelgiumMichael Siegrist Institute for Environmental Decisions, Zurich, SwitzerlandT. Leigh Signal Massey University, Wellington, New ZealandAdrian Smith Aeromedical Centre, Dhahran, Kingdom of Saudi ArabiaRichard H. Y. So University of Essex, Colchester, UKManuel Soler Universidad Rey Juan Carlos, Madrid, Spain

Sybert Stroeve NLR Air Transport Safety Institute, Amsterdam, The NetherlandsShinji Suzuki University of Tokyo, Tokyo, JapanHakan Tarakci Melbourne Business School, Melbourne, AustraliaSteve Thatcher University of South Australia, Mawson Lakes, AustraliaM. “Mattie” Tops Leiden University, Leiden, The NetherlandsPernilla Ulfvengren Royal Institute of Technology, Stockholm, SwedenClaudia van de Wal VALK Foundation, NetherlandsLucas van Gerwen VALK Foundation, Netherlands Leo Vermeulen University of Pretoria, Pretoria, South AfricaJoachim Vogt Technische Universität Darmstadt, Darmstadt, GermanyAnthony S. Wagstaff Institute of Aviation Medicine, Oslo, NorwayStephen Walsh Interaction Training Associates, NetherlandsMark Wiggins Macquarie University, North Ryde, NSW, Australia Damien J. Williams University of Bristol, Bristol, UKRobert Wolfger Austrian Airlines, Strasshof, AustriaRogier Woltjer Linköping Institute of Technology, Linköping, SwedenNie Xiaofeng Nanyang Technological University, SingaporeJin-Ru Yen National Taiwan Ocean University, Keelung, Taiwan, ROCBeat Zimmermann Air Navigation Institute, Thun, Switzerland
U.S.A.
Robert I. Aceves St. Cloud State University, St. Cloud, MNMaheen M. Adamson Stanford/VA Aging Clinical Research Center, Palo Alto, CAVicki Ahlstrom FAA, William J. Hughes Technical Center, Atlantic City, NJAmy Alexander Aptima, Inc., Woburn, MA Steve Anderson St. Cloud State University, St. Cloud, MNRick Anglemyer SCSI, Colorado Springs, CODeak D. Arch Ohio University, Albany, OHAnthony R. Artino, Jr. Uniformed Services University, Bethesda, MDFrancis “Frank” Ayers Embry-Riddle Aeronautical University, Prescott, AZLarry Bailey FAA Academy, Oklahoma City, OKJack Barker Mach One Leadership, Miami, FLR. Kurt Barnhart Kansas State University, Salina, KS Robert Baron The Aviation Consulting Group, Myrtle Beach, SC Paul T. Bartone National Defense University, Ft. McNair, Washington, DCEllen Bass University of Virginia, Charlottesville, VAJ. Matthew Beaubien American Institutes for Research, Washington, DCJeffrey M. Beaubien Aptima, Inc., Woburn, MA Beth M. Beaudin-Seiler Western Michigan University, Battle Creek, MIWendy Beckman Middle Tennessee State University, Murfreesboro, TNSean Belcher NASA Ames Research Center, Moffett Field, CATheodore Beneigh Embry-Riddle Aeronautical University, Daytona Beach, FLDennis B Beringer Civil Aerospace Medical Institute, Oklahoma City, OK Robert O. Besco Professional Performance Improvement, Dallas, TX Aleta Best Department of Transportation, Washington, DC Kate Bleckley Civil Aerospace Medical Institute, Oklahoma City, OKJames P. Bliss Old Dominion University, Norfolk, VAErin E. Block-Bowen Purdue University, West Lafayette, IN Deborah Boehm-Davis George Mason University, Fairfax, VAPhilip Bos University of Central Missouri, Warrensburg, MOBrent Bowen Purdue University, W. Lafayette, IN Tim Brady Embry-Riddle Aeronautical University, Daytona Beach, FLJonathan Bricker University of Washington, Seattle, WAChristopher R. Brinton Mosaic ATM, INC., Leesburg, VA

Dana Broach Civil Aerospace Medical Institute, Oklahoma City, OKPhilip Budd Graduate Studies in Counseling, Bethany, OKJudith Bürki-Cohen Volpe National Transportation Systems Center, Cambridge, MAErnesto A. Bustamante University of Idaho, Moscow, IDJames N Butcher University of Minnesota, Minneapolis, MNPaul W. Buza Wuesthoff Medical Center, Melbourne, FLEvan Byrne National Transportation Safety Board, Washington, DCJohn H. Cain Florida Technology Institute, Melbourne, FLRaymond E. Cain, Jr. Florida Memorial University, Miami Gardens, FL John A. Caldwell Archinoetics, LLC, Honolulu, HI Lynn Caldwell Air Force Research Laboratory, Wright- Patterson AFB, OHWilliam Caldwell Southern Illinois University, Carbondale, ILKim Cardosi Volpe National Transportation Systems Center, Cambridge, MAThomas Q. Carney Purdue University, West Lafayette, INStephen M. Casner NASA Ames Research Center, Moffett Field, CAThomas R. Chidester Civil Aerospace Medical Institute, Oklahoma City, OK Robert H. Chisholm Support Systems Associates, Melbourne, FLAnna T. Cianciolo Command Performance Research, Inc., Champaign, ILDaniel W. Clark Critical Concepts Consulting, Olympia, WAMaria Consiglio NASA Langley Research Center, Hampton, VADavid Conway Southeastern Oklahoma State University, Durant, OKPaul A. Craig Middle Tennessee State University, Murfreesboro, TNJerry Crutchfield Civil Aerospace Medical Institute, Oklahoma City, OKThom Curtis University of Hawaii, Hilo, HI John Deaton Florida Institute of Technology, Melbourne, FLStephen Dedmon Embry-Riddle Aeronautical University, Daytona Beach, FLAsaf Degani NASA Ames Research Center, Moffett Field, CACarmen Delgado-Morales FAA Academy, Oklahoma City, OK Charles DeJohn Civil Aerospace Medical Institute, Oklahoma City, OK Chad Depperschmidt Oklahoma State University, Stillwater, OKJames DeVoll Office of Aerospace Medicine, Washington, DC Archie Dillard FAA National Headquarters, Washington, DCBrian G. Dillman Purdue University, West Lafayette, INKey Dismukes NASA Ames Research Center, Moffett Field, CARahul M. Dodhia Raven Analytics, Mountain View, CA Theresa A. Domagalski Western Carolina University, Cullowhee, NCNancy Dorighi NASA Ames Research Center, Moffett Field, CA Wayne Dornan Middle Tennessee State University, Murfreesboro, TND. Adrian Doss The University of West Alabama, Livingston, ALBoyd Falconer Russell Reynolds Associates, Chicago, IL Richard Fanjoy Purdue University, West Lafayette, INDouglas R. Farrow Federal Aviation Administration, Washington, DCJeffrey Forrest Metropolitan State College of Denver, Denver, COPaul M. Foster FAA Western-Pacific Regional Office, Lawndale, CAWai-Tat Fu University of Illinois, Savoy, ILKenneth H. Funk II Oregon State University, Corvallis, OR Peter C. Gardiner SCSI, Torrance, CA Kenneth Gardner FAA, Flight Standards, New Cumberland, PADevra L. Golbe Hunter College/CUNY, New York, NYA. F. Grandt Purdue University, West Lafayette, INMavis Green Utah Valley University, Provo, UTRegina A.Greenwood Nova Southeastern University, Fort Lauderdale-Davie, FLCarla A. Hackworth Civil Aerospace Medical Institute, Oklahoma City, OKMichele Halleran Embry-Riddle Aeronautical University, Daytona Beach, FLChris Hallman Great Circle Consulting, Inc., Newman, GA

Steven Hampton Embry-Riddle Aeronautical University, Daytona Beach, FLP. A. “Peter” Hancock University of Central Florida, Orlando, FL Jeffrey T. Hansberger George Mason University, Fairfax, VAFrederick D. Hansen Oklahoma State University - Tulsa, Tulsa, OKHernando Jimenez Georgia Institute of Technology, Atlanta, GARon A. Hess University of California, Davis, CAKevin High Western Michigan University, Battle Creek, MIJerry Higley FAA Academy, Oklahoma City, OKPatrick L. Hill University of Illinois at Urbana-Champaign, Champaign, ILAlan Hobbs NASA Ames Research Center, Moffett Field, CAJudy Holcomb FAA Academy, Oklahoma City, OKC.M. Holloway, NASA Langley Research Center, Hampton VAKent Holtorf Holtorf Medical Group, Torrance, CAWillem Homan Western Michigan University, Battle Creek, MIAmy Hoover Central Washington University, Ellensburg, WABruce Hoover Parks College, St. Louis University, St. Louis, MOTodd P. Hubbard Oklahoma State University, Stillwater, OK David R. Hunter Artis, LLC, Reston, VAPeter Hwoschinsky FAA National Headquarters, Washington, DC Kathi Ishimaru FAA, Northwest Mountain Regional Office, Renton, WAFrancine O. James Institutes for Behavior Resources, Inc. Baltimore, MDFlorian Jentsch University of Central Florida, Orlando, FLAlan W. Johnson Air Force Institute of Technology, Wright-Patterson AFB, OHJeffrey Johnson St. Cloud State University, St. Cloud, MNRobert Kaps Southern Illinois University, Carbondale, ILMerrill R. Karp Arizona State University, Mesa, AZKim Kenville University of North Dakota, Grand Forks, NDDavid King Nortwestern State University, Natchitoches, LADeann King FAA Academy, Oklahoma City, OK Raymond E. King Civil Aerospace Medical Institute, Oklahoma City, OKMike D. Kinney U.S. Dept of Energy, Natl Nuclear Security Admin. Las Vegas, NVWilliam Knecht Civil Aerospace Medical Institute, Oklahoma City, OKDavid A. Kolb Case Western Reserve University, Cleveland, OH Jefferson M. Koonce Technology Systems, Inc. Wiscasset, ME Bruce Kuhlmann FAA Academy, Oklahoma City, OKMary N. Kutz Oklahoma State University, Stillwater, OKFlorian Jentsch University of Central Florida, Orlando, FLSteven J. Landry Purdue University, West Lafayette, INJeff Lancaster Honeywell Aerospace Advanced Technology, Golden Valley, MNVictor LaSaxon The Boeing Company, Midwest City, OKJeffrey M. Lating Loyola University, Baltimore, MDDavid Lecraw Volpe Center, Cambridge, MATera D. Letzring Idaho State University, Pocatello, IDSuresh K. Lodha University of California, Santa Cruz, CALoukia Loukopoulos NASA Ames Research Center, Moffett Field, CAChien-tsung Lu Purdue University, W. Lafayette, INGary Luckenbaugh Lockheed Martin, Rockville, MDRebecca Lutte University of Nebraska at Omaha, Omaha, NENickolas D. Macchiarella Embry-Riddle Aeronautical University, Daytona Beach, FLDave MacDonald FAA Academy, Oklahoma City, OKMadhu S. Madhukar University of Tennessee, Knoxville, TNRichard L. Mangrum Kent State University, Kent, OHCarol Manning Civil Aerospace Medical Institute, Oklahoma City, OKRoderick “Rod” D. Margo Condon & Forsyth LLP, Los Angeles, CASteven Marks Oklahoma State University, Stillwater, OK

Lynne Martin NASA Ames Research Center, Moffett Field, CARoyce Ann Martin Bowling Green State University, Bowling Green, OHLuigi Martinelli Princeton University, Princeton, NJPatrick R. Mattson St. Cloud State University, St. Cloud, MNThomas C. Mawhinney University of Detroit Mercy, Detroit, MICeleste Mayer North Carolina State University, Raleigh, NCRaymon M. McAdaragh FAA, Hampton, VAMichael E. McCauley Naval Postgraduate School, Monterey, CAKathleen L. McFadden Northern Illinois University, DeKalb, IL Ole J. Mengshoel NASA Ames Research Center, Moffett Field, CARussell Mills FAA National Headquarters, Washington DCHarry Minniear Indiana State University, Terre Haute, INMarjo Mitsutomi University of Redlands, Redlands, CARichard H. Mogford NASA Ames Research Center, Moffett Field, CA John Morey Dynamics Research Corporation, Andover, MA Kathleen Mosier San Francisco State University, San Francisco, CAVahid Motevalli The George Washington University, Ashburn, VA Martin Mumenthaler Stanford University, Redwood City, CA Edward F. Murphy, Jr Embry Riddle Aeronautical University, Vacaville, CATom Nesthus Civil Aerospace Medical Institute, Oklahoma City, OKMary Niemczyk Arizona State University, Mesa, AZMark I. Nikolic The Boeing Company, Seattle, WAMichael S. Nolan Purdue University, West Lafayette, INGary J. Northam Embry-Riddle Aeronautical University, Prescott, AZRobert P. Olislagers, Arapahoe County Public Airport Authority, Englewood, CO Jim Oppermann Ohio State University, Columbus, OHKorhan Oyman Florida Institute of Technology, Melbourne, FLRaja Parasuraman George Mason University, Fairfax, VABonny Parke NASA Ames Research Center, Moffett Field, CAAllen J. Parmet Midwest Occupational Medicine, Kansas City, MO Harold Pashler University of California, San Diego, CAManoj Patankar Parks College, St. Louis University, St. Louis, MODonald A. Petrin Purdue University, West Lafayette, IN James J. Picano Mind Quest, LLC, Suisun, CAJean Potvin Saint Louis University, St. Louis, MOJulia Pounds Civil Aerospace Medical Institute, Oklahoma City, OK Thomas Prevot NASA Ames Research Center, Moffett Field, CARoni Prinzo Civil Aerospace Medical Institute, Oklahoma City, OK Michael D. Proctor University of Central Florida, Orlando, FLEdward Pugacz FAA, William J. Hughes Technical Center, Atlantic City, NJ Yandong Qiang Johns Hopkins University, Baltimore, MD Stephen M. Quilty Bowling Green State University, Bowling Green, OHWilliam B. Rankin II University of Central Missouri, Warrensburg, MOEsa M. Rantanen Rochester Institute of Technology, Rochester, NYWilliam G. Rantz Western Michigan University, Battle Creek, MI Raj M. Ratwani George Mason University, Fairfax, VAKeith Rayner University of California, San Diego, CADawna L. Rhoades Embry Riddle Aeronautical University, Daytona Beach, FLStephen Rice New Mexico State University, Las Cruces, NMRobert Ripley Auburn University, Auburn, ALVladimir Risukhin Western Michigan University, Kalamazoo, MICharles L. Robertson University of North Dakota, Grand Forks, NDBonnie L. Rogers Wichita State University, Wichita, KSEricka Rovira U. S. Military Academy, West Point, NYNicholas G. Rupp East Carolina University, Greenville NC
Jason J. Saleem Indiana Univ.-Purdue University, Indianapolis INChristian M. Salmon The George Washington University, Ashburn VASteven M. Samuels US Air Force Academy, Colorado Springs, CONadine Sarter University of Michigan, Ann Arbor, MI Ian Savage Northwestern University, Evanston, ILStewart W. Schreckengast Purdue University, West Lafayette, INDavid Schroeder Civil Aerospace Medical Institute, Oklahoma City, OKPete Schumacher University of North Dakota, Grand Forks, NDGregory L. Schwab Indiana State University, Terre Haute, INScott Shappell Clemson University, Clemson, SCJ. Anthony Sharp Elizabeth City State University, Elizabeth City, NCJohn W. Sheremeta, Jr. American Airlines, Lake Ronkonkoma, NY Mark A. Sherman Farmingdale State College, Farmingdale, NYLance Sherry George Mason University, Fairfax, VAL. James Smart Miami University, Oxford, OHGuy M. Smith Embry-Riddle Aeronautical University, Daytona Beach, FLKenneth Sperry The Boeing Company, Midwest City, OKJohn E. Stewart II U.S. Army Research Institute, Fort Rucker, ALEarl S. Stein William J. Hughes Technical Center, Atlantic City, NJThomas A. Stoffregen, University of Minnesota, Minneapolis, MNAlan J. Stolzer Embry-Riddle Aeronautical University, Daytona Beach, FLAllan Storm US Air Force, Arlington, VA Judith B. Strother Florida Institute of Technology, Melbourne, FLCraig Gerald Stroup American West Airlines, Phoenix, AZJoy L. Taylor Stanford/VA Aging Clinical Research Center, Palo Alto, CATerry von Thaden University of Illinois, Savoy, ILJeffrey M Thompson University of Minnesota, Minneapolis, MNPamela S. Tsang Wright State University, Dayton, OHJudith Foss Van Zante NASA Glenn Research Center, Cleveland, OHStephen Véronneau CAMI, Oklahoma City, OKKen Wallston Vanderbilt University, Nashville, TNRon Ward FAA Academy, Oklahoma City, OKCarl Washburn Greenville Technical College, Greenville, SCWilliam E. Weiss MITRE Corporation, McLean, Virginia Thomas Weitzel Embry-Riddle Aeronautical University, Daytona Beach, FLVictor Welzant International Critical Incident Stress Foundation, Inc. Ellicott City, MDMichael Wetmore Central Missouri State University, Great Falls, MTChristopher Wickens University of Illinois Urbana-Champaign, Urbana, ILMichael Wiggins Embry-Riddle Aeronautical University, Daytona Beach, FLCraig Williams Fort Wayne-Allen County Airport Authority, Fort Wayne, INKevin Williams Civil Aerospace Medical Institute, Oklahoma City, OKDale Wilson Central Washington University, Ellensburg, WADonna Forsyth Wilt Florida Institute of Technology, Melbourne, FLPeter Wolfe Professional Aviation Board of Certification, Washington, DCShawn R. Wolfe NASA Ames Research Center, Moffett Field, CARichard D. Wright Volpe National Transportation Systems Center, Weston, MAXidong Xu Boeing Research & Technology (BR&T), Seattle, WA John Young Purdue University, West Lafayette, IN
PHILOSOPHY STATEMENT
1 Cornelius Lanczos, a mathematician working in the field of applied analysis, expressed the history of mathematics in three phases:
1) A given physical situation is translated into the realm of numbers,
2) By purely formal operations with these numbers certain mathematical results are obtained, [and]
3) These results are translated back into the world of physical reality (1988, p. 1).1
Formal papers, in subjects related to aviation, roughly follow the same course. However, there appears to be a weakness in aviation research, that being the omission of the third phase.
It is not good enough that conclusions are drawn, if those conclusions fail to improve the system ob-served. Clearly, the observed have a say in implementing the conclusions of research, but their failure to implement the conclusions drawn by the researcher may be more indicative of a lack of understanding than a lack of desire. Researchers tend to peer into complex systems as through a soda straw, forming formal opinions on the finite without understanding the complete system. Industry, ever mindful of the complete system, may find research irrelevant, because it makes much to do about nothing.
The editorial staff, to include those listed as consulting editors, is committed to the improvement of all individuals within the aviation community. We seek to enhance existing systems bearing in mind that small improvements must not upset the delicate balance between too little and too much help. We also seek to promote safety, not by lip service, but by demonstration in how we execute our studies and how we report our findings.
We feel that the best way to translate results back to the physical world is to incorporate the viewpoints of people around the globe. Without the influence of a worldwide community, we deny the significance of diversity, and ignore the perspectives of gifted scientists from different countries. It is our hope that each reader will feel the same.
1 Lanczos, C. (1988). Applied Analysis. Mineola, NY: Dover Publications, Inc.

EDITOR’S NOTES
To support the FAA's efforts to reduce costs, the IJAAS will only be available from our web site at http://www.faa.gov/about/office_org/headquar-ters_offices/arc/programs/academy/journal/.
Papers
In our lead article, The Line Operations Safety Audit Program: Transitioning from Flight Opera-tions to Maintenance and Ramp Operations, Ma, Pedigo, Gildea, Hackworth, and Holcomb review the application of the Line Operations Safety Audit (LOSA) program to maintenance and ramp opera-tions. Tools were developed for airlines and main-tenance organization to use to initiate M-LOSA and R-LOSA programs.
The purpose of the study presented in A Mixed Method Approach to Runway Incursion Rating was to illuminate the underlying factors contribut-ing to runway incursions using a mixed methods analysis of quantitative Runway Safety Office data and qualitative Aviation Safety Reporting System
data. Joslin, Goodheart, and Tuccio found a num-ber of emergent themes among ASRS reports that contribute to a more complete understanding of runway incursions.
In A Case for Federal Aviation Regulations to Develop Civil Supersonic Transport Aircraft, Jos-lin's study proposes that codification of Federal Aviation Regulations allowing overland superson-ic flight would incentivize industry stakeholder de-velopment and fielding of civil supersonic transport aircraft. Regulations allowing overland civil super-sonic flight will establish a viable market potential, clarify aircraft design requirements, and unlock the manufacturing and operational implementation of supersonic civil transport aircraft.
A boomerang effect was observed, whereby ex-posure to information about aviation’s contribution to global climate change led to a significant increase in perceived desire to fly. In The Effect of Informa-tion about the Environmental Impact of Flying and People's Desire to Fly, Gilbey, Perezgonzalez, and Tani used a between-subjects experimental design to test whether participants exposed to information about the environmental impact would alter their choices in transportation.
KC


International Journal of Applied Aviation Studies | xv
Volume 11, Number 1 2011
Papers
REVIEW PROCESS iiiPOLICY AND DISCLAIMERS ivPUBLICATION AND EDITORIAL STAFF vPHILOSOPHY STATEMENT xiiEDITOR’S NOTES xiii
The Line Operations Safety Audit Program: Transitioning from Flight Operations to Maintenance and Ramp Operations
Jiao Ma, Mark Pedigo, Kevin Gildea, Carla Hackworth, and Kali Holcomb 1
A Mixed Method Approach to Runway Incursion RatingRobert Edward Joslin, Benjamin Jeffry Goodheart, and William Anthony Tuccio 13
Personality and Motivational Needs in Indian Military Pilots
Catherine Joseph and Rohit Ramesh Kochhar 37
A Case for Federal Aviation Regulations to Develop Civil Supersonic Transport Aircraft
Robert Edward Joslin 49
The Effect of Information about the Environmental Impact of Flying and People’s Desire to Fly
Andrew Gilbey, Jose D. Perezgonzalez, and Kawtar Tani 59
International Journal of Applied Aviation Studies
A Publication
of the FAA
Academy
Oklahoma City,
Oklahoma
Delivering
Tomorrow's
Training Today

xvi |

International Journal of Applied Aviation Studies | 1
The Line Operations Safety Audit Program:
Transitioning from Flight Operations to Maintenance
and Ramp Operations?
Abstract
Managing risk has become increasingly impor-tant in modern organizations, including medicine, aviation, and finance. Accident investigation con-centrates on failures, which are important for dis-covering major breakdowns, but failures are rare events. Proactive approaches offer the flexibility of observing normal operations A Line Operations Safety Audit (LOSA) is a voluntary safety pro-gram that collects safety data during normal airline operations and was originally designed for flight deck operations. The goal of this FAA-sponsored project is to capitalize on the 10-plus years of suc-cessful audits on the flight deck. The hazards that threaten the safety of flight deck operations are not unique to that environment. Similar problems are present during maintenance and ramp opera-tions. This report provides a review of the use of LOSA, discusses LOSA’s essential operating characteristics, lessons learned on the flight deck, and describes the extension of LOSA to mainte-nance and ramp operations. The research team de-veloped tools for airlines and maintenance orga-nizations to use as they initiate their maintenance (M-LOSA) and ramp (R-LOSA) programs.
The Line Operations Safety Audit Program: Transitioning from
Flight Operations to Maintenance and Ramp Operations
Managing risks has become increasingly impor-tant in modern organizations, including medicine, aviation, and finance. The initial identification and interpretation of hazards are some of the most chal-lenging aspects of risk management, since many hazards remain hidden, unnoticed, or misunder-stood for long periods of time before an accident (Macrae, 2009; Turner, 1994). The risks associated with these hazards seem obvious after an accident; however, the early signs pointing to an emerging hazard and its consequent risk are often extreme-ly weak and ambiguous (Reason, 1997; Vaughan, 1996).
Systems such as the National Aeronautics and Space Administration (NASA)’s Aviation Safety Reporting System (ASRS) and the Maintenance Aviation Safety Action Program (M-ASAP) en-courage air carrier and repair station employees to voluntarily report certain safety information. These programs provide an important, previously unavailable, source of data that is captured rapidly and directly from those responsible for the day-to-day safe operation of the aviation system. Howev-er, systems like these are used proactively and are based on previous adverse events.
Jiao Ma1,* Mark Pedigo2,
& Kali Holcomb3 1Maintenance Engineering, 2 Dept. of Aviation ScienceThe Boeing Company Saint Louis UniversityFormerly Saint Louis University
*[email protected]: 206-662-4014
Kevin Gildea3, Carla Hackworta3,
3Federal Aviation Administration Civil Aerospace Medical Institute
Note: A condensed version of this paper is previously pub-lished as a DOT/FAA report (DOT/FAA/AM-11/15, Septem-ber 2011).
Return to Table of Contents

2 |
A Line Operations Safety Audit (LOSA) is a tool for collecting safety data during normal air-line operations. As a voluntary safety program, a LOSA does not require Federal Aviation Adminis-tration (FAA) approval, acceptance, or monitoring, as stated in the FAA LOSA Advisory Circular 120-90 (2006). The agreement allows the air carrier or air agency to maintain control of the audit results.1
Monitoring routine operations, the cornerstone of the LOSA process, addresses an important as-pect of safety auditing, namely, that risks and hu-man error can never be completely eliminated. Recognizing correct and incorrect actions to man-age these risks and errors before they manifest into larger incidents/accidents makes LOSA a truly pro-active, rather than a reactive strategy, as well as a workable predictive way of risk mitigation (ICAO, 2009; Maurino, 2001). Several companies have in-stituted LOSA programs and have garnered many valuable lessons, safety improvements, and signifi-cant returns on their investment.
LOSA has evolved into a strategy comprised of systematic line observations of routine opera-tions to provide safety data, both in the technical and human performance areas. During a LOSA observation, observers record and code potential threats to safety, how the threats were addressed, the errors generated, how the errors were man-aged, and how the observed behaviors could be associated with incidents and accidents. The data from LOSA observations provide indicators of organizational strengths and weaknesses, which facilitate the development of countermeasures to operational threats and errors (ICAO, 2002). Prior to the implementation of LOSA, safety analysis of the effect of human performance in aviation had been retrospective, thus overlooking processes im-mediately preceding the human error that resulted in incidents/accidents (Maurino, 2001). Investiga-tors targeted those actions and inactions that did not produce desired outcomes, often without fully
1 The FAA ATA Human Factors Taskforce has dis-cussed referring to LOSA within maintenance and ramp operations as an assessment rather than audit to reflect the nonpunitive intent of the program.
considering the mismanagement of processes lead-ing to these safety breakdowns.
Accident investigation concentrates on failures, which are important for discovering major break-downs in the system, but failures are rare events. Self-reporting of incidents and potential hazards preceding major accidents can be limited because personal biases about behavioral norms may result in overlooking significant actions, and there are al-ways concerns about professional consequences.
In addition to flight deck operations, there is a need to study aviation maintenance and ramp op-erations from a neutral perspective during normal operations. Maintenance organizations and ground operators have the opportunity to benefit from the 10-year success of normal operations audits on the flight deck. LOSA provides a minimally invasive safety audit of maintenance and ramp operations to evaluate an organization (including its systems, processes, and personnel), ascertain the validity and reliability of its information, and consequently assess its internal controls. Maintenance safety au-dits are intended to complement other safety-data sources such as ASRS and M-ASAP by tapping different feedback mechanisms and by identifying hazards before they become events or accidents.
The purpose of this report is to document the development of LOSA in flight operations, its suc-cesses and lessons learned, and describe the exten-sion of the flight deck version of LOSA to aviation maintenance and ramp operations.
Background
LOSA development was initially started in 1991 at the University of Texas at Austin (UT-Austin) with funding from the FAA. The development of LOSA stemmed from a request by Delta Air Lines to validate the operational impact of its three-day Crew Resource Management (CRM) training course. Analysts soon realized that existing data collection methods did not assemble adequate in-formation regarding flight crew adherence to stan-dard operating procedures (SOPs) and environ-mental influences on flight crew performance. To explore the effectiveness of CRM training transfer,
LOSA Program: Transition from Flight to Maintenance & Ramp Operations

International Journal of Applied Aviation Studies | 3
a partnership was established between the UT-Aus-tin Human Factors Research Project and Delta Air Lines in 1994. The goal was to develop a line au-dit methodology utilizing jump-seat observations on regularly scheduled flights (i.e., LOSA). In its early form, LOSA mostly focused on CRM per-formance (Klinect, Murray, Merritt, & Helmreich, 2003). The audits provided actionable data about strengths and weaknesses allowing prioritization and improvement of CRM training. They also sup-ported the validity of findings from the CRM train-ing data. Other major airlines then conducted their own CRM audits in collaboration with UT-Austin.
The next major development of LOSA evolved from the advancement of systems thinking and hu-man error research in the field of aviation human factors. In 1997, the UT-Austin team collaborated with Continental Airlines to expand the method to focus on the management of common threats and errors. This ultimately evolved into the Threat and Error Management (TEM) model and the cre-ation of the current LOSA’s underlying theoretical framework. Continental Airlines was the first to use a TEM-based LOSA to target areas for improve-ment (e.g., pilots’ error management training). In 1997 and 1998, the UT-Austin research team con-ducted LOSAs at three airlines (Klinect, Wilhelm, & Helmreich, 1999). The observers documented threats (external events such as adverse weather or errors originated by non-cockpit personnel), re-corded flight crew errors, and rated the crew using CRM behavioral markers in accordance with TEM performance. Along with the documented threats and errors, observers also recorded how each event was managed by the flight crew. Initial data showed that threats and errors are common. Their types and occurrences varied across airlines. Nota-bly, LOSA data illuminated the behaviors that led to effective and ineffective threat and error man-agement. The nuances included in this proactive data collection strategy populate a richer and more extensive library of threats and errors than reac-tive accident/incident reporting. LOSA examines responses to errors that have not yet resulted in an accident or incident. Capturing effective responses allows LOSA data to provide insight into normal flight operations and aid training. Follow-up stud-
ies showed a sizable improvement at Continental Airlines in safety and overall crew performance (Klinect, et al., 2003).
LOSA data collection is conducted using the LOSA observation form under strict non-jeopardy conditions, meaning that crews are not at risk of receiving reprimands due to observed actions. Es-tablishing that there is a non-punitive policy toward errors during data collection improves the validity of the data by encouraging those being observed to carry on their natural work behaviors.
LOSA was first operationally deployed as an International Civil Aviation Organization (ICAO)-endorsed safety program following the First LOSA Week2, which was hosted by Cathay Pacific Air-ways in March 2001. After several years of de-velopment and refinement, LOSA has evolved into a strategy to provide safety data comprised of normal operations in technical and human per-formance areas. The LOSA observations provide data to develop countermeasures to operational threats and errors (ICAO, 2002). It has since been used and validated by many international airlines and is now recognized as a key element in an air-line’s Safety Management System (SMS). It also provides a data-driven mechanism for measuring change (Veilette, 2008). Based on the success at many carriers that use LOSA, ICAO made LOSA a central focus of its Flight Safety and Human Fac-tors Program and endorsed it as an industry best-practice for normal operations monitoring. The FAA also approves LOSA as one of its voluntary safety programs (Merritt & Klinect, 2006).
UT-Austin provided “how-to” guides as an open source through numerous conference pre-sentations and papers to the airline industry about flight deck LOSA, as well as details about why and how to set up a LOSA. UT-Austin helped de-
2 The First LOSA Week, a pioneering event organized by the International Civil Aviation Organization indi-cates the completion of a transformation from research concepts to operational tools. Since then, LOSA evolved and extended into the Normal Operations Safety Survey (NOSS), designed for air traffic control operations, and has become a successful and acknowledged contribu-tion to the management of safety (ICAO, 2008).

4 | LOSA Program: Transition from Flight to Maintenance & Ramp Operations
Table 1
LOSA Characteristics with flight deck examples
Characteristic Examples in Flight Deck LOSA
1. Peer-to-peer observations during normal operations
• Routine flights only - no line checks or training flights• No debriefings or post-flight interviews asking crews to comment on their errors and/or undesired aircraft states
2. Anonymous, confidential, and non-punitive data collection
• No crew names, flight numbers, or other identifying information• Observer identity kept anonymous• Data used for safety purposes only, not disciplinary action
3. Voluntary participation • Flight crews have the right to decline a LOSA observation
4. Trusted and trained observers • Observer selection – management/union list of candidates• Diverse observer team – pilots, check airmen, instructors, safety experts, members of human factors groups, external observers• Training length (5 days): ground school (2), test observations (2), & recalibration (1)• Majority should be regular pilots from within the airline
5. Joint management/union sponsorship • Steering committee – flight operations, training, safety, and union• Symbolized with a signed agreement and sent to all pilots
6. Systematic observation instrument based on TEM
• Safety-targeted data collection form• Observers record TEM events that they see and/or hear and write narratives for contextual support
7. Secure data collection repository • Third party or pilot association gate keeper• Pilots must believe that observations will not be “misplaced” or improperly disseminated
8. Data verification roundtables • Three to five representatives from various parts of the airline scan the raw data for inaccuracies• TEM data checked for coding accuracy and consistency with SOP• On completion, data analysis begins
9. Data-derived targets for enhancement • Serve as benchmarks for organizational change• LOSA adopts a “measure, change, measure again” approach
10. Feedback of results to the workforce • LOSA findings and information on how airline management intends to respond to the findings with organizational change
International Journal of Applied Aviation Studies | 5
velop two primary guidelines: 1) Line Operations Safety Audit (ICAO, 2002)3, and 2) Advisory Cir-cular 120-90 Line Operations Safety Audits (FAA, 2006).
Consequently, The LOSA Collaborative (a pri-vate organization) was formed in the interest of protecting the collected LOSA data.
LOSA Operating Characteristics
The ICAO LOSA (2002) manual described 10 must-have LOSA operating characteristics (Table 1). These characteristics ensure the integrity of the LOSA methodology and its data. (ICAO, 2002).
Benefits of LOSA
LOSA does not rely on outcomes, such as an incident or accident, to generate data. It provides a unique opportunity to sample all activities in nor-mal operations, both successful and unsuccessful, by noting the problems crews encounter and how they manage them (FAA, 2006).
Proactive approaches are aligned with the prin-ciples of risk management and SMS. Instead of fo-cusing on problems, LOSA offers the flexibility of observing normal operations (where threats will al-ways exist) and targeting problematic areas. LOSA is a project-based process, which includes advance planning, observer selection and training, data col-lection, analyses, and a final report. Repeating a LOSA can help maintain a broad focus of an earlier LOSA and track any targeted enhancements. ICAO recommends “to sustain safety in a constantly changing environment, data must be collected and analyzed on a routine basis to identify the targets for enhancement and then a formal Safety Change Process (SCP) to bring out improvement” (ICAO, 2002). Prior to programs like LOSA, SCPs were
3 The ICAO LOSA manual is outdated. For example, the hierarchical “sticks and boxes” diagram in the manual implies that every error has a threat, which was found to not be true through actual LOSA observations. Most er-rors are “spontaneous errors” without any previous threat (J. Klinect, personal communication, April 1, 2009).
based on findings from incident/accident investiga-tions, experience, and intuition. Today, SCPs must deal with the precursors of incidents/accidents and be based on the accumulated data repository and interactive detailed analysis methods generated by programs like LOSA.
Flight deck LOSA has resulted in numerous im-provements including the modification of dispatch paperwork, reallocation of resources, and revision of procedures based on the problems uncovered through standardized observations and scientific data analyses. LOSA data have greater accuracy than anecdotal observations and can help answer questions about problem frequency, surrounding conditions, and events leading up to an issue. The data also provide better detail than voluntary re-ports, and identify problematic procedures and pol-icies by highlighting poor adherence rates (Veilette, 2008). At Continental Airlines, an airline-wide LOSA in 1996 uncovered that pilots were having trouble flying uniform approaches to company-defined standards. As it turned out, the problem was not that the pilots were managing approach-es ineffectively but that the company's standards were ambiguous. LOSA results made it possible to convince management to modify SOPs for ap-proaches, and the results, verified through a LOSA in 2000, showed a 59% reduction in nonconform-ing approaches (Croft, 2001). In addition, a 55% decline in unstabilized approaches was achieved by the company as a result of training developed from the LOSA findings (Tullo, 2002).
Problems with LOSA Implementation
Lack of adherence to the 10 LOSA character-istics, which sometimes occurs in internal LOSA programs, can reduce the effectiveness of the LOSA audit (ICAO, 2002). First, LOSA results are not al-ways shared with the pilots. This may be the re-sult of management considering a particular LOSA observation result “not great news” and deciding not to take action. A potential countermeasure to this problem is to instill the concept that provid-ing feedback will advance future LOSA efforts in the sense of (a) illustrating that pilots’ opinions and

6 |
inputs are taken seriously by the company and (b) motivating observers and those being observed to participate more collaboratively in future studies. Second, airlines’ internal LOSA programs some-times specify the identities of the observers and those being observed. This is a problem because potential disclosure of identity may prevent ob-servers from providing honest feedback. Informa-tion such as name, employee identification number, flight number, and date should not be recorded on a LOSA audit form. Departure/arrival cities, air-craft type, and pilot role are the only demographic information that should be recorded. Everything possible should be done to encourage anonymity. Pilots’ trust in the LOSA program is paramount, and any violation of anonymity, whether a penalty follows or not, violates that trust. Third, some in-ternal LOSA programs logged threats and errors but did not describe how they were managed. A threat or error may not occur frequently but may still be poorly managed and have unwanted out-comes. This highlights the importance of LOSA not being just a threats-and-errors counting exer-cise; the management of these threats and errors is critical.
McDonald and Fuller (1994) found that some organizations focus only on auditing documenta-tion, physical resources, and infrastructure, while neglecting observations of operational activities. Audits conducted by external agencies and inter-nal safety departments may prompt altered and rehearsed work behaviors, which potentially lead to inaccurate data. LOSA is different but comple-mentary to other proactive safety programs such as Flight Operational Quality Assurance (FOQA) and ASAP by providing a “neutral, third-party perspective” (FAA, 2006). Each offers unique in-sight; and used together they can aid understand-ing and mitigate operational risk.
Extension to Aviation Maintenance and Ramp Operations
There remains substantial opportunity for safe-ty improvement on the ramp and in the hangar. The Flight Safety Foundation (Lacagnina, 2007)
LOSA Program: Transition from Flight to Maintenance & Ramp Operations
estimated that the airline industry worldwide was losing $5 billion a year in direct and indirect costs associated with aircraft damage on the ramp. It was further estimated that 243,000 people were injured on the ramp every year. Thus, we believe that addi-tional methods of reducing damage and injuries are imperative. The LOSA process holds promise as a means of reducing the incidents and accidents in ramp and maintenance operations because LOSA enables ramp and maintenance workers to identify and develop methods to address threats and errors before they lead to an incident or accident.
Several companies have instituted LOSA themed programs aimed at reducing maintenance errors and ground operation damage. These LOSA programs predate the current LOSA effort and pro-vided many valuable lessons. The development of numerous subject matter experts (SMEs) were one of the beneficial outcomes of these efforts: they provided guidance during the development of the current LOSA program.
These companies have also experienced marked success as a result of their efforts. Continental Air-lines, Delta Airlines, and Qantas Airlines reported benefits from their LOSA programs and are listed below.
Continental Airlines4
Ramp-LOSA (R-LOSA). In 2008, among 447 problems identified by the flight operations LOSA at COAir, 147 (29%) were ground safety issues. An examination of flight operations LOSA archival data revealed that the industry average is only 16%
4 The information in this section is based on a site visit to George Bush Intercontinental Airport on March 18, 2008 and personal communications with Doc Garrett (Senior Manager, Maintenance Human Factors, Logis-tics & GSE Systems, Tech Ops); Rodney Luetzen (Man-aging Director, Reliability); Gerry McGill (Regional Manager, Safety & Regulatory Compliance, Flight Ops); and Guy Schroeder (Director Ground Safety, Safety & Regulatory Compliance) between March 2008
International Journal of Applied Aviation Studies | 7
for flight operations ground safety issues.
To improve ground safety performance, COAir established several safety programs under the um-brella of its SMS; for example, the Safety Recog-nition Program and R-LOSA. Station #1 had the same ground safety programs as Station #2 but, Sta-tion #1 added the R-LOSA program in 2007. Both stations improved their group safety performance dramatically over a three-year span (2006-2009). Data for 2009 are only available from January through October. Monthly averages for the first 10 months were used to estimate November and De-cember 2009 ground damage mishaps, and conse-quently, the averages for the entire year. However, the improvement observed by Station #1 is more than Station #2, which can potentially be attributed to the effectiveness of R-LOSA program (Note that Station #1’s initial safety performance was better than Station #2). Ground safety performance was assessed using three measures: (1) ground damage mishaps (total number of occurrences), (2) ground damage mishaps (mishap rate per 10,000 depar-tures), and (3) cost of ground damage mishaps.
Ground operation mishaps can further be catego-rized as attributable mishaps and non-attributable mishaps. Attributable mishaps are a result of hu-man error and are charged back to the responsible department or vendor. Non-Attributable Mishaps include Foreign Object Damage (FOD). The costs are not recovered for these mishaps. Both stations showed a dramatic decrease in the total number of ground damage mishaps from 2006 to 2009. The number of attributable and non-attributable mis-haps for Station #1 dropped 73% and 85%, respec-tively, whereas the drops for Station #2 were 58% and 67%, respectively. The cost of ground damage also decreased overall between the years of 2006 and 2009 in both stations. However, the cost of at-tributable mishaps for Station #1 increased very slightly in 2008.
For Station #1, the ground damage mishap rate also decreased significantly from 2006 to 2009: per 10,000 departures, attributable mishaps dropped 61% and non-attributable mishaps dropped to zero. For Station #2, both attributable and non-attrib-utable mishap rates decreased from 2006 to 2009
(43% and 45%, respectively). The cost of ground damage also decreased overall between the years of 2006 and 2009 in both stations. The most sig-nificant improvements were observed in the fol-lowing four areas: ground handling operations, struck by vehicle in motion, taxi-tow-push, and maintenance operations.
Maintenance LOSA (M-LOSA). M-LOSA findings help make deactivation procedures more workable, efficient, and safer. As an example, B767 leading edge device deactivation and reactivation procedures used to take three hours to properly lockout and tagout5 without individual sign-offs. An M-LOSA auditor identified this inefficiency, which was then addressed by Tech Publications by rewriting their deactivation/reactivation proce-dures. Previously, the lockout and tagout process involved unnecessary deactivation of some sys-tems following a 37-page procedure. Some steps required personnel to repeatedly reference differ-ent sections of the manual and there were no indi-vidual sign-offs when following the manual (e.g., deactivate the slats per AMM 27). The new work-card is 2-pages long with clearly defined steps. Now, with individual sign-offs, this modified process takes between 30 and 45 minutes to com-plete. The new standardized procedures also help to avoid problems caused by shift changes (deac-tivation and reactivation are often carried out on different shifts) and interruptions. This deactiva-tion/reactivation procedure has been implemented in the entire Continental Airlines fleet. Because of the changes implemented by M-LOSA, the threats have been reduced tremendously and no damage to the aircraft has occurred at the time of this pub-lication.
5 "Lock out and tag out" refers to specific prac-tices and procedures to safeguard employees from the unexpected energization or startup of machin-ery and equipment, or the release of hazardous energy during service or maintenance activities.

8 |
data on strengths and weaknesses of the operation, interface problems, effectiveness of training, qual-ity and usability of procedures, and a rationale for resource allocation. It has also provided quantita-tive and qualitative data on the processes under-taken by staff that result in work shortcuts, injury, or risk to other staff. The implementation of GOSA has resulted in positive tangible outcomes for Qan-tas. Many simple day-to-day procedures have been adapted to reflect the results of the audits. This has had the beneficial effects of streamlining ramp practices and contributing to staff engagement.
GOSA has allowed Qantas to gather data on the work practices of external ramp service provid-ers, and subsequently work with those providers to eradicate ineffective procedures. Qantas was then able to further satisfy its customers by ensuring compliant, efficient, and cohesive ramp service.
Air Transport Association (ATA) Human Factors Task Force
In December 2008, a group FAA and Saint Lou-is University researchers researchers began collab-orating with the Air Transport Association (ATA) Maintenance and Ramp Human Factors Task Force (ATA HF Task Force). The Task Force developed M-LOSA and R-LOSA forms, training documenta-tion, and the base structure for data warehousing and reporting. Development progressed through numerous consultations, combined with iterative development, testing, and refinement. The devel-opment of the maintenance and ramp LOSA forms, procedures, and software involved a core team of approximately 30 experts from the maintenance, ramp, and human factors communities. The team produced more than 20-line, base maintenance, and ramp operations forms designed for use in various LOSA audits (see sample, Appendix).
Form Development
The ATA HF Task Force found that forms comprising a combination of checklists and comments would be more effective for this domain, rather than the narrative method used with the flight deck LOSA.
LOSA Program: Transition from Flight to Maintenance & Ramp Operations
Delta Air Lines6
Due to ground operations safety concerns, the Delta leadership team made several requests to the Atlanta Airport Authority asking that they repaint the clearance lines in the international concourse. However, the requests were ignored until Delta pre-sented the results of a Ramp Operations Safety Au-dit (ROSA) at an airport operator meeting. ROSA is considered an effective communication tool and a critical component of Delta’s SMS. ROSA data are reactive in addressing existing problems and proactive in helping the leadership team form goals and objectives with a reasonable timeline.
The ROSA data illustrated serious problems caused by the missing clearance lines. The Atlanta Airport Authority was convinced of the urgency in repainting the clearance lines by the ROSA data. Following repainting, ground equipment opera-tors have consistently obeyed the rule of parking outside the clearance lines when airplanes are not at the gate. This practice has been consistent-ly implemented across six different concourses. Consequently, parking violation-induced ground equipment damage and occurrence of FOD on the ramp have decreased. The ready availability of the equipment has also improved significantly.
Qantas Airways7
In January 2008, Qantas Airways successfully conducted its first Ground Operational Safety Au-dit (GOSA), an adaptation of the airlines’ long-es-tablished LOSA methodology to the ramp environ-ment. GOSA was used to observe the behavior of ramp teams during aircraft turnarounds and provid-ed quantitative data on the threats, errors, and unde-sirable operational states that threatened the opera-tional safety of ground operations. GOSA provided Qantas ramp management a means of gathering
6 The information in this section is based on person-al communication with Mr. Alex Vargas, Manager of Aviation Safety, Delta Airlines ROSA (A. Vargas, personal communication, February 19, 2009).7 The information in this section is based on personal communication with Shaun Trimby, Coordinator Hu-man Factors and Safety Programs, Qantas Airways (S. Trimby, personal communication, March 5, 2009).

International Journal of Applied Aviation Studies | 9
The forms and checklists were constructed to re-flect the procedures followed by maintenance and ramp workers. Maintenance forms are based on procedures such as Troubleshooting and Prepare to Install with ramp forms based on procedures such as Downloading and Uploading. The line items on the forms follow the general flow of activities found during each procedure. This makes it easier for a LOSA observer to locate where a particular item should be recorded. If the observer encounters activities, threats, and errors that are not encom-passed by the forms, he or she is instructed to ad-dress these items in detail in the general comments for that form.
The most common categories of threats and er-rors (e.g., fatigue, incorrect maintenance manual) are assigned codes. The codes provide the ability to query and analyze the data more quickly and in ways not possible (e.g., inferential statistics) with a largely narrative approach. The comments provide additional detail that can be accessed as needed but come with the drawback of requiring more time to read, comprehend, and interpret the information.
Beta Testing
After initial development of the forms, beta testing allowed input from more than 100 main-tenance technicians and ramp personnel. We con-ducted beta tests for ramp, line maintenance, and base maintenance at numerous locations across the United States. The task force selected Part 135 and Part 121 carriers representing both passenger and cargo operations for beta testing. For each beta test, a team of 10-15 experts were deployed. LOSA trainers preceded the team to prepare the mainte-nance and ramp workers for being observed and to train a carefully chosen team to conduct the initial observations. The instructors provided information on the basics of LOSA, including the confidential, non-jeopardy characteristics of the observations, as well as detailed training on how to conduct a LOSA including the recording and coding of data.
The task force beta testing team remained on site and answered questions and recorded feedback throughout the initial weeks of testing. Following
each shift, we debriefed and addressed questions and captured lessons learned on LOSA procedures and checklist content. The task force discussed the lessons learned at ensuing meetings and made changes as necessary.
Database Development
Databases were created to streamline audit in-formation. Currently, users enter data collected from audits into an Access® database for future analyses and reporting. Efforts are underway to develop a more robust and powerful software tool based on Structured Query Language. The tool under development will allow LOSA teams to en-ter the data from a virtually unlimited number of LOSA observations. The new system will also al-low connections from a greater number of observ-ers, stations, and organizations. These factors are critical as the numbers of observations are antici-pated to rapidly extend into the thousands.
Training
Training was developed to ensure effective im-plementation of the LOSA program that described the purpose of LOSA, theoretical foundation (TEM model), how to conduct a LOSA via the checklist forms, and data management. Computer-based training via scenario-based, guided presentation allows companies the flexibility to introduce the basics of LOSA while considering practical ex-amples. The training materials provide the neces-sary background to prepare LOSA observers who have no background in TEM or LOSA. The initial training module provides an introduction to threat and error management, how it relates to the main-tenance or ramp environment, and the initial foun-dation for LOSA. The second module in the train-ing provides detailed information on LOSA, how and why it was developed, previous successes, and what it means for ramp and maintenance workers. The third and final module provides the observers with scenario-based practice. The scenarios allow the observer to experience a distilled version of several real-world observations, practice record-
10 | LOSA Program: Transition from Flight to Maintenance & Ramp Operations
ing the data, and the chance to review what LOSA experts have recorded for each scenario.
The task force’s goal was to develop a practi-cal, customizable, and scalable methodology and deliver it to the industry as a part of a freely avail-able toolset. The culmination of that goal was re-alized when the ATA HF Task Force released the M-LOSA and R-LOSA forms, procedures, soft-ware, and training materials for the public on the Internet (https://hfskyway.faa.gov/HFSkyway/LO-SAHome.aspx).
Conclusions
This report provides a review of the develop-ment and implementation of flight deck LOSA, as well as description of attempts to transit LOSA to aviation maintenance and ramp operations. The R-LOSA and M-LOSA methodologies aim to use pre-identified visible precursors to ramp or main-tenance events, thus ensuring an efficient, reliable, and valid audit of normal activity.
Precursors may lay hidden for years waiting for the chance to team up with other factors to cause an incident. The R-LOSA and M-LOSA audits are expected to encourage behavior change in ramp and maintenance operations and allow sub-units of an organization to build in some flexibility to address their key problems and conquer them one at a time. The periodic audits can help ensure that specific problems identified have been resolved, as well as assess the effectiveness of safety recom-mendations.
The development of R-LOSA and M-LOSA will build upon existing knowledge regarding safety across high-consequence industries. In particular, the impact of observation of normal behaviors in the aircraft maintenance and ramp operations will help qualify and quantify the efforts made by air-craft mechanics and ramp agents to prevent or re-duce incidents and accidents.
References
Croft, J. (2001). Research perfect new ways to monitor pilot performance. Aviation Week & Space Technology, 155, 76.
FAA (2006). Advisory Circular: Line Operations Safety Audits (AC No: 120-90): Federal Avia-tion Administration, Washington, DC.
ICAO (2002). Line Operations Safety Audit, Doc 9803 AN/761: International Civil Aviation Or-ganization.
ICAO (2008). Normal Operations Safety Survey (NOSS): International Civil Aviation Organi-zation.
ICAO (2009). Safety Management Manual (SMM). Doc 9859 AN/474 (2nd ed.): International Civ-ial Aviation Organization.
Klinect, J., Murray, P., Merritt, A., & Helmreich, R. (2003). Line Operations Safety Audit (LOSA): Definition and operating characteristics. Paper presented at the 12th International Symposium on Aviation Psychology, Dayton, Ohio.
Klinect, J., Wilhelm, J., & Helmreich, R. (1999). Threat and error management -- Data from Line Operations Safety Audits. Paper pre-sented at the 10th International Symposium on Aviation Psychology, Columbus, Ohio.
Lacagnina, M. (2007). Defusing the ramp. Aero-safety World, 2, 22-24.
Macrae, C. (2009). Making risk visible: Identifying and interpreting threats to airline flight safety. Journal of Occupational and Organizational Psychology, 82, 273-293.
Maurino, D.E. (2001, November). Line Operations Safety Audit. Paper presented at the Joint Meeting of FSF, IFA, IATA, Athens, Greece.
McDonald, N., & Fuller, R. (Eds.) (1994). The Management of safety on the airport ramp: Avebury Technical.
Merritt, A., & Klinect, J. (2006). Defensive fly-ing for pilots: An introduction to threat and error management. Retrieved from http://homepage.psy.utexas.edu/homepage/group/HelmreichLAB/Publications/pubfiles/TEM.Paper.12.6.06.pdf
Reason, J. (1997). Managing the risks of organi-zational accidents. Burlington, VT: Aldershot: Ashgate.
Tullo, F. (2002). The next century of flight. Avia-tion Week & Space Technology, 156, 70.
Turner, B. (1994). Causes of disasters: Sloppy management. British Journal of Management, 5, 215-219.
International Journal of Applied Aviation Studies | 11
Vaughan, D. (1996). The challenger launch deci-sion: Risky technology, culture and deviance at NASA. Chicago: University Press.
Veilette, P.R. (2008). Line Operations Safety Au-dits. Business & Commercial Aviation, 102, 32-39.

12 |
International Journal of Applied Aviation Studies | 13
A Mixed Method Approach to Runway Incursion
Rating
Robert Edward Joslin, Benjamin Jeffry Goodheart, and William Anthony Tuccio Embry-Riddle Aeronautical UniversityEmail: benjamin.goodheart[at]erau.edu
Abstract
Reduction of runway incursions has been a top strategic objective for the Federal Aviation Admin-istration (FAA) for the last decade. The purpose of this study was to illuminate the underlying factors contributing to runway incursions using a mixed methods analysis of quantitative Runway Safety Office (RSO) data and qualitative ASRS data. A literature review describes how the FAA RSO cat-egorizes incursions by severity from an air traf-fic control perspective, primarily based on closest horizontal and vertical proximity of conflicting aircraft; and how the Aviation Safety Reporting System (ASRS) makes no provision for categoriza-tion by severity, instead primarily collecting narra-tives of self-reported pilot experiences. The study compares the existing RSO runway incursion cat-egorization structure with a researcher-developed scheme for ASRS reports using mixed methods to establish if the two categorization schemes could be harmonized to achieve a greater understanding of the contributory elements of runway incursion incidents. The study rated ASRS severities higher than RSO severities, and found a number of emer-gent themes among ASRS reports that contribute to a more complete understanding of runway in-cursions.
A Mixed Method Approach to Runway Incursion Rating
For over three decades, reduction of runway incursions has been a topic of scrutiny by the Fed-eral Aviation Administration (FAA) and the Na-tional Transportation Safety Board (NTSB). Each agency has targeted runway incursions (RI) in its strategic planning, and though various directives and initiatives have been implemented, the rate at which RIs occur continues to rise. This continuing hazard informed this study, the purpose of which was to illuminate the underlying factors contrib-uting to RIs using a mixed methods analysis of quantitative and qualitative data.
This study addressed the research problem by exploring if the analysis of quantitative FAA Run-way Safety Office (RSO) reports accurately cap-tures the severity category and contributory causal factors involved in RI incidents. In the search for answers to the research question, this study adopt-ed a constructivist worldview, focusing on an inte-grated combination of both quantitative and quali-tative methodologies to discover ways to improve interpretation of runway safety data as a means to decrease RI occurrences. An etic perspective (i.e., the cultural outsider) provided by RSO reports was combined with an emic perspective (i.e., the cultural insider) provided by expert-rater partici-pation in pilot reported incursions. The etic/emic
Return to Table of Contents

14 |
contrast allowed for varied ontological representa-tions of the realities of RIs and an epistemological closeness between researchers and pilot subjects. The inductive nature of this study was further in line with a constructivist view (Creswell & Plano Clark, 2011). Previous research on the application of qualitative or mixed method research design to Aviation Safety Reporting System (ASRS) reports has not to date defined quantitative or qualitative methods in the assignment of narrative reports to categories of interest, exploration of thematic trends or implementation of any qualitative study beyond reporting narrative excerpts. As such, this mixed methods study represents a novel method in this area allowing a greater depth of understanding of RI phenomena.
Adopting a scope similar to a pilot study, this research was intended to develop a credible and trustworthy ASRS categorization of RIs in support of future efforts to examine RI causality and cate-gorization across a more comprehensive sample of airports and reports. In addition, this research pro-vided a practical foundation for the expansion or modification of the existing ASRS data collection instrument to enable more robust categorization of data in support of the ongoing global aviation goal of runway incursion mitigation. An explanatory sequential mixed methods design was used, which first collected quantitative data from RSO reports generated by FAA air traffic controllers. In the next strand, expert raters simultaneously assigned quantitative severity ratings to ASRS narratives and qualitatively coded ICAO causal factors against each narrative. The FAA RSO and ASRS severity ratings were quantitatively compared. The qualita-tive ICAO causal codes were used to explain the quantitative results (FAA, 2010b; NASA, 2011). The quantitative and qualitative strands were both drawn upon to deduce meta-inferences from col-lected data.
An explanatory mixed methods design was se-lected because although substantial quantitative data exist on runway incursions, emic perspective qualitative data from pilot self-reports explain the mechanisms behind the persistent occurrence of RIs in greater resolution than was available through current methods of investigation. The quantitative
research question was: is there a difference between pilot self-reported RI severity and RSO reported severity. The qualitative research question was: to what extent does the pilot reported qualitative nar-rative data from ASRS reports help to explain the quantitative results about runway incursion sever-ity reported by the FAA RSO.
Literature Review
Runway incursions have occupied the public psyche since the catastrophic collision of two Boe-ing 747 aircraft on the runway at Tenerife, Spain in 1977, which killed 583 and remains the most deadly civil air disaster in history (Tarrel, 1985). As defined by the International Civil Aviation Or-ganization (ICAO), an RI is “any occurrence at an aerodrome involving the incorrect presence of an aircraft, vehicle or person on the protected area of a surface designated for the landing and takeoff of aircraft” (EUROCONTROL, 2011, p. v). The 2009 European Aviation Safety Agency (EASA) Annual Safety Review listed runway incursions in the top 10 accident categories and implemented a Euro-pean Action Plan for the Prevention of Runway In-cursions (EUROCONTROL, 2011). Although run-way incursion rate information was not provided, EUROCONTROL states in its web-available data that total runway incursions have increased every year since data collection began in 1999 and pres-ently there is an average of two runway incursion incidents each day in Europe with 51% attributable to pilot deviations (PD) (EUROCONTROL, n.d.).
Despite a strong European interest in stemming the ongoing incidence of RIs, the problem is far from isolated to Europe. Current figures from the FAA Runway Safety website (http://www/faa.gov/ airports/runway_safety) indicate the United States rate of runway incursions per million aircraft op-erations has increased from 12.3 to 18.9 over the last six years, 2005 to 2010, culminating in a total of 966 reported RIs in 2010 with over 60% from PDs (FAA, 2010a). Whereas rises may in part be because of changes in RI definitions (Joslin, 2011), these figures have prompted regulators around the world to develop communications and train-
Mixed Method Approach to Runway Incursion Rating

International Journal of Applied Aviation Studies | 15
riety of contexts as a means to gain an insider per-spective rather than simply gather objective state-ments (van Bekkum, Williams, & Morris, 2011, p. 200). This emic perspective is often absent from strategies for reducing error and may well provide insight into how more effective initiatives may be developed. The emphasis in this study on discovery and meaning rather than on prediction per se also made a phenomenological approach applicable, not least of all because of the abil-ity of this approach to balance out the traditional need for overtly observable data (Osborne, 1994). Though their study is outside the direct scope of the present study, van Bekkum, Williams, and Morris (2011) provided interesting insight regard-ing how purposive sampling coupled with trans-parent phenomenological analysis can lead to the identification of what the authors generally refer to as tentative and emerging themes. Haverila, R. B. Earl, and R. N. Earl (2011) addressed content analysis of narratives in a thematic way consistent with interpretive phenomenological analysis. The researchers in this instance performed an analysis of interview responses to create a broadly inter-pretive approach where quantitative counts could be used as well as specific quotations to “…sum-marize important facets of the raw textual material analyzed” (Haverila, Earl, & Earl, 2011, pp. 1359-60). As a means of discovery of both manifest and latent content, both thematic and content analysis have been established as robust methodological approaches; however, neither thematic nor con-tent analysis have been previously demonstrated in assessment and interpretation of narrative RI reports.
Available literature also indicated a focused ap-plication of qualitative or mixed method research design to ASRS analysis has been only superficial. Tarrel (1985) approached the categorization of ASRS from what he refers to as an epidemiologi-cal perspective, mirroring the methodology often used in the study of influential factors of disease. Though this study is not without merit, it does not outline any defined quantitative or qualita-tive method in its assignment of narrative reports to categories of interest. However, Tarrel (1985) does acknowledge ASRS reports are typically used
ing strategies in an attempt to mitigate the haz-ard. The NTSB in 1991 identified the roots of the FAA’s plan for RI mitigation as originating from a 1987 FAA directive to identify the causes of RIs and to articulate a plan for mitigating the problem (Rankin II, 2008). As a result, the FAA, ICAO, EASA, and other aviation authorities increasingly have focused on runway safety over the past two decades.
In the United States, classification of runway incursions within the FAA RSO database is ac-complished using a severity scale harmonized with ICAO illustrated in Appendix A as well as by type: PD, operator error/deviation, and vehicle/pedes-trian deviation (FAA, 2009). Scores are generated through the use of a Runway Incursion Severity Classification Calculator, the data entry screen on which is shown in Appendix B (ICAO, 2007). The most prevalent type of runway incursions were of the PD type, defined by Flight Standards Informa-tion Management Systems (FSMIS) (2009) as ac-tions of a pilot resulting in a failure to comply with Air Traffic Control (ATC) clearances or instruc-tions.
To date, the primary strategies aimed at reduc-ing RI threats have been those seeking to imple-ment training and engineering protection by way of proposals to modify airport lighting, surface mark-ings, signage, ground-based tracking displays, and cockpit devices (FAA, 2007). Rankin II (2008) identifies the top five most effective RI initia-tives as (a) training of ground vehicle operators, (b) airport surface detection equipment, (c) stop bar lighting, (d) airport surface traffic automation, and (e) airport movement area safety system. In contrast, relatively little research exists focused on understanding the covert errors informing an effec-tive mitigation strategy (Hendrickson, 2009, p. 3). While technology based initiatives undoubtedly have a place in a plan to reduce RIs, without a full understanding of the causal factors at issue, it is possible such initiatives are misguided.
A survey of relevant literature suggested ad-dressing the issue of RIs from a phenomenologi-cal perspective may be appropriate. Interpretive phenomenological analysis has been used in a va-
16 |
exists between the runway incursion severity clas-sification from FAA RSO reports and ASRS pilot reports, and b) thematic constructs extracted from the ASRS narratives inform a greater understand-ing of FAA RSO reports.
Research Methodology
Research Design
This study broadly adopted an explanatory se-quential mixed methods approach, using a quan-titative methodology in the data gathering and descriptive phase of the research and progress-ing into the qualitative realm as FAA RI data were compared with those derived qualitatively from ASRS reports (quan → QUAL = validate through additional quantitative analysis). While both quantitative and qualitative techniques were critical to the success of this research, qualitative information was prioritized because of the nature of the ASRS narrative analysis. Notably, although the authors characterize this study design as ex-planatory, it does share some elemental similarity with an embedded design, wherein the qualitative strand lies within a traditionally quantitative study as a means of enhancing the design. The empha-sis on one type of data, in this case qualitative, is also typical of the embedded design and was embraced in the design of this research. In short, the complex nature of the problem demanded a modicum of design flexibility; and while the heart of this research lies in an explanatory methodol-ogy, readers will notice an embedded design no-ticeably influenced this study (Creswell & Plano Clark, 2011). Figure 1 summarizes the sequence and objectives of the subject research design.
Sampling
The data collection sites for this study were from two sources of publically available U.S. historical data: (a) Air Traffic Controller (ATC) reported RI PD type incidents from the FAA RSO database, and (b) voluntarily submitted pilot reports of RI
to identify unwanted behavior, despite substantial variability in the self-reported data on which to base such conclusions. Instead, it is suggested patterns of circumstance combinations, rather than behaviors may be perceived through content analysis and then used for further study. There is no evidence the conclusions from Tarrel’s (1985) work were ever quantitatively evaluated or used in any further research. In 2003, National Aero-nautics and Space Administration (NASA) ASRS undertook a study with similar goals in mind; however, its execution indicates that although free-form questioning was used to interview pilots who had submitted ASRS reports for an RI, there is no indication of intent to explore thematic trends or implement any qualitative study beyond report-ing narrative excerpts. The report simply ends by offering an appendix of factors and recommenda-tions gleaned from telephone interviews with pi-lots, reinforcing the need for further investigation in this area. NASA encourages the use of ASRS reports specifically for the qualitative information in report narratives (ASRS, 2011). Hendrickson’s (2009) dissertation provides perhaps the most use-ful insight into the concept of using content analy-sis to investigate causal elements as reported in ASRS narratives. Hendrickson (2009) used latent semantic analysis, an information retrieval and language processing technique, to develop a clas-sification of ASRS narratives based on human per-formance drivers. Hendrickson (2009) identifies several shortcomings of the ASRS structure; chief among which are the system’s limited capacity for efficient analysis and the lack of any sort of reason codes or taxonomy by which reports can be clas-sified. While Hendrickson (2009) seems to have made strides in this area, there is no specific focus on any particular kind of report. Based upon the literature available, there exists a clear need for application of methodology capable of identifying underlying causal themes in narrative reports of RI incidents.
Research Hypotheses
The two research hypotheses presented in this study were as follows: a) a significant difference
Mixed Method Approach to Runway Incursion Rating
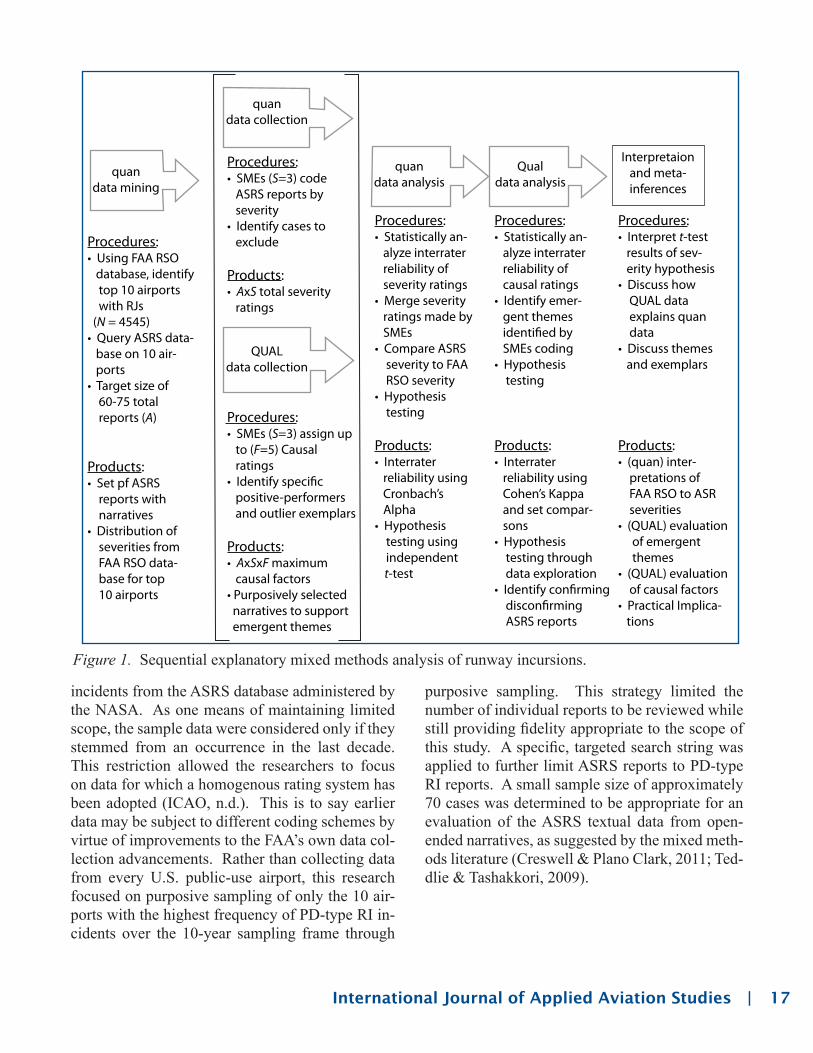
International Journal of Applied Aviation Studies | 17
purposive sampling. This strategy limited the number of individual reports to be reviewed while still providing fidelity appropriate to the scope of this study. A specific, targeted search string was applied to further limit ASRS reports to PD-type RI reports. A small sample size of approximately 70 cases was determined to be appropriate for an evaluation of the ASRS textual data from open-ended narratives, as suggested by the mixed meth-ods literature (Creswell & Plano Clark, 2011; Ted-dlie & Tashakkori, 2009).
incidents from the ASRS database administered by the NASA. As one means of maintaining limited scope, the sample data were considered only if they stemmed from an occurrence in the last decade. This restriction allowed the researchers to focus on data for which a homogenous rating system has been adopted (ICAO, n.d.). This is to say earlier data may be subject to different coding schemes by virtue of improvements to the FAA’s own data col-lection advancements. Rather than collecting data from every U.S. public-use airport, this research focused on purposive sampling of only the 10 air-ports with the highest frequency of PD-type RI in-cidents over the 10-year sampling frame through
Figure 1. Sequential explanatory mixed methods analysis of runway incursions.
quandata mining
quandata collection
QUALdata collection
quandata analysis
Qualdata analysis
Interpretaionand meta-inferences
Procedures:• Using FAA RSO database, identify top 10 airports with RJs (N = 4545)• Query ASRS data- base on 10 air- ports• Target size of 60-75 total reports (A)
Products:• Set pf ASRS reports with narratives• Distribution of severities from FAA RSO data- base for top 10 airports
Procedures:• SMEs (S=3) code ASRS reports by severity• Identify cases to exclude
Products:• AxS total severity ratings
Procedures:• SMEs (S=3) assign up to (F=5) Causal ratings• Identify specific positive-performers and outlier exemplars
Products:• AxSxF maximum causal factors• Purposively selected narratives to support emergent themes
Procedures:• Statistically an- alyze interrater reliability of severity ratings• Merge severity ratings made by SMEs• Compare ASRS severity to FAA RSO severity• Hypothesis testing
Products:• Interrater reliability using Cronbach’s Alpha• Hypothesis testing using independent t-test
Procedures:• Statistically an- alyze interrater reliability of causal ratings• Identify emer- gent themes identified by SMEs coding• Hypothesis testing
Products:• Interrater reliability using Cohen’s Kappa and set compar- sons• Hypothesis testing through data exploration• Identify confirming disconfirming ASRS reports
Procedures:• Interpret t-test results of sev- erity hypothesis• Discuss how QUAL data explains quan data• Discuss themes and exemplars
Products:• (quan) inter- pretations of FAA RSO to ASR severities• (QUAL) evaluation of emergent themes• (QUAL) evaluation of causal factors• Practical Implica- tions

18 |
a. Unique text for identification was recorded for each ASRS case. This acted as a data entry quality measure, as means to check if a rater may have been recording data on the wrong line.
b. Causal Factor Taxonomy of ICAO 9870, Ap-pendix D, Manual on the Prevention of Run-way Incursions was augmented with two addi-tional choices developed by the expert raters.
c. ASRS cases were sorted using a random num-ber generator.
d. Only one set of 10 ASRS cases were evalu-ated per day to mitigate expert rater fatigue.
e. Raters conducted their evaluation on "one pass" for each case without going back and changing ratings.
f. Cases were marked as “exception” if they did not meet the criteria for a runway incursion or if there were insufficient data.
Data collection for both hypotheses were con-ducted simultaneously.
Hypothesis A: RSO and ASRS Severity
In the first phase, FAA RI reports for 2000-2010 were mined quantitatively. The source of the reports was the FAA Runway Safety website (http://www.faa.gov/airports/runway_safety/sta-tistics) and data were collected in spreadsheet for-mat. The reports were filtered by PD-type runway incursions, and the top 10 airports by runway in-cursion counts were identified.
The second step was primarily a quantitative step to develop a purposive sampling of ASRS re-ports from the top 10 airports identified in Step 1. ASRS reports were filtered through a target-ed search string, to provide in-depth information about runway incursions. The existing search en-gine on the ASRS website (http://akama.arc.nasa.gov/ASRSDBOnline/QueryWizard_Filter.aspx) was used (Appendix F) with the following crite-ria:
a. The word incursion in the narrative,
Mixed Method Approach to Runway Incursion Rating
Permissions
The study had no direct interaction with sub-jects and relied instead upon previously collected historical information. The ASRS program and federal regulations informed participants of their rights in the ASRS program, as illustrated in Ap-pendix C, and the FAA RI reports were a report-ing function of the federal government to admin-ister air transportation safety (FAA, 2010; NASA, 2011).
Instrument
The data were recorded and collected on a re-searcher-developed expert rater worksheet with pull down menus to ensure standardized respons-es, as shown in Appendix D. Rater categories used ICAO Runway Incursion Causal Factors (ICAO, 2007) taxonomy and the FAA/ICAO Runway In-cursion Severity (FAA, 2009) taxonomy as illus-trated in Appendix A and Appendix E. Profiles of the three expert raters are provided in Appendix I.
Data Collection
Purposive sampling of the ASRS database provided a pool of narrative reports used for pre-testing the expert raters. Initially, ratings were assigned independently without guidance or com-munication between the raters in an organic ef-fort to determine the most intuitive rating scheme. The raters refined the rating methodology by com-bining best practices of each individual effort to apply a set of coding guidelines to the narrative review process. Allowing that each rater could have identified a boundless number of causal fac-tors among the selected ASRS reports, they were limited to assignment of a maximum of five ICAO causal factors per ASRS report. In total, three pre-test training exercises were executed with 10 ran-dom ASRS cases from airports not in the research study reports to familiarize the raters with the pro-cess and to identify opportunities for improvement in the data collection plan. Based on the training exercises the following procedures were adopted for this study:
International Journal of Applied Aviation Studies | 19
The five, qualitative causal factors were col-lected during the same coding process used to create the severity ratings of each ASRS report. This collection method allowed the study to focus simultaneously on the quantitative and qualitative perspectives of the narrative and also apply an emic and etic perspective.
Data Analysis Method
Each hypothesis was addressed during data analysis. Hypothesis A (severity) was a quanti-tative analysis, while hypothesis B (causal expla-nations) was qualitative with quantitative assess-ments of transformed codes to assist in thematic discovery.
Hypothesis A: RSO and ASRS Severity
Hypothesis A was supported in three areas. These areas were FAA RSO database mining, se-verity interrater reliability, and severity compari-sons to FAA RSO severity reports. Severity and ICAO causal codes were transformed from ASRS narratives and coded into quantitative data. Each analysis is discussed in turn.
FAA RSO database mining. The FAA RSO RI reports from 2000 through 2010 were analyzed using a Microsoft Excel pivot table, filtered to include just PD-type reports. The pivot table provided frequency counts of RSO reports by airport. The resulting sort of most frequent airport identified the top 10 airports by PD RI occurrence frequency.
FAA severity interrater reliability. Each rater determined an RI severity for each ASRS report. The rating, a letter from A to E, was re-coded into a number of one to five. The normality of each rater’s rating distribution was evaluated and transformations applied to achieve normality. The transformed ratings for each rater were analyzed using Cronbach’s Alpha to determine a measure of interrater reliability on severity codes (Leech, Barrett & Morgan, 2008).
b. Airport identifier location of top 10 airports identified from the FAA RSO database,
c. ASRS event type categories specific to RI events,
d. Events occurring in between January 2000 and October 2011, and
e. Reports submitted by pilots.
The criteria were chosen to provide general alignment with the FAA quantitative sample, and to reduce the qualitative data to a size conducive to in-depth analysis. No effort was made to match the exact set of reports from the FAA RSO data-base and ASRS, because such an approach would be difficult at best given the anonymous nature of ASRS reports and further may have artificially lim-ited the study because there is no requirement for ASRS reports to be submitted for every FAA RSO report. As such, some FAA RSO reports may not have corresponding ASRS reports, and the same is true for ASRS reports, which may not have a cor-responding RSO report.
The ASRS reports were coded for severity by the three expert-raters. When the expert-raters be-lieved insufficient information existed to make a rating, the raters had the option of recording the ASRS report as an exception. This is discussed further in the results section.
Hypothesis B: Causal Explanations of Severity
Using the same set of reports identified for se-verities in hypothesis A, causal explanations of se-verity differences were sought. The three expert raters identified up to five causal factors, each se-lected from the previously discussed ICAO taxon-omy, and assigned these codes based on an analysis of each ASRS narrative. This method is consistent with the qualitative coding guideline, “…dividing the text into small units, [and] assigning a label to each unit” (Creswell & Plano Clark, 2011, p. 208). The data were recorded and collected on a re-searcher-developed expert rater worksheet shown in Appendix D.

20 |
ASRS Severity ratings compared to FAA RSO ratings. As described in the prior section, severity codes A through E determined by each rater were re-coded to numbers one through five. When all three raters produced a severity rating for the same ASRS case, the mean rating was used to provide one numerical rating. The average ASRS ratings were compared to the FAA RSO ratings from pilot deviation type runway incursions recorded by the FAA at the same 10 airports, using an independent t-test.
Hypothesis B: Causal Explanations of Severity
While this data analysis was primarily qualita-tive, quantitative analysis of interrater reliability was first performed. Following the interrater re-liability, themes were extracted and qualitatively analyzed. Each step is discussed in turn.
ICAO causal coding quantitative analysis. Each rater examined the ASRS narrative reports and assigned up to five ICAO causal codes per report, effectively re-coding the narratives into nominal, quantitative data. The nominal causal codes were quantitatively analyzed as follows:
Frequency counts. A simple frequency count was made of each ICAO causal category used by each rater. A sort of these frequency counts created thematic insight into the most common among ASRS reports examined. Further, the frequency counts allowed for identification of which ICAO causal codes were not used by any rater.
Interrater reliability. Each rater was allowed to assign between one and five nominal ICAO causal ratings per ASRS report. This coding style presented a challenge to assessment of the interrater reliability, as most statistics available expect a fixed number of codes per item, interval level coding, or only two raters. Three methods were used to assess interrater reliability.
Union of ICAO ratings. Given each rater could assign up to five ICAO causal ratings per ASRS report, this meant per ASRS report there
Mixed Method Approach to Runway Incursion Rating
could be 0 to 15 unique possible codes assigned, if the codes were unioned together. The union technique resulted in a distinct list of ICAO causal codes per ASRS report as well as a count of how many unioned codes were used per ASRS report.
Intersection of ICAO ratings. In contrast to the union operation per ASRS report, an intersection of ratings was also applied to each ASRS report. The intersection operation only retained those codes used by all raters per ASRS report. The intersection technique resulted in a distinct list of ICAO causal codes per ASRS report used by all raters as well as a count of these codings.
Cohen’s Kappa interrater reliability. Cohen’s Kappa provides a measure of interrater reliability of two raters assigning one nominal code to a list of items (Leech, Barrett & Morgan, 2008). Cohen’s Kappa was run for each rater pair, resulting in three comparisons. For reach rater pair, Cohen’s Kappa was run five times. Each of the five runs per rater used a structured query language (SQL) procedure to create a unique nominal string of characters representing a code for each rating. For example, the first run of Cohen’s Kappa used SQL to find any one matching code per ASRS between the two raters. The second run used SQL to find two matching codes per ASRS between the two raters; the two matching codes were concatenated together to create a unique but matching nominal string between the two raters. This process continued for three, four, and five matches. When matches were not found, a unique character string per rater was inserted as a placeholder. At the end of the SQL procedure, dummy ASRS records were inserted to comply with a Cohen procedural requirement of both raters using all possible codes. The procedure resulted in a three by five set of Cohen’s Kappas.
ICAO causal coding qualitative analysis. The qualitative analysis resulted from reading of the ASRS narratives and the assignment of up to five nominal ICAO causal codes. In addition to assignment of causal codes, during the rating process, narrative examples illuminating the emic meaning of the codes were identified to connect the quantitative themes to the qualitative discoveries.

International Journal of Applied Aviation Studies | 21
The saturation coding process led to a better understanding of the ICAO causal codes as repre-senting three themes. As such, the analysis pres-ents ASRS themes through the lens of the three ICAO causal code themes. The qualitative codes provided a basis for identification of themes ex-isting in the ASRS reports evaluated through fre-quency of occurrence. The ASRS narratives were connected to these themes to present mixed meth-ods support of explanatory reasons for the occur-rence of RIs.
Results
The data collection process was executed as described. FAA and ASRS reports were examined in detail, and the data analysis methodology was applied supportive of hypotheses A (severity) and B (causal factors). The results of this effort fol-low.
Results Common to Hypotheses A and B
The initial strand of results was common to both hypotheses. These common results are pre-sented first.
FAA RSO top 10 airports. The FAA RSO database from fiscal year 2000 through 2010 reported 4,545 RI reports. Of these, 3,451 were PD-type reports. Table 1 shows the RIs sorted by frequency for the top 15 airports as reported on the FAA RSO website (http://www.faa.gov/airports/runway_safety/statistics). The study selected the top 10 airports: VGT, LAX, SNA, FXE, BOS, LGB, PDK, SAT, PRC, ATL, which yielded 484 PD-type RI reports. While LAS had more occurrences than ATL in Table 1, the data available at the start of the study placed ATL ahead of LAS, thus ATL was the tenth airport rather than LAS.
ASRS reports selected. The results of the quantitative analysis of FAA RSO reports guided the ASRS query as described in the methodology section and produced a total of 68 ASRS reports.
Table 1
Top 15 Occurrences of RIs by Airports
Airport Ident
Airport Count
LAX Los Angeles Intl, CA 74
VGT North Las Vegas Airport, NV 74
SNA John Wayne Airport-Orange Co, Santa Ana, CA 66
FXE Fort Lauderdale Executive Airport, FL 58
BOS General Edward Lawerence Logan Intl, Boston MA 55
LGB Long Beach/Daugherty Field, CA 54
PDK Dekalb-Peachtree Airport, Atlanta, GA 44
SAT San Antonio Intl, TX 41
PRC Ernest A Love Field, Prescott, AZ 39
LAS McCarran Intl, Las Vegas, NV 38
ATL Hartsfield-Jackson Atlanta Intl, GA 37
TUS Phoenix Deer Valley Airport, AZ 37
DVT Tucson Intl, AZ 37
CCR Buchanan Field, Concord, CA 35
ADS Addison Airport, Dallas, TX 34
Rater coding results. Each rater worked independently creating three sets of codes. The rater results are presented in Appendix G. Each rater had the option of marking an ASRS report as an exception; for example when the report was not a PD type report or a report was not made by

22 |
AT BOSTON, I WAS ISSUED THE CLRNC TO TAXI TO RWY 4R… I WAS THEN ISSUED THE CLRNC TO PROCEED 'TO THE VISUAL HOLD POINT.' AFTER CLRING THE SHORT FINAL APCH COURSE, I PROCEEDED ONTO THE RWY TO THE VISUAL HOLD POINT WHERE THERE USED TO BE A SIGN TO THE L OF THE RWY IN-DICATING THE POINT TO WHICH ACFT SHOULD TAXI UP TO IN ORDER TO BEGIN THE TKOF RUN. I COULD NOT SPOT THAT SIGN AS IT WAS UNLIT. I SET THE PARKING BRAKE WHILE IN THE TKOF POS AND A FEW SECONDS LATER I RECEIVED A TKOF CLRNC.
For two of the raters, the aforementioned report presented an ambiguity in information suggesting controller error. However, one rater interpreted this as a clear case of taking an active runway when being told to hold short.
Hypothesis A: RSO and ASRS Severity
The severity codes assigned were analyzed. Of the 54 ASRS reports available for analysis, only 41 had a severity code assigned by all of raters. In large part this was a result of the two out of three condition for an ASRS report to be excluded. This meant if one rater thought an ASRS report should be excepted, individually a severity was not as-signed. In a few cases, one or more raters rated the ASRS but failed to assign a severity code.
Interrater reliability of RI severity coding. The interrater reliability of severity codes was assessed using Cronbach’s Alpha. To achieve a more nor-mal distribution of ratings for each rater, each rating was logarithmically transformed for evalu-ation by Cronbach’s Alpha. Even after the loga-rithmic transformation, one rater’s distributions of severity remained slightly skewed. Cronbach’s Alpha for the log of the severity was .637, which indicates the three raters achieved only minimal internal consistency (Leech, Barrett & Morgan, 2008).
Hypothesis testing of RI severity. To address the first hypothesis that a significant difference
Mixed Method Approach to Runway Incursion Rating
the crew involved in the RI. It was decided an exception existed if at least two raters identified a report as such. Application of this rule resulted in 14 records being eliminated from analysis, yielding the ASRS identification numbers shown in Table 2. Thus out of 68 total ASRS reports, only 54 were used in subsequent quantitative and qualitative analysis.
Table 2
ASRS Report Identifiers Excluded from Further Analysis
ASRS ID ASRS ID ASRS ID ASRS ID523642 585771 506520 561190630406 522030 775974 560876504850 543639 562179 913109905932 637297 492148
Two reports were excluded because they were submitted by air traffic controllers and thus lacked an emic, PD perspective. A report of an airborne intercept by military aircraft for a restricted air-space incursion was also excluded.
In cases for which only two out of three of the three raters opted for exclusion, the reasons varied. In six cases, reports were excluded because they dealt with taxiway errors away from the runway. The disagreeing rater believed these should be in-cluded as they were precursors to runway incur-sions; however they did not meet the FAA (2009) definition of a runway incursion. In another two cases, the pilot submitted ASRS described an ATC operational error. In one report, an aircraft could not clear the runway due to insufficient space on a taxiway, causing a go-around. One report was excluded because the narrative information was in-ternally inconsistent as expressed by the pilot. An-other report was exclude because the pilot missed an advisory hold short line but still held short of the mandatory hold short line. Last, a report was excluded where the pilot crossed a hold short line and taxied into position and hold. In this last ex-cluded case, ASRS #637297, the pilot said in part,
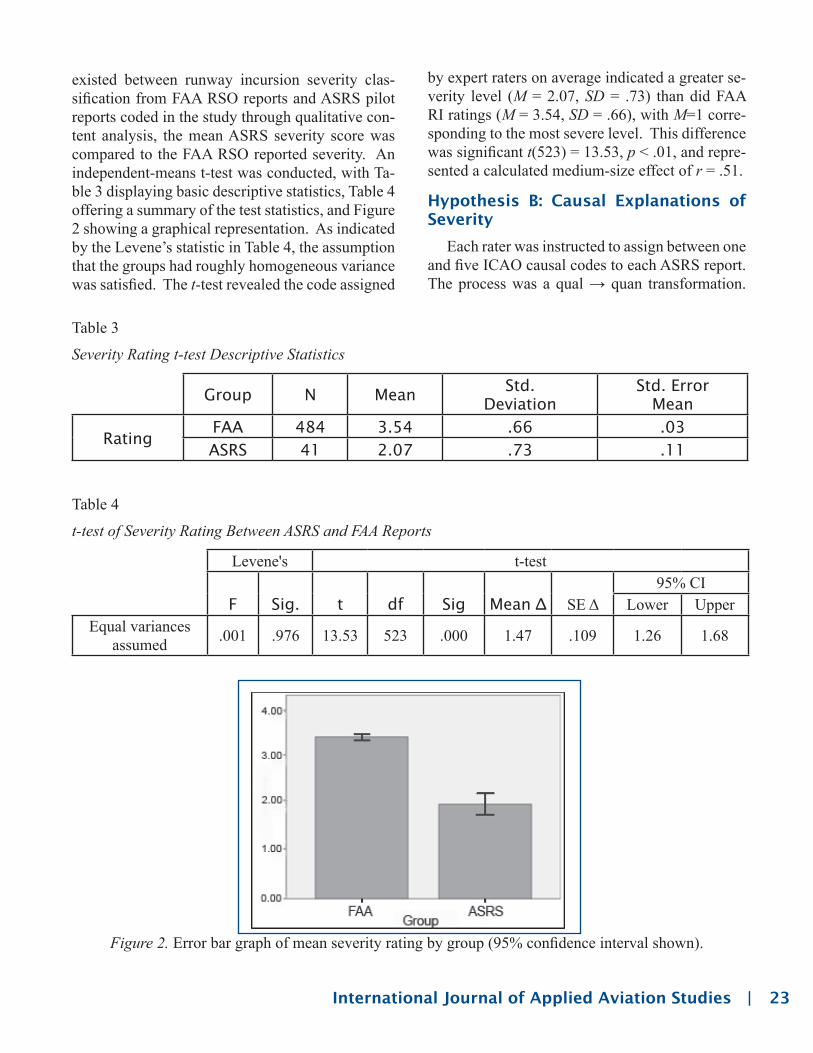
International Journal of Applied Aviation Studies | 23
by expert raters on average indicated a greater se-verity level (M = 2.07, SD = .73) than did FAA RI ratings (M = 3.54, SD = .66), with M=1 corre-sponding to the most severe level. This difference was significant t(523) = 13.53, p < .01, and repre-sented a calculated medium-size effect of r = .51.
Hypothesis B: Causal Explanations of Severity
Each rater was instructed to assign between one and five ICAO causal codes to each ASRS report. The process was a qual → quan transformation.
existed between runway incursion severity clas-sification from FAA RSO reports and ASRS pilot reports coded in the study through qualitative con-tent analysis, the mean ASRS severity score was compared to the FAA RSO reported severity. An independent-means t-test was conducted, with Ta-ble 3 displaying basic descriptive statistics, Table 4 offering a summary of the test statistics, and Figure 2 showing a graphical representation. As indicated by the Levene’s statistic in Table 4, the assumption that the groups had roughly homogeneous variance was satisfied. The t-test revealed the code assigned
Table 3
Severity Rating t-test Descriptive Statistics
Group N MeanStd.
DeviationStd. Error
Mean
RatingFAA 484 3.54 .66 .03
ASRS 41 2.07 .73 .11
Table 4
t-test of Severity Rating Between ASRS and FAA Reports
Levene's t-test
F Sig. t df Sig Mean Δ SE Δ95% CI
Lower UpperEqual variances
assumed .001 .976 13.53 523 .000 1.47 .109 1.26 1.68
Figure 2. Error bar graph of mean severity rating by group (95% confidence interval shown).

24 |
tion, and 2.5.2, Did Not Read Back Clearance, to avoid overuse of the broad other categorizations. Through the coding process it was discovered the codes used represented three broad themes of classifications: descriptive, causal, and contribu-tory, which are presented in Table 5. The clas-
This section discusses the various quantitative and qualitative aspects of the qualitative coding, in-cluding measures of interrater reliability.
Groupings of ICAO causal codes. During training and pre-testing rating exercises, it was decided to supplement the ICAO causals codes with two additional codes, 2.5.1, Crew Coordina-
Mixed Method Approach to Runway Incursion Rating
Code DescriptionDescriptive
2.4.5 Entered the runway after being instructed to “hold short”2.4.6 Lined up on the runway after instruction to taxi to the runway-holding position
(point)2.4.7 Took off without a clearance after being instructed to “line up and wait”2.4.8 Took off without a clearance after being instructed to taxi to the runway-holding
position (point)2.4.9 Landed or departed on the wrong runway2.4.10 Landed or departed on the taxiwayCausal2.1.3 Accepted a similar aircraft’s clearance: • with similar call signs • without similar
call signs2.2.6 Crew mistook their position on the aerodrome (thought they were in a different
location)2.2.8 Reported incorrect location to ATC2.2.9 Taxied fast2.4.1 Misunderstood clearance: • conditional • follow • other2.4.4 Forgot part of the clearance or instruction
Contributory2.1.1 Transmission was completely blocked2.1.2 Transmission was partially blocked (“stepped-on”)2.1.4 Deviation from established ICAO standard phraseologies2.1.5 Used other than ICAO language requirements for air-ground radiotelephony com-
munications (language normally used by the station on the ground or the English language) in a situation not covered by ICAO standard phraseology
2.1.6 Used language not in accordance with ICAO language requirements for air-ground radiotelephony communications (language normally used by the station on the ground or the English language)
Table 5
ICAO Causal Codes Classification
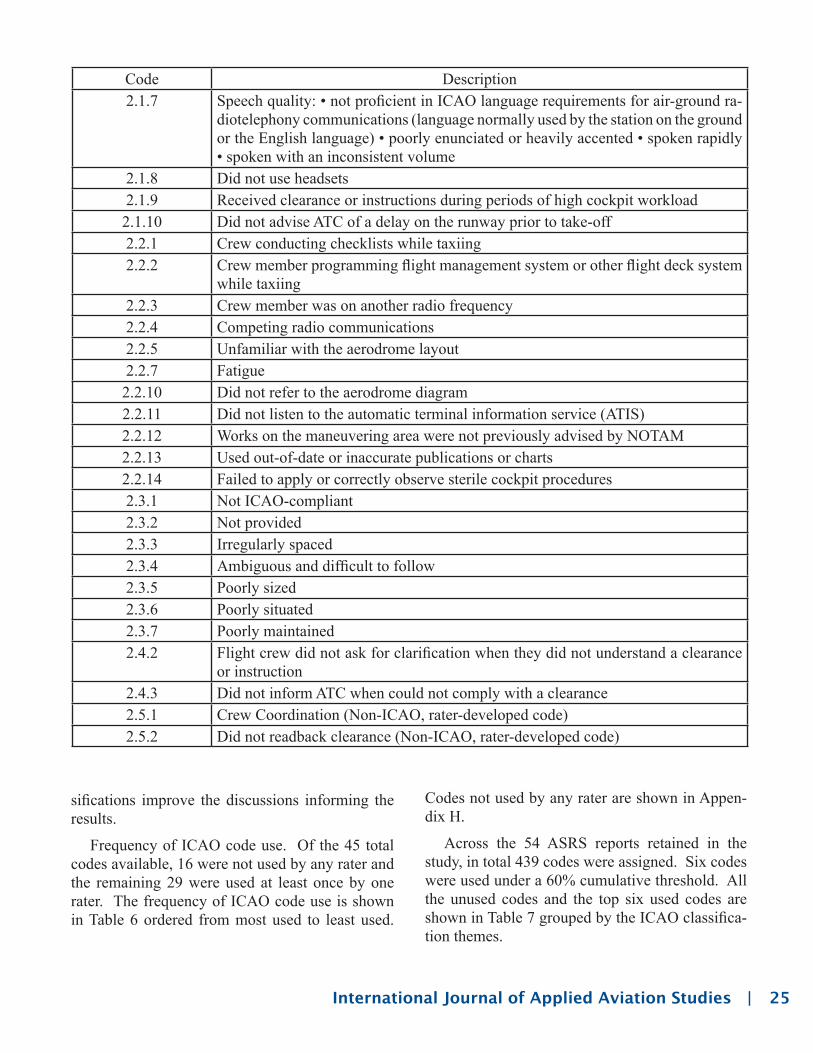
International Journal of Applied Aviation Studies | 25
Codes not used by any rater are shown in Appen-dix H.
Across the 54 ASRS reports retained in the study, in total 439 codes were assigned. Six codes were used under a 60% cumulative threshold. All the unused codes and the top six used codes are shown in Table 7 grouped by the ICAO classifica-tion themes.
sifications improve the discussions informing the results.
Frequency of ICAO code use. Of the 45 total codes available, 16 were not used by any rater and the remaining 29 were used at least once by one rater. The frequency of ICAO code use is shown in Table 6 ordered from most used to least used.
Code Description2.1.7 Speech quality: • not proficient in ICAO language requirements for air-ground ra-
diotelephony communications (language normally used by the station on the ground or the English language) • poorly enunciated or heavily accented • spoken rapidly • spoken with an inconsistent volume
2.1.8 Did not use headsets2.1.9 Received clearance or instructions during periods of high cockpit workload2.1.10 Did not advise ATC of a delay on the runway prior to take-off2.2.1 Crew conducting checklists while taxiing2.2.2 Crew member programming flight management system or other flight deck system
while taxiing2.2.3 Crew member was on another radio frequency2.2.4 Competing radio communications2.2.5 Unfamiliar with the aerodrome layout2.2.7 Fatigue2.2.10 Did not refer to the aerodrome diagram2.2.11 Did not listen to the automatic terminal information service (ATIS)2.2.12 Works on the maneuvering area were not previously advised by NOTAM2.2.13 Used out-of-date or inaccurate publications or charts2.2.14 Failed to apply or correctly observe sterile cockpit procedures2.3.1 Not ICAO-compliant2.3.2 Not provided2.3.3 Irregularly spaced2.3.4 Ambiguous and difficult to follow2.3.5 Poorly sized2.3.6 Poorly situated2.3.7 Poorly maintained2.4.2 Flight crew did not ask for clarification when they did not understand a clearance
or instruction2.4.3 Did not inform ATC when could not comply with a clearance2.5.1 Crew Coordination (Non-ICAO, rater-developed code)2.5.2 Did not readback clearance (Non-ICAO, rater-developed code)

26 | Mixed Method Approach to Runway Incursion Rating
Table 6
Frequency of ICAO Code Use by All Raters
Count Cum Count Cum Pct Code Description77 77 18% 2.4.5 Entered the runway after being instructed to “hold short”52 129 29% 2.5.1 Crew Coordination48 177 40% 2.4.1 Misunderstood clearance: • conditional • follow • other
30 207 47% 2.4.2 Flight crew did not ask for clarification when they did not understand a clearance or instruction
23 230 52% 2.2.5 Unfamiliar with the aerodrome layout22 252 57% 2.2.1 Crew conducting checklists while taxiing18 270 62% 2.2.7 Fatigue
15 285 65% 2.2.2 Crew member programming flight management system or other flight deck system while taxiing
15 300 68% 2.2.6 Crew mistook their position on the aerodrome (thought they were in a different location)
13 313 71% 2.3.6 Poorly situated12 325 74% 2.5.2 Did not readback clearance11 336 77% 2.2.4 Competing radio communications
11 347 79% 2.4.6 Lined up on the runway after instruction to taxi to the runway-holding position (point)
10 357 81% 2.1.9 Received clearance or instructions during periods of high cockpit workload
10 367 84% 2.3.4 Ambiguous and difficult to follow
8 375 85% 2.1.3 Accepted a similar aircraft’s clearance: • with similar call signs • without similar call signs
8 383 87% 2.2.15 Other (please specify).8 391 89% 2.2.3 Crew member was on another radio frequency7 398 91% 2.4.4 Forgot part of the clearance or instruction6 404 92% 2.2.10 Did not refer to the aerodrome diagram6 410 93% 2.2.9 Taxied fast6 416 95% 2.3.7 Poorly maintained5 421 96% 2.1.2 Transmission was partially blocked (“stepped-on”)5 426 97% 2.4.11 Other (please specify).
4 430 98% 2.4.7 Took off without a clearance after being instructed to “line up and wait”
3 433 99% 2.1.4 Deviation from established ICAO standard phraseolo-gies
3 436 99% 2.2.13 Used out-of-date or inaccurate publications or charts
2 438 100% 2.4.3 Did not inform ATC when could not comply with a clear-ance
1 439 100% 2.3.2 Not provided

International Journal of Applied Aviation Studies | 27
Table 7
Top Six ICAO Codes and Unused Codes Grouped by Study Identified Themes
Code Count DescriptionDescriptive2.4.5 77 Entered the runway after being instructed to “hold short”Causal2.4.1 48 Misunderstood clearance: • conditional • follow • otherContributory2.2.1 22 Crew conducting checklists while taxiing2.2.5 23 Unfamiliar with the aerodrome layout
2.4.2 30 Flight crew did not ask for clarification when they did not understand a clearance or instruction
2.5.1 52 Crew CoordinationUNUSED CODES
Descriptive2.4.10 0 Landed or departed on the taxiway
2.4.8 0 Took off without a clearance after being instructed to taxi to the runway-holding position (point)
2.4.9 0 Landed or departed on the wrong runwayCausal2.2.8 0 Reported incorrect location to ATCContributory2.1.1 0 Transmission was completely blocked2.1.10 0 Did not advise ATC of a delay on the runway prior to take-off
2.1.5 0Used other than ICAO language requirements for air-ground radiotelepho-ny communications (language normally used by the station on the ground or the English language) in a situation not covered by ICAO standard phraseology
2.1.6 0Used language not in accordance with ICAO language requirements for air-ground radiotelephony communications (language normally used by the station on the ground or the English language)
2.1.7 0Speech quality: • not proficient in ICAO language requirements for air-ground radiotelephony communications (language normally used by the station on the ground or the English language) • poorly enunciated or heav-ily accented • spoken rapidly • spoken with
2.1.8 0 Did not use headsets2.2.11 0 Did not listen to the automatic terminal information service (ATIS)2.2.12 0 Works on the maneuvering area were not previously advised by NOTAM2.2.14 0 Failed to apply or correctly observe sterile cockpit procedures2.3.1 0 Not ICAO-compliant2.3.3 0 Irregularly spaced2.3.5 0 Poorly sized

28 | Mixed Method Approach to Runway Incursion Rating
Interrater reliability measures. Three quantita-tive analyses were performed to assess ICAO code interrater reliability: union, intersection, and Co-hen’s Kappa.
The union and intersection of rater coding is shown in Figure 3. The union of ratings shows a mode between five and six ratings. Given the max-imum possible ratings for three raters permitted to assign up to five codes is 15, a mode between five and six provides some indication of interrater reli-ability. The intersection of ratings shows a rapid drop off from one to two common ratings amongst all raters.
Finally, the Cohen’s Kappa procedure outlined in the method section was performed. The Kappa statistic is plotted in Figure 4. Similar to the in-tersection of Figure 3, there is a rapid drop off in convergence for all rater pairs after two causal fac-tors.
Discussion
The quantitative and qualitative results present-ed provide measures of severity code comparison and relations to runway incursion causation themes.
Figure 3. Rating union among ASRS reports and three raters.
Figure 4. Cohen’s Kappa by rater pair at rating code agreement levels.
International Journal of Applied Aviation Studies | 29
Descriptive theme: Code 2.4.5. The most fre-quent causal code used was 2.4.5, Entered the run-way after being instructed to “hold short.” This code is descriptive and relates what happened but not necessarily why it happened. ASRS report #577552 was an example of where all three raters agreed on the use of 2.4.5,
TWR CLRED US TO 'TURN L ON TXWY L' AND HOLD SHORT OF RWY 19L, ACR'S USE RWY 19R. NORMALLY, WHEN TWR CLRS YOU TO 'TURN L ON TXWY L' YOU ARE CL-RED TO CROSS RWY 19L AND HOLD SHORT OF RWY 19R. NOT THIS TIME. WE WERE CL-RLY TOLD TO HOLD SHORT OF RWY 19L. I EVEN REPEATED THE CLRNC TO THE FO. AFTER TURNING L ON TXWY L I THEN, OUT OF HABIT, CROSSED THE RWY 19L HOLD LINE AND WOULD HAVE CROSSED ONTO THE RWY EXCEPT I SAW A SMALL PLANE ON SHORT FINAL FOR RWY 19L.
In this example, the pilot stopped, but it is a fairly typical example of the hold short code. It was found many ASRS reports had emic sugges-tions. The reporter in #577552 went on to say,
THE POINT IS, I DISTINCTLY HEARD THE CLRNC TO HOLD SHORT OF RWY 19L, EVEN REPEATED IT, BUT STILL, OUT OF HABIT, INTENDED TO CROSS RWY 19L AND HOLD SHORT OF RWY 19R AS USU-AL. UNTIL NOW I THOUGHT RWY IN-CURSIONS WERE THE RESULTS OF NOT PAYING ATTN (I'VE NEVER DONE THIS IN 30+ YRS OF FLYING). NOW, EVEN I CAN'T EXPLAIN WHY I DID THIS.
The authors were impressed with the frankness of the pilot, which speaks highly of the trust in the ASRS system. The pilot’s observation of hab-it patterns are an important theme, found absent from the ICAO coding system.
Contributory theme: Code 2.5.1. The second most frequent causal code used was a code of 2.5.1 for Crew Coordination, which was developed by the expert raters during the training/pre-test exer-cise. This code is causal and relates why the event happened. ASRS report #638598 was an example
These results are discussed and interpreted in this section.
Hypothesis A: Severity Comparisons
There was a statistically significant difference (p < .01) between the severity of the FAA RSO re-ports and the ASRS reports investigated. One pos-sible inference based on this difference is only RI events perceived as being relatively severe trigger a pilot report via the ASRS system. The obverse being for cases in which a pilot is either unaware of an incursion or where the event appears to a pilot involved to have little potential for a catastrophic outcome, no report will be filed. However, because the query methodology was focused on reducing the sample ASRS data down to only 70 cases for the purpose of qualitative analysis, the study could not find confidence in the severity t-test signifi-cance and effect alone.
However, as each ASRS report was read, the raters agreed many reports rated as A or B severity were likely not so by the FAA RSO rating stan-dard. This is because the FAA RSO rating standard is based upon temporal and aircraft proximity con-ditions. To wit, if an aircraft taxied onto an active runway after being told to hold short, the FAA RSO database would rate the event as a C if no other air-craft were in the vicinity; but all raters agreed this type of occurrence turned out to be an A or B on our scale, depending on why the crew erred. This explanatory emphasis is further explained as emer-gent themes are investigated.
Hypothesis B: Causal Explanations
The causal themes presented in Table 5 and the frequencies of use were used to guide the review of qualitative examples of explanatory ASRS reports. The review of these reports reinforced the strong explanatory nature of this study, allowing the raters, in effect, to become a part of each scenario through the rich narrative data. The natural inference is the emic awareness of the peculiarities of each event explains the statistically significant difference be-tween the raters’ own severity ratings and those as-signed in the mined FAA RSO reports.

30 |
I DID A RWY INCURSION. I AM VERY DISAPPOINTED WITH MYSELF. I KNOW HOW DANGEROUS THIS MISTAKE IS AND THE EMPHASIS THE COMPANY PUTS ON IT… AGAIN I SAID, 'SOR-RY FOR THE MIX-UP.' TWR SAID, 'NO PROB'… IT WAS MY FAULT, PERIOD. I ALWAYS THOUGHT IF I EVER DID SOMETHING LIKE THIS, IT WOULD BE AT AN UNFAMILIAR FIELD AND IN BAD VISIBILITY.
The pilot’s commentary from an ASRS report adds a level of depth to an event not captured in FAA RSO reports, and the authors were convinced by such communication the hypothesis that the-matic constructs extracted from ASRS narrative data are valuable in informing a greater under-standing of runway incursion events may be sup-ported.
Contributory theme: Code 2.4.2. The analysis also identified failure to ask for clearance clarifi-cation, 2.4.2, as a theme in many cases. All raters agreed ASRS report #528006 provided an exam-ple of an avoidable incursion had the pilot simply asked for clarification:
…THE CTLR ALSO TOLD THE LNDG AIR-PLANE THAT THERE WOULD BE 2 DEPS PRIOR TO HIS ARR, WHICH THE PLT ACKNOWLEDGED. THEN THE EVENTS LEADING UP TO AN ALMOST CERTAIN INCURSION BTWN MYSELF AND THE LNDG ACFT BEGAN. SINCE THERE WAS JUST MY AIRPLANE AND THE AIRPLANE STILL HOLDING SHORT AT RWY 2L, I KNEW WE WERE THE 2 ACFT TO DEPART PRIOR TO THE ARRIVING ACFT. I THOUGHT IT STRANGE WHEN THE CTLR THEN CLRED THE ACFT HOLDING SHORT OF RWY 2L TO CROSS OVER RWY 2L FOR RWY 2R. WHAT I THOUGHT HE SHOULD HAVE DONE FIRST WAS TO CLR ME FOR TKOF. HE THEN TOLD ME TO TAXI INTO POS AND HOLD ON RWY 2L. I THOUGHT SOME-THING WAS AMISS AND SHOULD HAVE QUESTIONED HIM, BUT I THOUGHT
of failure to follow basic crew coordination proce-dures as perceived by the first officer.
AS WE APCHED RWY 33R/15L, I TOLD THE CAPT WE NEEDED TO HOLD SHORT OF RWY 33R. HE CONTINUED TO TAXI. I SAID AGAIN TO STOP THE ACFT UNTIL WE HAD A CHANCE TO TALK WITH GND CTL. THE CAPT SAID THAT THE RWY WAS NOT ACTIVE, THEREFORE, IT WAS OK TO CROSS WITHOUT CLRNC. I STRONGLY DIS-AGREED AND SAID FOR THE THIRD TIME TO HOLD SHORT. THE CAPT DID NOT, AND WE CROSSED RWY 33R/15L. FURTHERMORE, HIS LACK OF CRM IN THIS SIT WAS UNACCEPTABLE. HE DID WHAT HE WANTED TO DO.
Causal theme: Code 2.4.1. Cases of misunder-stood clearance, causal code 2.4.1, were also the subject of frequent rater agreement. ASRS report #578955 provides insight as a case fairly typical of those observed with misunderstood clearances. This report also captures the common contribut-ing factors observed in such scenarios. The pilot describes possible causative factors to the incur-sion as crew inexperience, being rushed, and ex-pectancy:
IT WAS THE LAST LEG OF THE DAY, THE LAST DAY OF A 4-DAY. MY FO WAS VERY NEW… TOO MANY THINGS HAD BEEN TOO UNUSUAL IN THE LAST FEW MINS…. I HAD A ROCK SOLID EXPECTA-TION THAT WE WERE GOING TO TAKE OFF ON THE L. THAT'S THE WAY IT AL-WAYS IS AND DURING PUSH, GND CTL EVEN SAID 'PUSH FOR RWY 24L.' I WILL NOT MAKE THESE ASSUMPTIONS IN THE FUTURE AT LAX, OR ANYWHERE ELSE.
As with many of the reports reviewed, emic messages from the reporter are clear. The pilot noted many times his own disappointment that a miscommunication had led to an incursion, stat-ing:
Mixed Method Approach to Runway Incursion Rating
International Journal of Applied Aviation Studies | 31
Contributory theme: Code 2.2.1. The last high ranking theme was 2.2.1, crew conducting checklists while taxiing. ASRS report #541888 presented this example,
…AS THE PLT WAS TAXIING I [co-pilot] WAS RUNNING THE CHKLIST THEN PROGRAMMING THE FMS FOR OUR RTE FROM KBOS AND VERIFYING THE RTE ON THE LOW ALT ENRTE CHARTS. AF-TER PROGRAMMING THE FMS WHILE THE FLYING PLT WAS STILL TAXIING. I WAS THEN STUDYING THE LOGAN 2 DEP PROCEDURE FOR RWY 27 AND FINDING THE DEP FREQUENCY WE WOULD EVENTUALLY NEED. AT THIS POINT BOSTON - LOGAN GND ISSUED US THE FOLLOWING TAXI CLRNC, 'ACFT X CROSS RWY 33L ON D AND TAXI TO RWY 27 CONTACT 128.8.' WHILE I READ BACK THIS CLRNC LOOKING-UP FROM THE DP AND CHANGING FROM 121.9 TO 128.8 THE PLT HAD MADE A L TURN ON G INSTEAD OF D AND TAX-IED ONTO RWY 33L…
While in this case the co-pilot discussed fatigue issues, the distraction element was quite clear. This report had a unique aspect in that the ASRS data set had put the captain’s and copilot’s opin-ions together into the same report. The captain’s perspective was,
… BEFORE LEAVING FBO PARKING RAMP PLT ASKED CO-PLT FOR ARPT DIAGRAM. PLT REVIEW ARPT TAXI RTS AND UNDERSTOOD CLRNC. PLT HAND-ED THE ARPT DIAGRAM BACK TO CO-PLT FOR HIM TO FOLLOW ALONG DUR-ING TAXI…A CLRNC WAS ISSUED BY THE GND/TWR CTLR (SAME PERSON AT BOTH POSITIONS) TO CROSS RWY 33L. THE CREW BELIEVED THEY WERE ON TXWY G PROCEEDED ONTO RWY 33L. THE PLT REALIZING HE WAS ON THE WRONG TXWY MADE A 180 DEG TURN TO EXIT RWY 33L AT TXWY G. THE CO-PLT WAS HAVING DIFFICULTY COM WITH GND/TWR CTLR AT WHICH
HE KNEW WHERE I WAS AND SURELY MEANT RWY 2R OF MAYBE HE SAID 2R AND I JUST THOUGHT HE SAID 2L. I BE-GAN TO TAXI ONTO RWY 2R AND THEN I HEARD THE CTLR SCREAM MY TAIL NUMBER TO STOP.
When the pilot says, “…I thought something was amiss and should have questioned…,” is not uncommon. Many cases were seen where the pilot had an inner feeling something was not right. In ASRS report #579253, the pilot notes,
…THE FO AND I BOTH HAD OUR ARPT DIAGRAMS OUT AND WERE DISCUSS-ING 'WHAT DID THE CTLR SAY?' I HAD BEEN TAXIING VERY SLOWLY, AND WAS ALMOST STOPPED SO THAT WE COULD GET A CLARIFIED CLRNC WHEN THE CTLR CALLED US AND TOLD US TO 'HOLD SHORT OF RWY 4L.'
Similar to #528006, the raters noted a pilot sensing an impending problem. In this case the pilot slowed and avoided an incursion; however, the controller still issued a go-around to another aircraft because the aircraft’s intentions were not clear to the controller.
Contributory theme: Code 2.2.5. While 2.2.5, unfamiliar with aerodrome layout, was within the top six, the authors were surprised it was not more highly rated. ASRS report #545129 succinctly epitomized the code 2.2.5,
…BOS HAS A BRAVO HOLD POINT AND BOTH CAPT AND FO DISTR BY DIS-CUSSING PROPER TAXI RTE TO HOLD POINT BRAVO -- BOTH FO AND CAPT SPENDING A LOT OF TIME LOOKING DOWN AT ARPT DIAGRAM. CONTRIB-UTING FACTORS: 1) DISTR IN COCKPIT AS BOTH FO AND CAPT REFERRING TO ARPT DIAGRAM -- UNFAMILIAR WITH ARPT…
Similar to nearly all the reports rated, there were multiple factors at play; unfamiliarity was often ac-companied by other distractions as noted in this re-port.
32 |
scenario for runway incursions were aircraft en-tering the runway, after being told by ATC to hold short, when the crew misunderstood the clearance and failed to request clarification. Overarching themes characterized by these events included re-liance by crews on assumptions and expectations as well as poor crew coordination skills, especial-ly during conditions of unusually high workload or unfamiliar airport surroundings.
The literature review demonstrated a need for further analysis of RI incidents by illuminating the very rigid structure in which FAA RI data is currently examined and understood. Research in dissimilar fields has much to offer in terms of tex-tual analysis as a means of identifying emerging trends, arguably a first step toward validating and targeting mitigation techniques. Through the ap-plication of explanatory sequential mixed meth-ods research to elucidate the significant difference between RSO severity classification and those assigned by expert raters tasked with achieving a deeper awareness of the situational circumstances unique to each event, this study contributed to the understanding of the complex causality of RI cases. This study informs further research in the domain to build toward a more comprehensive un-derstanding of how future runway incidents can be prevented.
Future Research Directions
Controls, or aviation system defenses, for man-aging and reducing the risk and controlling runway incursion hazards have been grouped by ICAO under the three general categories of technology, training, and regulations (ICAO, 2008, p. 5-ix). This study indicated the best mitigation strategy may be to focus future research on training, spe-cifically in the areas of pilot-controller communi-cation and crew coordination. As research in this area continues toward maturity, the results of this study suggest substantial gains in understanding the nature of the problem may be achieved through careful thematic analysis. While emerging themes were identified in this study in a relatively rudi-mentary fashion and with a constrained data set, future research efforts may be best focused on an-alytical techniques, such as those discussed previ-
TIME THE PLT MADE CONTACT AND ANNOUNCED CLR OF RWY 33L AT IN-TERSECTION G.
The raters were struck by the different perspec-tives of the captain and co-pilot describing the same event. While avoidance of self-incrimina-tion may explain part of the difference, the raters believed there were genuine issues of disagree-ment and also thought the co-pilot summarized the crew distraction issue effectively by saying,
THE POSSIBLE CORRECTIVE ACTION WOULD FOR ME AS A CO-PLT NOT TO TOTALLY RELY ON THE PLT TO TAXI WHILE I AM BUSY WITH OTHER CO-PLT DUTIES AND TO BOTH JUST CON-CENTRATE AT THE TASK AT HAND TAXIING AT A MAJOR ARPT AT NIGHT TO PREVENT ANY RWY INCURSIONS.
The raters wholly agreed with the self-evident assessment made by the co-pilot. As the raters immersed themselves in the emic perspective, as-sessment of this closing comment was consistent with the overarching theme of inadequate crew coordination.
Airport Layout Issues
In the emic examination of ASRS reports, each rater noted certain airports have limited maneu-vering areas after landing, such as the parallel run-ways at LAX, inherently causing problems diffi-cult to address through hot spots alone.
There appear to be remaining airport layout issues for accommodating larger aircraft at some older airports. These airports may have been de-signed before the introduction of larger aircraft, coupled with busier operations in which aircraft can get stacked up. It also appears the predomi-nance of runway/taxiway signage and lighting is-sues may have been fixed, because there were very few ASRS comments in this area.
Conclusions
The qualitative analysis of ASRS narratives provided greater understanding of the FAA RSO reports and indicated the most commonly observed
Mixed Method Approach to Runway Incursion Rating

International Journal of Applied Aviation Studies | 33
FAA (2009). National runway safety plan 2009-2011. Retrieved September 10, 2011, from http://www.faa.gov/ airports/runway_safety/publications/
FAA (2010a). Annual runway safety report. Wash-ington, DC: Author.
FAA (2010b, September 16). Runway safety pro-gram (Order 7510.1A). Washington, DC: Au-thor.
FAA (2011, March). NextGen implementation plan. Washington, DC: Author.
Flight Standards Information Management Sys-tems [FSIMS] (2009). FAA Order 8900.1. Retrieved from http://fsims.faa.gov/
Haverila, M., Earl, R. B., & Earl, R. N. (2011). The drivers of customer satisfaction in strate-gic consulting engagements: A global study. Management Decision, 49(8), 1354-1370.
Hendrickson, S. M. L. (2009). The wrong Wright stuff: Mapping human error in aviation (Doc-toral dissertation).
ICAO (n.d.). ICAO - Flight safety information ex-change. Retrieved, from http://www.icao.int/FSIX/Risc.cfm
International Civil Aviation Organization [ICAO] (2007). Manual on the Prevention of Runway Incursions). Retrieved from http://www.icao.int/fsix/_Library\ Runway%20 Incursion%20Manual-final_full_fsix.pdf
International Civil Aviation Organization [ICAO] (2008). Safety Management Manual (SMM). Retrieved from http://www.icao.int/fsix/_Li-brary/SMM-9859_1ed_en.pdf.
Joslin, R. (2011,Sep). Runway Incursion Aware-ness Systems. Paper presented at the Interna-tional Society of Air Safety Investigaors Sym-posium, Salt Lake City UT.
Leech, N. L., Barrett, K. C., & Morgan, G. A. (2008). SPSS for intermediate statistics: Use and interpretation (3rd ed.). New York: Taylor & Francis.
NASA ASRS (2003, July 14). Runway transgres-sions at non-towered and tower-closed air-ports (Publication 61). Mountain View, CA: Aviation Safety Reporting System.
National Aeronautics and Space Administration [NASA]. (2011). Aviation safety reporting system [ASRS] [Online Database]. Retrieved from http://asrs.arc.nasa.gov
NTSB (n.d.). Most wanted list. Retrieved, from http://www.ntsb.gov/safety/mwl.html
ously and implemented by Haverila, R.B. Earl, and R.N. Earl (2011) and van Bekkum, Williams, and Morris (2011) toward in-depth semantic content analysis. Such research may lead to evidence that RI events are rated artificially low in severity as a result of incomplete understanding of the dynamic components of each incident.
References
Aviation Safety Reporting System. (2003). Run-way transgressions at non-towered and tower-closed airports. (Structured Callback Study No. NASA ASRS Publication 61). California: Author.
Aviation Safety Reporting System. (2011). Re-quired navigation performance (RNP) related incidents. Search Request No. 7030, July 12, 2011. Washington, DC: National Transporta-tion Safety Board Docket DCA011IA047.
Creswell, J. W., & Plano Clark, V. L. (2011). De-signing and conducting mixed methods re-search (2nd ed.). Los Angeles, CA: SAGE Publications.
EUROCONTROL (n.d.). Runway safety. Retrieved from http://www.eurocontrol.int/runwaysafety/public/subsite_homepage/homepage.html
EUROCONTROL (2011, April). European action plan for the prevention of runway incursions: Edition 2.0. Author.
FAA (2007). Call to action. Retrieved September 10, 2011, from http://www.oig.dot.gov/sites/ dot/files/WEB%20FILE_FAA%20Call%20to%20Action.pdf

34 |
Appendix A
FAA/ICAO Runway Incursion Taxonomy for Severity
A A serious incident in which a collision was narrowly avoided
B
An incident in which separation de-creases and there is a significant poten-tial for collision, which may result in a time critical corrective/evasive response to avoid a collision.
CAn incident characterized by ample time and/or distance to avoid a colli-sion.
D
Incident that meets the definition of runway incursion such as incorrect presence of a single vehicle/person/air-craft on the protected area of a surface designated for the landing and take-off of aircraft but with no immediate safety consequences.
NotDefined
(FAA non-conflict surface incidents include more than just ICAO class "D" events)
EInsufficient information inconclusive or conflicting evidence precludes se-verity assessment.
NTSB (1991, June). Aircraft accident report (NTSB/AAR-91/05). Washington, DC: Au-thor.
Osborne, J. W. (1994). Some similarities and dif-ferences among phenomenological and other methods of psychological qualitative research. Canadian Psychology, 35(2), 167-189.
Rankin II, W. B. (2008). Runway incursions: An industry examination of FAA initiatives and objectives. International Journal of Applied Aviation Studies, 8(2), 225-240.
Tarrel, R. J. (1985, April 1). Human factors as-sociated with runway transgressions (Publica-tion 32). Mountain View, CA: Aviation Safety Reporting System Office.
Teddlie, C., & Tashakkori, A. (2009). Founda-tions of mixed methods research: Integrating quantitative and qualitative approaches in the social and behavioral sciences. Los Angeles, CA: SAGE Publications.
van Bekkum, J. E., Williams, J. M., & Morris, P. G. (2011). Employees' perceptions of cycle commuting: A qualitative study. Health Edu-cation, 111(3), 198-215.
Mixed Method Approach to Runway Incursion Rating

International Journal of Applied Aviation Studies | 35
Appendix B
Runway Incursion Severity Classification (RISC) 4.2

36 |
International Journal of Applied Aviation Studies | 37
Personality and Motivational Needs in Indian Military
PilotsCatherine Joseph and Rohit Ramesh Kochhar
Department of Aviation PsychologyInstitute of Aerospace MedicineIndian Air Force, Bangalore 560017, India
Abstract
Research on cultural differences provides a different aspect of the attributes in pilots that might affect job performance. Basic attributes of personality and motivation are of importance for military aviators to maintain optimal personal ef-fectiveness, flying proficiency and safety in avia-tion. Ninety military pilots were assessed on the Edwards Personal Preference Schedule (EPPS), and the Revised Neuroticism Extraversion and Openness Personality Inventory (NEO-PI-R). The results of this study showed that Indian aircrew were lower on achievement, dominance, change and heterosexuality when compared to American aircrew. They were significantly higher on other needs such as affiliation, deference, order, suc-corance, abasement and nurturance. The results on the NEO-PI-R showed that the group was signifi-cantly higher on neuroticism and significantly low-er on extraversion and conscientiousness. These cross cultural differences can be attributed to the collectivistic nature of Indian culture as opposed to the individualistic nature of American culture. The findings imply that cultural factors are likely to influence personality and motivation and that this issue needs to be taken into account during aircrew selection, training and clinical evaluation.
Personality And Motivational Needs In Indian Military Pilots
The aviation scenario encompasses many de-manding and challenging situations in the air and/or on the ground. The personality and motivation of the aviator are two characteristics which are likely to have their impact during demanding situ-ations. Hence knowledge about pilot’s personality and motivation and their influence on flying perfor-mance has an important bearing on flight safety.
Previous studies of personality in pilots can be divided into two spheres of research: those that deal with occupational issues and the others which deal with clinical issues. Occupational issues initially concentrated on areas related to selection and train-ing. More recently Boyd, Patterson & Thompson (2005) studied if personality testing prior to flight training could identify measurable differences be-tween pilots who eventually fly fighter and non-fighter military aircraft. Significant differences between the scores of pilots assigned to fly airlift/tankers and fighter pilots were found for the NEO domains of Agreeableness and Conscientiousness. Fighter pilots had lower levels of Agreeableness and higher levels of Conscientiousness. However, the authors found that homogeneity of scores pre-vented any practical application.
A number of meta-analyses have been conduct-ed to estimate the relationship between personality and flying training criteria (Hunter & Burke, 1994;
Return to Table of Contents

38 |
when they compared U.S. Air Force (USAF) 1,301 student pilots against the general popula-tion using the normative scores of the NEO-PI-R. When compared to the norms of the NEO-PI-R, the sample of USAF student pilots were most el-evated on extraversion and openness (to new ex-periences and ideas) and lower on agreeableness (ability to get along with others). Another study by Barto, Chapelle, King, Ree & Teachout (2011) on 12,702 USAF pilot trainees found that compared to the general population, pilots scored lower on Neuroticism and Agreeableness and higher on Ex-traversion, Openness to Experience, and Consci-entiousness.
The FFM was also found to be clinically rel-evant in assessing aeronautical adaptability and some studies have outlined the aeronautically non-adaptable traits that are incompatible with aviation (Christen & Moore, 1998; Ellis, Moore & Dolgin, 2001). Campbell, Moore, Poythress & Kennedy (2009) used the FFM to determine whether or not a sample of clinically- referred military aviators exhibited commonly occurring personality clus-ters. The NEO-PI-R was used to evaluate 956 clinically- referred U.S. Naval aviators and flight officers on five domains. A two-cluster model pro-vided the best fit to the data. MANOVA indicated significant differences between the two cluster groups with respect to four of the five factors (N, E, A, and C). The greatest differences were for N and E, with the smaller group (Group 1, N= 291) being significantly more neurotic and less extro-verted than Group 2 (N= 665). Elevated neuroti-cism and depressed extraversion were the defining traits of the personality cluster less suited for avia-tion duty (Group 1). Results support assessment of neuroticism and extraversion during clinical mental health evaluations related to military avia-tion duty.
Previous research on motivation has used Mur-ray’s psychogenic need theory and McClelland’s trichotomy of needs as a theoretical base. The social motives according to them were of three types; that is, need for achievement, need for affil-iation and need for power (Gordon, 1998). There are a number of studies on aviators, that use the
Martinussen, 1996). More recently, Campbell, Castaneda, and Pulos (2010) performed a meta-analysis on 26 studies examining the effects of personality as a predictor of pilots’ performance in aviation training. They found two personality domains (Neuroticism and Extraversion) and one facet of Neuroticism (Anxiety) to have an impact on training success; indicating that emotionally stable, extroverted individuals would be better suited to undergo the stress of aviation training.
Occupational issues also involve studies that suggest that personality interacts with flying per-formance. A study conducted in USAF on 100 pi-lots using the “Big Five” model of personality and a multi-component model of pilots combat perfor-mance rated 60 traits for effective performance on dimensions such as flying skills and crew manage-ment. The personality trait of conscientiousness was agreed to by all, as the most important deter-minant of performance on all dimensions (Siem & Murray, 1994).
Personality could also be one of the many fac-tors, which contributes to hazardous thought pat-terns and unsafe behaviour. Interpersonal relation-ships and individual contribution to teamwork are important aspects of personality manifested in the crew resource management model. Threat and er-ror safety models also emphasize the identification and subsequent intervention of unsafe pilot behav-ior, which in part may stem from the intrinsic per-sonality and motivation characteristics of aircrew. King, Orme, and Retzlaff (2001) found that pilots with higher levels of NEO PI-R Conscientious-ness facets of Competence and Dutifulness were at an increased risk of pilot-error mishaps or in-cidents.
In the clinical realm there have been some im-portant studies that have assessed personality, us-ing the five factor model (FFM). Two studies have compared results with general population norms and recommend that separate norms on aviator populations need to be used when clinically as-sessing aircrew. This is because of differences in descriptive statistics. Callister, King, Retzlaff, and Marsh (1997) conducted an empirical inves-tigation of personality types in military aviation
Personality and Motivational Needs in Indian Military Pilots

International Journal of Applied Aviation Studies | 39
differing cultures on personality and motivation. Firstly, cross-cultural differences can exist, even when cultural equivalence is found within the Big Five factor structure. Triandis and Suh (2002) postulated that personality may reflect both uni-versally and culturally specific aspects. In support of this, studies suggest that personality dimen-sions express themselves differently in different contexts, and differences between Americans and Asians have been observed on the five personal-ity domains (Yang, 1986; McCrae, Yik, Trapnell, Bond, and Paulhus, 1998; Mastor, Jin, & Cooper, 2000; Eap, DeGarmo, Kawakami, Hara, Hall, & Teten, 2008). This suggests that cultural context may also be associated with personality differenc-es in Indian as compared to American aircrew.
Secondly, aviation environment and personnel can be specifically influenced by cultural context. For instance, there has been much discussion on the role of culture on CRM and aviation mishaps (Merritt & Maurino, 2004) and one of the reasons could be because of the influence of organization-al style of management in Eastern countries (Li, Harris & Chen, 2007). Thirdly, previous prelimi-nary research from our laboratory indicates the possibility of cultural variations in Indian military pilots on characteristics such as achievement, af-filiation and locus of control (Joseph, Thomas & Roopa, 2005; Joseph & Ganesh, 2006).
The Indian and American cultures have been found to differ in three out of five cultural charac-teristics; Individualism, Power Distance and Long Term Orientation (Hofstede, 2001). The dimen-sion of Individualism is the extent that individu-als assume an identity beyond a group. The Power Distance Index identifies the extent that different members of a group see inequality versus equal-ity in a power struggle. Long-Term Orientation measures values in terms of values of the future as opposed to values of the present. These cultural characteristics have been known to influence per-sonality and motivation (Triandis & Suh, 2002). Cultural differences in personality and motivation could have an enormous bearing and implication for Indian aircrew, especially in areas of pilot se-lection and training, occupational issues like fly-
EPPS to measure need for achievement and affilia-tion. The EPPS has shown to be a relatively robust instrument for differentiating among groups of dif-ferent occupations and between successful and un-successful workers in a given occupation.
Using EPPS, studies suggest that both fighter pilots and pilot trainees have several personality characteristics that differ from male members of the general community (Ashman & Telfer, 1983; Fine & Hartman,1968; Fry & Reinhardt, 1969; Novello & Yousseff, 1974). It was seen that pilot groups were significantly higher on five factors of achievement, exhibition, dominance, change and heterosexuality. They were significantly lower on seven factors of deference, order, affiliation, suc-corance, abasement, nurturance and endurance. The jet pilots were significantly higher on aggression and consistency and lower on autonomy than the U.S. adult male norms. The difference was attribut-ed to the selection and training in military aviation that has heightened aggression and consistency and depressed autonomy (Novello & Yousseff, 1974).
The need for achievement has been measured in two different studies on pilots who were outstand-ing. Successful or “high achiever” jet pilots differed significantly from the normative group in that they expressed a greater need for flying achievement (Fry & Reinhardt, 1969). One study on 105 fighter pilots who were selected from the upper 10% of their peer group found that the outstanding jet avia-tors were desirous of success and scored high on achievement. They kept an emotional distance and isolated themselves from deep interpersonal rela-tionships. They were highly preferential of being independent, autonomous and focused on external events (Reinhardt, 1970).
Almost all research done on aircrew using the NEO-PI-R and the EPPS has been carried out in Western countries and comparatively much less research has been done in Eastern countries such as India. The question arises whether aircrew per-sonality and motivation concepts that have been developed in the West can be merely duplicated and applied cross-culturally. There are three main reasons why one should look into the effects of

40 |
ing performance and flight safety and clinical is-sues such as in aircrew evaluation.
Therefore, this study was carried out to observe whether this group of Indian military pilots shares similar basic personality and motivational charac-teristics with Western pilots. It was hypothesized that Indian pilots would differ in some ways from their Western counterparts. In line with previous research Indian pilots were expected to be lower in achievement, dominance, extraversion and con-scientiousness and higher on affiliation and neu-roticism than American pilots.
Personality and Motivational Needs in Indian Military Pilots
Method
Subjects
Ninety male aircrew from the three Services (Indian Army, Navy & predominantly from Air Force) were selected for the study. The age group was restricted to between 20-42 years for this study. Of the three groups, 30 were pilots flying fighters, 30 flying helicopters and 30 pilots grounded due to medical reasons. The grounded pilots were from different streams and included both temporary and permanently medically unfit pilots (12-fighters, 13-Helicopters & 5-Transports). The demographic
Table 1
Demographic characteristics of the pilots in the three groups.
Demographic
CharacteristicsGroups Mean SD
Age in years
Fighter 28.3 4.15
Helicopter 33.37 4. 17
Medically unfit 30.20 3.04
Service in years
Fighter 6.13 4.37
Helicopter 11.53 4.58
Medically unfit 8.30 2.98
Total flying hours
Fighter 884.67 765.95
Helicopter 1150.83 720.26
Medically unfit 1011.67 752.51
Flying hours on type
Fighter 211.13 220.60
Helicopter 405.23 329.60
Medically unfit 292.62 235.65

International Journal of Applied Aviation Studies | 41
characteristics of the pilots in this study are given in the Table 1. The mean age of all the pilots was 30.62 years with a SD of 4.33. The minimum age of the pilots was 24 and the maximum was 42 years. The number of years of education of all 90 pilots was 15 years.
Materials and Procedure
The subjects volunteered to participate in the study. After establishing a good rapport, the need for the study was explained to the individual and a demographic inventory was filled in using a struc-tured interview. The subjects were given necessary instructions before starting the tests. Following this the NEO-PI-R and EPPS were administered and scored manually according to the directions given in the manuals (Costa & McCrae, 1992; Edwards, 1959).
The NEO PI-R is a concise measure of five main domains of personality: neuroticism, extra-version, openness, agreeableness and conscien-tiousness. Each domain has six facets and therefore there are a total of 30 facet scores. The question-naire has 240 statements, to be answered with re-sponses from “strongly agree”, “agree”, “neutral”, “disagree” and “strongly disagree”. The reliability of the internal consistencies for the individual facet scales range from 0.56 to 0.81 in self reports. The 48 item domain scale has correspondingly larger coefficient alphas which range from 0.86 to 0.95. With congruence coefficients between contrasting groups ranging from 0.91 to 0.99, the test shows factorial validity across gender, race and age groups (Costa & McCrae, 1992).
EPPS provides measures of Murray’s manifest needs including motivational needs of achieve-ment, affiliation and dominance. It also provides a measure of test consistency and profile stability. There are 225 statements which are to be answered in such a way that a “yes” response indicates that the subject believes the statement is characteris-tic of himself and a “no” response indicates that it is not characteristic. Social desirability is mini-mized. The 15 needs measured are achievement, deference, order, exhibition, autonomy, affiliation,
intraception, succorance, dominance, abasement, nurturance, change, endurance, heterosexuality and aggression. Operational definitions of each need are provided in the test manual. The test has high reliability and validity; the split half re-liability correlations for all needs vary from 0.60 to 0.87 and the test retest reliability from 0.74 to 0.88. Inter correlations between variables are low (Edwards, 1959). Data of variables for 90 subjects were entered into the Statistical Package for Social Sciences (SPSS) worksheet on computer and were statistically analyzed.
Results
The descriptive data showed that in general the pilots were in the average range of the adult popula-tion norms on the variables of EPPS, and NEO-PI-R, except that the pilots were higher on dominance on the EPPS scale. They were not found to be high on their need for achievement and affiliation.
The descriptive EPPS data was also compared to the previous published data of aircrew as shown in Table 2 (next page). The results of the present study showed that the group was lower on achieve-ment and higher on affiliation. They were signifi-cantly higher on other needs such as deference, or-der, succorance, abasement and nurturance when compared to previous studies. They were found to be significantly lower on dominance, change and heterosexuality.
The descriptive NEO-PI-R domain data was also compared to the previous published data of aircrew as shown in Table 3 (next page). Results of the study showed that the current group was significantly higher on neuroticism and lower on extraversion and conscientousness. On the agree-ableness factor the current group was significantly lower than the Campbell et al. data and higher than the Callister et al. data.
The descriptive NEO-PI-R facets data were also compared to the previous published data of aircrew as shown in Table 4 (page 59). Results of the pres-ent study showed that the current group was signif-
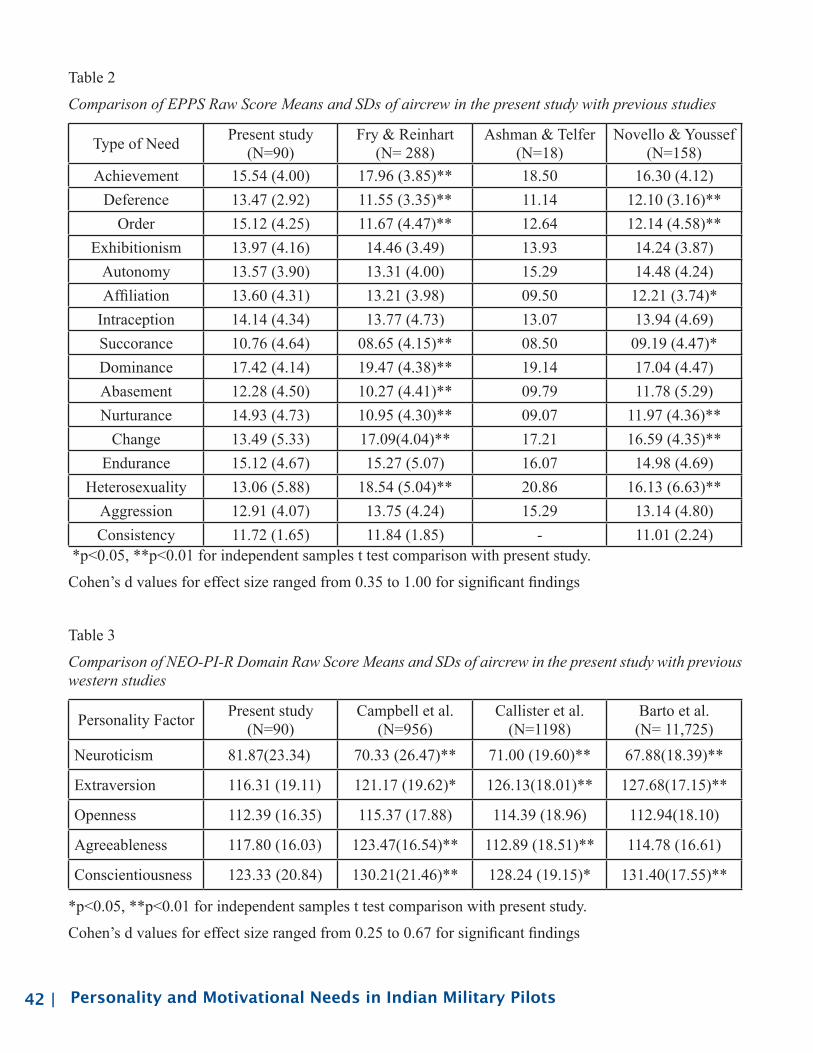
42 | Personality and Motivational Needs in Indian Military Pilots
Table 2
Comparison of EPPS Raw Score Means and SDs of aircrew in the present study with previous studies
Type of Need Present study (N=90)
Fry & Reinhart (N= 288)
Ashman & Telfer (N=18)
Novello & Youssef (N=158)
Achievement 15.54 (4.00) 17.96 (3.85)** 18.50 16.30 (4.12)Deference 13.47 (2.92) 11.55 (3.35)** 11.14 12.10 (3.16)**
Order 15.12 (4.25) 11.67 (4.47)** 12.64 12.14 (4.58)**Exhibitionism 13.97 (4.16) 14.46 (3.49) 13.93 14.24 (3.87)
Autonomy 13.57 (3.90) 13.31 (4.00) 15.29 14.48 (4.24)Affiliation 13.60 (4.31) 13.21 (3.98) 09.50 12.21 (3.74)*
Intraception 14.14 (4.34) 13.77 (4.73) 13.07 13.94 (4.69)Succorance 10.76 (4.64) 08.65 (4.15)** 08.50 09.19 (4.47)*Dominance 17.42 (4.14) 19.47 (4.38)** 19.14 17.04 (4.47)Abasement 12.28 (4.50) 10.27 (4.41)** 09.79 11.78 (5.29)Nurturance 14.93 (4.73) 10.95 (4.30)** 09.07 11.97 (4.36)**
Change 13.49 (5.33) 17.09(4.04)** 17.21 16.59 (4.35)**Endurance 15.12 (4.67) 15.27 (5.07) 16.07 14.98 (4.69)
Heterosexuality 13.06 (5.88) 18.54 (5.04)** 20.86 16.13 (6.63)**Aggression 12.91 (4.07) 13.75 (4.24) 15.29 13.14 (4.80)Consistency 11.72 (1.65) 11.84 (1.85) - 11.01 (2.24)
*p<0.05, **p<0.01 for independent samples t test comparison with present study.
Cohen’s d values for effect size ranged from 0.35 to 1.00 for significant findings
Table 3
Comparison of NEO-PI-R Domain Raw Score Means and SDs of aircrew in the present study with previous western studies
Personality Factor Present study (N=90)
Campbell et al. (N=956)
Callister et al. (N=1198)
Barto et al.(N= 11,725)
Neuroticism 81.87(23.34) 70.33 (26.47)** 71.00 (19.60)** 67.88(18.39)**
Extraversion 116.31 (19.11) 121.17 (19.62)* 126.13(18.01)** 127.68(17.15)**
Openness 112.39 (16.35) 115.37 (17.88) 114.39 (18.96) 112.94(18.10)
Agreeableness 117.80 (16.03) 123.47(16.54)** 112.89 (18.51)** 114.78 (16.61)
Conscientiousness 123.33 (20.84) 130.21(21.46)** 128.24 (19.15)* 131.40(17.55)**
*p<0.05, **p<0.01 for independent samples t test comparison with present study.
Cohen’s d values for effect size ranged from 0.25 to 0.67 for significant findings

International Journal of Applied Aviation Studies | 43
Table 4
Comparison of NEO-PI-R Facet Raw Score Means and SDs of aircrew in the present study with previous western studies
Personality Facet Present study (N=90) Callister et al. (N=1198) Barto et al. (N= 11,725)N1 Anxiety 14.42(5.14) 12.75 (4.69)** 12.19 (4.51)**N2 Angry Hostility 13.48(5.35) 12.39 (4.84) 11.78 (4.44)**N3 Depression 13.63(5.17) 10.82 (4.70)** 9.97 (4.30)**N4 Self consciousness 15.67 (4.10) 12.99 (4.54)** 12.58 (4.25)**N5 Impulsiveness 15.53 (4.07) 15.11 (4.65) 14.69 (4.44)*N6 Vulnerability 09.38(5.12) 06.91 (3.53)** 06.66 (3.25)**E1 Warmth 22.16 (4.13) 22.77 (4.13) 23.11 (3.88)*E2 Gregariousness 18.26 (4.97) 18.32 (5.25) 19.01 (5.01)E3 Assertiveness 17.52 (4.39) 19.80 (4.47)** 20.21 (4.37)**E4 Activity 17.96 (3.94) 20.81 (3.85)** 20.69 (3.67)**E5 Excitement seeking 19.36 (4.43) 22.92 (3.82)** 23.19 (3.66)**E6 Positive emotions 22.41 (4.25) 21.48 (4.54) 21.46 (4.36)*O1 Fantasy 18.42 (11.22) 19.15 (5.17) 18.23 (4.97)O2 Aesthetics 19.14 (4.79) 17.00 (6.04)** 16.14 (5.68)**O3 Feelings 20.02 (4.74) 20.93 (4.51) 20.66 (4.23)O4 Actions 16.29 (3.80) 16.52 (4.02) 16.77 (3.97)O5 Ideas 19.70 (4.55) 21.88 (5.33)** 21.94 (5.22)**O6 Values 19.94 (3.84) 18.89 (4.79)* 19.20 (4.49)A1 Trust 21.42 (4.48) 20.05 (4.83)* 20.39 (4.42)*A2 Straightforwardness 19.90 (4.94) 18.71 (4.71)* 19.10 (4.41)A3 Altruism 23.00 (3.83) 23.26 (3.87) 23.72 (3.54)A4 Compliance 15.64 (4.62) 16.19 (4.42) 16.18 (4.17)A5 Modesty 16.74 (3.62) 16.78 (4.88) 16.84 (4.69)A6 Tender mindedness 21.09 (3.26) 17.88 (4.15)** 18.55 (3.72)**C1 Competence 21.83 (4.05) 24.06 (3.48)** 24.48 (3.28)**C2 Order 19.93 (4.72) 18.76 (4.67)* 19.08 (4.30)C3 Dutifulness 22.53 (4.39) 23.72 (3.74)* 24.19 (3.56)**C4 Achievement striv-ing
20.02 (4.69) 22.52 (4.37)** 23.07 (3.85)**
C5 Self discipline 20.79 (5.27) 21.71(4.56) 22.69 (4.13)**C6 Deliberation 18.16 (4.79) 17.44 (4.30) 17.89 (4.17)
*p<0.05, **p<0.01 for independent samples t test comparison with present study
Cohen’s d values for effect size ranged from 0.23 to 0.94 for significant findings
44 | Personality and Motivational Needs in Indian Military Pilots
icantly higher compared to both the previous stud-ies on neuroticism facets of anxiety, depression and vulnerability. They were also significantly higher than one of the studies on the other facets of angry hostility and impulsiveness.
The current group was significantly lower com-pared to both the previous studies on extraversion facets of assertiveness, activity, excitement seeking and higher on positive emotions. They were also significantly lower than one of the studies on the other facet of warmth. Though the domain com-parison of openness did not indicate an overall sig-nificant difference, facets of this domain showed this pilot group to be higher on aesthetics and val-ues and lower on ideas. On the agreeableness do-main Indian pilots were higher on facets of trust, straightforwardness and tender mindedness. As can be seen from Table 4 the facets of conscientious-ness such as competence, dutifulness, achievement striving and self discipline were all significantly lower in Indian pilots.
Discussion
On the variables of the NEO-PI-R the Indian military pilots were seen to be in the average range of the adult U.S. population norms. Previous re-search indicated personality differences between general population Americans and Asians (Yang, 1986; McCrae et al., 1998; Mastor et al., 2000; Eap et al., 2008). In line with these findings, the results of the present study also showed that Indian pilots, when compared to Western pilots were significant-ly higher on neuroticism and lower on extraversion and conscientiousness. Consistent with the findings of McCrae, et al. (1998) and Eap et al. (2008), In-dian aircrew were higher on neuroticism and all its facets; that is, anxiety, angry hostility, depression, self consciousness, impulsiveness and vulnerability when compared to Western pilots. However, when compared to the Indian male population, they had lower mean scores on neuroticism and four of its facets (Lodhi, Deo & Belhekar, 2002). This there-fore further substantiates the role of culture influ-encing neuroticism domain scores in Indians on
the whole. The work on cross cultural differences showed the Indian society to be less individualis-tic and more collectivistic. It is known that people from collectivistic cultures express their emotions more and also tend to report more negative emo-tions (Triandis & Suh, 2002). More than emotions, social norms (approval from others) predict life satisfaction for collectivists.
Indian pilots were found to be lower on extra-version which is consistent with previous studies (Yang, 1986; Mastor et al., 2000; McCrae et al., 1998; McCrae & Terracciano, 2005; Eap et al., 2008) that found that European Americans score higher on extraversion than people of Asian de-scent. This finding has been attributed to the indi-vidualistic culture of Americans as opposed to the collectivistic culture of Asians. However, when In-dian pilots are compared to the Indian male popula-tion, they had higher mean scores on extraversion and all six of its facets (Lodhi, Deo & Belhekar, 2002).
There are a number of studies that have shown that pilots who are high achievers to be high on the conscientiousness factor (Fitzgibbons, Davis & Schutte, 2004). This study does not show this simi-larity probably because achievement is an aspect of conscientiousness, which is seen to be lower in Indian pilots. This finding is consistent with the results of the Eap et al. (2008), who found con-scientiousness to be lower in those of Asian ori-gin. However, once again, when Indian pilots are compared to the Indian male population they had higher mean scores on conscientiousness and five of its facets (Lodhi, Deo & Belhekar, 2002). These cultural differences highlight the importance of context in understanding personality differences in pilots.
The extensive research on U.S. military pilots has found the aviators to be consistently higher on the need for achievement compared to the av-erage U.S. adult population norms (Ashman & Telfer, 1983; Novello & Yousseff, 1974; Fine & Hartman,1968; Fry & Reinhardt, 1969, Reinhardt, 1970; Retzlaff & Gibertini, 1987).
The results of this study indicate certain differ-ences in the motivational needs of Indian military

International Journal of Applied Aviation Studies | 45
pilot. The results of this study are not in conso-nance with U.S. studies as Indian military pilots were found to be in the average range using a simi-lar comparison. Indian military pilots were also seen to be in the average range for the need for affiliation. This result does not corroborate with other studies, which show the aviators to be low on affiliation (Ashman & Telfer, 1983; Fine & Hartman,1968; Fry & Reinhardt, 1969; Novello & Yousseff, 1974). In another Indian study it was seen that almost the same number of pilots ranked achievement and affiliation in the first position (Jo-seph, Thomas & Roopa, 2005).
Indian military aviator is high on the variable of dominance when compared to average U.S. population norms. This is in line with the number of studies that show military pilots to be high on dominance (Ashman & Telfer, 1983; Fine & Hart-man,1968; Fry & Reinhardt, 1969; Novello & Yousseff, 1974; Reinhardt, 1970; Retzlaff & Gib-ertini, 1987). Such characteristics as dominance are part of military value system and are adaptive traits given the nature of their missions. The need for power is a need to have control over one’s own work or the work of others. Persons who insist on autonomy in their work or seek supervisor respon-sibilities have a need for power (Gordon, 1998). Indian military pilot maybe high on dominance because it is a requirement in the defense services with its hierarchy. There is need to lead soldiers, be an officer, and to set an example for the rest. Even though Indians are high on dominance compared to U.S. general population, when absolute mean values are compared, Indian pilots scored lower on dominance than Western counterparts.
Indian pilots were also significantly higher on other needs such as deference, succorance, abase-ment and nurturance when compared to previous studies on aircrew. They were found to be signifi-cantly lower on change and heterosexuality. These needs are also partly determined by the collectiv-istic culture. Within collectivistic cultures, Indian culture is vertical as opposed to horizontal (Hofst-ede, 1980, 2001; Markus & Kitayama, 1991; Tri-andis & Suh 2002; Triandis, 1995). Vertical col-lectivistic cultures are traditionalist and emphasize
in-group cohesion, respect for in-group norms, and the directives of authorities. It is correlated with the tendency to be submissive to authority and to endorse conventionalism (Triandis & Suh, 2002). When compared to Indian society, the importance of achievement and individualism is much higher in Western culture. Indian society, on the other hand, places more emphasis on affiliation, deference, suc-corance and nurturance. Indians see helping an in-group member as duty-based, whereas Americans see it more as a matter of personal choice. Ameri-cans are less likely to feel responsible compared to Indians for helping siblings or colleagues whom they personally do not like (Triandis & Suh, 2002).This may explain why Indian pilots are lower on their need for achievement, dominance, change and heterosexuality and higher than the Western pilots on their need for affiliation, deference, suc-corance and nurturance. With the present state of knowledge it is not possible to assess Indian pilots’ standing with respect to Indian general population because norms on the EPPS have not been devel-oped.
In conclusion, the Indian military pilots’ de-scriptive EPPS and NEO-PI-R data was compared to the previous published data of Western aircrew. The results of present study showed that the group was lower on achievement and higher on affilia-tion. They were significantly higher on other needs such as deference, order, succorance, abasement and nurturance. They were also found to be sig-nificantly lower on dominance, change and het-erosexuality when compared to previous Western studies. The results on the NEO-PI-R showed that the group was significantly higher on neuroticism and lower on extraversion and conscientiousness. These cross cultural differences were attributed to the collectivistic nature of Indian culture which has influenced both the personality and need structure.
This study could be a basis for further research, leading to a better understanding of the motiva-tional needs and basic personality components of Indian military pilots in selection, training and medical evaluation. These results call for the de-velopment of indigenous standards for aircrew se-lection so that optimal personality and motivational

46 |
able” dispositions in the U.S. Navy. Avia-tion, Space and Environmental Medicine, 69, 1071-1075.
Costa, P.T., McCrae, R.R . (1992).The Revised NEO Personality Inventory Manual . Odessa, FL : Psychological Assessment Resources.
Eap, S., DeGarmo, D. S., Kawakami, A., Hara, S.N., Hall, G.C.N. & Teten, A.L. (2008). Culture and Personality Among European American and Asian American Men. Journal of Cross Cultural Psychology, 39, 630–643.
Edwards, A.L. (1959). Manual for the Edwards Personal Preference Schedule. New York, Psychological Corporation.
Ellis, S., Moore, J., and Dolgin, D. (2001). Aviator personality assessment: Part I- Aeronautical adaptability. AsMA 2001 meeting abstracts 118, Aviation, Space and Environmental Medicine,72, 254.
Fine, P.M. & Hartman, B.O. (1968). Psychiat-ric strengths and weaknesses of typical Air Force pilots. Report No SAM-TR-68-121. Brooks Air Force Base Texas: USAF School of Aerospace Medicine.
Fitzgibbons, A., Davis, D. & Schutte, P. C. (2004). Pilot Personality Profile using the NEO-PI-R. Report No NASA/TM-2004-213237. Na-tional Aeronautics and Space Adminis-tration. Hampton, Virginia: Langley Research Centre.
Fry, G.E. & Reinhardt, R.F. (1969). Personality characteristics of jet pilots as measured by the Edwards Personal Preference Schedule. Aerospace Medicine, 40, 484-86.
Gordon, J.R. (1998). Diagnosing Individual Be-haviour. A diagnostic approach to organi-zational behaviour. 3rd ed. USA: Library of congress cataloging in Publication Data;. p. 54-89,130-50.
Hofstede, G. (1980).Culture’s consequences, Bev-erly Hills CA: Sage.
Hofstede, G. (2001). Culture’s consequences: Comparing values, behaviors, institutions and organizations across nations. 2nd ed. Thousand Oaks, CA: Sage.
Hunter, D.R., Burke, E.F. (1994). Predicting air-craft pilot training success: A meta-analysis of published research. International Journal of Aviation Psychology, 4, 297-313.
Joseph, C. & Ganesh, A. (2006). Aviation safety locus of control in Indian aviators. Indian Journal of Aerospace Medicine, 50, 14-21.
Joseph, C., Thomas, B. & Roopa, C.G. (2005). Motivational work needs and personality
characteristics (with respect to the general Indian population) may be selected out and selected in. Military aviation training in India has to take into consideration these aspects of personality that can influence thought patterns and safety attitudes. This could call for more intense continuity train-ing during different phases of military pilots’ ca-reer. Lastly, the outcome of this study implies that pilot normative data needs to also be culture specific. Such norms should be used when clini-cally assessing a pilot in conjunction with general population norms so that reliable and valid judg-ments are made. There is an ultimate requirement of having highly motivated aviators with best fly-ing abilities and mission safety attitudes in the In-dian military.
References
Ashman, A. & Telfer, R. (1983). Personality pro-files of pilots. Aviation, Space and Environ-mental Medicine, 54, 940-43.
Barto, E., Chapelle, W., King, R.E., Ree, M. & Teachout, M.S. (2011). The NEO PI-R as a Premorbid Baseline Measure. Report No. AFRL-SA-WP-TR-2011-0001. USAF School of Aerospace Medicine, Brooks City Base, Texas.
Boyd, J.E., Patterson J.C., Thompson, B.T. (2005). Psychological test profiles of USAF pilots before training vs. type aircraft flown. Avia-tion, Space and Environmental Medicine, 76, 463– 468.
Callister, J.D., King, R.E., Retzlaff, P.D., Marsh, R.W. (1997). Using the NEO-PI-R to Assess the Personality of US Air Force Pilots. Re-port No. ALJAO-TR- 1997-0097. Armstrong Laboratory, Brooks AFB, Texas.
Campbell, J.S., Castaneda, M., Pulos, S. (2010). Meta-analysis of personality assessments as predictors of military aviation training suc-cess. The International Journal of Aviation Psychology, 20, 92-109.
Campbell, J.S., Moore, J.L., Poythress, N.G., Ken-nedy, C.H. (2009). Personality traits in clini-cally referred aviators: two clusters related to occupational suitability. Aviation, Space and Environmental Medicine, 80,1049-1054.
Christen, B.R., Moore, J.L. (1998). A descrip-tive analysis of “not aeronautically adapt-
Personality and Motivational Needs in Indian Military Pilots

International Journal of Applied Aviation Studies | 47
Siem, F.M. & Murray, M.W. (1994). Personality actors affecting pilot combat performance: A preliminary investigation. Aviation Space and Environmental Medicine, 65, section II: A45-47.
Triandis, H.C. & Suh, E.M. (2002). Cultural influ-ences on personality. Annual Review of Psy-chology, 53, 133-160.
Triandis, H.C. (1995). Individualism and collec-tivism. Boulder, CO: Westview.
Yang, K.S. (1986). Chinese personality and its change. In: Bond MH, editor. The psychology of the Chinese people. Oxford, UK: Oxford University Press; pp. 106–170.
factors in aircrew. Indian Journal of Aero-space Medicine, 49 ,48-56.
King, R.E., Orme, D.R., Retzlaff, P.D. (2001). US Air Force Pilot Psychological Baseline Infor-mation Compared to Safety Outcomes, AFSC-TR-2001-0001, Air Force Safety Center, Kirt-land AFB, NM.
Li, W-C., Harris, D. & Chen, A. (2007). Eastern minds in western cockpits: meta-analysis of human factors in mishaps from three nations. Aviation Space and Environmental Medicine, 78, 420-425.
Lodhi, P.H., Deo, S. & Belhekar, V.M. (2002). The five factor model of personality- measure-ment and correlates in the Indian context. In R.R. McCrae & J.Allik (Eds), The five factor model of personality across cultures. New York: Kluwer Academic/Plenum Publishers.
Markus, H.R. & Kitayama, S. (1991). Culture and the self: Implications for cognition, emo-tion and motivation. Psychological Review, 20,568-579.
Martinussen, M. (1996). Psychological measures as predictors of pilot performance: A meta-analysis. International Journal of Aviation Psychology, 6, 1-20.
Mastor, K.A., Jin, P., Cooper, M. (2000). Malay culture and personality. American Behavioral Scientist, 44, 95–111.
McCrae, R.R., Terracciano, A. (2005).Personal-ity profiles of cultures: aggregate personality traits. Journal of Personality and Social Psy-chology, 89, 407–425.
McCrae, R.R., Yik, M.S.M., Trapnell, P.D., Bond, M.H., Paulhus, D.L. (1998). Interpreting per-sonality profiles across cultures: Bilingual, acculturation, and peer rating studies of Chi-nese undergraduates. Journal of Personality and Social Psychology, 74,1041–1065.
Merritt, A. & Maurino, D. (2004). Cross-cultural factors in aviation safety. In: Kaplan, M. (Ed) Advances in human performance and cogni-tive engineering research. San Diego, Elsevier Science, 147-181.
Novello, J.R. & Yousseff, Z.l. (1974) Psycho-so-cial studies in general aviation:1. Personality profile of male pilots. Aviation Space and En-vironmental Medicine, 45,185-188.
Reinhardt, R.F. (1970). The outstanding jet pilot. American Journal of Psychiatry, 127, 732-736.
Retzlaff, P.D. & Gibertini, M. (1987). Air Force pilot personality: Hard data on the right stuff. Multivariate Behavioral Research, 22, 383-389.

48 | Personality and Motivational Needs in Indian Military Pilots
International Journal of Applied Aviation Studies | 49
A Case for Federal Aviation Regulations to Develop
Civil Supersonic Transport Aircraft
Robert Edward Joslin
Embry-Riddle Aeronautical University
Abstract
This report drew upon a variety of government, industry, and academic studies to make conclu-sions and provide recommendations for the codi-fication of Federal Aviation Regulations allowing overland supersonic flight would incentivize indus-try stakeholder development and fielding of civil supersonic transport aircraft. The absence of less restrictive regulations that would permit overland supersonic operations has hindered industry to go beyond technological research and market surveys, into actual production and air carrier operations. The novel phenomenon of a sonic boom that is as-sociated with supersonic flight has elevated regu-lations as the requisite dominant and leading fac-tor. A civil supersonic transport aircraft that has to fly at subsonic speeds overland has proven not economically feasible. However, overland super-sonic flight with unconstrained sonic boom levels is not environmentally acceptable and unfeasible as well. Regulations allowing overland civil super-sonic flight will establish a viable market potential, clarify aircraft design requirements, and unlock the manufacturing and operational implementation of supersonic civil transport aircraft.
A Case for Federal Aviation Regulations to Develop Civil
Supersonic Transport Aircraft
This report drew upon a variety of government, industry, and academic studies to make conclusions and provide recommendations for the codification of Federal Aviation Regulations (FAR) allowing overland supersonic flight would incentivize in-dustry stakeholder development and fielding of civil supersonic transport aircraft into the National Airspace System (NAS). Since the retirement in 2003 of the Concorde1, the first and only opera-tional supersonic civil transport aircraft, industry have been reluctant to fully invest in a produc-tion design of a supersonic aircraft that would be restricted from supersonic flight over land. Con-corde’s prohibition for supersonic flight over land limited its commercial success and was a major contributor to its demise (Maxwell & Dickinson, 1980; Zha, Im, & Espinal, 2010). The absence of less restrictive regulations that would permit over land supersonic operations has hindered industry stakeholders to go beyond technological research
1 The Concorde aircraft was jointly developed and funded by the French and British as the first and only supersonic civil transport aircraft to provide sched-uled air service. The first scheduled transatlantic flight occurred in 1976 and the last flight was in 2003. Air France and British Airways were the only airlines to fly the aircraft (Cathers,1990; Van Teuren, 2005)
Return to Table of Contents

50 |
and market surveys into actual production and air carrier operations.
Factors normally considered by industry in busi-ness cases for investing in any new airplane can be grouped into three categories (a) market potential, (b) technology, and (c) regulations (Henne, 2003). The novel phenomenon of a sonic boom associat-ed with supersonic flight has elevated regulations as the requisite dominant and leading factor (Wel-ge, Nelson, & Bonet, 2010). Regulations allow-ing overland civil supersonic flight are essential to establish a viable market potential, clarify aircraft design requirements, and unlock the manufactur-ing and operational implementation of superson-ic civil transport aircraft (Aronstein & Schueler, 2005). The two assumptions for this report were that the regulatory limitation that prohibits over-land supersonic flight under U.S.C. Title 14 Code of Federal Regulations (CFR) §91.8172 has been rescinded, and that regulations for a prescribed acceptable overland sonic boom level have been established.
Sonic Boom
There are several unique issues associated with supersonic flight, such as high altitude ozone de-pleting emissions of nitric oxides and jet engine noise in the airport environment (Hamel, Folk, Jimenez, & Mavris, 2009). However, the most challenging technological and marketing issue as-sociated with supersonic flight has been the over-land sonic boom (Candel, 2004). A sonic boom is the ground trace of the pressure disturbance creat-ed by the passage of an aircraft moving faster than the speed of sound, typically measured in pounds/square foot (psf) (Supersonic Aerodynamics, 2008; Welge, Nelson, & Bonet, 2010). The char-acteristics of a sonic boom must be understood to
2 No person may operate a civil aircraft for which the maximum operating limit speed exceeds a Mach number of 1, to or from an airport in the United States, unless information available to the flight crew includes flight limitations that ensure that flights entering or leaving the United States will not cause a sonic boom to reach the surface within the United States (Civil Aircraft Sonic Boom, 1963)
determine operationally realistic and environmen-tally acceptable regulatory sonic boom levels that can then be used to set the technological design requirements and work out any business case for market potential (Chudoba et al., 2007).
The presence of a sonic boom during supersonic flight is fundamentally tied to the laws of thermo-dynamics and consists of the initial transition boom as the aircraft passes through Mach 1, followed by the continuous nominal boom in cruise flight. A sonic boom can be controlled through aircraft ge-ometry, aircraft weight, Mach number, altitude, and flight profile. The primary sonic boom char-acteristics controlled by the aforementioned vari-ables are strength (amplitude), lay-down or carpet area, directionality, and persistence of the boom (Aronstein & Schueler, 2005). An aircraft travel-ing at supersonic speed produces shock waves that merge in the near-field and eventually propagate to the ground in the far-field, creating an impulsive change in pressure. The external geometric aircraft design, aircraft weight, and instantaneous flight profile (dive angle, turns, maneuvering, and accel-eration) primarily drive the near-field sonic boom characteristics, which coalesce and propagate to-wards the far-field. Atmospherics, topography, and turbulence drive the far-field characteristics, which determine the geometry and dimensions of the son-ic boom carpet area on the ground.
A sonic boom radiates in all directions, not just downward, and under some atmospheric conditions can bounce off the upper atmosphere and propa-gate a secondary over the top boom a considerable distance downrange of the aircraft to one or more secondary ground impact areas. The sonic boom can also extend well outside the direction of the actual flight path due to winds, temperature gradi-ents, or when a supersonic aircraft performs even a gentle turn. Sonic boom paths curve towards re-gions where the temperature, and thus the speed of sound, is lower and where the wind component is greater (Poling, Robinson, & Sutherland, 1997). The regulatory restriction for overland supersonic flight includes impingement of the aircraft’s sonic boom over land, hence the aircraft may be miles away from actual landfall when it must slow to subsonic speeds. The presence of an over-the-top
Case for FAA Regulations to Develop Supersonic Transport Aircraft

International Journal of Applied Aviation Studies | 51
sonic boom can back up the requirement for sub-sonic speeds even farther away from landfall.
The exterior design of the aircraft (i.e. nose shape, wing thickness, wing sweep, fuselage length) affects the trade-off between sonic boom rise time associated with the rumble sensed by the public, and the absolute overpressure associ-ated with the sharp startling crack sound that is heard. A favorable combination of atmospheric state, flight altitude, and Mach number can exist where a sonic cut-off condition is achieved and the boom bounces (refracts) off a flight level below the aircraft, never hitting the ground. This so-called Mach cut-off speed is the highest speed at which an aircraft can operate in cruise flight without produc-ing booms on the ground. In the standard atmo-sphere this value hovers around Mach 1.15, which is of little marketable value when competing with current subsonic aircraft that operate in excess of Mach 0.9 (Plotkin, 1989; Maglieri & Sothcott, 1990; Henne, 2003). Climb and descent angles increase or decrease Mach cut-off, with boom in-tensities decreasing rapidly with altitude. Conse-quently, flying a climb angle that progressively in-creases with increasing Mach-altitude can further delay the initial transition boom until the aircraft reaches even higher altitudes.
Propagation path and ground zone impact area of the sonic boom vary with atmospheric pressure, temperature, density, humidity, turbulence, and wind (Loubeau & Coulouvrat, 2009). Turbulence and topography may reduce the boom amplitude by randomly redirecting the sonic boom energy. Humidity in clouds may also attenuate or disperse the boom. The variability of global and regional climate changes as well as local weather and tur-bulence are random, hence the ground sonic boom is uncertain and must be predicated on some me-teorological model and certification standards de-termined by sonic boom level regulations.
Technological Design
A successful supersonic transport must be de-signed with the intent of maintaining efficiency in supersonic cruise as well as in subsonic segments
during the take-off and landing phases. Aircraft designers start with the regulatory acceptable sonic boom signature, and factor in the variables of air-craft weight, cruising altitude, and Mach number. The required aircraft geometric shape that will pro-duce the desired sonic boom signature can then be determined. The nose design is a trade-off between aerodynamic drag and sonic boom generation. A blunt nose with a long fuselage minimizes the sonic boom but maximizes the aerodynamic drag, which increases the required engine thrust and fuel con-sumption. A sharp nose with a shorter fuselage has the opposite effect (Aronstein & Schueler, 2005; Candel, 2004). The fuselage volume for fuel, struc-ture, systems, and payload have to be considered as well (See Figure 1).
Figure 1. Conceptual aircraft design with and with-out sonic boom constraint. Adapted from “Two Supersonic Business Aircraft Conceptual Designs with and without sonic boom constraint” by Aron-stein and Schueler, 2005, Journal of Aircraft, 42(3), 775-786.
Regulatory acceptable overland sonic boom lev-els will determine aircraft exterior design by dictat-ing the required nose and fuselage/wing geometry
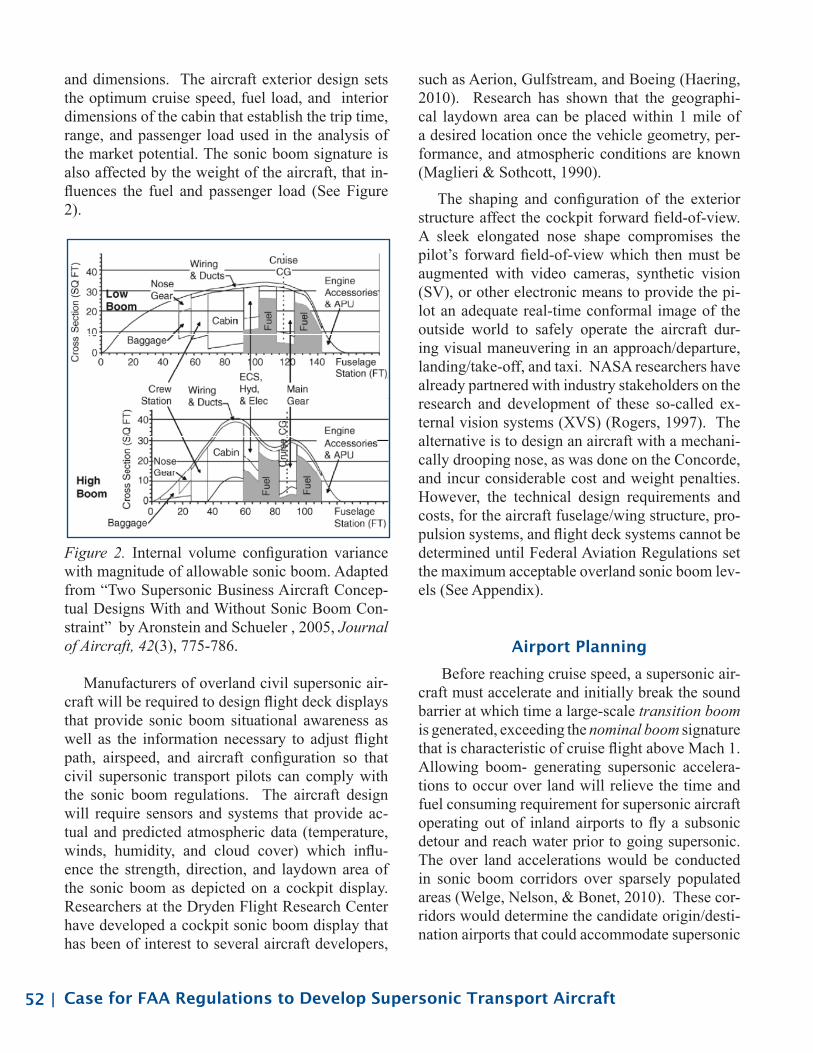
52 |
and dimensions. The aircraft exterior design sets the optimum cruise speed, fuel load, and interior dimensions of the cabin that establish the trip time, range, and passenger load used in the analysis of the market potential. The sonic boom signature is also affected by the weight of the aircraft, that in-fluences the fuel and passenger load (See Figure 2).
Figure 2. Internal volume configuration variance with magnitude of allowable sonic boom. Adapted from “Two Supersonic Business Aircraft Concep-tual Designs With and Without Sonic Boom Con-straint” by Aronstein and Schueler , 2005, Journal of Aircraft, 42(3), 775-786.
Manufacturers of overland civil supersonic air-craft will be required to design flight deck displays that provide sonic boom situational awareness as well as the information necessary to adjust flight path, airspeed, and aircraft configuration so that civil supersonic transport pilots can comply with the sonic boom regulations. The aircraft design will require sensors and systems that provide ac-tual and predicted atmospheric data (temperature, winds, humidity, and cloud cover) which influ-ence the strength, direction, and laydown area of the sonic boom as depicted on a cockpit display. Researchers at the Dryden Flight Research Center have developed a cockpit sonic boom display that has been of interest to several aircraft developers,
such as Aerion, Gulfstream, and Boeing (Haering, 2010). Research has shown that the geographi-cal laydown area can be placed within 1 mile of a desired location once the vehicle geometry, per-formance, and atmospheric conditions are known (Maglieri & Sothcott, 1990).
The shaping and configuration of the exterior structure affect the cockpit forward field-of-view. A sleek elongated nose shape compromises the pilot’s forward field-of-view which then must be augmented with video cameras, synthetic vision (SV), or other electronic means to provide the pi-lot an adequate real-time conformal image of the outside world to safely operate the aircraft dur-ing visual maneuvering in an approach/departure, landing/take-off, and taxi. NASA researchers have already partnered with industry stakeholders on the research and development of these so-called ex-ternal vision systems (XVS) (Rogers, 1997). The alternative is to design an aircraft with a mechani-cally drooping nose, as was done on the Concorde, and incur considerable cost and weight penalties. However, the technical design requirements and costs, for the aircraft fuselage/wing structure, pro-pulsion systems, and flight deck systems cannot be determined until Federal Aviation Regulations set the maximum acceptable overland sonic boom lev-els (See Appendix).
Airport Planning
Before reaching cruise speed, a supersonic air-craft must accelerate and initially break the sound barrier at which time a large-scale transition boom is generated, exceeding the nominal boom signature that is characteristic of cruise flight above Mach 1. Allowing boom- generating supersonic accelera-tions to occur over land will relieve the time and fuel consuming requirement for supersonic aircraft operating out of inland airports to fly a subsonic detour and reach water prior to going supersonic. The over land accelerations would be conducted in sonic boom corridors over sparsely populated areas (Welge, Nelson, & Bonet, 2010). These cor-ridors would determine the candidate origin/desti-nation airports that could accommodate supersonic
Case for FAA Regulations to Develop Supersonic Transport Aircraft
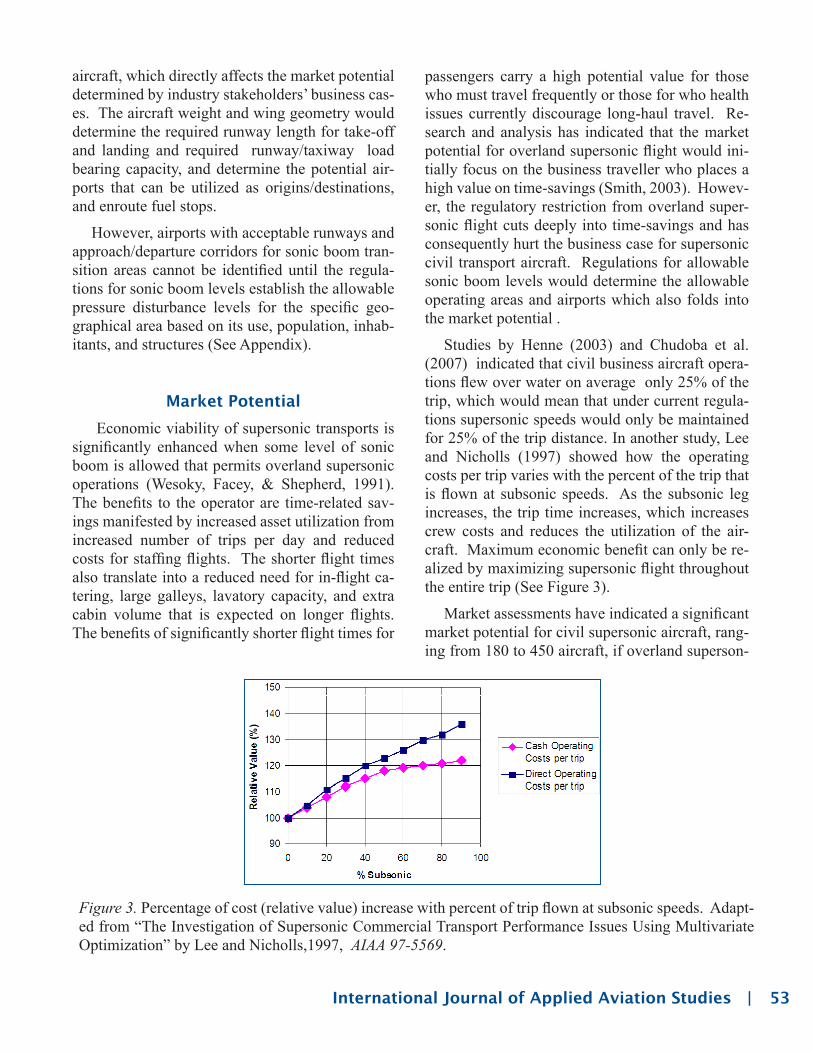
International Journal of Applied Aviation Studies | 53
aircraft, which directly affects the market potential determined by industry stakeholders’ business cas-es. The aircraft weight and wing geometry would determine the required runway length for take-off and landing and required runway/taxiway load bearing capacity, and determine the potential air-ports that can be utilized as origins/destinations, and enroute fuel stops.
However, airports with acceptable runways and approach/departure corridors for sonic boom tran-sition areas cannot be identified until the regula-tions for sonic boom levels establish the allowable pressure disturbance levels for the specific geo-graphical area based on its use, population, inhab-itants, and structures (See Appendix).
Market Potential
Economic viability of supersonic transports is significantly enhanced when some level of sonic boom is allowed that permits overland supersonic operations (Wesoky, Facey, & Shepherd, 1991). The benefits to the operator are time-related sav-ings manifested by increased asset utilization from increased number of trips per day and reduced costs for staffing flights. The shorter flight times also translate into a reduced need for in-flight ca-tering, large galleys, lavatory capacity, and extra cabin volume that is expected on longer flights. The benefits of significantly shorter flight times for
passengers carry a high potential value for those who must travel frequently or those for who health issues currently discourage long-haul travel. Re-search and analysis has indicated that the market potential for overland supersonic flight would ini-tially focus on the business traveller who places a high value on time-savings (Smith, 2003). Howev-er, the regulatory restriction from overland super-sonic flight cuts deeply into time-savings and has consequently hurt the business case for supersonic civil transport aircraft. Regulations for allowable sonic boom levels would determine the allowable operating areas and airports which also folds into the market potential .
Studies by Henne (2003) and Chudoba et al. (2007) indicated that civil business aircraft opera-tions flew over water on average only 25% of the trip, which would mean that under current regula-tions supersonic speeds would only be maintained for 25% of the trip distance. In another study, Lee and Nicholls (1997) showed how the operating costs per trip varies with the percent of the trip that is flown at subsonic speeds. As the subsonic leg increases, the trip time increases, which increases crew costs and reduces the utilization of the air-craft. Maximum economic benefit can only be re-alized by maximizing supersonic flight throughout the entire trip (See Figure 3).
Market assessments have indicated a significant market potential for civil supersonic aircraft, rang-ing from 180 to 450 aircraft, if overland superson-
Figure 3. Percentage of cost (relative value) increase with percent of trip flown at subsonic speeds. Adapt-ed from “The Investigation of Supersonic Commercial Transport Performance Issues Using Multivariate Optimization” by Lee and Nicholls,1997, AIAA 97-5569.

54 |
ic flight were allowed (Hamel, Folk, Jimenez, & Mavris, 2009; Smith, 2003). The margins for a profitable operation are narrow, and a prohibition from overland supersonic flight make it unfeasible (Welge, Nelson, & Bonet, 2010; Henne, 2003). A comparison of flight times for a Supersonic Busi-ness Jet (SSBJ) flying from New York to Moscow, with and without an overland sonic boom restric-tion, show the time savings at various supersonic cruise speeds when speed does not have to be re-duced to less than Mach 1 overland. An aircraft departing overwater from New York and cruis-ing enroute to Moscow at Mach 1.8 would have a trip time of 4.6 hours, if not constrained to reduce to subsonic speeds cruise speeds when reaching landfall over Europe (Figure 4). However, the trip time would be increased to 5.5 hours if the aircraft had a restriction from overland supersonic cruise flight (Figure 4).
Figure 4. Comparison of Trip Time from New York to Moscow with and without an overland sonic boom restriction. Adapted from “What price su-personic speed? An applied market research case study-part 2” by Chudoba et al., 2007, 45th AIAA Aerospace Sciences Meeting and Exhibit, Reno NV.
Regulations
The Federal Aviation Administration is aware of the implications of the prohibition for overland supersonic flight, and has sponsored research to quantify sonic boom levels and perceived level of decibels (PLdB) that are acceptable to the residen-tial community, not harmful to the environment or wildlife, and that do not adversely affect buildings or other man-made structures (Croft, 2010; Coen, 2003). Sonic boom overpressure, the objective effect, can be readily measured. The subjective effect perceived by humans, typically measured in perceived level of decibels (PLdB), is a com-bination of overpressure, duration, rise time, and shape. Studies have analyzed the effects of sonic booms on observers inside structures constructed from different materials, and outdoors with varying amounts of ambient background noise levels to de-termine the sonic boom level that would be accept-able to the public and not harmful or a nuisance to wildlife, structures, or other man-made object, such as seismic sensors and car alarms (Coulou-vrat, 2009).
The regulation that addresses supersonic flight in the United States was enacted in 1973 under U.S. C. Title 14 CFR 91.817. The regulation con-siders any sonic boom that impacts the ground as unacceptable and consequently prohibits civil air-craft from exceeding Mach 1 over U.S. territory, as well as supersonic operations to or from any U.S. airport in which any sonic boom would reach the ground. The International Civil Aviation Organi-zation (ICAO) Committee on Aviation and Envi-ronmental Protection (CAEP) has recognized that current guidance for supersonic flight is outdated and established a timeline for the implementation of a new rule for supersonic flight (Table 1).
Less stringent criteria, proposed in 1974 by the U.S. Environmental Protection Agency (EPA), rec-ommended a sonic boom peak pressure level not to exceed 0.75 psf. Viable supersonic aircraft designs have been presented by Gulfstream, Boeing, and Raytheon with overpressures in the 0.4 to 0.7 psf range and a perceived level of ≤70 PLdB (Rad-loff, 2003; Raytheon, 2003; Wolz, 2003) . Studies indicate that these designs, with sonic boom sig-
Case for FAA Regulations to Develop Supersonic Transport Aircraft

International Journal of Applied Aviation Studies | 55
natures significantly less than Concorde’s 2.0+ psf and estimated 100+ PLdB, might be acceptable to the community and environment, (Cathers, 1990; Wedge, Chester, & Bonet, 2010) .
The FAA has a website (http://www.faa.gov/about/office_org/headquarters_ offices/apl/noise_ emissions/supersonic_aircraft_noise/) soliciting technical information from other federal agencies, industries, universities, and other interested parties on the mitigation of over land sonic booms from supersonic aircraft to determine whether there is
sufficient new data to support future rulemaking actions. The FAA (2008) has also issued a policy that states the following:
Since March 1973, supersonic flight over land by civil aircraft has been prohibited by regulation in the United States. The Concorde was the only civil supersonic airplanethat of-fered service to the United States, and it is no longer in service. Interest in supersonic aircraft technology has not disappeared. Cur-rent research is dedicated toward reducing the
Table 1.
ICAO supersonic regulatory goals and timelines. Adapted from International Civil Aviation Organization (2006). Review of Supersonic Standards-CAEP/7-WP-10. Montreal, Canada: Author
CertificationCondition
Environmental Protection Area
CAEP 7 Mtg (2007)
CAEP 8 Mtg (2010)
CAEP 8 Mtg (20130)
Noisecertification
Surrounding Air-port community
noise impact
Agree Terms of Reference &Possible timeline for ruledevelopment
Consider Adoption of CurrentSubsonic Noise Rule for Super-sonic airplanes
If required, Pro-pose Modification to Current Super-sonic Noise rule for Supersonic Airplanes
SonicBoom
En-route Sonic Boom control
Agree Terms of Reference &Possible timeline for ruledevelopment
Report status on Acceptable metric and on Animal and Human response AssesmentsReassess terms of Reference
Propose Superson-ic Rule with: 1) Acceptable
metric2) Acceptable
limits3) Demonstration
methodLTO
EmissionsLocal Air Quality
controlAgree Terms of Reference &Possible timeline for ruledevelopment
Consider Adoption of revisedEmissions Rules for Supersonic Airplanes
If required, (if no action taken at CAEP/8) consider adoption of revised Emissions rules for SupersonicAirplanes
CruiseEmissions
GlobalAtmospheric Im-pacts (e.g. climate
change, ozone)
Consider existing global emissions assessments and promote newassessments
Report Status on new cruiseemissionassessments
Propose guidance on importance of cruise emissions with link to type of fleet (SSBJ and HSCT may bedifferent)
56 |
impact of sonic booms before they reach the ground, in an effort to make overland flight acceptable. Recent research has produced promising results for low boom intensity, and has renewed interest in developing super-sonic civil aircraft that could be considered environmentally acceptable for supersonic flight overland. Supersonic aircraft technolo-gists, designers, and prospective manufac-turers have approached the FAA and Inter-national Civil Aviation Organization (ICAO) for guidance on the feasibility of changing the current operational limitations. The U.S. regulation prohibits civil supersonic aircraft flight overland. Before the FAA can address a change in operational restrictions, it needs thorough research to serve as a basis for any regulatory decisions. Public involvement will be essential in defining an acceptable sonic boom requirement, and public participation would be part of any potential rulemaking process. (FAA, 2008, p.2)
Conclusion
The historical precedent from the demise of the Concorde and subsequent business analyses have established that the viability of a profitable civil supersonic aircraft operation rests with allowing supersonic flight over land. Incentivizing the air-line industry to procure and operate civil super-sonic transport aircraft requires a clear definition of the market potential for a profitable operation. The airline industry relies on the aircraft manufac-turers to provide an aircraft design that can meet or exceed airline operator requirements for passen-ger load, trip time, and range, with the underlying specification that overland supersonic flight will be possible. In turn, the aircraft manufacturers are subject to the normal aircraft certification regula-tory compliances, with the additional constraints of sonic boom control. Although the airlines may identify a demand for supersonic flight, and the manufacturers may have mature technologies for designing a supersonic aircraft, neither can pro-ceed any further until the regulatory requirements for an acceptable over land sonic boom level are
determined. The maximum allowable over land regulatory sonic boom level will determine the possible combinations of aircraft cruise speed, weight, and exterior design geometry/dimensions, which in turn determine the interior dimensions for passenger/fuel load, range, and trip times for estab-lishing a business case that is attractive enough to incentivize an investment by the airline industry in supersonic transport aircraft. The candidate origin/destinations for supersonic air carrier service are set by the specific overland flight corridors deter-mined by the allowable overland regulatory sonic boom levels.
Establishing Federal Aviation Regulations for acceptable over land sonic boom levels is the pre-requisite for determining aircraft design require-ments and market potential, both of which are essential to incentivize industry stakeholders to develop and introduce a supersonic civil transport aircraft into the National Airspace System.
References
Aronstein, D., & Schueler, K. (2005). Two super-sonic business aircraft conceptual designs with and without sonic boom constraint. Jour-nal of Aircraft, 42(3), 775-786.
Candel, S. (2004). Concorde and the future of su-personic transport. Journal of Propulsion and Power, 20(1), 59-68.
Cathers, R. (1990). Pursuit of the high-speed civil transport, AIAA Aerospace Engineering Conference & Show. Los Angeles, CA.
Chudoba, B., Oza, A., Robert, K., Mixon, B., Cole-man, G., & Czysz, P. (2007, January). What price supersonic speed? An applied market re-search case study-part 2. 45th AIAA Aerospace Sciences Meeting and Exhibit. Reno, NV.
Civil Aircraft Sonic Boom, 14 C.F.R. pt. 91.817 (1963).
Coen, P. (2003). Human response to sonic booms, FAA Civil Supersonic Aircraft Workshop, [Pow-erPoint Slides]. Retrieved from http://www.faa.gov/about/office_org/headquarters_offices/apl/noise_emissions/supersonic_aircraft_noise/
Case for FAA Regulations to Develop Supersonic Transport Aircraft

International Journal of Applied Aviation Studies | 57
Coulouvrat, F. (2009). The challenges of defining an acceptable sonic boom over land. 15th AIAA/CEAS Aeroacoustics Conference. Mi-ami, FL.
Croft, J. (2010, November). Big Buildings are NASA’s focus in sonic boom study. Flight International, 178, 18.
Federal Aviation Administration (2008). Civil Su-personic Airplane Noise Type Certification Standards and Operating Rules, Washington DC. Retrieved May 22, from http://www.faa.gov/about/office_org/headquarters_of-fices/apl/noise_emissions/supersonic_aircraft_noise/
Haering, E. (2010). Real-Time sonic boom dis-play, NASA Dryden Flight Research Center [PowerPoint Slides]. Edwards AFB, CA.
Hamel, L., Folk, T., Jimenez,H., & Mavris, D. (2009). Conceptual design of an N+2 super-sonic airliner, AIAA Aviation Technology, In-tegration, and Operations Conference. Hilton Head, S.C.
Henne, P. (2003, July). The case for small super-sonic civil aircraft, AIAA International Air and Space Symposium and Exposition: The Next 100 Years, Dayton, OH
Lee, C., & Nicholls, K. (1997). The investigation of supersonic commercial transport perfor-mance issues using multivariate optimization. AIAA 97-5569.
Loubeau, A., & Coulouvrat, F. (2009). Effects of meteorological variability on sonic boom propagation from hypersonic aircraft. AIAA Journal, 47(11), 2632-2641.
Maglieri, D., & Sothcott, V. (1990). Influence of vehicle configuration and fight profile on X-30 sonic booms. AIAA 2nd International Aero-space Planes Conference. Orlando, FL.
Maxwell, R., & Dickinson, L. (1980). Advanced high-speed aircraft-2000. AIAA International Meeting & Technical Display. Baltimore, MD.
Plotkin, K. (1989, April). Review of sonic boom theory, AIAA 12th Aeroacoustics Conference. San Antonio, TX.
Poling, H., Robinson, L., & Sutherland, L. (1997). Supersonic transport secondary sonic booms, AIAA-97-1659-CP.
Radloff, P. (2003). Boeing airframe focus, FAA Civ-il Supersonic Aircraft Workshop, [PowerPoint Slides]. Retrieved from http://www.faa.gov/about/office_org/headquarters_offices/apl/noise_emissions/supersonic_aircraft_noise/
Raytheon Aircraft Company (2003). Supersonic civil aircraft study, FAA Civil Supersonic Aircraft Workshop, [PowerPoint Slides]. Re-trieved from http://www.faa.gov/ about/of-fice_org/ headquarters_offices/apl/noise_emis-sions/supersonic_aircraft_noise/
Rogers, W. (1997). Review of high-speed civil transport flight deck design and integration is-sues, AIAA-97-5525.
Smith, R. (2003). NetJets supersonic aircraft work-shop, FAA Civil Supersonic Aircraft Workshop, [PowerPoint Slides]. Retrieved from http://www.faa.gov/ about/office_org/headquarters_offices/apl/noise_emissions/supersonic_air-craft_noise/
Supersonic Aerodynamics. (2008). In G. D. Con-sidine (Ed.) Van Nostrand’s Scientific Ency-clopedia, (Vol.3). (10th ed., pp. 5287-5292) Hoboken, NJ: Wiley-Interscience.
Van Treuren, K. W. (2005). (Concorde) In C. Mit-cham (Ed.), Encyclopedia of science, tech-nology, and ethics, airplanes. Detroit: Mac-millan Reference USA. Retrieved from http://go.galegroup.com.ezproxy.libproxy.db.erau.edu/ps/i.do?&id=GALE%7CCX3434900038&v=2.1&u=embry&it=r&p=GVRL&sw=w
Welge, H., Nelson, C., & Bonet, J. (2010). Super-sonic vehicle systems for the 2020 to 2035 timeframe, AIAA 28th Applied Aerodynamics Conference. Chicago, IL.
Wesoky, H., Facey, J., & Shepherd, K. (1991). Technical bases for high speed civil transport environmental acceptability, AIAA 9th Applied Aerodynamics Conference. Baltimore, MD.
Wolz, R. (2003). Recent supersonic vehicle stud-ies at Gulfstream Aerospace, FAA Civil Super-sonic Aircraft Workshop, [PowerPoint Slides].

58 | Case for FAA Regulations to Develop Supersonic Transport Aircraft
Appendix
Factors and Relationships for Sonic Boom Regulations (Joslin, 2011)
Retrieved from http://www.faa.gov/about/of-fice_org/headquarters_offices/apl/noise_emis-sions/supersonic_aircraft_noise/
Zha, G., Im, H., & Espinal, D. (2010). Toward zero sonic boom and high efficiency superson-
icflight, part I: A novel concept of supersonic bi-directional flying wing, AIAA Aerospaces Sciences Meeting. Orlando, FL.
Inter-related factors
International Journal of Applied Aviation Studies | 59
The Effect of Information About the Environmental
Impact of Flying and People’s Desire to Fly
Andrew Gilbey, Jose D. Perezgonzalez, and Kawtar Tani
School of Aviation
Massey University, N
Abstract
It is widely believed that the aviation industry contributes to global climate change. Both the in-dustry and its detrimental effect upon the environ-ment are predicted to grow over the next 10–15 years. Although numerous lobby groups have tried to deter people from unnecessary air travel by explaining how aviation is a factor in causing global climate change, few people report they will try to limit the amount of flights that they take. A between-subjects experimental design was used to test whether participants exposed to information about the adverse effect of aviation on the envi-ronment desire to fly more than those not exposed to such information. Evidence of a boomerang ef-fect was observed, whereby exposure to informa-tion about aviation’s contribution to global climate change led to a significant increase in perceived desire to fly.
The Effect of Information about the Environmental Impact of Flying
and People’s Desire to Fly
It is widely believed that anthropogenic green-house gas (GHG) emissions contribute to global climate change (GCC) and that the effects of GCC may include extreme weather patterns, water-borne diseases, and an overall effect upon food chains (Kovats, Menne, McMicheal, Bertollini, & Soskolne, 2000), although it should be noted that the link between GHG and GCC has not gone un-challenged (e.g., Spencer, 2010). It is also widely acknowledged that the aviation industry contrib-utes to anthropogenic GHG emissions, although estimates vary regarding the extent of the contribu-tion. For example, it has been reported that inter-national aviation is responsible for between 2.5% and 3% of total anthropogenic GHG emissions (Scheelhaase & Grimme, 2007), whilst domestic and international aviation combined account for between 3.5% (Penner, Lister, Griggs, Dokken, & McFarland, 1999) and 4.6% (Gössling & Peeters, 2007). In addition to GHG emissions, it is argued that airports adversely affect the environment through increased noise, air pollution, and dam-age to wildlife, heritage, and landscapes (Benfield, Bell, Troup, & Soderstrom, 2010; Blickley & Pa-tricelli, 2010; Jarup et al., 2008; Oosterlynck & Swyngedouw, 2010).
The aviation industry has grown approximately 5% per year for the last 30 years and is predicted
Return to Table of Contents

60 |
to grow at a similar rate for at least the next 10–15 years (Beloba, Odoni, & Barnhart, 2009). In con-trast, there may be a reduction of 20% in aviation GHG emissions by the year 2050 through the im-plementation of new aircraft technologies (Penner et al., 1999), and yet further gains from improved flight management (Becken, 2007). Neverthe-less, at best, it has been predicted that growth of the aviation industry will cancel out any gains as a result of technical and management improve-ments (Gössling & Peeters, 2007), whilst a more pessimistic outlook is that, as the aviation indus-try grows, its overall effect on the environment is likely to increase proportionally, regardless of any increases in energy efficiency (Cairns & Newson, 2006). Consistent with the latter prediction, in the European Union, net GHG emissions from aviation increased by 87% between 1990 and 2006 (EU, 2006), even although aircraft became more effi-cient during that period (Thomas, Norris, Forbes Smith, Creedy, & Pepper, 2008).
Given the adverse effect that aviation is argued to have on the environment, several calls have been made to limit any further expansion of the aviation industry (e.g., Friends of the Earth, nd; Greenpeace, 2010; Griggs & Howarth, 2008, May & Hill, 2006; Plane Stupid, 2011). One way to reduce the de-mand for air travel, and its subsequent effect on the environment, would be to make flying more expen-sive by introducing new taxes or charges, although such an approach would likely be highly unpopu-lar, thereby making this strategy potentially hard to defend for governments (Cairns & Newson, 2006; Griggs & Howarth, 2008). It is also believed that acquiring knowledge about environmental effects may increase people’s awareness and ultimately encourage pro-environmental behaviour (Bam-berg & Möser, 2007; O’Connor, Bord, & Fisher, 1999). Accordingly, different methods have been used to communicate the effect that air travel has on the environment in the hope that it will affect consumer behaviour. For example, Friends of the Earth (nd.) make available a short booklet about the effect of aviation on the environment, which includes suggestions for how people could reduce the number of times they need to fly (e.g., by taking holidays locally, rather than flying overseas), whilst
the lobby group, PlaneStupid.com, have adopted a more proactive stance and participated in non-vio-lent direct action at Stansted Airport by breaching the perimeter fence and disrupting flights to pro-test against a planned expansion (Gavin, 2010). In practice it has been reported that fewer than one in five people try to reduce the amount of flights that they take each year as a result of environmen-tal concerns (Vaughan, 2009), and that air travel is increasing year on year (Beloba et al., 2009), all of which suggests that information about aviation’s effect on the environment is not getting to consum-ers or, if it is, that it is having little or no effect.
In the wider context of behaviour modification and attitude change, education programmes and mass media campaigns frequently prove ineffec-tive in dealing with public health issues, even when the suggested changes may improve or maintain people’s health (Ringold, 2002) and probably save them money. For example, although unrelated to aviation, it has been found that health campaigns aimed at reducing the incidence of behaviours such as cigarette smoking, drug abuse, and excessive alcohol consumption often fail to succeed, whilst some campaigns even produce an effect in the op-posite direction to that which was intended (Rin-gold, 2002). Attitudinal and behavioural changes that occur in a direction opposite to that which was intended are sometimes referred to as boomerang effects (Ringold, 2002).
Ringold (2002) argued that Brehm’s (1966) re-actance theory explains why some attempts at at-titude change either fail or result in a boomerang effect. Although a review of reactance theory is be-yond the scope of the current study, Brehm (1966) essentially argued that, as a reaction to impositions or regulations that encroach upon real or perceived freedoms and autonomy, people perceive the re-stricted behaviour or product as more desirable. Thus, people may perceive their ability to travel by air as a freedom to be enjoyed, at least when time and funds permit, and information aimed at reduc-ing people’s use of air travel as a potential imposi-tion upon this perceived freedom.
The present study therefore sought to test the hypothesis that exposure to information about the
Environmental Impact of Flying and People’s Desire to Fly

International Journal of Applied Aviation Studies | 61
(see table 1) were developed to tap various differ-ent aspects of people’s desire to fly. For each of the 13 statements, participants were instructed to indi-cate the extent to which they agreed or disagreed using an 11-point scale, where 0 = completely disagree, 5 = neither agree nor disagree, and 10 = completely agree. To reduce the likelihood of a response set, some statements were negatively worded. Once the negatively worded statements were reverse scored, the overall scale mean would be interpreted as providing a general indication of how a person perceives the desirability of air trav-el, with higher scores indicating higher degrees of desirability. Participants were also asked to report their age and gender.
The independent variable was exposure to in-formation that explains how aviation damages the environment and had two levels: i) exposure to information; or ii) no exposure to information. Participants assigned to the experimental condi-tion were exposed to information which included
effect of aviation upon the environment will lead to a boomerang effect, whereby air travel is subse-quently perceived as more desirable.
METHOD
Participants
Participants were eighty undergraduate students (40 male, 36 female, 4 did not report gender). The mean age (9 did not report age) was 21.38 yr. (SD = 6.45, range = 17– 53). Thirty-nine students were recruited from a class in aviation management and forty-one were recruited from a class in cognitive psychology.
Materials and Procedure
The dependent variable was the degree to which flying is perceived as desirable. Thirteen statements
Table 1
Statements Measuring Desire To Fly
Number Statements1 I really like travelling by air.2 If I can, I will travel by air as much as possible in the future.
3 I personally should take my holiday in the country where I currently live, as it can be just as good as visiting far-off destinations by air travel and will help save the environment.*
4 Airlines should pay extra taxes to offset pollution they cause. *
5 I think the average person in the country where I live wants to travel by air as much as they can in the future.
6 If holiday makers want to fly, they must pay extra taxes for the environmental damage that they cause.*
7 I should have freedom of choice to travel by air when I want.
8 It is selfish to want to fly to distant and/or exotic locations because it creates pollution and global warming.*
9 I intend to holiday at home to avoid contributing to air pollution.*10 Air travellers unfairly affect non-air travellers by contributing to greenhouse emissions.*
11 I think that business people should try to cut back on flying if they possibly can (e.g., use tele-conference rather than a business meeting), so not to contribute to global warming.*
12 Aircraft passengers should pay extra taxes to offset the global warming they contribute to.*
13 I think people should holiday in the country where they are currently living, rather than over-seas, so as not to contribute to global warming.*

62 |
ation students, F(1, 69) = 9.38, p = 0.003, partial η2 = 0.12, (MAv = 19.03 yr, SD = 2.04; MPscyh = 23.54 yr, SD = 8.18). Chi-sq test found that gen-der was significantly related to course, χ² (1, n = 76) = 21.39, p < 0.001; more males (29) than fe-males (7) were enrolled in the aviation class, and fewer males (11) than females (29) were enrolled in the psychology class.
Internal consistency (Cronbach’s Alpha) of the 13-statement questionnaire was 0.77 and could not be improved further by removal of any item(s). A 2x2 analysis of covariance, using age and gender as covariates, revealed highly significant main effects for: exposure to information, F(1, 64) = 14.74, p < 0.001, partial η2 = 0.19, air travel was perceived as more desirable by those exposed to information (M = 6.19, SD = 1.23) than by those in the control condition (M = 5.26, SD = 1.42); and also for course, F(1, 64) = 24.34, p < 0.001, partial η2 = 0.28; aviation students (M = 6.40, SD = 1.31) perceived air travel to be more desirable than did psychology students (M = 5.04, SD = 1.15). The interaction between exposure to information and course was not significant.
The above findings did not alter significantly when all participants were included in a 2x2 anal-ysis of variance.
DISCUSSION
Similar to the boomerang effect found for many types of public health interventions (Ringold, 2002), the current findings support the hypothesis that providing¬¬¬ information about aviation’s ef-fect on the environment will have the opposite ef-fect to that which was intended. In specific terms, following exposure to information about how aviation harms the environment and that potential solutions involve restrictions to the freedom of flying, people perceive flying as more desirable. As a result, the current strategy of the green lobby, i.e., to convince people that flying causes environ-mental damage, appears destined to fail.
two video clips, both of which conveyed informa-tion about the negative effects of aviation on the environment, and a copy of a booklet published by Friends of the Earth. The video clips lasted ap-proximately 5 min in total. The booklet provided by Friends of the Earth (nd) outlined factual infor-mation about aviation’s effect on the environment including some tips on how to reduce the number of times that people fly (e.g., by taking holidays at home or using teleconference for business meet-ings), from which the experimenter read out loud five points about how to reduce one’s reliance upon air travel, prior to instructing participants to complete the questionnaire. As the manipulation was short in duration (approx 7 min), participants in the control group were not exposed to unrelated audiovisual or text material.
Participants were approached at the end of a scheduled lecture and were asked to participate in a brief study to explore people’s attitudes to air travel. Participants were blind to the experimen-tal manipulation, but it was not possible to blind the survey administrator. Aviation students were randomly assigned to the experimental or control condition by drawing (without replacement) odd or even numbers for each participant, thus assigning them to either the control condition or experimen-tal condition. As psychology students had already been randomly allocated to one of two groups at the time of testing, and because of classroom size constraints, one psychology class was randomly assigned to the experimental condition (by the flip of a coin) and the other to the control condition.
RESULTS
No participants declined to participate in the study and no questionnaires were spoiled, al-though 10 failed to report their age and/or gender. These participants were omitted from the follow-ing analyses.
One-way analysis of variance found that psy-chology students were significantly older than avi-
Environmental Impact of Flying and People’s Desire to Fly

International Journal of Applied Aviation Studies | 63
depend on the continuation of air transport). Fur-thermore, the lack of evidence of an interaction between exposure to information and course sug-gests that the difference in baseline desirability of air travel did not affect internal validity.
There are two potential limitations to the find-ings reported here. First, concerns the use of intact groups regarding the participants who were psy-chology students. However, as it was ascertained that the prior allocation to groups was not based upon any pre-existing characteristics, and as dif-ferences between aviation and psychology stu-dents was not the primary point of this study, this limitation is not believed to have seriously com-promised the validity of the findings. Second, the participants in this study were students studying at a New Zealand University. It is possible that their views and the way in which they are influenced by information about the environment is limited to a New Zealand geographical context. For ex-ample, New Zealand’s relative geographical iso-lation from other countries and few countrywide train services (TranzScenic, 2011) make alterna-tives to both domestic and international air travel financially unviable, whereas, in Europe, viable alternatives such as high-speed rail networks have led, for example, to the near-complete discontinu-ation of air services between Paris and Brussels (Dobruszkes, 2011). Although travellers to and from New Zealand are highly dependent on in-ternational air services (Becken, 2002), tourists in New Zealand are reportedly open to discussions on the environmental impacts of their travel (Fair-weather, Maslin, & Simmons, 2005). That said, the findings of the current study suggest such dis-cussions could lead to air travel being perceived as more desirable.
As the study reported herein investigated the desirability to travel by air, rather than actual be-haviour (e.g., how much participants travelled by air before and after exposure to information), it is possible that the effect of exposure to information about aviation’s effect on the environment is rela-tively short-lived. That said, given that it is pos-sible to buy flights and/or holiday packages virtu-ally instantaneously at any time of the day using the World Wide Web, even a temporary increase
If information-based interventions are indeed ineffective, or worse still lead to a boomerang ef-fect, then other types of intervention, no matter how unfavourably they are received, may need to be considered. For example, evidence suggests that increased taxation increases the number of people who attempt to give up cigarette smok-ing (Hu, Sung, & Keeler, 1995), or reduce their level of alcohol consumption (Waagenar, Salois, & Komro, 2009), although air travel is very dif-ferent from these two behaviours. It is considered likely that governments will be unwilling to imple-ment changes such as these for a perceived right or freedom such as air travel for fear of not being elected to a further term. Alternatively, technologi-cal advancements in aviation may reduce the effect of aviation on the environment so that it no longer poses a significant threat to GCC, although there is no evidence this will occur anytime soon (Cairns & Newson, 2006).
Ultimately, expansion of aviation may not be halted by the environmental lobby, but by the lack of availability of low-cost aviation fuel, mainly as a result of the widely-anticipated advent of peak oil (May & Hill, 2006). However, as flying is cur-rently much more dependent on oil-based fuels (Kivits, Charles & Ryan, 2010) than is driving (Za-pata, 2010)—because, at least in the foreseeable future, electric aircraft are unlikely to be viable for passenger travel (Gohardani, Doulgeris, & Singh, In Press), whilst electric cars are already widely available and their production is rapidly increasing (Bradsher, 2009)—it is possible that reduced reli-ance on oil for cars will free-up and save remain-ing oil based fuel for aviation. We acknowledge this may require a significant change in current consumer attitudes and preferences and perhaps even some government legislation.
It was also found that participants enrolled in aviation courses perceived air travel to be more desirable than participants enrolled in psychology courses. This was interpreted as evidence that the 13-statement questionnaire tapped the construct of desire to fly, as it would be reasonable to expect students enrolled in an aviation degree to perceive air travel as more desirable than groups not explic-itly studying aviation (i.e., their future livelihoods
64 |
Bradsher, K. (2009, April, 1). China vies to be world’s leader in electric cars. The New York Times. Retrieved July 29, 2011 http://www.nytimes.com/2009/04/02/business/global/02electric.html
Brehm, J. W. (1966). A theory of psychological re-actance. New York: Academic.
Cairns, S., & Newson, C. (2006). Predict and de-cide - Aviation, climate change and UK poli-cy. Retrieved July 14, 2010 from http://www.eci.ox.ac.uk/research/energy/downloads/pre-dictanddecide.pdf
Dobruszkes, F. (In press). High-speed rail and air transport competition in Western Europe: A supply-oriented perspective. Transport Poli-cy.
EU press release (2006, December 20). Climate change: Commission proposes bringing air transport into EU Emissions Trading Scheme. Press release, retrieved July 14, 2010 from http://europa.eu/rapid/pressReleasesAction.do?reference=IP/06/1862
Fairweather, J.R., Maslin, C., & Simmons, D.G. (2005). Environmental values and response to ecolabels among international visitors to New Zealand. Journal of Sustainable Tourism 13 (1), 82–98.
Friends of the Earth (not dated). Aviation and global climate change. Retrieved April 19, 2010 from: http://www.foe.co.uk/resource/re-ports/aviation_climate_change.pdf#search=-percent22Aviationpercent20andpercent20globalpercent20climatepercent20changepercent22
Gavin, N. T. (2010). Pressure Group Direct Action on Climate Change: The Role of the Media and the Web in Britain-A Case Study. The British Journal of Politics & International Relations, 12(3), 459–475.
Gohardani AS, Doulgeris, G., & Singh, R. (2011, In press) Challenges of future aircraft propul-sion: A review of distributed propulsion tech-nology and its potential application for the all electric commercial aircraft. Prog Aerospace Sc.
Environmental Impact of Flying and People’s Desire to Fly
in the perceived desirability of flying would result in increased level of air travel within a population. This possibility could be investigated in future re-search using a larger representative sample where the outcomes of interest include both desire to fly and number of flights actually taken.
The current findings suggest that if the green lobby is to influence people’s attitudes about fly-ing by providing knowledge about the effect it has on the environment, and thus reduce people’s de-sire to fly, they should be aware that so doing may result in a boomerang effect, whereby prospective passengers exhibit an increased desire to travel by air.
ACKNOWLEDGEMENT
The authors would like to thank the anonymous reviewers for their valuable comments and sugges-tions, which were helpful in improving the paper.
REFERENCES
Bamberg, S., & Moser, G. (2007). Twenty years after Hines, Hungerford, and Tomera: A new meta-analysis of psycho-social determinants of pro-environmental behaviour. Journal of Environmental Psychology, 27, 14–25.
Belobaba, P., Odoni, A., & Barnhart, C. (Eds.) (2009). The global airline industry. Chich-ester, West Sussex, U.K.: Wiley.
Benfield, J. A., Bell, P. A., Troup, L. J., & Soder-strom, N. C. (2010). Aesthetic and affective ef-fects of vocal and traffic noise on natural land-scape assessment. Journal Of Environmental Psychology, 30(1), 103–111.
Blickley, J.L., & Patricelli, G.L. (2010). Impacts of anthropogenic noise on wildlife: Research priorities for the development of standards and mitigation. J Int. Wildlife Law Policy, 13(4), 274–292.

International Journal of Applied Aviation Studies | 65
Oosterlynck, S., & Swyngedouw, E. (2010). Noise reduction: the postpolitical quandary of night flights at Brussels airport. Environment and Planning A, 42, 1577–1594.
Penner, J., Lister, D., Griggs, D., Dokken, D., & McFarland, M. (eds) (1999) Aviation and the Global Atmosphere. In A Special Report of IPCC Working Groups I and III. Published for the Intergovernmental Panel on Climate Change. Cambridge: Cambridge University Press.
Plane Stupid. (2011). Bringing the aviation in-dustry back down to earth. Retrieved July 27, 2011 from http://www.planestupid.com/
Ringold, D. J. (2002). Boomerang Effects in Re-sponse to Public Health Interventions: Some Unintended Consequences in the Alcoholic Beverage Market. Journal of Consumer Pol-icy, 25, 27–63.
Scheelhaase, J. D., & Grimme, W. G. (2007). Emissions trading for international aviation an estimation of the economic impact on selected European airlines. Journal of Air Transport Management, 13, 253–263.
Spencer, R. W. (2010). The great global warming blunder: how mother nature fooled the world's top climate scientists. New York: Encounter Books.
Thomas, G., Norris, G., Creedy, S., Forbes Smith, C., & Pepper, R. (2008). Plane Simple Truth: Clearing the Air on Aviation's Environmen-tal Impact. Perth, W.A.: Aerospace Technical Publications International Pty Ltd.
TranzScenic. (2011). The official website for New Zealand Train Journeys. Retrieved July 29, 2011 from http://www.tranzscenic.co.nz/
Vaughan, A. (2009, October, 5). British public re-fuse to fly less to reduce their carbon footprint. The Guardian. Retrieved July 14, 2010 from http://www.guardian.co.uk/
Wagenaar, A. C., Salois, M. J., & Komro, K. A. (2009). Effects of beverage alcohol price and tax levels on drinking: a meta-analysis of
Gössling, S., & Peeters, P. (2007) ‘It does not harm the environment!’ – An analysis of industry discourses on tourism, air travel and the envi-ronment. Journal of Sustainable Tourism, 15 (4), 402–417.
Greenpeace. (2010). The problem with aviation. Retrieved May 9, 2010 from http://www.greenpeace.org.uk/climate/aviation
Griggs, S., & Howarth, D. (2008). Populism, local-ism and environmental politics: the logic and rhetoric of the Stop Stansted Expansion Cam-paign. Planning Theory, 7, 123–145.
Hu, T. W., Sung H. Y., & Keeler, T. E. (1995). Reducing cigarette consumption in Califor-nia: tobacco taxes vs. an anti-smoking media campaign. American Journal of Public Health, 85(9),1218-22.
Jarup, L., Babisch, W., Houthuijs, D., Pershagen, G., Katsouyanni, K., Cadum, E., Dudley, M. L., Savigny, P., Seiffert, I., Swart, W., Breugelmans, O., Bluhm, G., Selander, J., Haralabidis, A., Dimakopoulou, K., Sourtzi, P., Velonakis, M., & Vigna-Taglianti, F. (2008). Hypertension and exposure to noise near airports—the HYENA study. Environ Health Perspect, 116, 329-333.
Kivits, R., Charles, M.B., & Ryan, N. (2010). A Post-Carbon Aviation Future: Airports and the Transition to a Cleaner Aviation Sector. Fu-tures, 42(3), 199–211.
Kovats, S., Menne, B., McMicheal, A., Bertollini, R., & Soskolne, C. (Eds.). (2000). Climate change and stratospheric ozone depletion: ear-ly effects on our health in Europe. WHO Re-gional Publications European Series, No 88. Retrieved 14 July, 2010 from http://www.euro.who.int/document/E71230.pdf
May, M., & Hill, S. B. (2006). Questioning airport expansion--a case study of Canberra Interna-tional Airport. Journal Of Transport Geogra-phy, 14(6), 437.
O’Connor, R.E., Bord, R. J. and Fisher, A. (1999) Risk perceptions, general environmental be-liefs, and willingness to address climate change. Risk Analysis, 19(3), 461–471.

66 |
1003 estimates from 112 studies. Addiction, 104:179–90.
Zapata, C., & Nieuwenhuis, P. (2010). Explor-ing innovation in the automotive industry: new technologies for cleaner cars. Journal of Cleaner Production, 18(1), 14–20.
Environmental Impact of Flying and People’s Desire to Fly

International Journal of Applied Aviation Studies | 67

20
11
Inte
rnatio
nal Jo
urn
al o
f Ap
plie
d A
via
tion
Stu
die
s Vo
lum
e 1
1, N
um
ber 2
International Journal of Applied Aviation StudiesVolume 11, Number 2ISSN Number: 1546-3214Copyright © 2011 FAA Academy1st Printing June, 2012