international journal of advance research in engineering, …€¦ · · 2 days agoshunt...
TRANSCRIPT

International Journal of Advance Research in Engineering, Science & Technology
e-ISSN: 2393-9877, p-ISSN: 2394-2444
Volume 5, Issue 4, April-2018
All Rights Reserved, @IJAREST-2018
Impact Factor (SJIF): 5.301
1
Power Quality Enhancement by DSTATCOM
Zarana Bhindi1, Dipesh Doshi2, Rakesh Akbari3
1Electrical Engineering, Noble Institution 2Electrical Engineering, Noble Institution 3Electrical Engineering, Noble Institution
Abstract — Static Synchronous Compensator (STATCOM) is a device based on a voltage source converter which
shunt connected to the grid. The STATCOM goes one step further than SVC and is capable of improving the power
quality against even voltage dips and flickers. The advantages of a STATCOM are that the reactive power provision is
independent from the actual voltage on the connection point. In this work MATLAB based simulation of STATCOM
and its related analysis is done. In this paper the study of various shunt connected FACTS devices and simulation of
11KV transmission line with and without STATCOM is done and different faults are applied to the system and
analysis of voltage sag is done. The respected simulations are being shown.
Keywords- Power Quality, DSTATCOM, Voltage sags, VSC, PI controller, MATLAB/SIMULINK
I. INTRODUCTION
Nowadays, more and more revolutionary power electronics equipment’s are used in industries for attaining
better & better power controlling ability. Also Power Quality is one of the important issues in power systems
has been a problem to both suppliers and consumers. Any small disturbances like voltage dips, voltage swells or
any other harmonic disturbances can bring a large amount of financial losses. Moreover power electronics and
power quality are indirectly linked together as with the advancement in both broad areas [1]. Flexible AC
Transmission Systems (FACTS) which are based on power electronics offer an opportunity to enhance
controllability, stability, and power transfer capability of AC transmission systems. Increased electric power consumption causes transmission lines to be driven close to or even beyond their
transfer capacities resulting in overloaded lines. Also some other problems like voltage dip, voltage sag and
voltage swell creates a critical problem both technically and economically. As a result of all such problems,
Power Quality is affected. Since most loads are inductive and consume lagging reactive power, the
compensation required is usually supplied by leading reactive power. As a result Shunt compensation of reactive
power is needed STATCOM is such one of the Shunt FACTS Controllers.
II. POWER QUALITY In present days the AC power distribution system or transmission system is suffering from various power
quality problems. The widespread use of power electronics in applications such as adjustable speed drives
(ASD), programmable logic controllers (PLC), and energy efficient lighting led to a complete change of electric
loads nature. These loads are simultaneously the major causers and the major victims of power quality
problems. Due to the non-linearity in loads, all these loads cause disturbances in the voltage waveform [2]. For
power engineers the term power quality refers to a certain sufficiently high grade of electric service. The
measure of power quality depends upon the needs of the equipment that is being supplied. Usually the term
power quality refers to maintaining a sinusoidal waveform of bus voltages at rated voltage and frequency.
III. INTRODUCTION OF SAG
Sags or dips were initially any reduction in rms voltage below a user defined low limit for between one cycle
and 2.55 seconds. Sag (dip) a decrease to between 0.1 and 0.9 pu in rms voltage or current at the power frequency for durations of 0.5 cycles to 1 minute.
IV. CAUSES OF SAG
TRANSMISSION SYSTEMS(typically above 65kV):They include the weather, construction accidents,
transportation accidents (helicopter or light planes are common culprits), animals or a fault on another part of
the system[15].

International Journal of Advance Research in Engineering, Science & Technology (IJAREST) Volume 5, Issue 4, April 2018, e-ISSN: 2393-9877, print-ISSN: 2394-2444
All Rights Reserved, @IJAREST-2018 2
DISTRIBUTION SYSTEMS(65kV to 12 kV):Similar to the transmission system causes, weather (lightning,
wind, ice), animal contact, contamination of insulators, construction accidents, motor vehicle accidents, falling
or contact with tree limbs can result in voltage sags.
POINT-OF- UTILIZATION(120-480V):Sudden increases in the current requirement can have the same effect
within a facility's wiring as on a utility distribution system.Voltage sags can be caused by fault conditions within
the building or the start up of large inductive loads, such as motors that create a temporary in rush current
condition.
V. PRINCIPLE OF STATCOM
A STATCOM is comparable to a Synchronous Condenser (or Compensator) which can supply variable reactive
power and regulate the voltage of the bus where it is connected. In its most general way, the STATCOM can be
modeled as a regulated voltage source Vi connected to a voltage bar Vs through a transformer. It is shown in
figure 1 [1] [9] [14] In its most general way, the STATCOM can be modeled as a regulated voltage source Vi
connected to a voltage bar Vs through a transformer. The Static Compensator (STATCOM) uses a VSC
interfaced in shunt to a transmission line. In most cases the DC voltage support for the VSC will be provided by
the DC capacitor of relatively small energy storage capability. Hence, in steady state operation, active power
exchanged with the line has to be maintained at zero, as shown symbolically in the figure. With the active power
constraint imposed, the control of the STATCOM is reduced to one degree of freedom, which is used to control
the amount of reactive power exchanged with the line.
Figure 1 principle of STATCOM
Accordingly, a STATCOM is operated as a functional equivalent of a Static VAR compensator; it provides
faster control than an SVC and improved. The figure 2 shows the equivalent circuit of a STATCOM system with
its power diagram.
Figure 2 Equivalent circuit of a STATCOM
International Journal of Advance Research in Engineering, Science & Technology (IJAREST) Volume 5, Issue 4, April 2018, e-ISSN: 2393-9877, print-ISSN: 2394-2444
All Rights Reserved, @IJAREST-2018 3
VI. CONTROLLER ALGORITHM
The main aim of the control scheme is to maintain constant voltage magnitude at the point where a sensitive
load is connected, under system disturbances. In this scheme it measures the RMS voltage at the load point, i.e.
no requirements of reactive power measurements. Here the sinusoidal PWM technique is used for the switching
of Voltage Source Converter as sine PWM offers simplicity and good response compared to other scheme like
space vector PWM. The input of the controller is an error signal which is obtained from the reference voltage
and the value RMS of the terminal voltage measured. Now PI controller which is shown in figure 3 will process
this error signal and then the output is the angle δ, which is provided to the PWM signal generator.
Figure 3 PI controller
In this case it is important to note that in converter, there is active and reactive power exchange with the network
simultaneously. Now the error signal is obtained by comparison of the reference voltage with the RMS voltage
measured at the load point. The error signal is processed by PI controller which in return generates the required
angle to drive the error to zero, i.e., the load RMS voltage is brought back to the reference voltage.
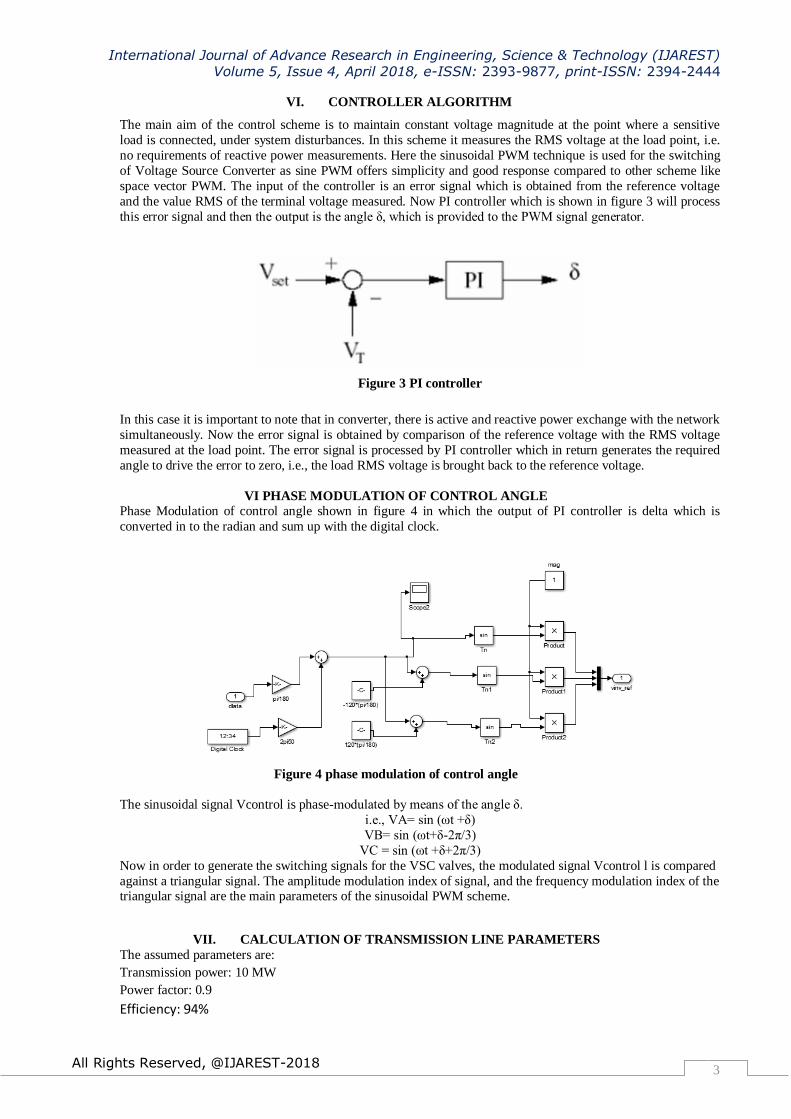
VI PHASE MODULATION OF CONTROL ANGLE
Phase Modulation of control angle shown in figure 4 in which the output of PI controller is delta which is
converted in to the radian and sum up with the digital clock.
Figure 4 phase modulation of control angle
The sinusoidal signal Vcontrol is phase-modulated by means of the angle δ.
i.e., VA= sin (ωt +δ)
VB= sin (ωt+δ-2π/3)
VC = sin (ωt +δ+2π/3)
Now in order to generate the switching signals for the VSC valves, the modulated signal Vcontrol l is compared
against a triangular signal. The amplitude modulation index of signal, and the frequency modulation index of the triangular signal are the main parameters of the sinusoidal PWM scheme.
VII. CALCULATION OF TRANSMISSION LINE PARAMETERS
The assumed parameters are:
Transmission power: 10 MW
Power factor: 0.9
Efficiency: 94%

International Journal of Advance Research in Engineering, Science & Technology (IJAREST) Volume 5, Issue 4, April 2018, e-ISSN: 2393-9877, print-ISSN: 2394-2444
All Rights Reserved, @IJAREST-2018 4
(1) Calculation of Voltage:
(
)
(
)
(2) Calculation of receiving current (Ir):
Ir=
Ir=583.18A
According to current from Appendix A ACSR 30/7/264.40 mm conductor is used in which 30 shows number of Aluminum conductor, 7 shows number of steel conductor and 264.40 shows cross sectional area of Al.
conductor.
Line losses are approximately 3 (Ir)2 R Where R is total line resistance per phase.
(3) Calculation of Resistance at 75 degree:
R = 0.6719 ohm
(4) Calculation of Line efficiency=
Efficiency=93.58%
(5) Calculation of ABCD parameters of Transmission line:
Here π Method is used for parameters.
√
Deq=1.5119 m
R = 11.72* 10^-3 m
Geometric mean radious =0.7788*11.72* 10^-3
=9.13*10^-3
Inductor (L) =
Inductor (L)=1.02 mH/Km
Calculation of Impedance (
Calculation of Admittance(Y) Admittance(Y) =
(
Calculation of
(
Calculation of (

International Journal of Advance Research in Engineering, Science & Technology (IJAREST) Volume 5, Issue 4, April 2018, e-ISSN: 2393-9877, print-ISSN: 2394-2444
All Rights Reserved, @IJAREST-2018 5
VIII. SIMULATION AND RESULTS
The following figure 5 shows the block diagram of the STATCOM scheme implemented and simulated. As
shown in the diagram the whole operation of system. There is three phase source
Figure 5 Block diagram of Implemented STATCOM scheme
Which supply of system, coupling transformer which couples the system to the load. Three phase load is there
which is load of transmission line.
Controller is there for close loop control which continuously senses the output of the system. PWM (pulse width
modulation) will provide the pulses to the GATE terminal of IGBT of VSC. According to the output of VSC the
voltage will be absorb or supplied to the system.
[A] SIMULATION OF UNCOMPENSATED 11KV TRANSMISSION LINE
As shown in figure 6 the three phase series RLC line is connected through the three phase transformer and
three phase source and three phase fault is connected to the transmission line.
Figure 6 Simulation of uncompensated 11kv transmission line
[B] WAVEFORM BEFORE FAULT CREATED
Figure 7 Waveform before fault created
0.2 0.3 0.4 0.5 0.6 0.7 0.8 0.9 1-1.5
-1
-0.5
0
0.5
1
1.5
Time(s)
Voltage(V
)
No faultcondition

International Journal of Advance Research in Engineering, Science & Technology (IJAREST) Volume 5, Issue 4, April 2018, e-ISSN: 2393-9877, print-ISSN: 2394-2444
All Rights Reserved, @IJAREST-2018 6
[C] WAVEFORM WHEN SLG (SINGLE LINE TO GROUND) FAULT CREATED
Figure 8 Waveform when SLG (single line to ground) fault created
When SLG fault is created in the system that particular phase voltage will decreases. As shown in figure 8
voltage of phase Y is decreases compared to phase R and phase B.As fault resistance is kept 0.2 ohm the fault
voltage (sag) is 0.2608.
[D] WAVEFORM WHEN DLG (DOUBLE LINE TO GROUND) FAULT IS CREATED
Figure 9 Waveform when DLG (double line to ground) fault is created
As shown in figure 9 when double line to ground fault is created in the system the voltage of two phases (Y and
R) will be decreases.
[E] WAVEFORM WHEN TLG (TRIPLE LINE TO GROUND) FAULT IS CREATED
Figure 10 Waveform when TLG (triple line to ground) fault is created
As shown in figure 10 when three phase fault is created the voltage dip is there for all three phases for the time
duration of 0.4 to 0.8s.Which will compensate by DSTATCOM.
0.2 0.3 0.4 0.5 0.6 0.7 0.8 0.9 1-1.5
-1
-0.5
0
0.5
1
1.5
Time (s)
Voltage (
V)
Single line to Ground fault
0.2 0.3 0.4 0.5 0.6 0.7 0.8 0.9 1-1.5
-1
-0.5
0
0.5
1
1.5
Time (s)
Voltage(V
)
Double Line to Ground fault
0.2 0.3 0.4 0.5 0.6 0.7 0.8 0.9 1-1.5
-1
-0.5
0
0.5
1
1.5
Time (s)
Voltage (
V)
Triple Line to Ground fault

International Journal of Advance Research in Engineering, Science & Technology (IJAREST) Volume 5, Issue 4, April 2018, e-ISSN: 2393-9877, print-ISSN: 2394-2444
All Rights Reserved, @IJAREST-2018 7
[F] MATLAB SIMULINK MODEL OF DSTATCOM FOR MITIGATION OF SAG:
Figure 11 MATLAB Simulink model of DSTATCOM for mitigation of sag
As shown in figure 11 the DSTATCOM model is simulated in MATLAB which will mitigate the sag at the time
of different fault.
[G] VOLTAGE DURING NO FAULT CONDITION:
Figure 12 Voltage during no fault condition
[H] VOLTAGE DIP DURING SINGLE L-G FAULT WITHOUT & WITH DSTATCOM:
The first simulation contains no D-STATCOM and single line to ground fault is applied, via a fault resistance of
0.66 Ω, during the period 0.4 TO 0.8 s. It is clearly seen from figure that there is a voltage dip created between
0.4 sec to 0.8 second due to single phase L-G fault. Similarly, a new set of simulations are carried out but now with the D-STATCOM connected to the system. Now as seen from the below figure 14 the dip is almost
mitigated.
After having D-STATCOM in the system, the voltage dip is mitigated during that particular interval of time and
there is no loss of voltage in the system.
0.2 0.3 0.4 0.5 0.6 0.7 0.8 0.9 10
0.2
0.4
0.6
0.8
1
1.2
1.4
1.6
1.8
2
Time (s)
Voltage(V
)
No Fault condition

International Journal of Advance Research in Engineering, Science & Technology (IJAREST) Volume 5, Issue 4, April 2018, e-ISSN: 2393-9877, print-ISSN: 2394-2444
All Rights Reserved, @IJAREST-2018 8
Figure 13 Voltage dip during single L-G fault without DSTATCOM
As shown in figure 13 the voltage sag is there when single line to ground fault is applied.
Figure 14 Voltage dip during single L-G fault with DSTATCOM
[I] Voltage Dip During double L-G Fault without & with D STATCOM:
\
Figure 15 Voltage Dip During double L-G Fault without D STATCOM As shown in figure the Double line to ground fault is created without connecting DSTATCOM. By connecting
DSTATCOM voltage sag can be mitigated.
Figure 16 Voltage Dip During double L-G Fault with D STATCOM
0.2 0.3 0.4 0.5 0.6 0.7 0.8 0.9 10
0.2
0.4
0.6
0.8
1
1.2
1.4
1.6
1.8
2
Time (s)
Voltage(V
)
Single Line to Ground fault without DSTATCOM
0.2 0.3 0.4 0.5 0.6 0.7 0.8 0.9 10
0.2
0.4
0.6
0.8
1
1.2
1.4
1.6
1.8
2
Time (s)
Voltage(V
)
Single Line to Ground fault with DSTATCOM
0.2 0.3 0.4 0.5 0.6 0.7 0.8 0.9 10
0.2
0.4
0.6
0.8
1
1.2
1.4
1.6
1.8
2
Time (s)
Voltage(V
)
Double Line to Ground fault without connecting DSTATCOM
0.2 0.3 0.4 0.5 0.6 0.7 0.8 0.9 10
0.2
0.4
0.6
0.8
1
1.2
1.4
1.6
1.8
2
Time (s)
Voltage(V
)
Double Line to Ground fault with DSTATCOM

International Journal of Advance Research in Engineering, Science & Technology (IJAREST) Volume 5, Issue 4, April 2018, e-ISSN: 2393-9877, print-ISSN: 2394-2444
All Rights Reserved, @IJAREST-2018 9
[I] Voltage Dip during Triple L-G Fault without & with D STATCOM
Figure 17 Voltage Dip during Triple L-G Fault without D STATCOM
As shown in figure 17 Triple line to ground fault is created and voltage dip is there which will mitigate by DSTATCOM.
Figure 18 Voltage Dip during Triple L-G Fault with D STATCOM
IX VALUES OF VOLTAGE IN DIFFERENT FAULT CONDITION WITHOUT DSTATCOM AND
WITH DSTATCOM:
Sr
No.
Type of Fault Values of voltage
without DSTATCOM
Values of voltage with
DSTATCOM
1 Normal condition 1.0195 1.0195
2 Single Line to Ground fault 0.83 1.014
3 Double Line to Ground fault 0.70 0.99
4 Triple Line to Ground fault 0.66 0.96
IX. CONCLUSION According to the Simulink model during different faults L-G, DLG and TLG voltage dip is there in the output
which can mitigate by connecting the DSTATCOM in the system. As shown in result voltage sag is almost reduces with DSTATCOM for particular fault period and different values of voltages is shown in the result
which proves the advantages of DSTATCOM.
0.2 0.3 0.4 0.5 0.6 0.7 0.8 0.9 10
0.2
0.4
0.6
0.8
1
1.2
1.4
1.6
1.8
2
Time (s)
Voltage(V
)
Triple Line to Ground fault without DSTATCOM
0.2 0.3 0.4 0.5 0.6 0.7 0.8 0.9 10
0.2
0.4
0.6
0.8
1
1.2
1.4
1.6
1.8
2
Time (s)
Voltage(V
)
Triple Line to Groundfault with DSTATCOM

International Journal of Advance Research in Engineering, Science & Technology (IJAREST) Volume 5, Issue 4, April 2018, e-ISSN: 2393-9877, print-ISSN: 2394-2444
All Rights Reserved, @IJAREST-2018 10
REFERENCE
1. Narain G. Hingorani, Understanding FACTS, IEEE Press, third edition.
2. R.K.Rojin “A REVIEW OF POWER QUALITY PROBLEMS AND SOLUTIONS IN ELECTRICAL POWER
SYSTEM”,IJAREEIE, Vol. 2,5605-5614, November 2013
3. Dr.Tarlochan Kaur1 and Sandeep Kakran,” Transient Stability Improvement of Long Transmission Line
System by Using SVC” IJAREEIE press, Vol. 1,218-227, October 2012
4. B Singh, R saha, A Chandra , K L Hadaad,”Review of STATCOM” IETDL press,vol 2,297-324,april 2008 5. Vinay M. Awasthi and Mrs. V. A. Huchche” Reactive Power Compensation using D-STATCOM”IEEE
press,vol 2,1-32,april-may-june 2016
6. Hirak K. Shah, P.N. Kapil, and M.T.Shah” Simulation & Analysis of Distribution Static Compensator (D-
STATCOM)”, IJEDR,vol 2,761-771,2014
7. IEEE Recommended Practice for Monitoring Electric Power Quality, in IEEE press, IEEE std. 1159-1995, New
York, june 2009
8. IEEE Standard 519-1992,”IEEE Recommended Practices and Requirements for Harmonic Control in Electrical
Power Systems”
9. Pierre Giroux and Hoang Le huy,”Modeling and simulation of distribution STATCOM using Simulink power
system blockset”IEEE Press, vol 1,1-6 September 2012
10. Himadri Ghosh, Pradip Kumar Saha, Goutam Kumar Panda “Performance Comparison between DVR and
DSTATCOM Used for Load Voltage Control in Distribution Side”,IJCDSpress, September 2013 11. Xiao-Ping Zhang, Christian Rehtanz, Bikash Pal, ”Flexible AC Transmission Systems: Modelling and Control”,
Springer Publications
12. K. R. Padiyar,” FACTS controller in power Transmission and Distribribution”, New age international
publishers Limited,
13. Delgado, J., “Gestão da Qualidade Total Aplicada ao Sector do Fornecimento da Energia Eléctrica”, Thesis
submitted to fulfilment of the requirements for the degree of PhD. in Electrotechnical Engineering, Coimbra,
September 2002.
14. McGranaghan, M., “Costs of Interruptions”, in proceedings of the Power Quality Conference, Rosemont,
Illinois, pp 1-8, 2002.
15. Suzette Albert, “Total Power Quality Solution Approach for Industrial Electrical Reliability”, August 2006 issue
of Power Quality World. 16. Mr. Ketan G. Damor and Dr. Dipesh M. Patel,” Comparison Of Different Fact Devices”, IJSTE, Vol. 1,12-
17,July 2014.
17. Rupali D. Burungale, C. R. Lakade,” DSTATCOM Performance for Voltage Sag, Swell Mitigation”,
IJAREEI,vol. Vol. 6, Issue 2, February 2017
18. M. Mohammadi, M. Akbari Nasa,” Voltage Sag Mitigation with D-STATCOM In Distribution Systems,”
Australian Journal of Basic and Applied Sciences”vol. 201-207, 2011.
19. Sandip K. Panda, Jianxin,” Effect of Pulse-Width Modulation Schemes on the Performance of Three-Phase
Voltage Source onverter”,IEEE,vol. 5, november 2007.
20. Lech M. Grzesiak, Bartlomiej Ufnalski, Arkadiusz Kaszewski,” An Efficient Discontinuous Pulse Width
Modulation Algorithm for Multileg Voltage-Source Converters”,IEEE,vol.1,august 2011.
21. H. R. Sukhesh and M. Mahesh,” Comparative Analysis of the Behavior of EKF Algorithm Integrated Classical
PI Controller and Cascade PI-Fuzzy Controller”, ICEECCOT,vol. 9 ,5383-2361,2017 22. Shusma J Patil and M S Aspalli,” Study of AI and PI Controller using SVPWM Technique for Induction Motor
Speed Control,” ICEECCOT,vol. 9 ,5386-2361,2017
23. Jang-Hwan Kim, Seung-Ki Sul, Hyosung Kim, and Jun-Keun Ji” A PWM Strategy for Four-Leg Voltage
Source Converters and Applications to a Novel Line Interactive UPS in a Three-Phase Four-Wire System”,
IEEE,vol.5,7803-8286,2004
24. D.R.PATIL & KOMAL K.MADHALE,” DESIGN AND SIMULATION STUDIES OF D-STATCOM FOR
VOLTAGE SAG, SWELL MITIGATION,”International journal,,vol 2 issue 1-2 ,2231-4407.