international journal - ijmer. · pdf filesurveillance system with ... influenza as a disease...
TRANSCRIPT
International
OPEN ACCESS Journal
Of Modern Engineering Research (IJMER)
| IJMER | ISSN: 2249–6645 www.ijmer.com | Vol. 7 | Iss. 10 | October. 2017 | 32 |
Age wise Comparative Positivity Rate of H1n1 Using Rt- Pcr in
The Year 2011- 2012
1Anil Kumar,
2Mukesh Kumar
1,2Auroprobe Laboratories Nbe Institute, Nh-58, Modi Nagar Ghaziabad (U.P) 201204, India
A project report submitted to Biotech Consortium of India Limited (BCIL)
I. INTRODUCTION Swine Influenza (swine flu), first isolated from a pig in 1930, is a respiratory disease of pigs. It is
caused by type A Influenza Virus (H1N1 subtype), which is the only type of Influenza virus to have caused
pandemics. Swine flu outbreaks in pigs occur regularly, causing high levels of illness and low death rates. Swine
Influenza viruses may circulate among swine throughout the year, but most outbreaks occurs during the late fall
and winter months similar to outbreaks in humans. Swine flu occasionally infects people without causing large
outbreaks. Only twelve cases of swine flu were reported in the United States over the last four years (January
2005 through January 2009). None of them caused deaths.
An outbreak of swine flu occurred among soldiers in Fort Dix, New Jersey, in 1976. At least four
soldiers became ill with swine flu and one died; all of these patients had previously been healthy. The virus was
transmitted to close contacts in a basic training environment, with limited transmission outside the basic training
group. The virus is thought to have circulated for a month and disappeared.The Influenza virus belongs to
Orthomyxoviridae family. It has three classes: A and B which only infect humans and C which is uncommon.
Its genetic material is made up of eight separate segments. The virus is enveloped with two important
projections on the surface; these are haemagglutinin that binds to cell receptors in target tissues and
Neuraminidase that cleaves to the sialic acid in the cell wall to release the progeny viruses. Influenza A has 16
different haemagglutinins and 9 different Neuraminidases. It is classified according to the types of
haemagglutinin and Neuraminidase on its surface, e.g. H1N1, H3N2 and H5N1.
ABSTRACT: The emergence and rapid spread of the 2009 H1N1 pandemic Influenza A virus (H1N1
pandemic) in humans highlights the importance of enhancing the capability of existing Influenza
surveillance system with tools for rapid identification of emerging and re-emerging viruses. One of the
new approaches is the RT-PCR Technology; which is based on analysis of base composition (BC) of
RT-PCR amplicons. Samples were collected from different collection centers and the specimen type
taken was throat and nasal swab in VTM. About 324 samples are collected from different collection
centers in Delhi NCR and Jaipur. Further isolating of RNA with Qiagen kit and detecting the specific
targets for H1N1 virus. All samples was examined by RT-PCR Technology in which 2.46% samples
showed H1N1 positive result among which 2.84% were Males and 2.03% were Females showing that
male are more susceptible to this infection rather than Females, while the remaining are negative for
H1N1 and out of the remaining sample examined 9.57% were found to be infected by Influenza A virus
only among which 9.65% were Males and 9.45% were Females showing that in case of Influenza A
virus also Males are more susceptible than Females. It means that, in both cases males are more prone
to Influenza virus infection.
The RT-PCR assay is a broad range Influenza virus identification tool that can be used directly on
clinical specimen for rapid and accurate detection of Influenza virus genes. The assay differentiates the
H1N1 pandemic from seasonal and other non human host virus.
Age wise Comparative Positivity Rate of H1n1 Using Rt- Pcr in The Year 2011- 2012
| IJMER | ISSN: 2249–6645 www.ijmer.com | Vol. 7 | Iss. 9 | September. 2017 | 33 |
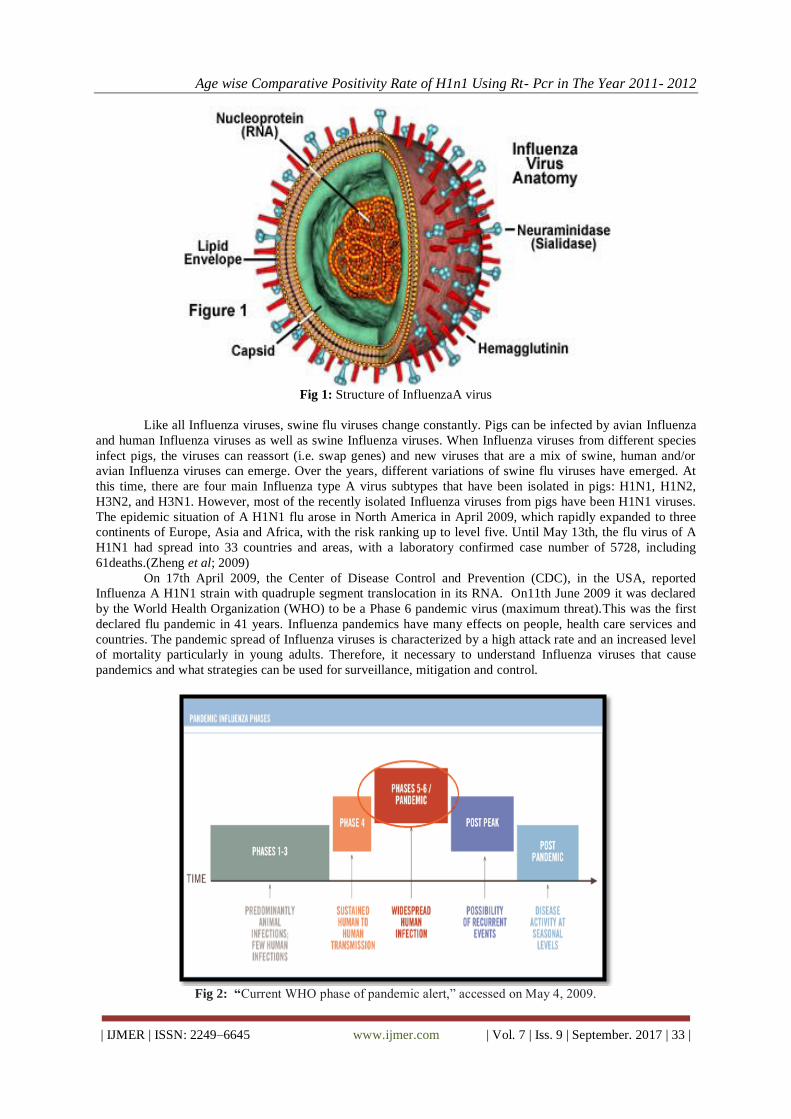
Fig 1: Structure of InfluenzaA virus
Like all Influenza viruses, swine flu viruses change constantly. Pigs can be infected by avian Influenza
and human Influenza viruses as well as swine Influenza viruses. When Influenza viruses from different species
infect pigs, the viruses can reassort (i.e. swap genes) and new viruses that are a mix of swine, human and/or
avian Influenza viruses can emerge. Over the years, different variations of swine flu viruses have emerged. At
this time, there are four main Influenza type A virus subtypes that have been isolated in pigs: H1N1, H1N2,
H3N2, and H3N1. However, most of the recently isolated Influenza viruses from pigs have been H1N1 viruses.
The epidemic situation of A H1N1 flu arose in North America in April 2009, which rapidly expanded to three
continents of Europe, Asia and Africa, with the risk ranking up to level five. Until May 13th, the flu virus of A
H1N1 had spread into 33 countries and areas, with a laboratory confirmed case number of 5728, including
61deaths.(Zheng et al; 2009)
On 17th April 2009, the Center of Disease Control and Prevention (CDC), in the USA, reported
Influenza A H1N1 strain with quadruple segment translocation in its RNA. On11th June 2009 it was declared
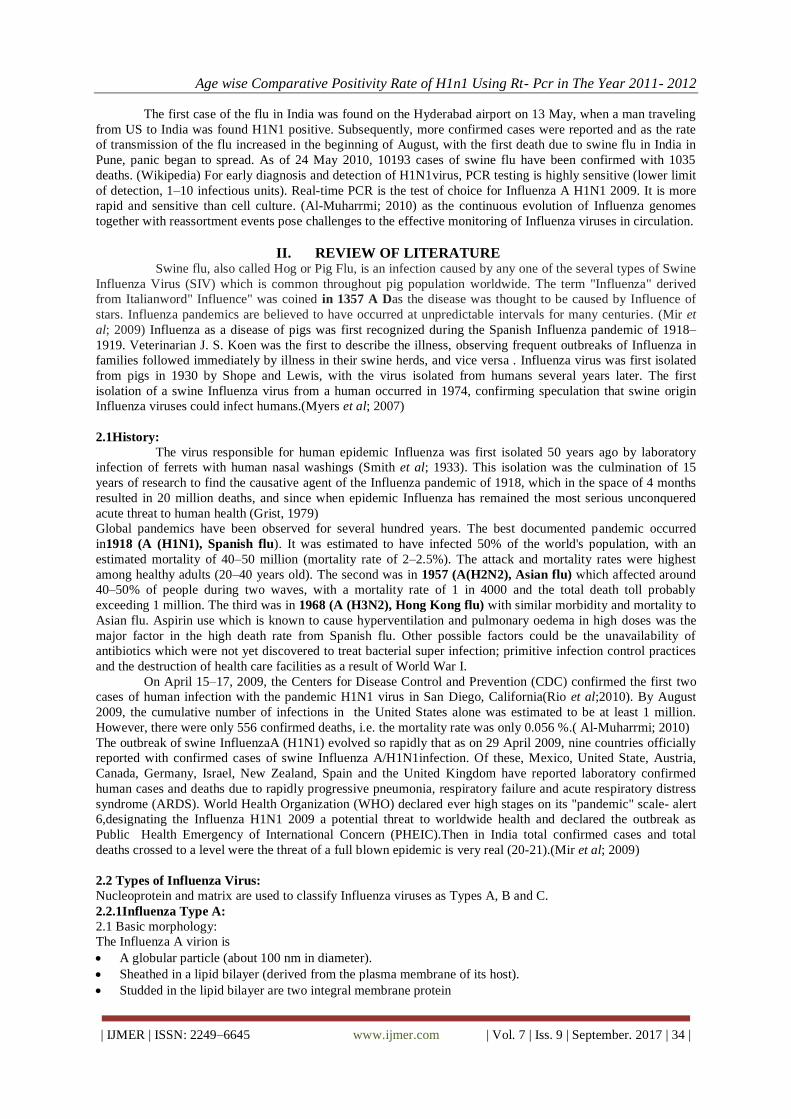
by the World Health Organization (WHO) to be a Phase 6 pandemic virus (maximum threat).This was the first
declared flu pandemic in 41 years. Influenza pandemics have many effects on people, health care services and
countries. The pandemic spread of Influenza viruses is characterized by a high attack rate and an increased level
of mortality particularly in young adults. Therefore, it necessary to understand Influenza viruses that cause
pandemics and what strategies can be used for surveillance, mitigation and control.
Fig 2: “Current WHO phase of pandemic alert,” accessed on May 4, 2009.
Age wise Comparative Positivity Rate of H1n1 Using Rt- Pcr in The Year 2011- 2012
| IJMER | ISSN: 2249–6645 www.ijmer.com | Vol. 7 | Iss. 9 | September. 2017 | 34 |
The first case of the flu in India was found on the Hyderabad airport on 13 May, when a man traveling
from US to India was found H1N1 positive. Subsequently, more confirmed cases were reported and as the rate
of transmission of the flu increased in the beginning of August, with the first death due to swine flu in India in
Pune, panic began to spread. As of 24 May 2010, 10193 cases of swine flu have been confirmed with 1035
deaths. (Wikipedia) For early diagnosis and detection of H1N1virus, PCR testing is highly sensitive (lower limit
of detection, 1–10 infectious units). Real-time PCR is the test of choice for Influenza A H1N1 2009. It is more
rapid and sensitive than cell culture. (Al-Muharrmi; 2010) as the continuous evolution of Influenza genomes
together with reassortment events pose challenges to the effective monitoring of Influenza viruses in circulation.
II. REVIEW OF LITERATURE Swine flu, also called Hog or Pig Flu, is an infection caused by any one of the several types of Swine
Influenza Virus (SIV) which is common throughout pig population worldwide. The term "Influenza" derived
from Italianword" Influence" was coined in 1357 A Das the disease was thought to be caused by Influence of
stars. Influenza pandemics are believed to have occurred at unpredictable intervals for many centuries. (Mir et
al; 2009) Influenza as a disease of pigs was first recognized during the Spanish Influenza pandemic of 1918–
1919. Veterinarian J. S. Koen was the first to describe the illness, observing frequent outbreaks of Influenza in
families followed immediately by illness in their swine herds, and vice versa . Influenza virus was first isolated
from pigs in 1930 by Shope and Lewis, with the virus isolated from humans several years later. The first
isolation of a swine Influenza virus from a human occurred in 1974, confirming speculation that swine origin
Influenza viruses could infect humans.(Myers et al; 2007)
2.1History:
The virus responsible for human epidemic Influenza was first isolated 50 years ago by laboratory
infection of ferrets with human nasal washings (Smith et al; 1933). This isolation was the culmination of 15
years of research to find the causative agent of the Influenza pandemic of 1918, which in the space of 4 months
resulted in 20 million deaths, and since when epidemic Influenza has remained the most serious unconquered
acute threat to human health (Grist, 1979)
Global pandemics have been observed for several hundred years. The best documented pandemic occurred
in1918 (A (H1N1), Spanish flu). It was estimated to have infected 50% of the world's population, with an
estimated mortality of 40–50 million (mortality rate of 2–2.5%). The attack and mortality rates were highest
among healthy adults (20–40 years old). The second was in 1957 (A(H2N2), Asian flu) which affected around
40–50% of people during two waves, with a mortality rate of 1 in 4000 and the total death toll probably
exceeding 1 million. The third was in 1968 (A (H3N2), Hong Kong flu) with similar morbidity and mortality to
Asian flu. Aspirin use which is known to cause hyperventilation and pulmonary oedema in high doses was the
major factor in the high death rate from Spanish flu. Other possible factors could be the unavailability of
antibiotics which were not yet discovered to treat bacterial super infection; primitive infection control practices
and the destruction of health care facilities as a result of World War I.
On April 15–17, 2009, the Centers for Disease Control and Prevention (CDC) confirmed the first two
cases of human infection with the pandemic H1N1 virus in San Diego, California(Rio et al;2010). By August
2009, the cumulative number of infections in the United States alone was estimated to be at least 1 million.
However, there were only 556 confirmed deaths, i.e. the mortality rate was only 0.056 %.( Al-Muharrmi; 2010)
The outbreak of swine InfluenzaA (H1N1) evolved so rapidly that as on 29 April 2009, nine countries officially
reported with confirmed cases of swine Influenza A/H1N1infection. Of these, Mexico, United State, Austria,
Canada, Germany, Israel, New Zealand, Spain and the United Kingdom have reported laboratory confirmed
human cases and deaths due to rapidly progressive pneumonia, respiratory failure and acute respiratory distress
syndrome (ARDS). World Health Organization (WHO) declared ever high stages on its "pandemic" scale- alert
6,designating the Influenza H1N1 2009 a potential threat to worldwide health and declared the outbreak as
Public Health Emergency of International Concern (PHEIC).Then in India total confirmed cases and total
deaths crossed to a level were the threat of a full blown epidemic is very real (20-21).(Mir et al; 2009)
2.2 Types of Influenza Virus:
Nucleoprotein and matrix are used to classify Influenza viruses as Types A, B and C.
2.2.1Influenza Type A:
2.1 Basic morphology:
The Influenza A virion is
A globular particle (about 100 nm in diameter).
Sheathed in a lipid bilayer (derived from the plasma membrane of its host).
Studded in the lipid bilayer are two integral membrane protein
Age wise Comparative Positivity Rate of H1n1 Using Rt- Pcr in The Year 2011- 2012
| IJMER | ISSN: 2249–6645 www.ijmer.com | Vol. 7 | Iss. 9 | September. 2017 | 35 |
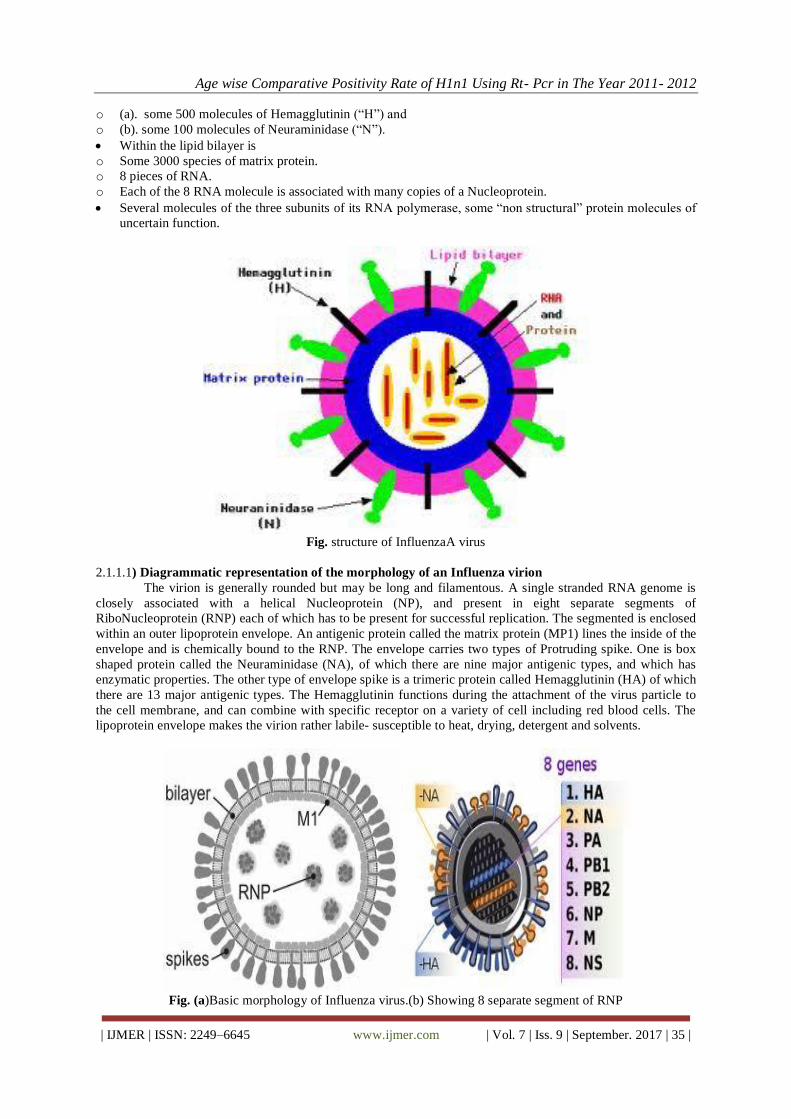
o (a). some 500 molecules of Hemagglutinin (“H”) and
o (b). some 100 molecules of Neuraminidase (“N”).
Within the lipid bilayer is
o Some 3000 species of matrix protein.
o 8 pieces of RNA.
o Each of the 8 RNA molecule is associated with many copies of a Nucleoprotein.
Several molecules of the three subunits of its RNA polymerase, some “non structural” protein molecules of
uncertain function.
Fig. structure of InfluenzaA virus
2.1.1.1) Diagrammatic representation of the morphology of an Influenza virion
The virion is generally rounded but may be long and filamentous. A single stranded RNA genome is
closely associated with a helical Nucleoprotein (NP), and present in eight separate segments of
RiboNucleoprotein (RNP) each of which has to be present for successful replication. The segmented is enclosed
within an outer lipoprotein envelope. An antigenic protein called the matrix protein (MP1) lines the inside of the
envelope and is chemically bound to the RNP. The envelope carries two types of Protruding spike. One is box
shaped protein called the Neuraminidase (NA), of which there are nine major antigenic types, and which has
enzymatic properties. The other type of envelope spike is a trimeric protein called Hemagglutinin (HA) of which
there are 13 major antigenic types. The Hemagglutinin functions during the attachment of the virus particle to
the cell membrane, and can combine with specific receptor on a variety of cell including red blood cells. The
lipoprotein envelope makes the virion rather labile- susceptible to heat, drying, detergent and solvents.
Fig. (a)Basic morphology of Influenza virus.(b) Showing 8 separate segment of RNP
Age wise Comparative Positivity Rate of H1n1 Using Rt- Pcr in The Year 2011- 2012
| IJMER | ISSN: 2249–6645 www.ijmer.com | Vol. 7 | Iss. 9 | September. 2017 | 36 |
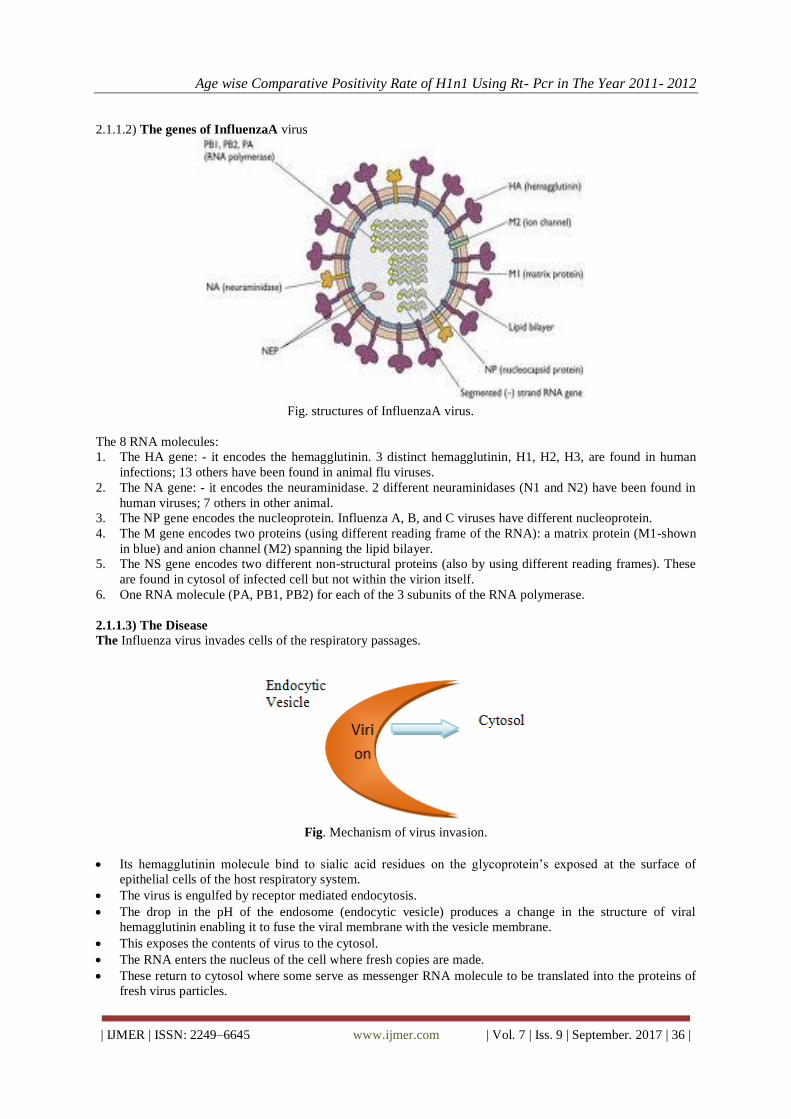
2.1.1.2) The genes of InfluenzaA virus
Fig. structures of InfluenzaA virus.
The 8 RNA molecules:
1. The HA gene: - it encodes the hemagglutinin. 3 distinct hemagglutinin, H1, H2, H3, are found in human
infections; 13 others have been found in animal flu viruses.
2. The NA gene: - it encodes the neuraminidase. 2 different neuraminidases (N1 and N2) have been found in
human viruses; 7 others in other animal.
3. The NP gene encodes the nucleoprotein. Influenza A, B, and C viruses have different nucleoprotein.
4. The M gene encodes two proteins (using different reading frame of the RNA): a matrix protein (M1-shown
in blue) and anion channel (M2) spanning the lipid bilayer.
5. The NS gene encodes two different non-structural proteins (also by using different reading frames). These
are found in cytosol of infected cell but not within the virion itself.
6. One RNA molecule (PA, PB1, PB2) for each of the 3 subunits of the RNA polymerase.
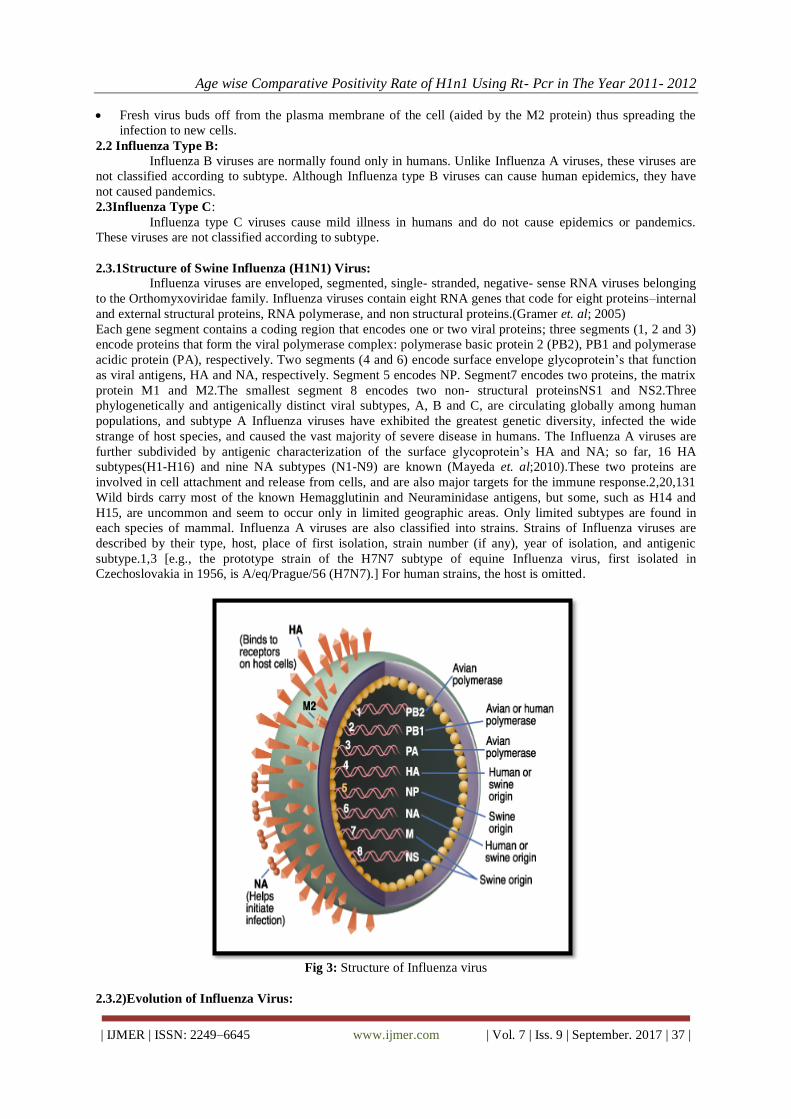
2.1.1.3) The Disease
The Influenza virus invades cells of the respiratory passages.
Fig. Mechanism of virus invasion.
Its hemagglutinin molecule bind to sialic acid residues on the glycoprotein‟s exposed at the surface of
epithelial cells of the host respiratory system.
The virus is engulfed by receptor mediated endocytosis.
The drop in the pH of the endosome (endocytic vesicle) produces a change in the structure of viral
hemagglutinin enabling it to fuse the viral membrane with the vesicle membrane.
This exposes the contents of virus to the cytosol.
The RNA enters the nucleus of the cell where fresh copies are made.
These return to cytosol where some serve as messenger RNA molecule to be translated into the proteins of
fresh virus particles.
Age wise Comparative Positivity Rate of H1n1 Using Rt- Pcr in The Year 2011- 2012
| IJMER | ISSN: 2249–6645 www.ijmer.com | Vol. 7 | Iss. 9 | September. 2017 | 37 |
Fresh virus buds off from the plasma membrane of the cell (aided by the M2 protein) thus spreading the
infection to new cells.
2.2 Influenza Type B:
Influenza B viruses are normally found only in humans. Unlike Influenza A viruses, these viruses are
not classified according to subtype. Although Influenza type B viruses can cause human epidemics, they have
not caused pandemics.
2.3Influenza Type C:
Influenza type C viruses cause mild illness in humans and do not cause epidemics or pandemics.
These viruses are not classified according to subtype.
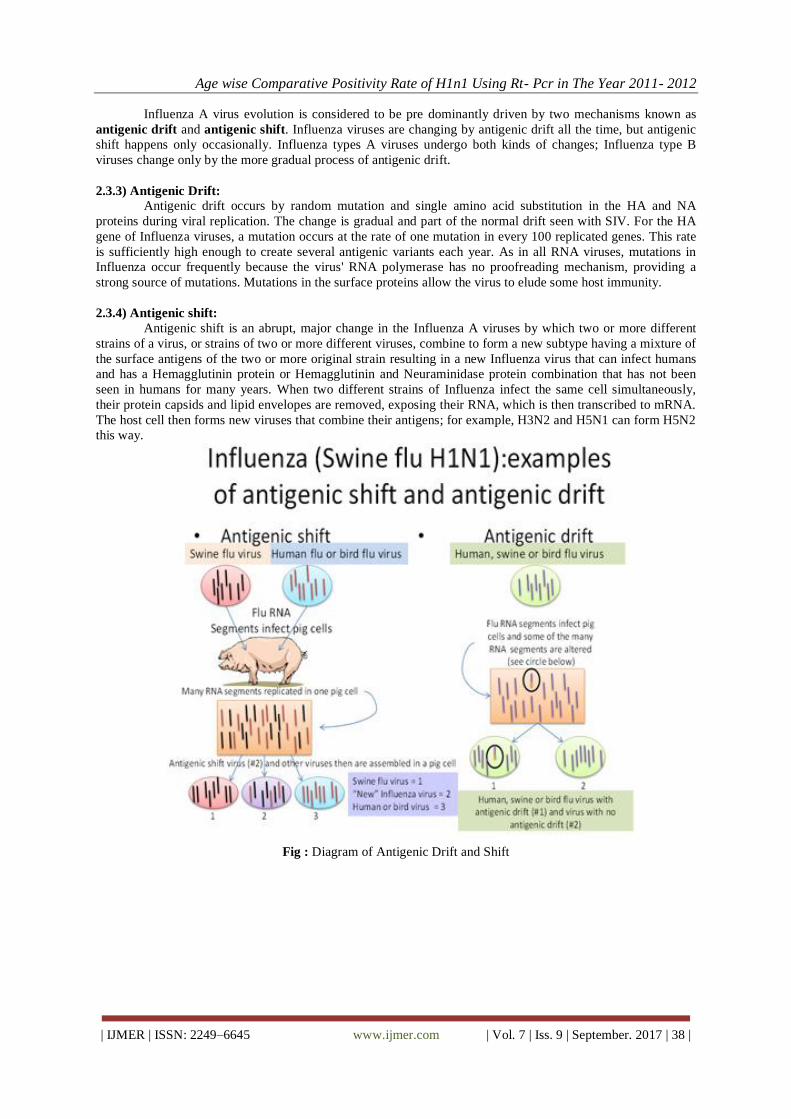
2.3.1Structure of Swine Influenza (H1N1) Virus:
Influenza viruses are enveloped, segmented, single- stranded, negative- sense RNA viruses belonging
to the Orthomyxoviridae family. Influenza viruses contain eight RNA genes that code for eight proteins–internal
and external structural proteins, RNA polymerase, and non structural proteins.(Gramer et. al; 2005)
Each gene segment contains a coding region that encodes one or two viral proteins; three segments (1, 2 and 3)
encode proteins that form the viral polymerase complex: polymerase basic protein 2 (PB2), PB1 and polymerase
acidic protein (PA), respectively. Two segments (4 and 6) encode surface envelope glycoprotein‟s that function
as viral antigens, HA and NA, respectively. Segment 5 encodes NP. Segment7 encodes two proteins, the matrix
protein M1 and M2.The smallest segment 8 encodes two non- structural proteinsNS1 and NS2.Three
phylogenetically and antigenically distinct viral subtypes, A, B and C, are circulating globally among human
populations, and subtype A Influenza viruses have exhibited the greatest genetic diversity, infected the wide
strange of host species, and caused the vast majority of severe disease in humans. The Influenza A viruses are
further subdivided by antigenic characterization of the surface glycoprotein‟s HA and NA; so far, 16 HA
subtypes(H1-H16) and nine NA subtypes (N1-N9) are known (Mayeda et. al;2010).These two proteins are
involved in cell attachment and release from cells, and are also major targets for the immune response.2,20,131
Wild birds carry most of the known Hemagglutinin and Neuraminidase antigens, but some, such as H14 and
H15, are uncommon and seem to occur only in limited geographic areas. Only limited subtypes are found in
each species of mammal. Influenza A viruses are also classified into strains. Strains of Influenza viruses are
described by their type, host, place of first isolation, strain number (if any), year of isolation, and antigenic
subtype.1,3 [e.g., the prototype strain of the H7N7 subtype of equine Influenza virus, first isolated in
Czechoslovakia in 1956, is A/eq/Prague/56 (H7N7).] For human strains, the host is omitted.
Fig 3: Structure of Influenza virus
2.3.2)Evolution of Influenza Virus:
Age wise Comparative Positivity Rate of H1n1 Using Rt- Pcr in The Year 2011- 2012
| IJMER | ISSN: 2249–6645 www.ijmer.com | Vol. 7 | Iss. 9 | September. 2017 | 38 |
Influenza A virus evolution is considered to be pre dominantly driven by two mechanisms known as
antigenic drift and antigenic shift. Influenza viruses are changing by antigenic drift all the time, but antigenic
shift happens only occasionally. Influenza types A viruses undergo both kinds of changes; Influenza type B
viruses change only by the more gradual process of antigenic drift.
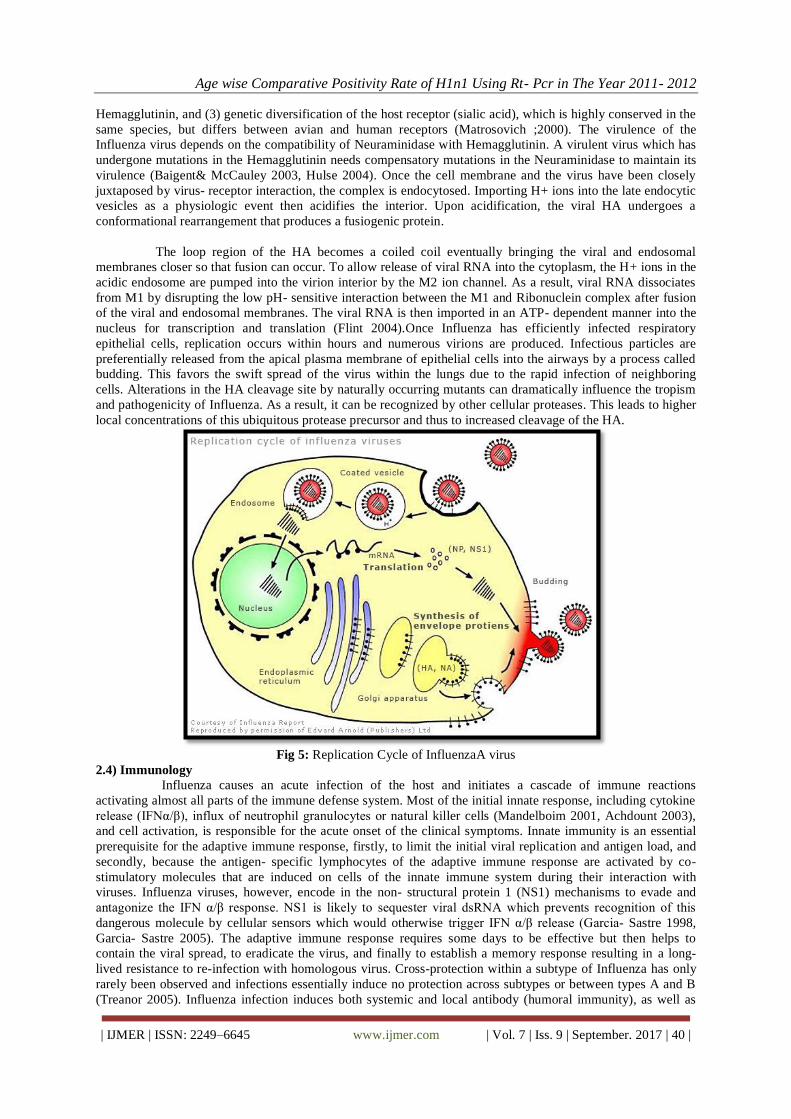
2.3.3) Antigenic Drift:
Antigenic drift occurs by random mutation and single amino acid substitution in the HA and NA
proteins during viral replication. The change is gradual and part of the normal drift seen with SIV. For the HA
gene of Influenza viruses, a mutation occurs at the rate of one mutation in every 100 replicated genes. This rate
is sufficiently high enough to create several antigenic variants each year. As in all RNA viruses, mutations in
Influenza occur frequently because the virus' RNA polymerase has no proofreading mechanism, providing a
strong source of mutations. Mutations in the surface proteins allow the virus to elude some host immunity.
2.3.4) Antigenic shift:
Antigenic shift is an abrupt, major change in the Influenza A viruses by which two or more different
strains of a virus, or strains of two or more different viruses, combine to form a new subtype having a mixture of
the surface antigens of the two or more original strain resulting in a new Influenza virus that can infect humans
and has a Hemagglutinin protein or Hemagglutinin and Neuraminidase protein combination that has not been
seen in humans for many years. When two different strains of Influenza infect the same cell simultaneously,
their protein capsids and lipid envelopes are removed, exposing their RNA, which is then transcribed to mRNA.
The host cell then forms new viruses that combine their antigens; for example, H3N2 and H5N1 can form H5N2
this way.
Fig : Diagram of Antigenic Drift and Shift

Age wise Comparative Positivity Rate of H1n1 Using Rt- Pcr in The Year 2011- 2012
| IJMER | ISSN: 2249–6645 www.ijmer.com | Vol. 7 | Iss. 9 | September. 2017 | 39 |
Fig 4: Diagram of Antigenic Drift and Shift
2.3.5)_Transmission between pigs
Influenza is quite common in pigs, with about half of breeding pigs having been exposed to the virus
in the US. Antibodies to the virus are also common in pigs in other countries.
The main route of transmission is through direct contact between infected and uninfected animals. These close
contacts are particularly common during animal transport. Intensive farming may also increase the risk of
transmission, as the pigs are raised in very close proximity to each other. The direct transfer of the virus
probably occurs either by pigs touching noses, or through dried mucus. Airborne transmissions through the
aerosols produced by pigs coughing or sneezing are also an important means of infection. The virus usually
spreads quickly through a herd, infecting all the pigs within just a few days. Transmission may also occur
through wild animals, such as wild boar, which can spread the disease between farms.
Transmission to humans
People who work with poultry and swine, especially people with intense exposures, are at increased
risk of zoonotic infection with Influenza virus endemic in these animals, and constitute a population of human
hosts in which zoonosis and reassortment can co- occur. Vaccination of these workers against Influenza and
surveillance for new Influenza strains among this population may therefore be an important public health
measure. Transmission of Influenza from swine to humans who work with swine was documented in a small
surveillance study performed in 2004 at the University of Iowa. This study among others forms the basis of a
recommendation that people whose jobs involve handling poultry and swine be the focus of increased public
health surveillance. Other professions at particular risk of infection are veterinarians and meat processing
workers, although the risk of infection for both of these groups is lower than that of farm workers.
2.3.6) Pathogenesis & Replication
The predominant way in which Influenza is transmitted is from person to person by aerosols and
droplets. Influenza then enters the host through the respiratory tract. In a human lung there are about 300 million
terminal sacs, called alveoli, Small droplets with a diameter of approximately 1 to 4 µm precipitate in the small
airways. Much larger particles are either not able to enter the respiratory system or are deposited in the upper
respiratory tract. The respiratory tract is covered with a mucociliary layer consisting of ciliated cells, mucus-
secreting cells and glands. Foreign particles in the nasal cavity or upper respiratory tract are trapped in mucus,
carried back to the throat, and swallowed. From the lower respiratory tract foreign particles are brought up by
the ciliary action of epithelial cells. In the alveoli that lack cilia or mucus, macrophages are responsible for
destroying particles.
Binding to the host cells
In Influenza infection, the receptor binding site of viral Hemagglutinin (HA) is required for binding
to galactose bound sialic acid on the surface of host cells (Weis 1988). Certain areas of the binding site of HA
are highly conserved between subtypes of the Influenza virus (Daniels 1984). Hosts may prevent the attachment
by several mechanisms: (1) specific immune response and secretion of specific IgA antibodies, (2) unspecific
mechanisms, such as mucociliary clearance or production of mucoproteins that able to bind to viral
Age wise Comparative Positivity Rate of H1n1 Using Rt- Pcr in The Year 2011- 2012
| IJMER | ISSN: 2249–6645 www.ijmer.com | Vol. 7 | Iss. 9 | September. 2017 | 40 |
Hemagglutinin, and (3) genetic diversification of the host receptor (sialic acid), which is highly conserved in the
same species, but differs between avian and human receptors (Matrosovich ;2000). The virulence of the
Influenza virus depends on the compatibility of Neuraminidase with Hemagglutinin. A virulent virus which has
undergone mutations in the Hemagglutinin needs compensatory mutations in the Neuraminidase to maintain its
virulence (Baigent& McCauley 2003, Hulse 2004). Once the cell membrane and the virus have been closely
juxtaposed by virus- receptor interaction, the complex is endocytosed. Importing H+ ions into the late endocytic
vesicles as a physiologic event then acidifies the interior. Upon acidification, the viral HA undergoes a
conformational rearrangement that produces a fusiogenic protein.
The loop region of the HA becomes a coiled coil eventually bringing the viral and endosomal
membranes closer so that fusion can occur. To allow release of viral RNA into the cytoplasm, the H+ ions in the
acidic endosome are pumped into the virion interior by the M2 ion channel. As a result, viral RNA dissociates
from M1 by disrupting the low pH- sensitive interaction between the M1 and Ribonuclein complex after fusion
of the viral and endosomal membranes. The viral RNA is then imported in an ATP- dependent manner into the
nucleus for transcription and translation (Flint 2004).Once Influenza has efficiently infected respiratory
epithelial cells, replication occurs within hours and numerous virions are produced. Infectious particles are
preferentially released from the apical plasma membrane of epithelial cells into the airways by a process called
budding. This favors the swift spread of the virus within the lungs due to the rapid infection of neighboring
cells. Alterations in the HA cleavage site by naturally occurring mutants can dramatically influence the tropism
and pathogenicity of Influenza. As a result, it can be recognized by other cellular proteases. This leads to higher
local concentrations of this ubiquitous protease precursor and thus to increased cleavage of the HA.
Fig 5: Replication Cycle of InfluenzaA virus
2.4) Immunology
Influenza causes an acute infection of the host and initiates a cascade of immune reactions
activating almost all parts of the immune defense system. Most of the initial innate response, including cytokine
release (IFNα/β), influx of neutrophil granulocytes or natural killer cells (Mandelboim 2001, Achdount 2003),
and cell activation, is responsible for the acute onset of the clinical symptoms. Innate immunity is an essential
prerequisite for the adaptive immune response, firstly, to limit the initial viral replication and antigen load, and
secondly, because the antigen- specific lymphocytes of the adaptive immune response are activated by co-
stimulatory molecules that are induced on cells of the innate immune system during their interaction with
viruses. Influenza viruses, however, encode in the non- structural protein 1 (NS1) mechanisms to evade and
antagonize the IFN α/β response. NS1 is likely to sequester viral dsRNA which prevents recognition of this
dangerous molecule by cellular sensors which would otherwise trigger IFN α/β release (Garcia- Sastre 1998,
Garcia- Sastre 2005). The adaptive immune response requires some days to be effective but then helps to
contain the viral spread, to eradicate the virus, and finally to establish a memory response resulting in a long-
lived resistance to re-infection with homologous virus. Cross-protection within a subtype of Influenza has only
rarely been observed and infections essentially induce no protection across subtypes or between types A and B
(Treanor 2005). Influenza infection induces both systemic and local antibody (humoral immunity), as well as
Age wise Comparative Positivity Rate of H1n1 Using Rt- Pcr in The Year 2011- 2012
| IJMER | ISSN: 2249–6645 www.ijmer.com | Vol. 7 | Iss. 9 | September. 2017 | 41 |
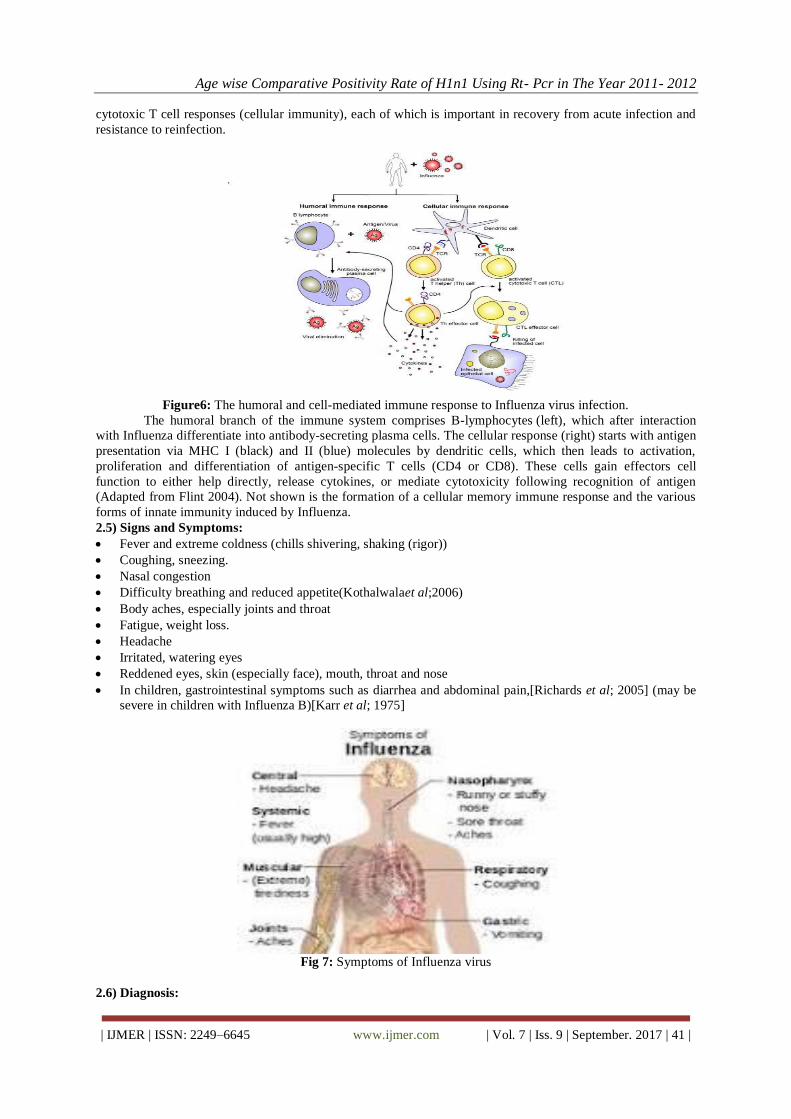
cytotoxic T cell responses (cellular immunity), each of which is important in recovery from acute infection and
resistance to reinfection.
Figure6: The humoral and cell-mediated immune response to Influenza virus infection.
The humoral branch of the immune system comprises B-lymphocytes (left), which after interaction
with Influenza differentiate into antibody-secreting plasma cells. The cellular response (right) starts with antigen
presentation via MHC I (black) and II (blue) molecules by dendritic cells, which then leads to activation,
proliferation and differentiation of antigen-specific T cells (CD4 or CD8). These cells gain effectors cell
function to either help directly, release cytokines, or mediate cytotoxicity following recognition of antigen
(Adapted from Flint 2004). Not shown is the formation of a cellular memory immune response and the various
forms of innate immunity induced by Influenza.
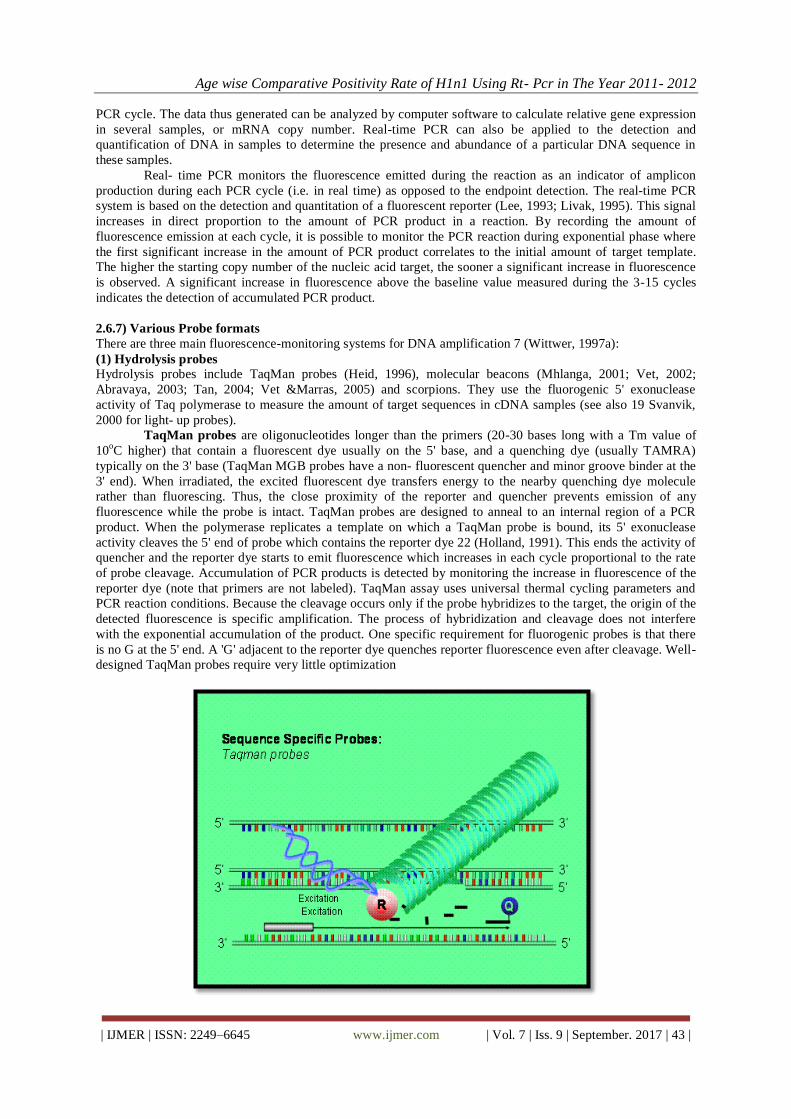
2.5) Signs and Symptoms:
Fever and extreme coldness (chills shivering, shaking (rigor))
Coughing, sneezing.
Nasal congestion
Difficulty breathing and reduced appetite(Kothalwalaet al;2006)
Body aches, especially joints and throat
Fatigue, weight loss.
Headache
Irritated, watering eyes
Reddened eyes, skin (especially face), mouth, throat and nose
In children, gastrointestinal symptoms such as diarrhea and abdominal pain,[Richards et al; 2005] (may be
severe in children with Influenza B)[Karr et al; 1975]
Fig 7: Symptoms of Influenza virus
2.6) Diagnosis:

Age wise Comparative Positivity Rate of H1n1 Using Rt- Pcr in The Year 2011- 2012
| IJMER | ISSN: 2249–6645 www.ijmer.com | Vol. 7 | Iss. 9 | September. 2017 | 42 |
InfluenzaA H1N1 2009 virus can be detected in respiratory specimens by different tests. These tests
differ in their sensitivity, specificity and ability to distinguish between InfluenzaA subtypes (e.g. 2009 H1N1
versus seasonal H1N1 versus seasonal H3N2 viruses).
2.6.1) Rapid Influenza diagnostic tests (RIDTs), have variable sensitivities and specificities, some experts
having reported sensitivity of 47%, and specificity of 86%.48 Others have reported sensitivity of 51%, and
specificity of 99% (Faixet al;2009).
2.6.2) Direct immunofluorescence (DIF) has variable sensitivities (47–93%), but high specificity ≥96 %(Faix
et al; 2009). Some reports claim that the DIF has a sensitivity of 93%, specificity of 97%, positive predictive
value of 95% and negative predictive value of 96%(Pollock et al;2009).
2.6.3) Viral culture was the gold standard for Influenza virus testing; however, it is only 88.9% sensitive for
InfluenzaA H1N1 2009(Ginocchioet al; 2009). Therefore, a negative viral culture does not exclude infection
with InfluenzaA H1N1 2009(CDC; 2009). Some researchers have described detection of the virus using
microarray techniques (Lu et al; 2009)
2.6.4) PCR testing is highly sensitive (lower limit of detection, 1–10 infectious units)(Petric etal; 2006). Real-
time PCR is the test of choice for InfluenzaA H1N1 2009(WHO; 2009). It is more rapid and sensitive than cell
culture. However, PCR is expensive and labour intensive; therefore, it is impractical to investigate all affected
patients because of the large number of people infected (Al-Muharrmi; 2010)
2.6.5) RT-PCR for Diagnosis of H1N1:
The most Powerful DNA amplification technology known as on date In molecular biology first
described by (Higuchi, 1992; Higuchi, 1993). Real- Time Polymerase Chain Reaction, also called quantitative
Real Time Polymerase Chain Reaction (qPCR) or kinetic polymerase chain reaction, is a laboratory technique
based on the polymerase chain reaction, which is used to amplify and simultaneously quantify a targeted DNA
molecule. It enables both detection and quantification (as absolute number of copies or relative amount when
normalized to DNA input or additional normalizing genes) of a specific sequence in a DNA sample. The
procedure follows the general principle of polymerase chain reaction; its key feature is that the amplified DNA
is quantified as it accumulates in the reaction in real time after each amplification cycle. Two common methods
of quantification are the use of fluorescent dyes that intercalate with double- stranded DNA, and modified DNA
oligonucleotide probes that fluoresce when hybridized with a complementary DNA.
Real Time PCR
2.6.6) Principle of RT-PCR:
Real time quantitative PCR uses fluorophores in order to detect levels of gene expression Cells in all
organisms regulate their cellular activities by activating or deactivating the expression of their genes. Gene
expression is usually directly proportional to the number of copies of messenger RNA (mRNA) of a particular
gene in a cell or tissue. In order to robustly detect and quantify gene expression from small amounts of RNA,
amplification of the gene transcript is necessary. The polymerase chain reaction is a common method for
amplifying DNA; for mRNA- based PCR the RNA sample is first reverse transcribed to cDNA with reverse
transcriptase. Development of PCR technologies based on reverse transcription and fluorophores permits
measurement of DNA amplification during PCR in real time, i.e., the amplified product is measured at each
Age wise Comparative Positivity Rate of H1n1 Using Rt- Pcr in The Year 2011- 2012
| IJMER | ISSN: 2249–6645 www.ijmer.com | Vol. 7 | Iss. 9 | September. 2017 | 43 |
PCR cycle. The data thus generated can be analyzed by computer software to calculate relative gene expression
in several samples, or mRNA copy number. Real-time PCR can also be applied to the detection and
quantification of DNA in samples to determine the presence and abundance of a particular DNA sequence in
these samples.
Real- time PCR monitors the fluorescence emitted during the reaction as an indicator of amplicon
production during each PCR cycle (i.e. in real time) as opposed to the endpoint detection. The real-time PCR
system is based on the detection and quantitation of a fluorescent reporter (Lee, 1993; Livak, 1995). This signal
increases in direct proportion to the amount of PCR product in a reaction. By recording the amount of
fluorescence emission at each cycle, it is possible to monitor the PCR reaction during exponential phase where
the first significant increase in the amount of PCR product correlates to the initial amount of target template.
The higher the starting copy number of the nucleic acid target, the sooner a significant increase in fluorescence
is observed. A significant increase in fluorescence above the baseline value measured during the 3-15 cycles
indicates the detection of accumulated PCR product.
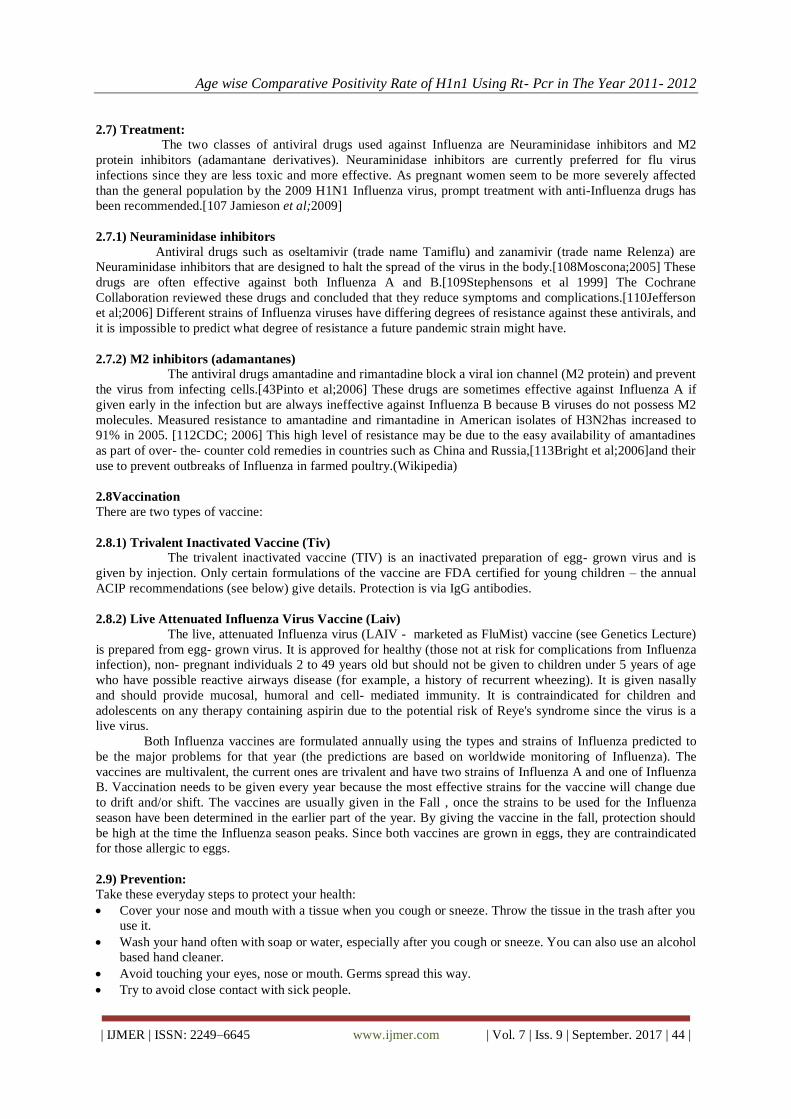
2.6.7) Various Probe formats
There are three main fluorescence-monitoring systems for DNA amplification 7 (Wittwer, 1997a):
(1) Hydrolysis probes
Hydrolysis probes include TaqMan probes (Heid, 1996), molecular beacons (Mhlanga, 2001; Vet, 2002;
Abravaya, 2003; Tan, 2004; Vet &Marras, 2005) and scorpions. They use the fluorogenic 5' exonuclease
activity of Taq polymerase to measure the amount of target sequences in cDNA samples (see also 19 Svanvik,
2000 for light- up probes).
TaqMan probes are oligonucleotides longer than the primers (20-30 bases long with a Tm value of
10oC higher) that contain a fluorescent dye usually on the 5' base, and a quenching dye (usually TAMRA)
typically on the 3' base (TaqMan MGB probes have a non- fluorescent quencher and minor groove binder at the
3' end). When irradiated, the excited fluorescent dye transfers energy to the nearby quenching dye molecule
rather than fluorescing. Thus, the close proximity of the reporter and quencher prevents emission of any
fluorescence while the probe is intact. TaqMan probes are designed to anneal to an internal region of a PCR
product. When the polymerase replicates a template on which a TaqMan probe is bound, its 5' exonuclease
activity cleaves the 5' end of probe which contains the reporter dye 22 (Holland, 1991). This ends the activity of
quencher and the reporter dye starts to emit fluorescence which increases in each cycle proportional to the rate
of probe cleavage. Accumulation of PCR products is detected by monitoring the increase in fluorescence of the
reporter dye (note that primers are not labeled). TaqMan assay uses universal thermal cycling parameters and
PCR reaction conditions. Because the cleavage occurs only if the probe hybridizes to the target, the origin of the
detected fluorescence is specific amplification. The process of hybridization and cleavage does not interfere
with the exponential accumulation of the product. One specific requirement for fluorogenic probes is that there
is no G at the 5' end. A 'G' adjacent to the reporter dye quenches reporter fluorescence even after cleavage. Well-
designed TaqMan probes require very little optimization
Age wise Comparative Positivity Rate of H1n1 Using Rt- Pcr in The Year 2011- 2012
| IJMER | ISSN: 2249–6645 www.ijmer.com | Vol. 7 | Iss. 9 | September. 2017 | 44 |
2.7) Treatment:
The two classes of antiviral drugs used against Influenza are Neuraminidase inhibitors and M2
protein inhibitors (adamantane derivatives). Neuraminidase inhibitors are currently preferred for flu virus
infections since they are less toxic and more effective. As pregnant women seem to be more severely affected
than the general population by the 2009 H1N1 Influenza virus, prompt treatment with anti-Influenza drugs has
been recommended.[107 Jamieson et al;2009]
2.7.1) Neuraminidase inhibitors
Antiviral drugs such as oseltamivir (trade name Tamiflu) and zanamivir (trade name Relenza) are
Neuraminidase inhibitors that are designed to halt the spread of the virus in the body.[108Moscona;2005] These
drugs are often effective against both Influenza A and B.[109Stephensons et al 1999] The Cochrane
Collaboration reviewed these drugs and concluded that they reduce symptoms and complications.[110Jefferson
et al;2006] Different strains of Influenza viruses have differing degrees of resistance against these antivirals, and
it is impossible to predict what degree of resistance a future pandemic strain might have.
2.7.2) M2 inhibitors (adamantanes)
The antiviral drugs amantadine and rimantadine block a viral ion channel (M2 protein) and prevent
the virus from infecting cells.[43Pinto et al;2006] These drugs are sometimes effective against Influenza A if
given early in the infection but are always ineffective against Influenza B because B viruses do not possess M2
molecules. Measured resistance to amantadine and rimantadine in American isolates of H3N2has increased to
91% in 2005. [112CDC; 2006] This high level of resistance may be due to the easy availability of amantadines
as part of over- the- counter cold remedies in countries such as China and Russia,[113Bright et al;2006]and their
use to prevent outbreaks of Influenza in farmed poultry.(Wikipedia)
2.8Vaccination
There are two types of vaccine:
2.8.1) Trivalent Inactivated Vaccine (Tiv) The trivalent inactivated vaccine (TIV) is an inactivated preparation of egg- grown virus and is
given by injection. Only certain formulations of the vaccine are FDA certified for young children – the annual
ACIP recommendations (see below) give details. Protection is via IgG antibodies.
2.8.2) Live Attenuated Influenza Virus Vaccine (Laiv)
The live, attenuated Influenza virus (LAIV - marketed as FluMist) vaccine (see Genetics Lecture)
is prepared from egg- grown virus. It is approved for healthy (those not at risk for complications from Influenza
infection), non- pregnant individuals 2 to 49 years old but should not be given to children under 5 years of age
who have possible reactive airways disease (for example, a history of recurrent wheezing). It is given nasally
and should provide mucosal, humoral and cell- mediated immunity. It is contraindicated for children and
adolescents on any therapy containing aspirin due to the potential risk of Reye's syndrome since the virus is a
live virus.
Both Influenza vaccines are formulated annually using the types and strains of Influenza predicted to
be the major problems for that year (the predictions are based on worldwide monitoring of Influenza). The
vaccines are multivalent, the current ones are trivalent and have two strains of Influenza A and one of Influenza
B. Vaccination needs to be given every year because the most effective strains for the vaccine will change due
to drift and/or shift. The vaccines are usually given in the Fall , once the strains to be used for the Influenza
season have been determined in the earlier part of the year. By giving the vaccine in the fall, protection should
be high at the time the Influenza season peaks. Since both vaccines are grown in eggs, they are contraindicated
for those allergic to eggs.
2.9) Prevention:
Take these everyday steps to protect your health:
Cover your nose and mouth with a tissue when you cough or sneeze. Throw the tissue in the trash after you
use it.
Wash your hand often with soap or water, especially after you cough or sneeze. You can also use an alcohol
based hand cleaner.
Avoid touching your eyes, nose or mouth. Germs spread this way.
Try to avoid close contact with sick people.
Age wise Comparative Positivity Rate of H1n1 Using Rt- Pcr in The Year 2011- 2012
| IJMER | ISSN: 2249–6645 www.ijmer.com | Vol. 7 | Iss. 9 | September. 2017 | 45 |
Stay home if you are sick until at least 24 hours after you no longer have fever (100oF or 37.8
oC) or signs of
fever (without the use of fever reducing medicine, such as Tylenol)
While sick, limit contact with others as much as possible keep from infecting them.
III. AIMS AND OBJECTIVES Aim: Our Aim of the study is “To analyze age wise positivity rate of H1N1 using RT- PCR in the year 2011-
2012”
Objective: To achieve the aim “To analyze the positivity rate of H1N1 using RT- PCR in the year 2011- 2012”
following techniques were used-
Sample Collection
Viral RNA Isolation
Diagnosis using RT- PCR
IV. MATERIALS AND METHODS
4.1) Sample Collection:
Samples are collected from various NCR regions and then they carried to molecular testing laboratory for
further processing and analysis.
Samples should be taken from the nasopharynx (a nasopharyngeal swab), nasopharyngeal aspirates, throat
swabs and transbronchial aspirates.
Swab specimens should be collected using swabs with a synthetic tip (e.g. polyester or Dacron®), but not
calcium alginate or cotton tips; the shaft should be made of aluminum or plastic, but not of wood.
Specimens should be placed into sterile viral transport media.
4.1) Materials for specimen collection:
4.1.1) Transport Media
1. B D Viral transport media
OR 2. In house viral transport medium
(A)Medium 199
Tissue culture medium 199 containing 0.5% bovine albumin fraction VPenicillin G (2 X 10⁶ U/liter),
Streptomycin 200 mg/liter, polymyxin(2 x 10⁶ U/liter), gentamicin (250 mg/liter), nystatin (0.5 X 10⁶ U/liter).
Ofloxacin HCI (60 mg/liter), and sulfamethoxazole (0.2 g/ liter).
(B) Broth media
10g veal infusion broth, 2g of BSA fraction V add to 400ml sterile distilled waterPenicillin G (2 X 10⁶ U/liter),
Streptomycin 200 mg/liter, Polymyxin (2 x 10⁶U/liter), Gentamicin (250 mg/liter), nystatin (0.5 X 10⁶ U/liter).
Ofloxacin HCI (60mg/liter), and Sulfamethoxazole (0.2 g/ liter).
Sterilize by filtration and distribute in 1.0ml - 2.0ml volumes in
Screw capped tubes
Dacron swabs. Calcium alginate is not accepted for the collection of viral specimens
Tongue depressor
4.2) UPPER RESPIRATORY TRACT SPECIMENS
4.2.1) Method of collecting a throat swab
1. Hold the tongue down with the depressor. Use a strong light source to locate areas of inflammation in the
posterior pharynx and the tonsillar region of the throat behind the uvula.
2. Rub the area back and forth with the swab. Withdraw the swab without touching cheeks, teeth or gums and
insert into a screw- cap vial containing viral transport medium.
3. Break off the top part of the stick without touching the tube and tighten the screw capfirmly
4. Label the specimen containers with patient‟s name type of specimen and date ofcollection
5. Complete the laboratory request form.
Age wise Comparative Positivity Rate of H1n1 Using Rt- Pcr in The Year 2011- 2012
| IJMER | ISSN: 2249–6645 www.ijmer.com | Vol. 7 | Iss. 9 | September. 2017 | 46 |
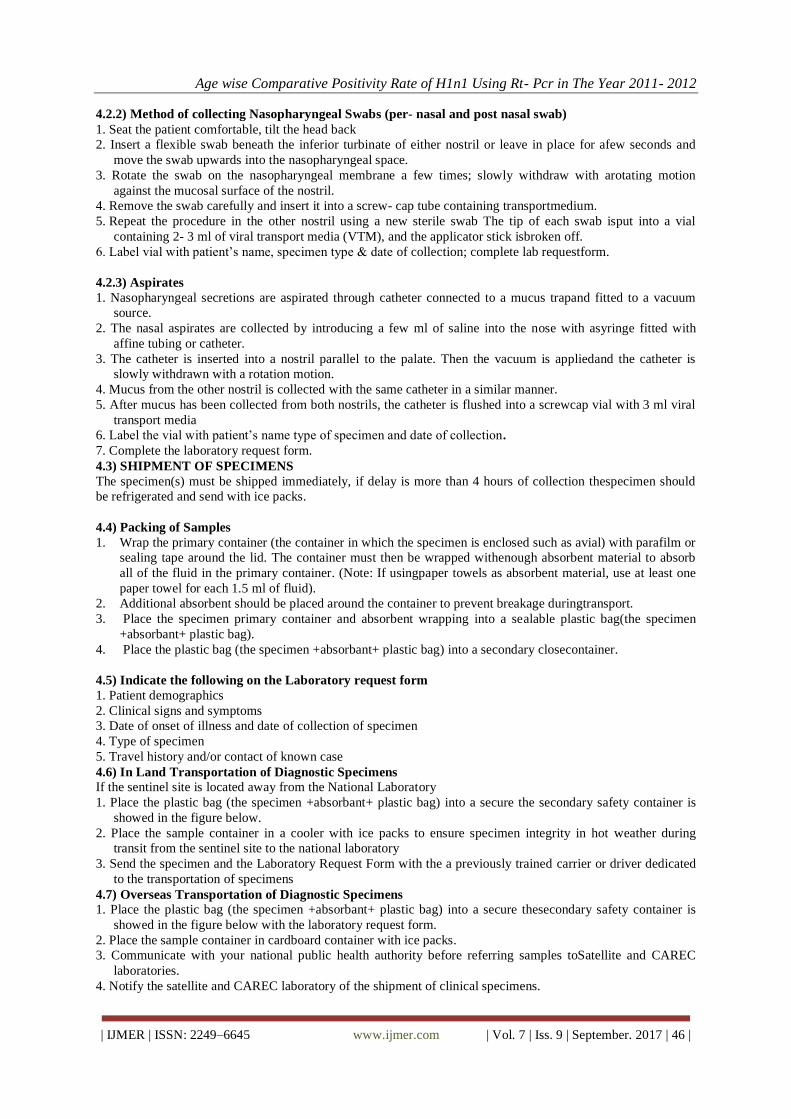
4.2.2) Method of collecting Nasopharyngeal Swabs (per- nasal and post nasal swab)
1. Seat the patient comfortable, tilt the head back
2. Insert a flexible swab beneath the inferior turbinate of either nostril or leave in place for afew seconds and
move the swab upwards into the nasopharyngeal space.
3. Rotate the swab on the nasopharyngeal membrane a few times; slowly withdraw with arotating motion
against the mucosal surface of the nostril.
4. Remove the swab carefully and insert it into a screw- cap tube containing transportmedium.
5. Repeat the procedure in the other nostril using a new sterile swab The tip of each swab isput into a vial
containing 2- 3 ml of viral transport media (VTM), and the applicator stick isbroken off.
6. Label vial with patient‟s name, specimen type & date of collection; complete lab requestform.
4.2.3) Aspirates
1. Nasopharyngeal secretions are aspirated through catheter connected to a mucus trapand fitted to a vacuum
source.
2. The nasal aspirates are collected by introducing a few ml of saline into the nose with asyringe fitted with
affine tubing or catheter.
3. The catheter is inserted into a nostril parallel to the palate. Then the vacuum is appliedand the catheter is
slowly withdrawn with a rotation motion.
4. Mucus from the other nostril is collected with the same catheter in a similar manner.
5. After mucus has been collected from both nostrils, the catheter is flushed into a screwcap vial with 3 ml viral
transport media
6. Label the vial with patient‟s name type of specimen and date of collection.
7. Complete the laboratory request form.
4.3) SHIPMENT OF SPECIMENS
The specimen(s) must be shipped immediately, if delay is more than 4 hours of collection thespecimen should
be refrigerated and send with ice packs.
4.4) Packing of Samples
1. Wrap the primary container (the container in which the specimen is enclosed such as avial) with parafilm or
sealing tape around the lid. The container must then be wrapped withenough absorbent material to absorb
all of the fluid in the primary container. (Note: If usingpaper towels as absorbent material, use at least one
paper towel for each 1.5 ml of fluid).
2. Additional absorbent should be placed around the container to prevent breakage duringtransport.
3. Place the specimen primary container and absorbent wrapping into a sealable plastic bag(the specimen
+absorbant+ plastic bag).
4. Place the plastic bag (the specimen +absorbant+ plastic bag) into a secondary closecontainer.
4.5) Indicate the following on the Laboratory request form
1. Patient demographics
2. Clinical signs and symptoms
3. Date of onset of illness and date of collection of specimen
4. Type of specimen
5. Travel history and/or contact of known case
4.6) In Land Transportation of Diagnostic Specimens
If the sentinel site is located away from the National Laboratory
1. Place the plastic bag (the specimen +absorbant+ plastic bag) into a secure the secondary safety container is
showed in the figure below.
2. Place the sample container in a cooler with ice packs to ensure specimen integrity in hot weather during
transit from the sentinel site to the national laboratory
3. Send the specimen and the Laboratory Request Form with the a previously trained carrier or driver dedicated
to the transportation of specimens
4.7) Overseas Transportation of Diagnostic Specimens
1. Place the plastic bag (the specimen +absorbant+ plastic bag) into a secure thesecondary safety container is
showed in the figure below with the laboratory request form.
2. Place the sample container in cardboard container with ice packs.
3. Communicate with your national public health authority before referring samples toSatellite and CAREC
laboratories.
4. Notify the satellite and CAREC laboratory of the shipment of clinical specimens.

Age wise Comparative Positivity Rate of H1n1 Using Rt- Pcr in The Year 2011- 2012
| IJMER | ISSN: 2249–6645 www.ijmer.com | Vol. 7 | Iss. 9 | September. 2017 | 47 |
5. Submit specimens to your Satellite Laboratory and CAREC Laboratory Division, through the National
Laboratory according CAREC guidelines and the IATA regulations “Diagnostic specimens” UN 3373.
4.8) Packing and Labeling of Clinical Specimens
4.8.1) Transportation of specimens
Specimens should be sent as “diagnostic specimens” in accordance with the International Air transport
Association dangerous goods regulations.
4.10) Equipments used during Sample Handling:
4.10.1) Personal Protection Equipments:
Before initiating processing of samples a fullcomplement of PPE should be worn. Thisincludes:
• Gloves (nonsterile),
• Mask (high- efficiency mask) / Three layered surgical mask,
• Long- sleeved cuffed gown,
• Protective eyewear (goggles/visors/face shields),
• Cap (may be used in high risk situations where there may be increasedaerosols),
•Plastic apron if splashing of blood, body fluids, excretions and secretions isanticipated.
Fig: showing PPE bearing inside and outside the laboratory

Age wise Comparative Positivity Rate of H1n1 Using Rt- Pcr in The Year 2011- 2012
| IJMER | ISSN: 2249–6645 www.ijmer.com | Vol. 7 | Iss. 9 | September. 2017 | 48 |
Fig: Personal Protection Equipment
The PPE should be used in situations were regular work practice requires unavoidable, relatively closed contact
with the suspected human case /poultry.
4.10.2) Correct procedure for applying PPE in the following order:
1. Follow thorough hand wash
2. Wear the coverall.
3. Wear the goggles/ shoe cover/and head cover in that order.
4. Wear face mask
5. Wear gloves
The masks should be changed after every six to eight hours.
4.10.3) Remove PPE in the following order:
• Remove gown (place in rubbish bin).
• Remove gloves (peel from hand and discard into rubbish bin).
• Use alcohol- based hand- rub or wash hands with soap and water.
• Remove cap and face shield (place cap in bin and if reusable place face shield incontainer for
decontamination).
• Remove mask- by grasping elastic behind ears – do not touch front of mask
• Use alcohol- based hand- rub or wash hands with soap and water.
• Leave the room.
• Once outside room use alcohol hand- rub again or wash hands with soap andwater.
Used PPE should be handled as waste as per waste management protocol
4.11) SAMPLE PROCESSING:Viral RNA is isolated after sample reaches the laboratory.
Age wise Comparative Positivity Rate of H1n1 Using Rt- Pcr in The Year 2011- 2012
| IJMER | ISSN: 2249–6645 www.ijmer.com | Vol. 7 | Iss. 9 | September. 2017 | 49 |
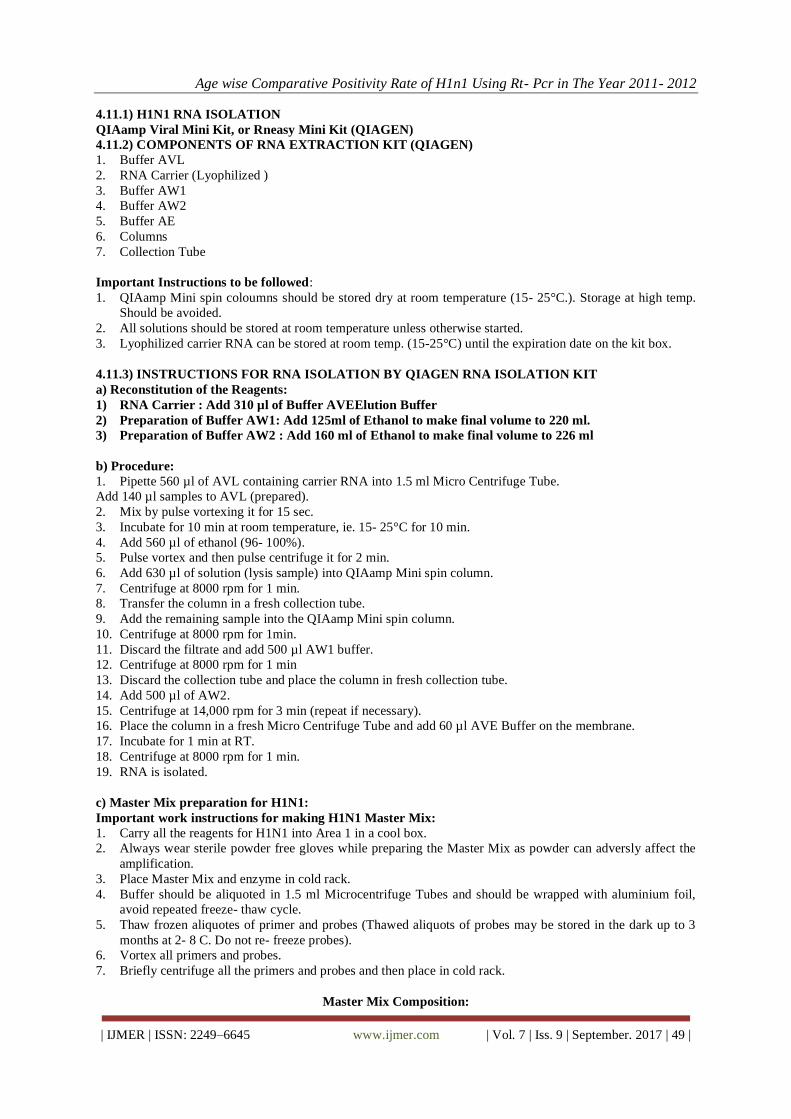
4.11.1) H1N1 RNA ISOLATION
QIAamp Viral Mini Kit, or Rneasy Mini Kit (QIAGEN)
4.11.2) COMPONENTS OF RNA EXTRACTION KIT (QIAGEN)
1. Buffer AVL
2. RNA Carrier (Lyophilized )
3. Buffer AW1
4. Buffer AW2
5. Buffer AE
6. Columns
7. Collection Tube
Important Instructions to be followed:
1. QIAamp Mini spin coloumns should be stored dry at room temperature (15- 25°C.). Storage at high temp.
Should be avoided.
2. All solutions should be stored at room temperature unless otherwise started.
3. Lyophilized carrier RNA can be stored at room temp. (15-25°C) until the expiration date on the kit box.
4.11.3) INSTRUCTIONS FOR RNA ISOLATION BY QIAGEN RNA ISOLATION KIT
a) Reconstitution of the Reagents:
1) RNA Carrier : Add 310 µl of Buffer AVEElution Buffer
2) Preparation of Buffer AW1: Add 125ml of Ethanol to make final volume to 220 ml.
3) Preparation of Buffer AW2 : Add 160 ml of Ethanol to make final volume to 226 ml
b) Procedure:
1. Pipette 560 µl of AVL containing carrier RNA into 1.5 ml Micro Centrifuge Tube.
Add 140 µl samples to AVL (prepared).
2. Mix by pulse vortexing it for 15 sec.
3. Incubate for 10 min at room temperature, ie. 15- 25°C for 10 min.
4. Add 560 µl of ethanol (96- 100%).
5. Pulse vortex and then pulse centrifuge it for 2 min.
6. Add 630 µl of solution (lysis sample) into QIAamp Mini spin column.
7. Centrifuge at 8000 rpm for 1 min.
8. Transfer the column in a fresh collection tube.
9. Add the remaining sample into the QIAamp Mini spin column.
10. Centrifuge at 8000 rpm for 1min.
11. Discard the filtrate and add 500 µl AW1 buffer.
12. Centrifuge at 8000 rpm for 1 min
13. Discard the collection tube and place the column in fresh collection tube.
14. Add 500 µl of AW2.
15. Centrifuge at 14,000 rpm for 3 min (repeat if necessary).
16. Place the column in a fresh Micro Centrifuge Tube and add 60 µl AVE Buffer on the membrane.
17. Incubate for 1 min at RT.
18. Centrifuge at 8000 rpm for 1 min.
19. RNA is isolated.
c) Master Mix preparation for H1N1:
Important work instructions for making H1N1 Master Mix:
1. Carry all the reagents for H1N1 into Area 1 in a cool box.
2. Always wear sterile powder free gloves while preparing the Master Mix as powder can adversly affect the
amplification.
3. Place Master Mix and enzyme in cold rack.
4. Buffer should be aliquoted in 1.5 ml Microcentrifuge Tubes and should be wrapped with aluminium foil,
avoid repeated freeze- thaw cycle.
5. Thaw frozen aliquotes of primer and probes (Thawed aliquots of probes may be stored in the dark up to 3
months at 2- 8 C. Do not re- freeze probes).
6. Vortex all primers and probes.
7. Briefly centrifuge all the primers and probes and then place in cold rack.
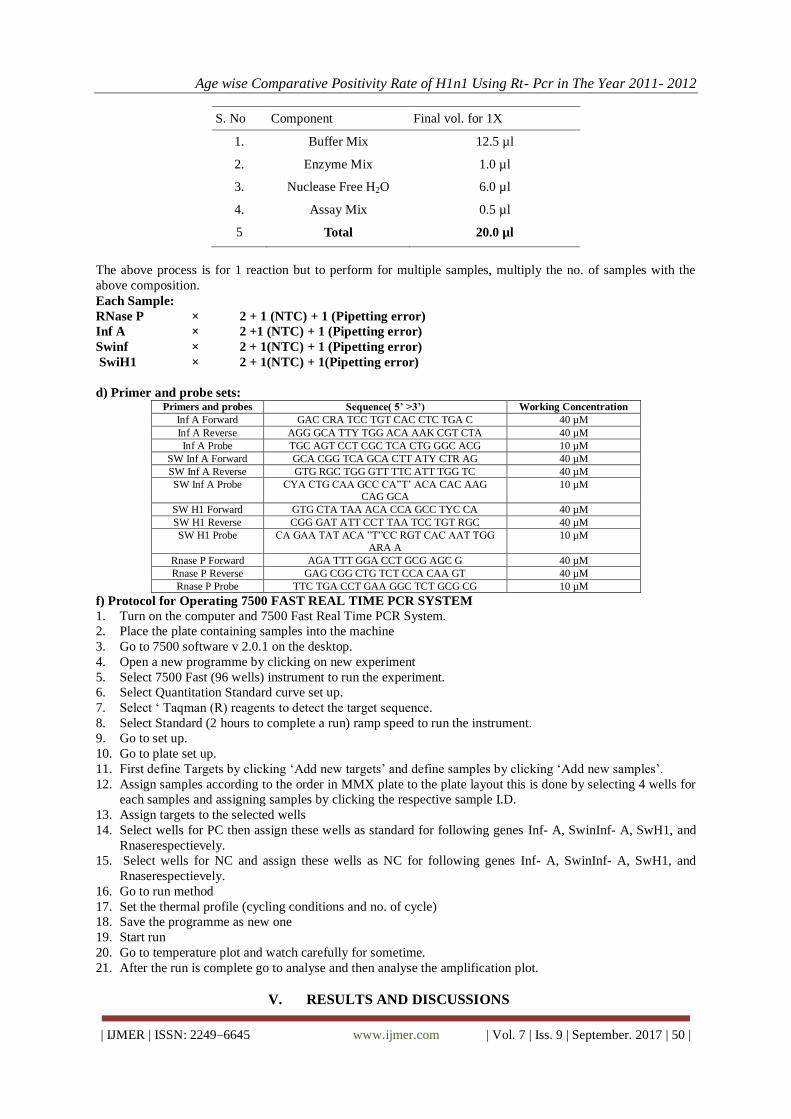
Master Mix Composition:
Age wise Comparative Positivity Rate of H1n1 Using Rt- Pcr in The Year 2011- 2012
| IJMER | ISSN: 2249–6645 www.ijmer.com | Vol. 7 | Iss. 9 | September. 2017 | 50 |
S. No Component Final vol. for 1X
1. Buffer Mix 12.5 µl
2. Enzyme Mix 1.0 µl
3. Nuclease Free H2O 6.0 µl
4. Assay Mix 0.5 µl
5 Total 20.0 µl
The above process is for 1 reaction but to perform for multiple samples, multiply the no. of samples with the
above composition.
Each Sample:
RNase P × 2 + 1 (NTC) + 1 (Pipetting error)
Inf A × 2 +1 (NTC) + 1 (Pipetting error)
Swinf × 2 + 1(NTC) + 1 (Pipetting error)
SwiH1 × 2 + 1(NTC) + 1(Pipetting error)
d) Primer and probe sets: Primers and probes Sequence( 5’ >3’) Working Concentration
Inf A Forward GAC CRA TCC TGT CAC CTC TGA C 40 µM
Inf A Reverse AGG GCA TTY TGG ACA AAK CGT CTA 40 µM
Inf A Probe TGC AGT CCT CGC TCA CTG GGC ACG 10 µM
SW Inf A Forward GCA CGG TCA GCA CTT ATY CTR AG 40 µM
SW Inf A Reverse GTG RGC TGG GTT TTC ATT TGG TC 40 µM
SW Inf A Probe CYA CTG CAA GCC CA”T‟ ACA CAC AAG CAG GCA
10 µM
SW H1 Forward GTG CTA TAA ACA CCA GCC TYC CA 40 µM
SW H1 Reverse CGG GAT ATT CCT TAA TCC TGT RGC 40 µM
SW H1 Probe CA GAA TAT ACA ”T”CC RGT CAC AAT TGG
ARA A
10 µM
Rnase P Forward AGA TTT GGA CCT GCG AGC G 40 µM
Rnase P Reverse GAG CGG CTG TCT CCA CAA GT 40 µM
Rnase P Probe TTC TGA CCT GAA GGC TCT GCG CG 10 µM
f) Protocol for Operating 7500 FAST REAL TIME PCR SYSTEM
1. Turn on the computer and 7500 Fast Real Time PCR System.
2. Place the plate containing samples into the machine
3. Go to 7500 software v 2.0.1 on the desktop.
4. Open a new programme by clicking on new experiment
5. Select 7500 Fast (96 wells) instrument to run the experiment.
6. Select Quantitation Standard curve set up.
7. Select „ Taqman (R) reagents to detect the target sequence.
8. Select Standard (2 hours to complete a run) ramp speed to run the instrument.
9. Go to set up.
10. Go to plate set up.
11. First define Targets by clicking „Add new targets‟ and define samples by clicking „Add new samples‟.
12. Assign samples according to the order in MMX plate to the plate layout this is done by selecting 4 wells for
each samples and assigning samples by clicking the respective sample I.D.
13. Assign targets to the selected wells
14. Select wells for PC then assign these wells as standard for following genes Inf- A, SwinInf- A, SwH1, and
Rnaserespectievely.
15. Select wells for NC and assign these wells as NC for following genes Inf- A, SwinInf- A, SwH1, and
Rnaserespectievely.
16. Go to run method
17. Set the thermal profile (cycling conditions and no. of cycle)
18. Save the programme as new one
19. Start run
20. Go to temperature plot and watch carefully for sometime.
21. After the run is complete go to analyse and then analyse the amplification plot.
V. RESULTS AND DISCUSSIONS
Age wise Comparative Positivity Rate of H1n1 Using Rt- Pcr in The Year 2011- 2012
| IJMER | ISSN: 2249–6645 www.ijmer.com | Vol. 7 | Iss. 9 | September. 2017 | 51 |
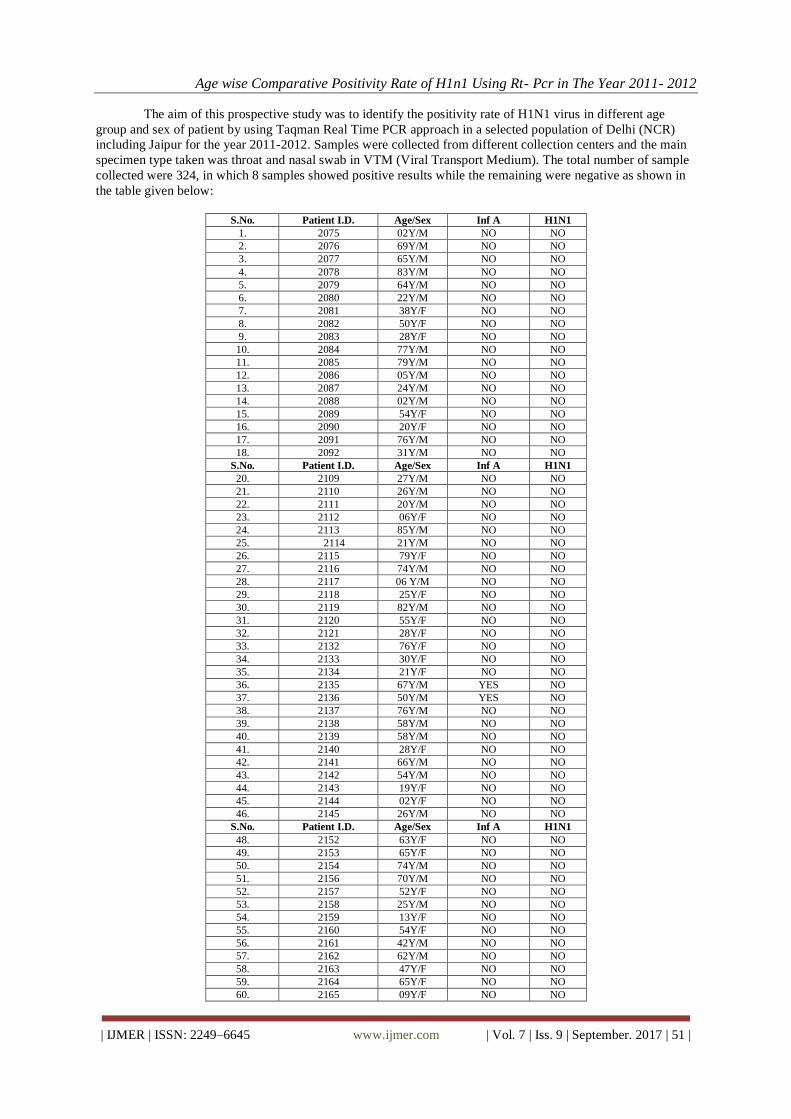
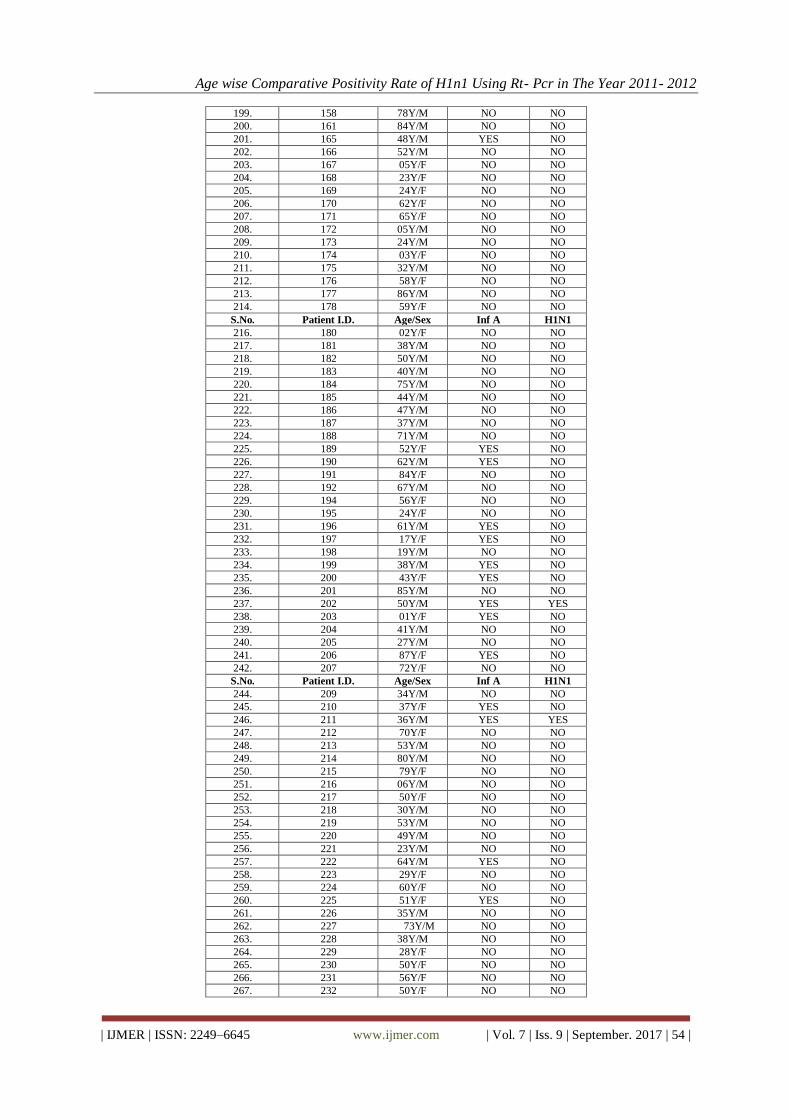
The aim of this prospective study was to identify the positivity rate of H1N1 virus in different age
group and sex of patient by using Taqman Real Time PCR approach in a selected population of Delhi (NCR)
including Jaipur for the year 2011-2012. Samples were collected from different collection centers and the main
specimen type taken was throat and nasal swab in VTM (Viral Transport Medium). The total number of sample
collected were 324, in which 8 samples showed positive results while the remaining were negative as shown in
the table given below:
S.No. Patient I.D. Age/Sex Inf A H1N1
1. 2075 02Y/M NO NO
2. 2076 69Y/M NO NO
3. 2077 65Y/M NO NO
4. 2078 83Y/M NO NO
5. 2079 64Y/M NO NO
6. 2080 22Y/M NO NO
7. 2081 38Y/F NO NO
8. 2082 50Y/F NO NO
9. 2083 28Y/F NO NO
10. 2084 77Y/M NO NO
11. 2085 79Y/M NO NO
12. 2086 05Y/M NO NO
13. 2087 24Y/M NO NO
14. 2088 02Y/M NO NO
15. 2089 54Y/F NO NO
16. 2090 20Y/F NO NO
17. 2091 76Y/M NO NO
18. 2092 31Y/M NO NO
S.No. Patient I.D. Age/Sex Inf A H1N1
20. 2109 27Y/M NO NO
21. 2110 26Y/M NO NO
22. 2111 20Y/M NO NO
23. 2112 06Y/F NO NO
24. 2113 85Y/M NO NO
25. 2114 21Y/M NO NO
26. 2115 79Y/F NO NO
27. 2116 74Y/M NO NO
28. 2117 06 Y/M NO NO
29. 2118 25Y/F NO NO
30. 2119 82Y/M NO NO
31. 2120 55Y/F NO NO
32. 2121 28Y/F NO NO
33. 2132 76Y/F NO NO
34. 2133 30Y/F NO NO
35. 2134 21Y/F NO NO
36. 2135 67Y/M YES NO
37. 2136 50Y/M YES NO
38. 2137 76Y/M NO NO
39. 2138 58Y/M NO NO
40. 2139 58Y/M NO NO
41. 2140 28Y/F NO NO
42. 2141 66Y/M NO NO
43. 2142 54Y/M NO NO
44. 2143 19Y/F NO NO
45. 2144 02Y/F NO NO
46. 2145 26Y/M NO NO
S.No. Patient I.D. Age/Sex Inf A H1N1
48. 2152 63Y/F NO NO
49. 2153 65Y/F NO NO
50. 2154 74Y/M NO NO
51. 2156 70Y/M NO NO
52. 2157 52Y/F NO NO
53. 2158 25Y/M NO NO
54. 2159 13Y/F NO NO
55. 2160 54Y/F NO NO
56. 2161 42Y/M NO NO
57. 2162 62Y/M NO NO
58. 2163 47Y/F NO NO
59. 2164 65Y/F NO NO
60. 2165 09Y/F NO NO

Age wise Comparative Positivity Rate of H1n1 Using Rt- Pcr in The Year 2011- 2012
| IJMER | ISSN: 2249–6645 www.ijmer.com | Vol. 7 | Iss. 9 | September. 2017 | 52 |
61. 2166 49Y/F NO NO
62. 2167 82Y/M NO NO
63. 2168 32Y/F NO NO
64. 2169 65Y/M NO NO
65. 2170 40Y/F NO NO
66. 2171 58Y/M NO NO
67. 2172 59Y/F NO NO
68. 2173 59Y/F NO NO
69. 2174 48Y/M NO NO
70. 2175 40Y/M NO NO
71. 2176 72Y/M NO NO
72. 2177 24Y/F NO NO
73. 2178 58Y/M NO NO
74. 2179 68Y/M NO NO
S.No. Patient I.D. Age/Sex Inf A H1N1
76. 2181 48Y/F NO NO
77. 2182 44Y/M NO NO
78. 2183 17Y/F NO NO
79. 2184 42Y/M NO NO
80. 2185 60Y/F NO NO
81. 2186 28Y/M NO NO
82. 2187 42Y/F YES YES
83. 2188 57Y/M NO NO
84. 2189 50Y/F NO NO
85. 2204 76Y/M NO NO
86. 2205 66Y/M NO NO
87. 2206 58Y/F NO NO
88. 2207 72Y/M NO NO
89. 2208 66Y/M NO NO
90. 2244 80Y/F NO NO
91. 2245 20Y/M NO NO
92. 2246 76Y/F NO NO
93. 2247 22Y/M NO NO
94. 2248 60Y/M NO NO
95. 2249 36Y/F NO NO
96. 2250 29Y/F NO NO
97. 2251 51Y/F NO NO
98. 2252 39Y/F NO NO
99. 2253 24Y/F NO NO
100. 2254 53Y/F NO NO
101 2255 50Y/M NO NO
102. 2256 70Y/M NO NO
S.No. Patient I.D. Age/Sex Inf A H1N1
104. 2258 84Y/F NO NO
105. 2259 54Y/M NO NO
106. 2260 77Y/M NO NO
107. 2261 16Y/F NO NO
108. 2262 74Y/F NO NO
109. 2263 78Y/M NO NO
110. 2264 86Y/F NO NO
111. 2265 70Y/M NO NO
112. 2266 66Y/F NO NO
113. 2267 12Y/M NO NO
114. 2268 50Y/F NO NO
115. 2269 56Y/F NO NO
116. 2270 06Y/F NO NO
117. 2271 34Y/M NO NO
118. 2272 33Y/M NO NO
119. 2273 57Y/M NO NO
120. 2274 54Y/M NO NO
121. 2275 10Y/M NO NO
122. 2276 16Y/M NO NO
123. 2277 26Y/M NO NO
124. 2278 43Y/M NO NO
125. 2279 17Y/F NO NO
126. 2280 76Y/F NO NO
127. 2281 65Y/M NO NO
128. 2282 37Y/F NO NO
129. 2283 38Y/F NO NO

Age wise Comparative Positivity Rate of H1n1 Using Rt- Pcr in The Year 2011- 2012
| IJMER | ISSN: 2249–6645 www.ijmer.com | Vol. 7 | Iss. 9 | September. 2017 | 53 |
130. 2284 61Y/M NO NO
S.No. Patient I.D. Age/Sex Inf A H1N1
132. 2286 16Y/F NO NO
133. 2287 60Y/M NO NO
134. 2289 68Y/F NO NO
135. 2290 28Y/M NO NO
136. 2291 12Y/M NO NO
137. 2292 52Y/F NO NO
138. 2293 82Y/F NO NO
139 2294 26Y/M NO NO
140 2295 37Y/M NO NO
141 2296 48Y/M NO NO
142 2297 56Y/M NO NO
143 2298 72Y/M YES NO
144 2299 46Y/F NO NO
145. 2300 45Y/F NO NO
146. 2301 17Y/M NO NO
147. 2302 27Y/F NO NO
148. 2303 32Y/F NO NO
149. 2304 40Y/F NO NO
150. 2305 50Y/F NO NO
151. 118 69Y/M NO NO
152. 124 82Y/F NO NO
153. 125 70Y/F NO NO
154. 126 56Y/M NO NO
155. 127 75Y/F NO NO
156. 128 76Y/F NO NO
157. 129 45Y/F NO NO
158. 130 46Y/F NO NO
S.No. Patient I.D. Age/Sex Inf A H1N1
160. 132 52Y/F NO NO
161. 133 51Y/F NO NO
162. 141 46Y/F NO NO
163. 142 58Y/F NO NO
164. 143 23Y/M NO NO
165. 144 44Y/M NO NO
166. 145 39Y/F NO NO
167. 146 70Y/F NO NO
168. 147 57Y/M YES NO
169. 148 43Y/M NO NO
170. 149 50Y/M NO NO
171. 153 54Y/F NO NO
172. 154 24Y/M NO NO
173. 155 16Y/M NO NO
174. 156 22Y/M NO NO
175. 119 86Y/M NO NO
176. 120 10Y/F NO NO
177. 103 53Y/F NO NO
178. 104 70Y/M YES NO
179. 105 28Y/F NO NO
180. 106 74Y/F NO NO
181. 107 37Y/F NO NO
182. 108 16Y/M NO NO
183. 109 58Y/M NO NO
184. 110 59Y/M NO NO
185. 111 67Y/F NO NO
186. 112 32Y/M NO NO
S.No. Patient I.D. Age/Sex Inf A H1N1
188. 114 90Y/F NO NO
189. 115 43Y/M NO NO
190. 116 54Y/M NO NO
191. 117 37Y/M NO NO
192. 118 69Y/M NO NO
193. 119 86Y/M NO NO
194. 120 10Y/F NO NO
195. 121 15Y/M NO NO
196. 122 70Y/M NO NO
197. 123 75Y/F NO NO
198. 157 38Y/F NO NO
Age wise Comparative Positivity Rate of H1n1 Using Rt- Pcr in The Year 2011- 2012
| IJMER | ISSN: 2249–6645 www.ijmer.com | Vol. 7 | Iss. 9 | September. 2017 | 54 |
199. 158 78Y/M NO NO
200. 161 84Y/M NO NO
201. 165 48Y/M YES NO
202. 166 52Y/M NO NO
203. 167 05Y/F NO NO
204. 168 23Y/F NO NO
205. 169 24Y/F NO NO
206. 170 62Y/F NO NO
207. 171 65Y/F NO NO
208. 172 05Y/M NO NO
209. 173 24Y/M NO NO
210. 174 03Y/F NO NO
211. 175 32Y/M NO NO
212. 176 58Y/F NO NO
213. 177 86Y/M NO NO
214. 178 59Y/F NO NO
S.No. Patient I.D. Age/Sex Inf A H1N1
216. 180 02Y/F NO NO
217. 181 38Y/M NO NO
218. 182 50Y/M NO NO
219. 183 40Y/M NO NO
220. 184 75Y/M NO NO
221. 185 44Y/M NO NO
222. 186 47Y/M NO NO
223. 187 37Y/M NO NO
224. 188 71Y/M NO NO
225. 189 52Y/F YES NO
226. 190 62Y/M YES NO
227. 191 84Y/F NO NO
228. 192 67Y/M NO NO
229. 194 56Y/F NO NO
230. 195 24Y/F NO NO
231. 196 61Y/M YES NO
232. 197 17Y/F YES NO
233. 198 19Y/M NO NO
234. 199 38Y/M YES NO
235. 200 43Y/F YES NO
236. 201 85Y/M NO NO
237. 202 50Y/M YES YES
238. 203 01Y/F YES NO
239. 204 41Y/M NO NO
240. 205 27Y/M NO NO
241. 206 87Y/F YES NO
242. 207 72Y/F NO NO
S.No. Patient I.D. Age/Sex Inf A H1N1
244. 209 34Y/M NO NO
245. 210 37Y/F YES NO
246. 211 36Y/M YES YES
247. 212 70Y/F NO NO
248. 213 53Y/M NO NO
249. 214 80Y/M NO NO
250. 215 79Y/F NO NO
251. 216 06Y/M NO NO
252. 217 50Y/F NO NO
253. 218 30Y/M NO NO
254. 219 53Y/M NO NO
255. 220 49Y/M NO NO
256. 221 23Y/M NO NO
257. 222 64Y/M YES NO
258. 223 29Y/F NO NO
259. 224 60Y/F NO NO
260. 225 51Y/F YES NO
261. 226 35Y/M NO NO
262. 227 73Y/M NO NO
263. 228 38Y/M NO NO
264. 229 28Y/F NO NO
265. 230 50Y/F NO NO
266. 231 56Y/F NO NO
267. 232 50Y/F NO NO
Age wise Comparative Positivity Rate of H1n1 Using Rt- Pcr in The Year 2011- 2012
| IJMER | ISSN: 2249–6645 www.ijmer.com | Vol. 7 | Iss. 9 | September. 2017 | 55 |
268. 233 75Y/M NO NO
269. 234 58Y/F NO NO
270. 235 80Y/F NO NO
S.No. Patient I.D. Age/Sex Inf A H1N1
272. 237 43Y/M NO NO
273. 238 74Y/M NO NO
274. 239 71Y/M NO NO
275. 240 80Y/F YES NO
276. 241 25Y/M NO NO
277. 242 63Y/M NO NO
278. 243 48Y/M NO NO
279. 244 55Y/M NO NO
280. 245 29Y/F NO NO
281. 246 70Y/F NO NO
282. 247 63Y/M NO NO
283. 248 48Y/M NO NO
284. 249 11Y/F NO NO
285. 250 59Y/M NO NO
286. 251 63Y/F NO NO
287. 252 39Y/F NO NO
288. 253 27Y/F NO NO
289. 254 63Y/M NO NO
290. 255 66Y/M NO NO
291. 256 29Y/M NO NO
292. 258 42Y/M NO NO
293. 259 54Y/M NO NO
294. 260 15Y/F NO NO
295. 261 48Y/M NO NO
296. 262 39Y/M NO NO
297. 263 39Y/M NO NO
298. 264 30Y/M NO NO
S.No. Patient I.D. Age/Sex Inf A H1N1
300. 266 40Y/M NO NO
301. 267 30Y/M NO NO
302. 268 91Y/M NO NO
303. 269 73Y/M NO NO
304. 270 27Y/F NO NO
305. 271 32Y/M NO NO
306. 2072 48Y/M NO NO
307. 2073 53Y/M NO NO
308. 2074 60Y/F NO NO
309. 2022 30Y/F YES NO
310. 2018 73Y/F YES NO
311. 2000 33Y/M YES NO
312. 1972 56Y/M YES NO
313. 1902 55Y/M YES YES
314. 1901 52Y/M YES NO
315. 1904 48Y/F YES NO
316. 3312 04Y/M YES NO
317. 3315 18Y/F YES NO
318. 3318 37Y/F YES NO
319. 3319 51Y/M YES NO
320. 1857 02Y/M YES YES
321. 1845 59Y/M YES NO
322. 676 48Y/F YES YES
323. 677 36Y/M YES YES
324. 655 32Y/F YES YES
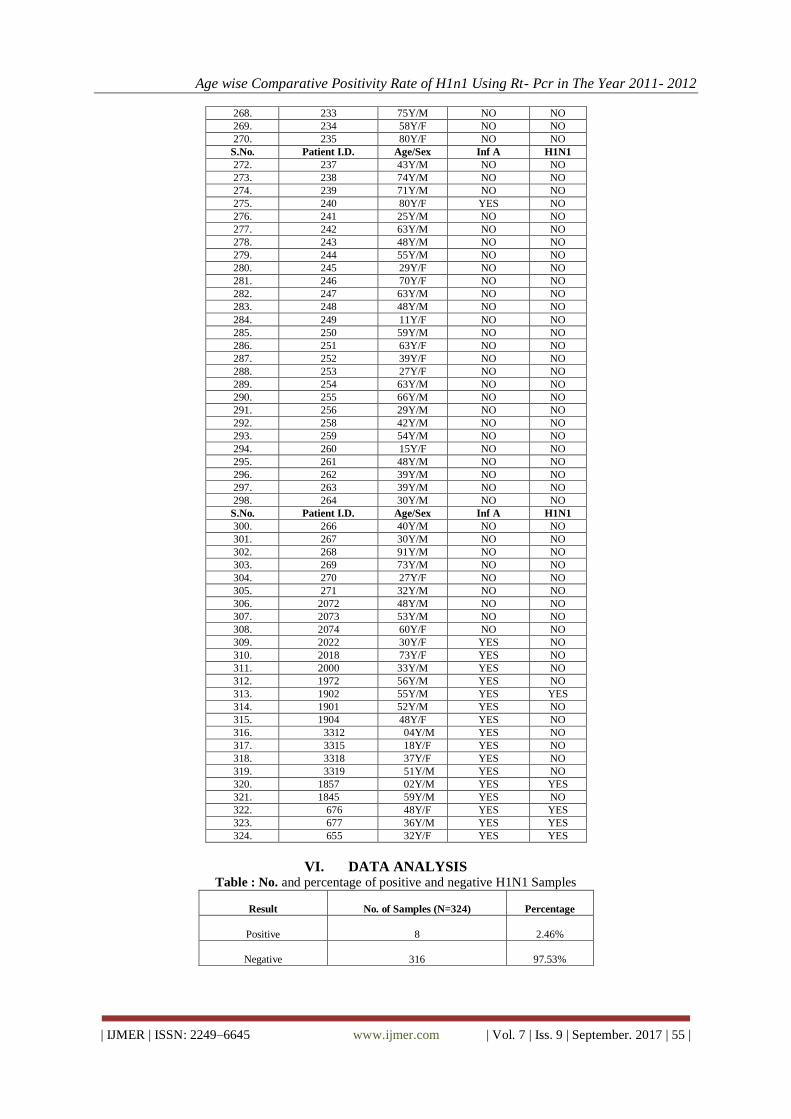
VI. DATA ANALYSIS Table : No. and percentage of positive and negative H1N1 Samples
Result
No. of Samples (N=324)
Percentage
Positive
8
2.46%
Negative
316
97.53%
Age wise Comparative Positivity Rate of H1n1 Using Rt- Pcr in The Year 2011- 2012
| IJMER | ISSN: 2249–6645 www.ijmer.com | Vol. 7 | Iss. 9 | September. 2017 | 56 |
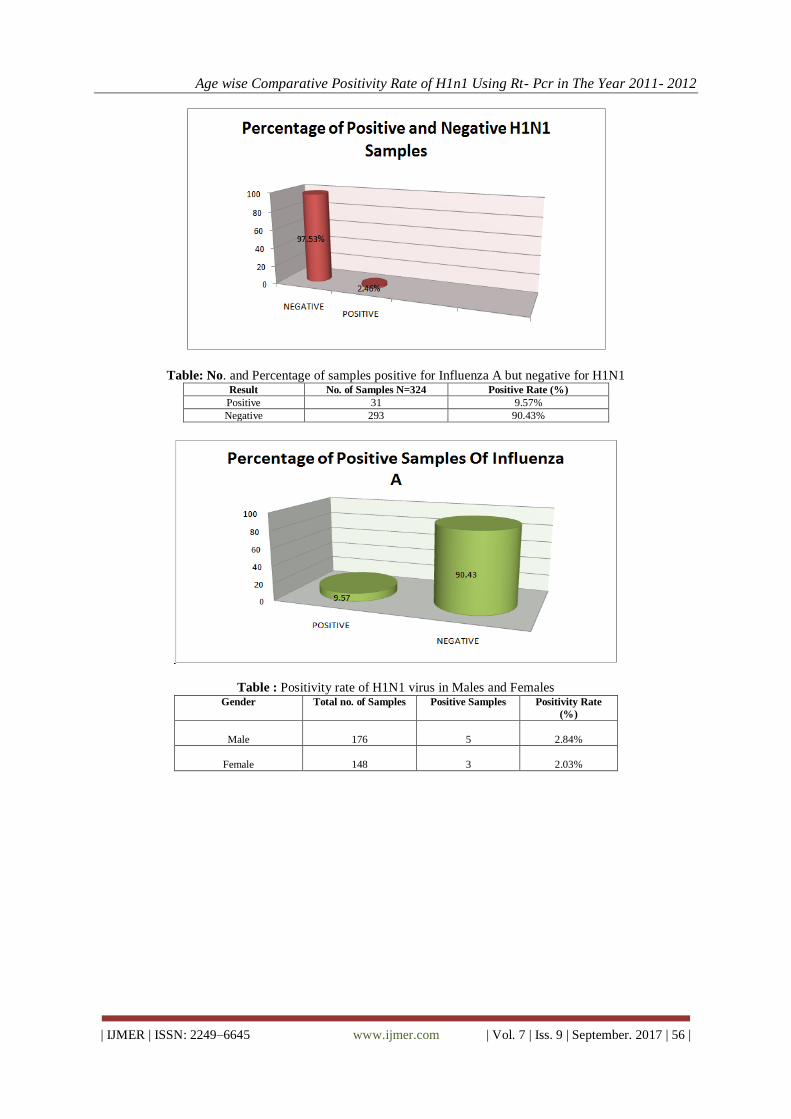
Table: No. and Percentage of samples positive for Influenza A but negative for H1N1 Result No. of Samples N=324 Positive Rate (%)
Positive 31 9.57%
Negative 293 90.43%
Table : Positivity rate of H1N1 virus in Males and Females Gender Total no. of Samples Positive Samples Positivity Rate
(%)
Male
176
5
2.84%
Female
148
3
2.03%

Age wise Comparative Positivity Rate of H1n1 Using Rt- Pcr in The Year 2011- 2012
| IJMER | ISSN: 2249–6645 www.ijmer.com | Vol. 7 | Iss. 9 | September. 2017 | 57 |
Table 5: Positivity Rate of Influenza A in Male and Female Gender Total no. of samples No. of positive
samples
Positivity Rate (%)
MALE
176
17
9.65%
FEMALE
148
14
9.45%
VII. Conclusion We have collected 324 samples from different collection centers in Delhi and Jaipur.
Further isolating the RNA with Qiagen kit and detecting the specific targets for H1N1 virus we can conclude
our work with the following points.
Only 2.46% of samples showed Positive results for H1N1 while other
97.53% were negative during 2011-2012.
9.57% of the patients were found infected by Influenza A only.
Positivity rate was found maximum in Males 2.84% in comparison with Females 2.03% in case of H1N1.
Positivity rate was found maximum in Male 9.65% as compared to Female 9.45% in case of Influenza A.

Age wise Comparative Positivity Rate of H1n1 Using Rt- Pcr in The Year 2011- 2012
| IJMER | ISSN: 2249–6645 www.ijmer.com | Vol. 7 | Iss. 9 | September. 2017 | 58 |
DECLARATION I do hereby declare that the thesis entitled “ To DETECTION OF H1N1 (SWINE FLU) VIRUS BY REAL
TIME PCR TECHNOLOGY ” submitted to „Biotech Consortium India Limited‟ in partial fulfillment of the
“Biotech Industrial Training Programme” is a faithful record of project work carried by Anil kumar, under the
guidance and supervision of Dr. Yogesh Kumar Singh and Mr. Mukesh Kumar.
ACKNOWLEDGEMENTS The person behind all direct and indirect evokes is Dr. Nimrat Bawa, the lady with constant patience
and oceanic personality due to her teaching and research strategies. She is the original source of my knowledge
regarding molecular diagnostics research. Each impulse generated in my brain is due to the continuous
synchronous stimulatory efforts provided by her work. She has dedicated all her life for the sake of patients and
diagnostic field. I heartily acknowledge Dr. Yogesh Kumar Singh, Head and Senior Scientist at Auroprobe
laboratories to boost up my morals during initial months of my training and shaping my brain in a special
manner by virtue of which only I could recognize my potentials to do all tough task in a simple and positive
way. His cooperative nature helped me to overcome my shyness and sparked my soul to fire like a constant
source of energy. I am very much inspired due to his way of interacting with his trainers as far as the high
standard of practical and theoretical works are concerned.
Mr. Mukesh Kumar, Scientist and my current guide at the time of project allotment played a very important
role in my training by making me capable to handle all the equipments and troubleshooting all the problems
during the experiments. He also trained me in each and every aspect of PCR starting from DNA isolation
and Decontamination. I am highly thankful to him for his aplomb and enthusiastic attitude towards his
trainers. The other scientists in our lab were very sympathetic and supportive regarding my project work.
Mr. Santosh in BacTech, Mr. Amit and Mr. Nishant in DNA isolation, Mr. Narotam in ZN Staining and
HPV Assay, Mr. Pranjal in RNA isolation, Mr. Satish and Mr. Jagdish in decontamination, helped me in
providing all other necessary support for my project theoretically as well as practically. I am also thankful
to all the other trainees of Auroprobe who always created a healthy environment for doing a good research.
I also admire their behavior to motivate me and give me a constant support.
Since I did my training in Auroprobe Labs on behalf of Department of Biotechnology, India, and BCIL, I
pay my sincere regards to DBT authorities for providing all necessary infrastructures for our benefits. At
last, I bow my head before almighty and my parents without whose continuous blessings; it would not have
been possible for me to complete this report.
REFERENCES

Age wise Comparative Positivity Rate of H1n1 Using Rt- Pcr in The Year 2011- 2012
| IJMER | ISSN: 2249–6645 www.ijmer.com | Vol. 7 | Iss. 9 | September. 2017 | 59 |
Age wise Comparative Positivity Rate of H1n1 Using Rt- Pcr in The Year 2011- 2012
| IJMER | ISSN: 2249–6645 www.ijmer.com | Vol. 7 | Iss. 9 | September. 2017 | 60 |
Age wise Comparative Positivity Rate of H1n1 Using Rt- Pcr in The Year 2011- 2012
| IJMER | ISSN: 2249–6645 www.ijmer.com | Vol. 7 | Iss. 9 | September. 2017 | 61 |
Age wise Comparative Positivity Rate of H1n1 Using Rt- Pcr in The Year 2011- 2012
| IJMER | ISSN: 2249–6645 www.ijmer.com | Vol. 7 | Iss. 9 | September. 2017 | 62 |
Age wise Comparative Positivity Rate of H1n1 Using Rt- Pcr in The Year 2011- 2012
| IJMER | ISSN: 2249–6645 www.ijmer.com | Vol. 7 | Iss. 9 | September. 2017 | 63 |
*Anil Kumar. “Age wise Comparative Positivity Rate of H1n1 Using Rt- Pcr in The Year 2011-
2012.” International Journal Of Modern Engineering Research (IJMER), vol. 07, no. 10, 2017,
pp. 32–63.