international goods movement planning - sistema ... ppt wakeman.pdf · waterways, ports, and...
TRANSCRIPT
International Goods International Goods Movement PlanningMovement Planning
Dr. Thomas Wakeman
International Symposium on International Symposium on Logistics and Port DevelopmentLogistics and Port Development
7 May 20097 May 2009Ponce, Puerto RicoPonce, Puerto Rico

Global Shipping & Logistics

Nature of Freight Flows• Domestic Movement
– Local goods exchanges (transport only)– Distant exchanges (transport and inventory
requirements = logistics)
• Import & Export (logistic chains)– Intra-continental– Inter-continental– Transshipment

Drivers of Freight Transport• Division of production
– Specialization of industrial activities– Increasing distances (offshoring)
• Division of labor– General demographics (regional/national)– Global phenomena in last 20 years
(outsourcing to gain economies of scale)• Demand of international trade
– Growing importance of manufactured goods
Presentation Topics
• Global Trade• Port Planning• Environment• Energy• Sustainability• Systems• Potential Port Opportunities
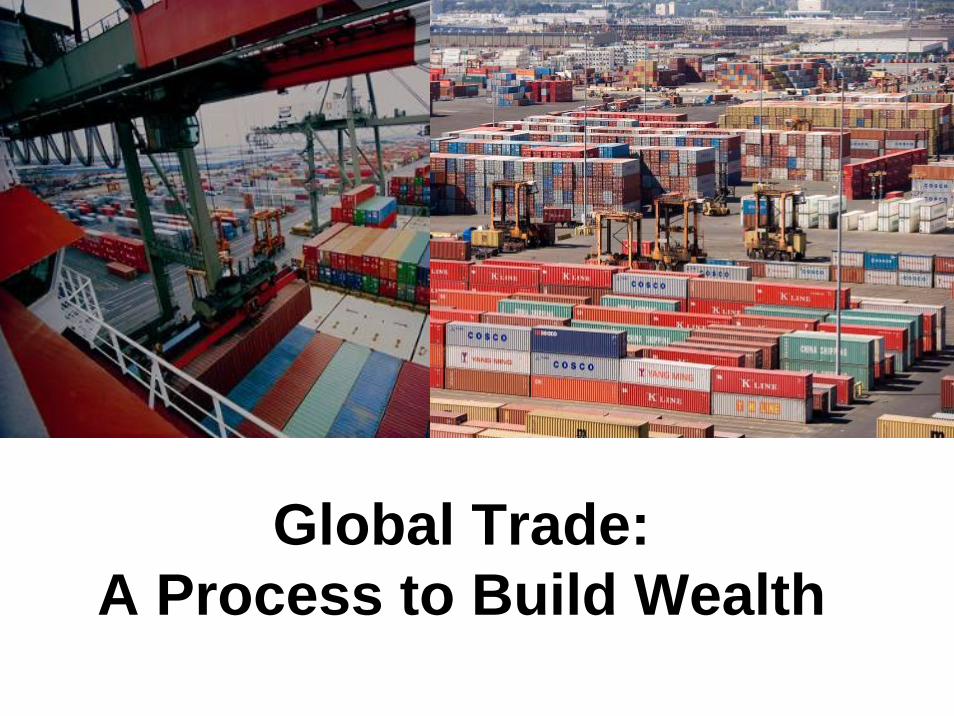
Global Trade:A Process to Build Wealth

The Facts• Economists agree: International trade
builds national prosperity!• The maritime sector transports more than
90% of the international goods and raw materials necessary for the continued vitality of ourselves, families, businesses, and governments.
• All trading nations rely heavily on their well-being for the continued supply of their energy resources, commercial goods and raw materials from ocean carriers.

Tracks of Global Shipping Fleet

International Shipping• There are around 50,000 merchant ships
trading internationally, transporting every kind of cargo.
• The world fleet is registered in over 150 nations, and manned by over a million seafarers of virtually every nationality.

Countries
1 Trillion Dollars
Imports
Exports
Germany
Italy
Japan
South Korea
India
ChinaUnited States
Canada
United KingdomNetherlands
Canada
France
U.S. is Leading Importerand Exporter in 2005
Value of International Trade in Goods and Services, All Modes, TValue of International Trade in Goods and Services, All Modes, Top 50 Countries, 2005 (World Bank)op 50 Countries, 2005 (World Bank)
CountryImports
($ bil USD)Exports
($ bil USD)Total
($ bil USD)United States 1,984 1,364 3,347
Germany 1,003 1,143 2,146China 718 830 1,548
United Kingdom 670 603 1,272Japan 591 637 1,228

U.S. Marine Transportation System (MTS)
Waterways, ports, and intermodal landside connections that allow the various modes of transportation to move people and goods. •• Over 3,700 marine terminals Over 3,700 marine terminals •• 25,000 miles of navigable channels 25,000 miles of navigable channels •• 238 locks at 192 locations 238 locks at 192 locations •• Great Lakes & St. Lawrence Seaway Great Lakes & St. Lawrence Seaway •• Over 174,000 miles of rail connecting all 48 Over 174,000 miles of rail connecting all 48
contiguous States, as well as Canada and Mexico contiguous States, as well as Canada and Mexico •• Over 45,000 miles of interstate highwayOver 45,000 miles of interstate highway
SOURCE: U.S.A.C.E; U.S. DOT: An Assessment of the U.S. Marine Transportation System, September 1999
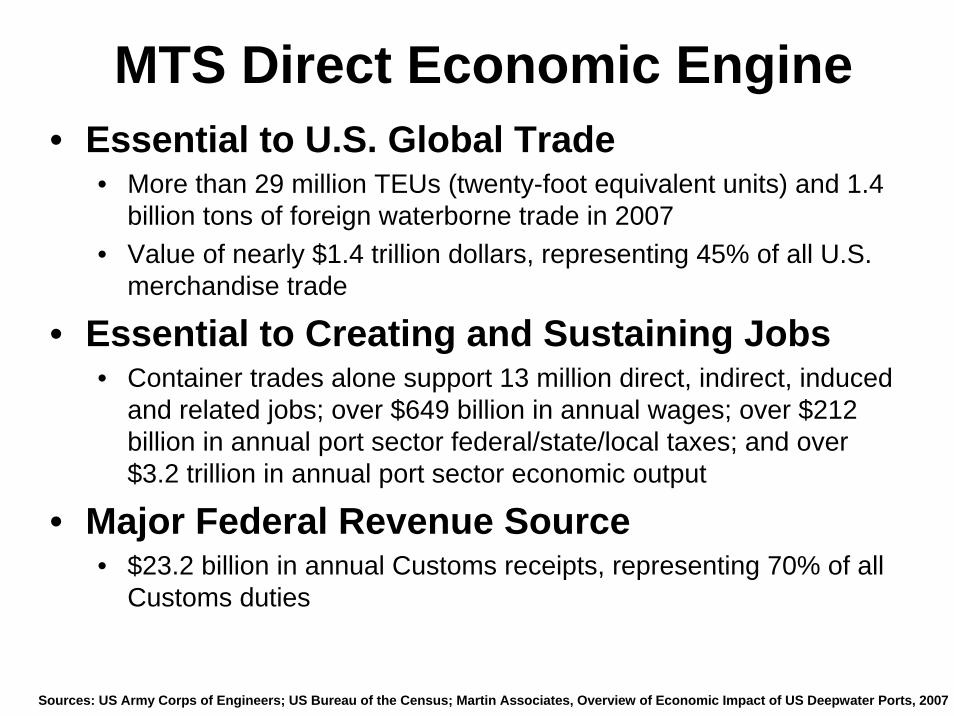
MTS Direct Economic Engine• Essential to U.S. Global Trade
• More than 29 million TEUs (twenty-foot equivalent units) and 1.4 billion tons of foreign waterborne trade in 2007
• Value of nearly $1.4 trillion dollars, representing 45% of all U.S. merchandise trade
• Essential to Creating and Sustaining Jobs• Container trades alone support 13 million direct, indirect, induced
and related jobs; over $649 billion in annual wages; over $212 billion in annual port sector federal/state/local taxes; and over $3.2 trillion in annual port sector economic output
• Major Federal Revenue Source• $23.2 billion in annual Customs receipts, representing 70% of all
Customs duties
Sources: US Army Corps of Engineers; US Bureau of the Census; Martin Associates, Overview of Economic Impact of US Deepwater Ports, 2007

World seaborne trade 1968-2008
World Seaborne Trade1968-2008
Source: International Chamber of Shipping, 2009

Factory Location:, Foreign Port
Vessel in Route US Port
Road Transport:
Final Destination:
Foreign Port Operations
Barge Service
Rail Yard
Rail:
Road Transport
“THE SUPPLY CHAIN”

Economies of Scale are Cheaper

Until 2007, containerized trade was almost 3X World Real GDP growth
Source: Drewry Shipping Consultants

Source: International Chamber of Shipping, 2009
Percent of Ships in World FleetJanuary 2008
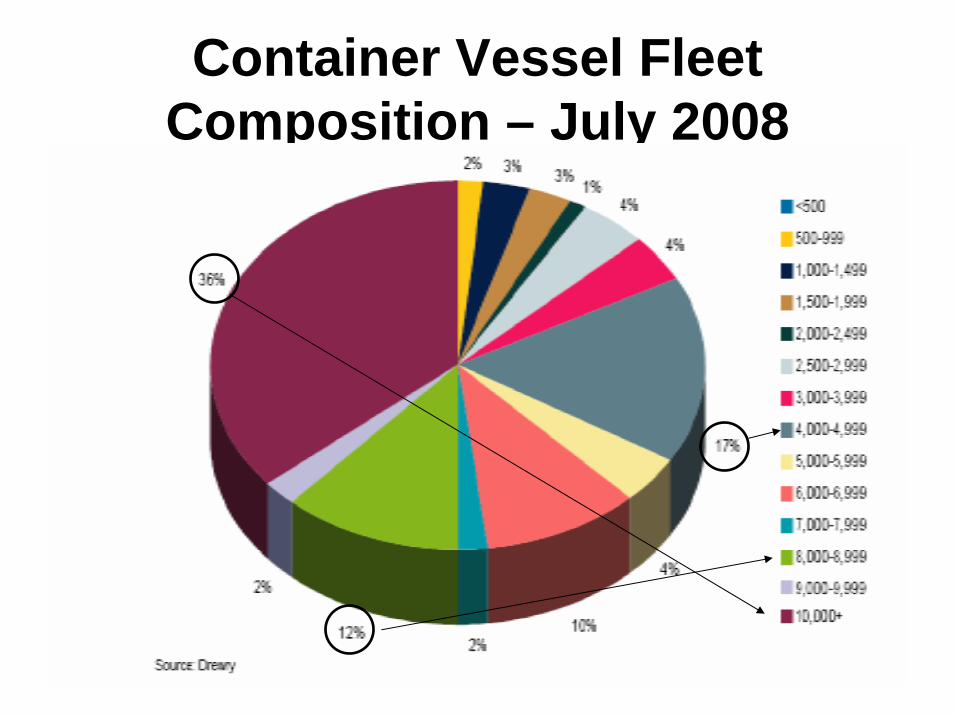
Container Vessel Fleet Composition – July 2008

Container Advantages• Greater efficiencies• Speed to market• Reduced damage• Reduced labor
costs• Facilitates
intermodal cargo exchanges

Containerization of Freight
Original Ideal X - 1956
In 2007, of the world total containerized cargo flow of 74 million TEUs:
• Intra-Asia total flow was 38.3 %• US total flow was 36.5%• N.Europe-Asia flow was 18.6%

Global Trade Flows – 2007
Source: Drewry Shipping Consultants
TRANS-ATLANTIC
6.3 million TEU
TRANS-PACIFIC
20.7 million TEU
ASIA- N.EUROPE18.6 million TEU
INTRA-ASIA
28.3 million TEU

Economic MeltdownStarting ~October 2008
U.S. Deficit Pegged At$1.2 trillion in 2009

U.S. Market Fundamentals
• Housing boom• Cheap and plentiful
money/easy credit• Expanding jobs,
consumption and negative savings rate
• Strong economic growth
• Housing slump• Financial crisis• No money or
unaffordable money• Unemployment• Confidence crisis• Spreading to the
global economy
2000 - 2007 2009

2009 Tonnage Falls 2.8%

2009 World Volume Down 5.8%

World Economic RecoveryBeginning in 2010

Will the Drivers of Trade Continue?
Cyclical Drivers• Trade has grown faster than GDP• Macro shocks have not impacted trendsStructural Drivers• Containerization• Trade Agreements• World Wide Web• Offshoring of Manufacturing

What Has Changed?• The international economic contraction
has transformed the global logistics chain as consumption of durable goods dropped.
• Cost of energy has fluctuated but will increase as competition for oil grows.
• Climate change is a international concern.• BUT, global population growth will remain
the primary driver of increasing demand for energy, resources, and consumer goods.


Growing World’s Population …means more trade!
• 1970 was 3.9 billion• 1980 was 4.5 billion (+0.6 billion)• 1990 was 5.2 billion (+0.7 billion)• 2000 was 6.0 billion (+0.8 billion)• …and in 2010 will be ~7 billion with
90% of the growth in the developing world including China and India.

Demand for Ocean Transportation services will
increase!
Population
GrowthConsumptionConsumption
Outsourcing
Industrial Production
International Food Production
Global Trade, Transportation & Port Growth

World Trade Still Grows

US imports are expected to decline and then grow steadily…

US exports are forecasted to remain flat through 2010 before growing…

Principal Business Drivers for Port Development Investment
1. Major consumer market2. Major manufacturing center3. Major distribution center development4. Situated on an international trade route

Two Mega-Trading Blocks
North America
South America

Four Mega-Trading BlocksRussia
China
India
Europe

Port Planning

Traditional Port Planning Considerations
• Potential site reviewstarts process
• Current and future trade routes
• Revenue predictions• Financing options
Great location for a port??

START WITH CUSTOMER!
Today three factors are controlling cargo routing decisions for global shippers -
PricePrice TimeTime
ReliabilityReliability

Co-Modality and Intermodalism
Goods move globally from origin to destination by many modes including:– Water– Highway– Rail– Pipeline– Air
?

From “Point-to-Point” Movement to Continuous Flow Pipelines
Freight transportation is a “systems” issue and must be seen from a regional/national mobility perspective.
The logistics system include waterways and terminals as well as landside access and distribution centers.

ContainerTerminal
ContainerShip
LocalTrucking
DC/RegionalWarehouse
RegionalTrucking
Retail Store
Tier I Move Tier III MoveTier II Move
Integrated Goods Movement Process for Imports

Today’s Business Planning
1. Define operating objectives2. Forecast demand for port capacity3. Evaluate port intermodal capacity4. Analyze cargo economics5. Estimate capital requirements6. Propose port ownership and
management structure

Principal Business Partners• Shipper (loads container)• Freight forwarder (may act on behalf of
the cargo owner)• Inland carrier (to and from the terminal)• Terminal operator (manages interchange)• Stevedore (loads and unloads ship)• Consignee (recipient of import container)• Broker (may act on behalf of the buyer)• Neighbors and public stakeholders

Logistics Chain is about Linking Suppliers with Customers
Producers Distributors Retailers Customers
Supply and Demand FacilitatorsSupply and Demand Facilitators
Transportation and Logistics Service Providers

International TransportInternational TransportPlanning EffortsPlanning Efforts
• US - Informal, piecemeal, market-driven, import-focused, congested, growing concerns for environment, and financially constrained
• EU – Long-term formal process with economic development and sustainability drivers (i.e., FreightVision 2050)
• Canada – Opportunistic strategy: supporting Atlantic and Pacific Gateway Initiatives to reach US Mid-west (using existing capacity) and looking to new Arctic routes to expand services
U.S. Port Executive View“The pie is getting smaller!”
• Consumer demand is drastically down in US and Europe and may stay down.
• The Far East will continue to be the manufacturing center, and the US industrial role is uncertain.
• There is an over-supply of shipping capacity and may be an over-supply of port capacity.
• Infrastructure is expensive… so “how do I get more pie?”

Panama Canal Expansion
East Coast ports reportedly investing more than $6 billion for expansions…
• Driven by ships/expansion of the Panama Canal• Break bulk & containerized cargo strategies• Port & intermodal infrastructure issues
–Availability of deep water –Road and rail connectivity –On-dock intermodal container transfer facility–Warehouses & logistics centers
• Environmental and community impact concerns

Exports?? - Movement Cost from Midwest to Northern Europe
2000100090080070060050040030020010050403020100
32%
20 %
1.4 %
10 %6 %
10 %
2 %
12 %
.5 % .75 %
2 %
100 %
$
U.S.INLAND
U.S.PORT
U.S.EMPTY
POSITIONING
EQUIPP/D
OCEANTRANSIT
EUPORT
EUEMPTY
POSITIONING
EUINLAND
CLAIMS FFFEE
AGENT TOTAL

A System at Risk in the U.S.• Decades of Underinvestment
•• Billions of dollars in deferred projects Billions of dollars in deferred projects –– especially especially maintenance dredging, channel deepening, and maintenance dredging, channel deepening, and lock and dam improvementslock and dam improvements
•• Reaching Maximum CapacityReaching Maximum Capacity•• Largely unable to accommodate modern barge Largely unable to accommodate modern barge
tows and container ships, or to handle projected tows and container ships, or to handle projected growth.growth.
•• Severely constrained by aging and congested Severely constrained by aging and congested highway and railroad connections.highway and railroad connections.
•• No Master Plan for International DevelopmentNo Master Plan for International Development•• No Commitment to Research and EducationNo Commitment to Research and Education

EU Trade Sector Challenges
• Increasing economic growth, which is coupled to…
• Addressing demand for freight transport• Avoid congestion and other negative
impacts on citizens and environment• Reduce GHG emissions (primarily CO2)• Reduce number of accidents…ACHIEVE SUSTAINABLE TRANSPORT!

FREGHTVISION 2050
• Uses a holistic approach to integrate all system aspects including infrastructure, vehicles, fuels, interoperability, etc. across criteria for solutions such as pricing, research, technologies and policies.
• Develops a long-term vision and adaptive action plan for transport and technology.
• Seeks broad based stakeholder support.
EU Transport Policies
“…the chief function of the EU transport policies is to provide a common guidance for national
policies for maintaining coherenceamong the whole EU.”
FreightVision, March 2009

“Foresight’ Process• Analyze transport policy, technology
development, and mega-trends with regard to long-distance freight transport;
• Integrate the findings into forecasts;• Develop scenarios on how to reach a
desirable future with respect to pre-selected parameters; and
• Prepare an overall action plan as defined by this vision.
Challenges to be AddressedDuring EU Foresight Process
• GHG Emissions
• Dependence on fossil fuel
• Congestion
• Accidents

In EU, trucks are not the only means to deliver cargo…
2009:Road – 90%Rail – 10%

Expanding Intermodal Rail
2015:Road – 70%Rail – 30%

Environment

What is the problem?
• EU agrees that transport is key to our economies and our lifestyles.
• BUT it causes too many accidents, too much congestion, too much noise and too much environmental damage, both through climate change and local pollution
• The anticipated growth in transport use is likely to make these problems worse.

Environmental Challenges: Global
Global warmingRising sea levelPollutionEnergy production& consumptionWaste managementHabitat lossSpecies extinction
Act Globally:World Ports Climate Declaration (40 Ports, Rotterdam, July 2008)
• Develop economic incentives for climate friendly clean shipping for global application in collaboration with IMO, shipowners and customers.
• Further develop and implement the application of onshore power supply.
• Pull each other’s knowledge to get more done & avoid duplication.
• Exchange tools & info to quantify & audit CO2footprints.

Act Regionally:Voluntary self-regulation
(e.g. ECOPORTS Foundation)• Self Diagnosis Methodology• Port Environmental Review
System• Issue-specific Workshops• Training Schemes• Environmental Performance
Indicators (EPI)• Environmental Management
Systems (EMS)• Best practice Guidelines

EU Environmental Management Successes for Ports
Environmental Management Component 1996 2004 2006 %
+ or -Environmental Plan? 45 62 82 +37Does Plan aim to raise Environmental awareness?
44 69 68 +24
Is Environmental Monitoring carried out? 53 65 72 +19
Does Plan involve community & Stakeholders?
53 39 78 +25
Designated Personnel? 55 67 88 +33Environmental Management System? 20 57 +37Review Environmental Management Programme?
43 50 +7
Policy made available to Public? 64 89 +25

Energy

The Speed to Market Impact
The increase of containership speed over the last 15 years had doubled the fuel consumption per unit of freight.

Atlantic Ocean
Pacific Ocean
Oceanic Barriers To Trade

Oil Price as Barrier to Trade• A world of triple digit oil prices and higher
transportation costs, not tariff barriers, pose the greatest challenge to trade.
• Over years from 2006 to 2008, every dollar rise in world oil prices has fed directly into a 1% rise in transport costs.
• At 2008 shipping cost, Asian trade to East Coast faced an equivalent of 9% tariff; with oil at $200, the tariff equivalent from Asia would be 15%.

Relative Shipping Costs• Shipping costs to the
East Coast rise as fuel cost rises
• In 2008, 40’ container cost around $5000 to move from Asia to the East Coast.
• If fuel goes to $200 per barrel, cost jumps to $10,000 per unit.
Source: Rubin and Tal, StrategEcon, 2008

Total Cost of Transporting a 40’ Container from Shanghai to US East Coast
08Source: Rubin and Tal, StrategEcon, 2008

In a world of triple-digit oil prices, distance costs money!
• While trade liberalization, improved global navigation and communications, and transport technologies may have flattened the world, the impact of rising transport costs from rising oil prices would make it round once again.
• The evolution of North-South trade lanes versus the current East-West trade flows would develop in response to the increased transportation costs.
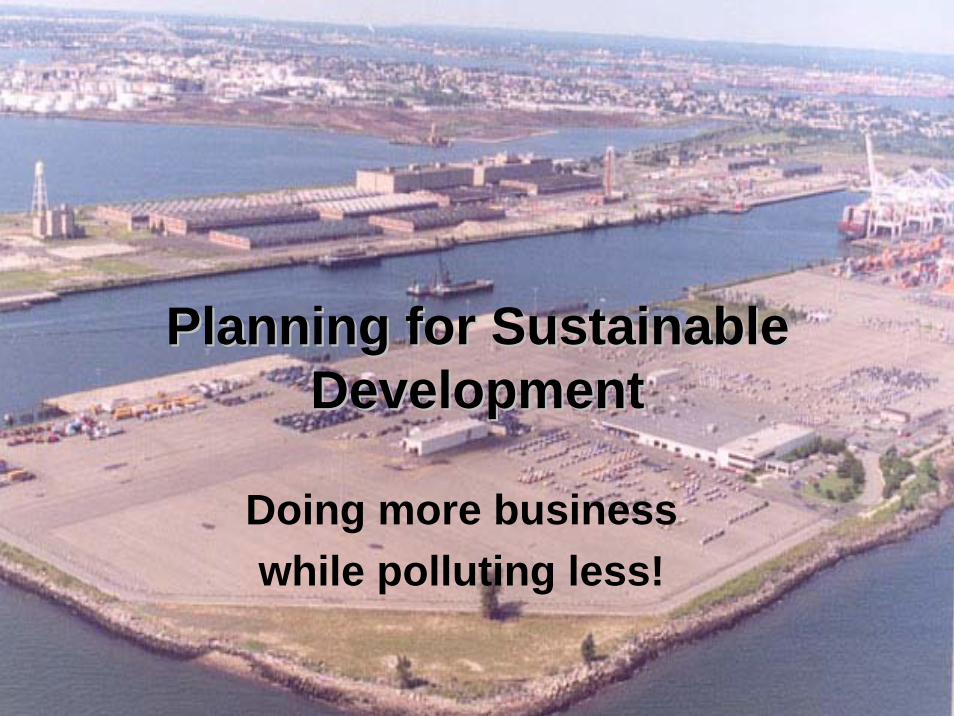
Planning for Sustainable Planning for Sustainable DevelopmentDevelopment
Doing more businesswhile polluting less!

Sustainability ConceptSustainability is a simple idea based
on the recognition that when resources are consumed faster than they are renewed, the resource is depleted, which is not sustainable.
In a sustainable world, society’s demand for economic development is balanced with the environmental and social capacity to meet that demand.
Corporate Triple Bottomline• Emerged in mid-1990s to measure overall
corporate performance• Industry strategy to capture economic,
environmental and societal values in business planning process
• Focus on producing corporate viability (economic), sustainability (envir/security) and prosperity/quality of life (societal)
• Used to formulate vision statement

Global Logisticsis a System

Global Logistics Evolving asSystem of Systems
• The global economy is highly dependent on the efficient, uninterrupted, and integrated operation of the system of vital supply lines and logistic processes.
• Ocean-going vessels activities have become closely coupled to shore-based transportation activities including intermodal delivery systems activities.
• Modern logistics is a System of Systems.

From Systems to System of Systems
• Systems– Post-World War II there
was a significant paradigm shift in dealing with new complexities by introducting new engineering techniques that focused on a complex system rather than separate individual components.
• System of Systems– Today we have a another
paradigm shift that now integrates multiple complex systems to perform a singular mission, service or purpose.
Systems are two or more subordinate entities that interact in some fashion to accomplish a process that transforms a set of predetermined inputs into a set of desired outputs, in time achieving a predetermined goal. (Leach, 2000; Grandy, 2000)
Systems are two or more subordinate entities Systems are two or more subordinate entities that interact in some fashion to accomplish a that interact in some fashion to accomplish a process that transforms a set of predetermined process that transforms a set of predetermined inputs into a set of desired outputs, in time inputs into a set of desired outputs, in time achieving a predetermined goal. (Leach, 2000; achieving a predetermined goal. (Leach, 2000; GrandyGrandy, 2000), 2000)
System of systems problems are a collection of trans‐domain networks of heterogeneous systems that are likely to exhibit operational and managerial independence, geographical distribution, and emergent and evolutionary behaviors that would not be apparent if the systems and their interactions are modeled separately (DeLaurentis, 2005).
System of systems problems are a collection of trans‐domain networks of heterogeneous systems that are likely to exhibit operational and managerial independence, geographical distribution, and emergent and evolutionary behaviors that would not be apparent if the systems and their interactions are modeled separately (DeLaurentis, 2005).

Systems vs. SoS(Engineering and Management)
Systems System of SystemsFocus Single Complex System Multiple Integrated Complex
SystemsObjective Optimization Adequacy (near optimal)Boundary Static Dynamic (Fluid)Problem Defined EmergentStructure Hierarchical NetworkGoals Unitary PluralisticApproach Process MethodologyTimeframe Deterministic Life Cycle Continuous (Evolutionary)Management
Command and Control Governance
SoS are problematic across the spectrum of technical, human/social,organizational, resource, policy, political, and managerial constraints (Keating, 2008).
SoS are problematic across the spectrum of technical, human/social,organizational, resource, policy, political, and managerial constraints (Keating, 2008).
Gorod, Sauser, and Boardman (2008). System‐of‐Systems Engineering Management: A Review of Modern History and a Path Forward. IEEE Systems Journal. 2(4):484‐499

Singapore Port TransportationSingapore PortTransportation
System aka SPTS(System of Interest)
Maritime (Sea)Transportation
SystemGround (Land)Transportation
SystemAirTransportation
System
Peopleand Goods
Containerterminals
Shippingcargo
Freightplanes
ChangiAirport’sAirfreightCenter
Freight
Singapore LandTransportation
Authority
Cars RailLines
Maritime andPort Authorityof Singapore
Government
Civil AviationAuthority ofSingapore
Ferry Terminals
PassengerPlanes
Changi Airport& other
SingaporeAirports
Taxes &transportationservice related
fees
Revenue
Tourism/PublicTransportation
Boards
Expressways Taxis
Buses
TransportationModes
Transportation to/fromSingapore Ports
Modes of LandTransportation
PrincipleStakeholders
Planes
MaritimeTransportation
Modes
AirTransportationInfrastructure
that mutuallyprovide
to unloador upload
to receive or ship
thatland at
to unloador upload
to receiveor send out
has
composed of
ownedby
administers& funds administers
& fundsadministers
& funds
usesthat land at
assistsadministration &
funding of continuesfunding for
furtherfaciliates
generate
topay
oversees
oversees
helpsmanage
consistsof
transports

Puerto Rico Opportunity?

Puerto Rico & Two Trading Blocks
North America
South America
BRIDGE
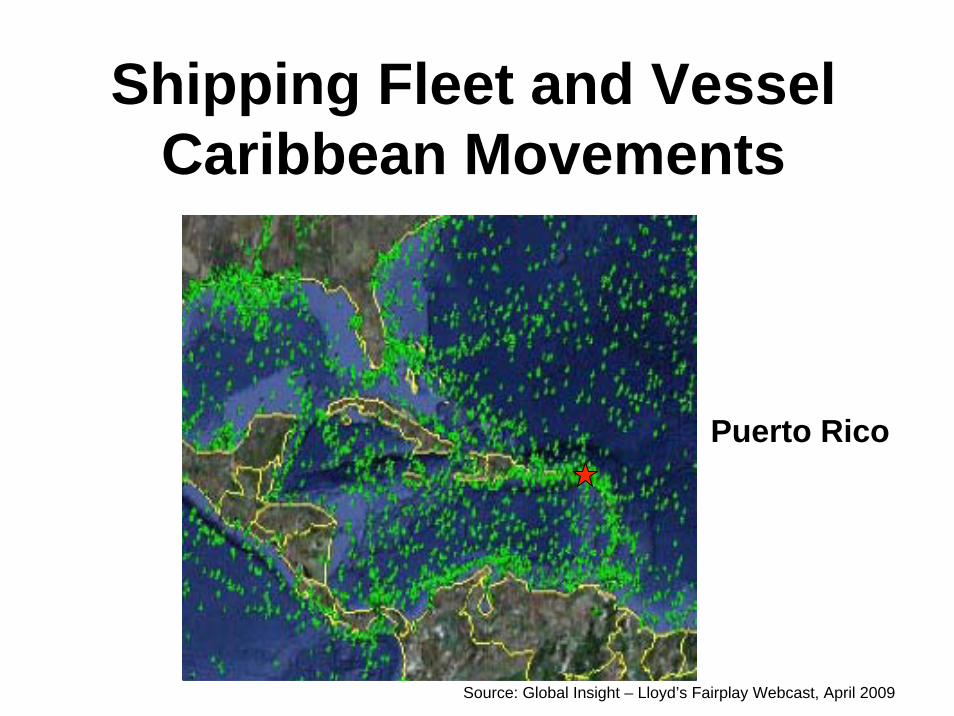
Shipping Fleet and Vessel Caribbean Movements
Source: Global Insight – Lloyd’s Fairplay Webcast, April 2009
Puerto Rico

Future
Container Port Development
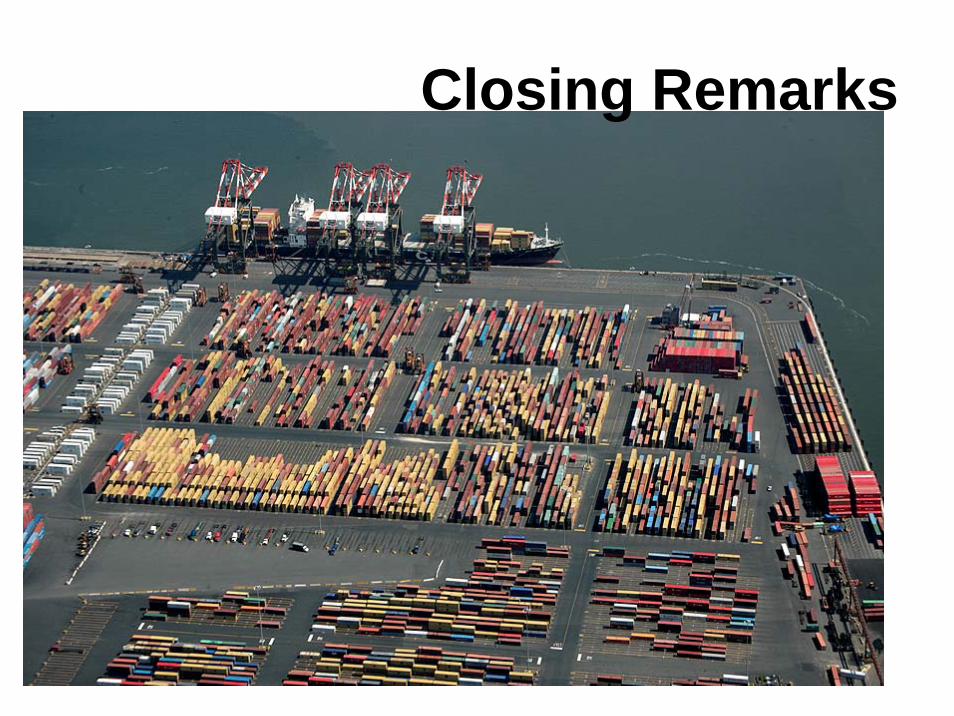
Closing Remarks

Planning Considerations
• Container volume is expected to more than double in the next 20-30 years and nearly all non-bulk cargo will be containerized.
• Planning must ensure that we have the people, training, technology, transportation and terminal assets, and the infrastructure to provide reliable supply chain services.
• Logistic Chains in marine transportation industry (carriers and terminals) must be flexible to accommodate changes that will inevitable occur (i.e., current conditions).
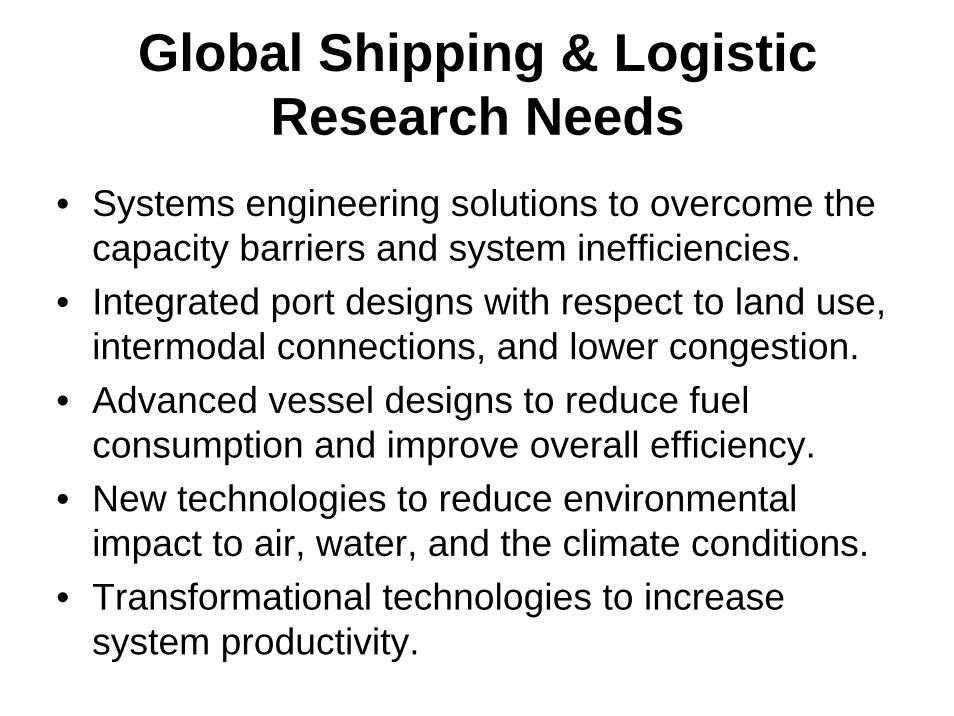
Global Shipping & Logistic Research Needs
• Systems engineering solutions to overcome the capacity barriers and system inefficiencies.
• Integrated port designs with respect to land use, intermodal connections, and lower congestion.
• Advanced vessel designs to reduce fuel consumption and improve overall efficiency.
• New technologies to reduce environmental impact to air, water, and the climate conditions.
• Transformational technologies to increase system productivity.

“Everything in the Universe is linked to everything else.”
John Muir