international evidence on the value of corporate...
TRANSCRIPT
International Evidence on the Value ofCorporate Diversification
KARL LINS and HENRI SERVAES*
ABSTRACT
The valuation effect of diversification is examined for large samples of firms inGermany, Japan, and the United Kingdom for 1992 and 1994. We find no signif-icant diversification discount in Germany, but a significant diversification dis-count of 10 percent in Japan and 15 percent in the U.K. Concentrated ownershipin the hands of insiders enhances the valuation effect of diversification in Ger-many, but not in Japan or the U.K. For Japan, only firms with strong links to anindustrial group have a diversification discount. These findings suggest that in-ternational differences in corporate governance affect the impact of diversificationon shareholder wealth.
RECENT EVIDENCE SUGGESTS THAT DIVERSIFICATION has not been beneficial forU.S. corporations over the last three decades ~see Lang and Stulz ~1994!,Berger and Ofek ~1995!, and Servaes ~1996!!.1 This indicates that, on aver-age, firms have not been able to exploit the potential benefits associatedwith diversification while controlling the costs. Benefits include the creationof an internal capital market void of information asymmetries ~Williamson~1975!, Stein ~1997!!, the improved ability to take advantage of the tax ben-efits of debt financing ~Lewellen ~1971!!, and economies of scope ~Teece ~1980!!.The main costs associated with diversification are that it may be rooted inagency problems ~see Jensen ~1986!, Stulz ~1990!, and Meyer, Milgrom, andRoberts ~1992!! or lead to power struggles between divisions ~Rajan andZingales ~1998! and Rajan, Servaes, and Zingales ~2000!!. This suggests that
* Lins is from the Kenan-Flagler Business School, University of North Carolina at ChapelHill, and Servaes is from London Business School and the Kenan-Flagler Business School,University of North Carolina at Chapel Hill. We thank Alejandro Beruete, David Denis, AmyDittmar, Luigi Giuso, Omesh Kini, Mark Lang, John Matsusaka, Antonio Mello, Eli Ofek, TodPerry, David Ravenscraft, Kristian Rydqvist, Anil Shivdasani, David Stangeland, René Stulz,Frans Tempelaar, Kurt Verweire, Robert Vishny, Marc Zenner, an anonymous referee, and par-ticipants at the EIASM 1997 Workshop on Corporate Finance, the CEPR 1997 Corporate Fi-nance conference, the Third Georgia Tech0Wachovia Capital Markets International Financeconference, the 1997 European Financial Management Association conference, the 1997 Euro-pean Finance Association conference, the 1997 Financial Management Association conference,the 1998 American Finance Association conference, and the London Business School financeworkshop for helpful comments and suggestions. Servaes acknowledges the support of the O’Herronand McColl Faculty Fellowships at the University of North Carolina at Chapel Hill.
1 See, however, Matsusaka ~1993! and Hubbard and Palia ~1999!, who find positive announce-ment effects associated with diversifying acquisitions during the 1960s.
THE JOURNAL OF FINANCE • VOL. LIV, NO. 6 • DECEMBER 1999
2215
firms often engage in diversification without the best interests of sharehold-ers in mind. Scharfstein and Stein ~1997!, Matsusaka and Nanda ~1996!,and Rajan et al. ~2000! consider the improved allocation of capital in aninternal capital market as well as the associated costs.2
In this paper, we examine whether companies in Germany, Japan, and theUnited Kingdom have been able to overcome the costs associated with di-versification, and therefore have enhanced shareholder wealth in the pro-cess of diversifying. The institutional environment in Germany and Japan isvery different from that in the United States, and various authors havesuggested that agency problems may be less severe in those countries ~e.g.,see Grundfest ~1990! and Prowse ~1990!!, partly because they have a moreconcentrated corporate ownership structure. Despite their overall similarityin institutional environment, a number of differences exist between the cor-porate organizational structures in Germany and Japan. For example, bankownership is limited in Japan, but not in Germany, and many Japanesefirms belong to industrial groups, better known as keiretsu organizations;such a formal group structure does not exist in Germany. Both countrieslack an active takeover market, but recent evidence suggests that internalcontrol mechanisms play an important role in the disciplining of poorly per-forming managers in both Germany and Japan ~Kaplan ~1994a, 1994b! andKang and Shivdasani ~1995!!. The institutional environment in the UnitedKingdom, on the other hand, is similar to that in the United States. Shareownership by banks is limited by law ~Roe ~1990!!, most companies have fewlarge shareholders, and intercorporate equity holdings are small ~Franksand Mayer ~1998!!. Thus, studying the U.K. provides an opportunity to ver-ify whether diversification has also led to shareholder losses in this economy.
Our results support the notion that the effect of diversification on firmvalue is different across countries. For samples that contain all Germanexchange-listed firms at the end of 1992 and 1994, we find no evidence thatdiversification reduces shareholder wealth. There is no evidence that share-holders benefit from diversification either, which suggests that the costs andbenefits offset each other. Unfortunately, because there are relatively fewfirms in our German sample, the effect of diversification on corporate valueis estimated imprecisely. Thus, although the effect is not significantly dif-ferent from zero, it is not significantly different from the effects for othercountries either.
Our results are more conclusive for samples of Japanese and U.K. com-panies, where we find a diversification discount of approximately 10 percentand 15 percent, respectively ~using the methodology proposed by Berger andOfek ~1995!!. The discount for the United Kingdom is very similar to thediscount reported by Berger and Ofek for the United States, whereas theJapanese discount is significantly smaller.
2 Recent empirical work on the functioning of internal capital markets includes Lamont~1997!, Shin and Stulz ~1998!, Houston, James, and Marcus ~1997!, Rajan et al. ~2000!, andScharfstein ~1997!.
2216 The Journal of Finance
To shed further light on these findings, we gather data on the ownershipstructure and industrial group membership ~for Japan! of the firms in our1994 sample. Since ownership concentration is highest in Germany, followedby Japan and the U.K., we explore whether ownership concentration is re-lated to the diversification discount in these countries. In Germany, we finda diversification discount only when insider ownership is below five percent.In contrast, insider ownership does not affect the diversification discount forJapan or for the U.K. For Japan, we also examine whether the industrialgroup structure affects the diversification discount and find that diversifiedfirms in Japan do not trade at a discount unless they have a strong link withan industrial group. This is consistent with an agency cost interpretation. Ifthe groups act as conglomerate organizations, then individual group mem-bers do not need to be diversified to reap the benefits of diversification.Without the benefits, only the costs matter. In our sample, diversified firmswith a strong association to an industrial group trade at a discount of 30percent.
Overall, these results suggest that the value of diversification is related tothe institutional structure of a country. However, no consistent pattern emergesacross countries.
The remainder of this paper is organized as follows. Section I contains adescription of our data collection procedure and our methodology., Section IIcontains the valuation results, and Section III provides robustness checks.Section IV contains the corporate governance results, and Section V concludes.
I. Data Collection and Methodology
A. Data and Descriptive Statistics
We gather a sample of publicly traded firms from Germany, Japan, and theUnited Kingdom from the Worldscope database in 1994 and 1996. Worldscopeprovides financial and ownership data for a large number of companies ~pub-lic and private! from 47 countries. We use data for the fiscal year-end closestto December 31, 1992 and 1994 for the U.K. and Germany, and closest to March31, 1993 and 1995 for Japan.
Table I lists the number of companies at the start of the sample selectionprocedure and the number of firms that drop out after applying severalscreens to the data. We start with the entire universe of firms on World-scope. Since we need market values for the companies in our study, we ex-clude private companies from the analysis. We also exclude corporationsthat are not listed on the country’s major stock exchanges. We exclude allcompanies whose main line of business is in the financial or the servicesindustries ~SIC 6000–9999!. Financial firms are eliminated because our mainvaluation measure, the market-to-sales ratio, cannot be computed for thisindustry since sales figures are provided only sporadically for financial ser-vices companies. Service firms are excluded because we find few of them inGermany, and we want to maintain consistency for all countries. All German
The Value of Corporate Diversification 2217

Table I
Sample Selection ProcedureData are gathered from the Worldscope database. Excluded from the sample are: private firms, firms not traded on major stock exchanges~Frankfurt and Düsseldorf for Germany, Tokyo and Osaka for Japan, and London for the United Kingdom!, firms in the financial or servicesindustries, firms classified as diversified that do not report segment sales, and firms diversified into the financial or services industries.
1992 1994
Germany JapanUnited
Kingdom Germany JapanUnited
Kingdom
Number of firms on Worldscope 467 1619 1703 564 2076 1797
Subtract: ^225& ^100& ^297& ^261& ^178& ^405&a. Private firmsb. Firms not traded on major stock exchanges
Subtract: Firms in the financial or services industries ^56& ^298& ^466& ^62& ^258& ^490&
Firms remaining 186 1221 940 241 1640 902
Random sample for Japan and the U.K. 186 900 450 241 900 450
Subtract: ^12& ^92& ^59& ^14& ^122& ^109&a. Firms classified as diversified that do not report sales by
segmentb. Firms diversified in the financial or services industry
Final sample 174 808 391 227 778 341
2218T
he
Jou
rnal
ofF
inan
ce

companies that remain after applying these screens are included in our sub-sequent analysis. For Japan and the U.K. we collect random samples of 900and 450 companies, respectively, to keep the data collection process man-ageable. We collect larger samples for Japan because subsequent tests focuson the industrial group structure, and we want to make sure that we havea sufficient number of diversified firms affiliated with industrial groups todraw inferences that are both statistically and economically meaningful.
We measure diversification at the firm level, but firms can also diversifythrough membership in industrial groups. For Japan, we examine in Sec-tion IV.C whether group membership affects the benefits of diversificationat the firm level, but we do not study the valuation effect of diversificationat the group level.
We classify firms as diversified when they report sales in two or moresegments ~defined at the two-digit SIC code level!, and the most importantsegment accounts for less than 90 percent of total sales. This 90 percentcutoff leads to a diversification classification similar to the one companiesare required to follow in the United States.3 We base our analysis exclusivelyon sales because we can get consistent segment data for all three countrieson this variable only; data on segment profitability and assets are very sparse.Diversification is defined at the two-digit SIC code level since U.S. evidencesuggests that there are no penalties for related diversification ~see Bergerand Ofek ~1995!!. Firms that are vertically integrated between manufactur-ing and distribution are classified as single-segment firms, but our resultsare not affected by this procedure.
We further eliminate companies for which Worldscope reports multipleSIC codes, but for which all sales are grouped together. We assume thatthese companies are diversified, but because they lack segment data, it isimpossible to analyze the valuation of the segments.4 The name of the seg-ment provided in the financial statements can usually be linked to the SICcode reported by Worldscope. However, when the segment description differsfrom the Worldscope industry code, we assign the firm to the proper indus-try based on this description. In other words, we correct the SIC codes re-ported by Worldscope when necessary. When we are unable to link a segmentdescription to a specific industry, we exclude the company from the sample.
3 Worldscope reports the percentage of sales in each segment. The percentages always sumto 100. Thus, we do not encounter the problem faced by Berger and Ofek ~1995! that the sumof the sales in each segment sometimes deviates from total firm sales.
4 Segment disclosure requirements in the U.K. and Japan are similar to those in the UnitedStates, although these regulations have been adopted fairly recently. German firms have morediscretion in reporting segment data. Neither U.K. nor German companies are required todisclose segment information if it compromises their competitive position. ~See Roberts, Weet-man, and Gordon ~1998! for more information.! Few diversified firms are excluded from oursample because of a lack of segment disclosure information: three percent of German and U.K.firms in 1992, two percent of German and U.K. firms in 1994, and two percent of Japanesefirms in 1992 ~none in 1994!. Moreover, the raw market-to-sales ratios of the excluded firms aresimilar to those of the firms included in our sample. We therefore do not believe that the lackof disclosure of segment information for these firms affects our findings.
The Value of Corporate Diversification 2219
Finally, we eliminate firms that have diversified into the financial or ser-vices industries to avoid potential bias in our imputation of diversified firmvalues. After applying all these screens, our 1992 sample contains 174 Ger-man firms, 808 Japanese firms, and 391 U.K. firms, and our 1994 samplecontains 227 German firms, 778 Japanese firms, and 341 U.K. firms.
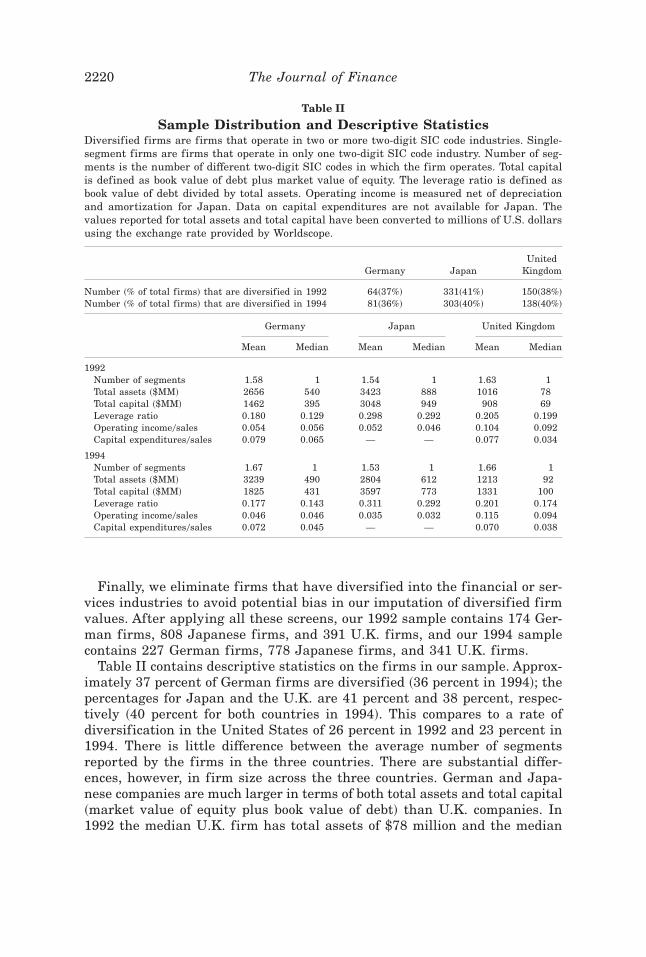
Table II contains descriptive statistics on the firms in our sample. Approx-imately 37 percent of German firms are diversified ~36 percent in 1994!; thepercentages for Japan and the U.K. are 41 percent and 38 percent, respec-tively ~40 percent for both countries in 1994!. This compares to a rate ofdiversification in the United States of 26 percent in 1992 and 23 percent in1994. There is little difference between the average number of segmentsreported by the firms in the three countries. There are substantial differ-ences, however, in firm size across the three countries. German and Japa-nese companies are much larger in terms of both total assets and total capital~market value of equity plus book value of debt! than U.K. companies. In1992 the median U.K. firm has total assets of $78 million and the median
Table II
Sample Distribution and Descriptive StatisticsDiversified firms are firms that operate in two or more two-digit SIC code industries. Single-segment firms are firms that operate in only one two-digit SIC code industry. Number of seg-ments is the number of different two-digit SIC codes in which the firm operates. Total capitalis defined as book value of debt plus market value of equity. The leverage ratio is defined asbook value of debt divided by total assets. Operating income is measured net of depreciationand amortization for Japan. Data on capital expenditures are not available for Japan. Thevalues reported for total assets and total capital have been converted to millions of U.S. dollarsusing the exchange rate provided by Worldscope.
Germany JapanUnited
Kingdom
Number ~% of total firms! that are diversified in 1992 64~37%! 331~41%! 150~38%!Number ~% of total firms! that are diversified in 1994 81~36%! 303~40%! 138~40%!
Germany Japan United Kingdom
Mean Median Mean Median Mean Median
1992Number of segments 1.58 1 1.54 1 1.63 1Total assets ~$MM! 2656 540 3423 888 1016 78Total capital ~$MM! 1462 395 3048 949 908 69Leverage ratio 0.180 0.129 0.298 0.292 0.205 0.199Operating income0sales 0.054 0.056 0.052 0.046 0.104 0.092Capital expenditures0sales 0.079 0.065 — — 0.077 0.034
1994Number of segments 1.67 1 1.53 1 1.66 1Total assets ~$MM! 3239 490 2804 612 1213 92Total capital ~$MM! 1825 431 3597 773 1331 100Leverage ratio 0.177 0.143 0.311 0.292 0.201 0.174Operating income0sales 0.046 0.046 0.035 0.032 0.115 0.094Capital expenditures0sales 0.072 0.045 — — 0.070 0.038
2220 The Journal of Finance

Japanese firm has assets of $888 million. This is consistent with the discus-sion in the introduction, which indicates that the U.K. is more of a stock-market-based economy than Japan or Germany; as such, more small firmsare listed on the stock market in the U.K. than in the other two countries.This size difference is also present in the data on total capital.
There is a substantial difference in the leverage ratios of the firms in thethree countries. Consistent with Rajan and Zingales ~1995!, German firmshave the lowest leverage ratios ~median of 12.9 percent in 1992 and 14.3 per-cent in 1994! and Japanese firms have the highest debt levels ~median of29.2 percent in both years!. We also report statistics on profitability andinvestment for the firms in our sample.5 For Germany and the U.K., prof-itability is computed as operating income, before depreciation, divided bysales. For Japan, we lack specific data on depreciation so it cannot be sep-arated from operating income in this computation. Firms in the U.K. aremore profitable than German or Japanese firms. We hypothesize that partof this difference can be explained by differences in accounting rules anddifferences in the industry composition of the sample.
We also compare the characteristics of diversified and single-segment firmsin the three countries ~not reported in a table!. There are no differences inleverage between single-segment firms and diversified firms for the threecountries, which differs from Berger and Ofek ~1995! who find that multi-segment firms in the U.S. have slightly more debt. It is therefore unlikelythat these firms diversified to capture increased debt tax shields.6 Profit-ability and capital spending are also similar between the two groups of firmsin the three countries. Consistent with Berger and Ofek’s ~1995! U.S. re-sults, we find that diversified companies are much larger than single-segment firms.
B. Valuation Methodology
To investigate whether diversified firms are valued differently from single-segment firms, we employ the valuation methodology proposed by Bergerand Ofek ~1995!. Berger and Ofek develop a method based on the ratio oftotal capital to three accounting items: sales, assets, and earnings. Eachsegment of a diversified firm is assigned the valuation ratio of the median ofthe single-segment firms that operate in the same industry. The imputedvalues of all the segments of a company are then summed to compute theimputed value of that company. The natural logarithm of the ratio of the
5 We do not report capital expenditures for Japan because they are unavailable in the data-base for most companies.
6 We examine whether there is a tax advantage to debt financing in all three countries usingthe Price Waterhouse Doing Business in Germany, Japan, and U.K. guides. The tax advantageis strongest in Japan, where there is double taxation of equity income, and capital gains aretaxable. The U.K. has a partial imputation system, but there is still a tax advantage to debtfinancing, especially because capital gains are also taxable. Germany has a complete imputa-tion system, but there remains a small tax advantage to debt financing because of trade taxeslevied on corporations by local authorities ~see also Rajan and Zingales ~1995!!.
The Value of Corporate Diversification 2221
actual to imputed market value is called the excess value of the firm, and itis used to determine whether diversified firms are trading at a discount ora premium. Our approach is similar, with the following two exceptions.
First, we only employ market-to-sales ratios since we lack segment dataon earnings and assets for our sample. Second, to compute industry ratios,Berger and Ofek ~1995! use the narrowest SIC grouping that includes atleast five single-segment companies. We define industry at the two-digit SICcode level whenever there are other two-digit firms available. In a limitednumber of cases, we encounter diversified firms that operate in segments forwhich single-segment firm medians are not available. In these instances, weemploy the median market-to-sales ratio of broad industry groups, based onthe classification by Campbell ~1996!.7 Our results remain unchanged whenwe exclude these firms from our analysis.
To facilitate comparison with Berger and Ofek ~1995!, we also eliminateany company whose imputed value is four times as large or as small as itsactual value.
II. Valuation Results
In addition to making industry adjustments as suggested in the previoussection, it is also important to control for a number of other factors relatedto a firm’s market-to-sales ratio ~see Lang and Stulz ~1994! and Berger andOfek ~1995!!. Other potential determinants of the market-to-sales ratio arefirm size, profitability, growth opportunities, and other intangible assets.We control for several of these characteristics in a regression framework. Inparticular, we estimate the following cross-sectional regression model forthe three countries:
Excess value 5 a 1 b1 ~Diversification dummy! 1 b2 ~Log assets!
1 b3 ~Operating income0Sales!
1 b4 ~Capital expenditures0Sales! 1 e. ~1!
7 For example, SIC codes 34, 35, and 38 are classified together in the capital goods industry.In 1992 ~1994!, the diversified firms in Germany operate in 163 ~219! segments in total. On
average, each segment is matched with 6.4 ~7.2! single-segment firms. Forty-one ~40! percent ofthe segments are matched with five or more single-segment firms. We lack single-segmentfirms, and therefore use broad industry groups to match 12.3 ~6.4! percent of these segments.
In 1992 ~1994!, the diversified firms in Japan operate in 773 ~727! segments in total. Onaverage, each segment is matched with 30.2 ~25.3! single-segment firms. Ninety-three ~94!percent of the segments are matched with five or more single-segment firms. We lack single-segment firms for one ~zero! percent of the segments and therefore use broad industry groupsin these cases.
In 1992 ~1994!, the diversified firms in the U.K. operate in 412 ~295! segments in total. Onaverage, each segment is matched with 7.6 ~6.4! single-segment firms. Seventy-eight ~65! per-cent of the segments are matched with five or more single-segment firms. We lack single-segment firms for 1.7 ~2.4! percent of the segments, and therefore use broad industry groups inthese cases.
2222 The Journal of Finance
Excess value has been defined previously. The ratio of operating income andsales is employed as a proxy for profitability, and the ratio of capital expen-ditures and sales is a proxy for growth opportunities. Unfortunately, wecannot include capital expenditures as an independent variable for Japan,because this data item is only available for a few Japanese companies onWorldscope. The diversification dummy in the above regression captures thedifference in valuation between single-segment and diversified firms aftercontrolling for the other factors.
Table III contains the results. The diversification discount in Germany isinsignificant for both years: It is 1.1 percent for 1992 ~ p-value of 0.87! and5.7 percent for 1994 ~ p-value of 0.44!. This is very different from the U.S.evidence, presented by Lang and Stulz ~1994! and Berger and Ofek ~1995!,who find evidence of a significant discount of about 15 percent. However, thelarge standard errors on the coefficients in our models suggest that they aremeasured imprecisely.
Excess value is negatively related to firm size in Germany. Lang and Stulz~1994! also find a negative relation between firm size and firm value forU.S. companies, whereas Berger and Ofek ~1995! find a positive relation.Profitability and investment spending are positively related to excess value,as expected, but the coefficients are only significant in 1992. The inconsis-tency in the effect of the control variables across years is somewhat disturb-ing. In particular, the effect of size on excess value is significantly morenegative in 1994 than in 1992 ~ p-value 5 0.03!, while the effect of capitalexpenditures is significantly more positive in 1992 ~ p-value 5 0.01!. Furtherinvestigation reveals that the significant difference in the effect of capitalexpenditures on value is caused by an outlier.8 A closer look at the differencein the effect of size between the two years reveals that the small coefficienton size for 1992 is caused by a few small firms with low excess values. If wefocus on firms with assets above $50 million, the negative effect of size in-creases in 1992, and the difference in the effect of size between the two yearsis no longer significant. We also believe that inferences made without sizecontrols could be misleading because, in 1994, size has a significant nega-tive effect on the excess value of single-segment firms ~ p-value 5 0.00! andof multiple-segment firms ~ p-value 5 0.09!, and the effect is not signifi-cantly different for both groups. We further examine the effect of size con-trols on our results in the next section, where we analyze whether the findingsreported in Table III are different when we subdivide the sample accordingto firm size.
The regression results for Japan indicate a discount of about 8.3 percentin 1992 and 10 percent in 1994. The relation between profitability and ex-cess value is highly significant, both statistically and economically. Excessvalue and size are not significantly related.
8 One German firm in 1994 has a ratio of capital expenditures-to-sales of 1.33. Removingthis company from the analysis does not affect the other results reported in the paper.
The Value of Corporate Diversification 2223

For the United Kingdom, the diversification discount is virtually identicalin both years at 15.5 percent. Just as in Germany, the coefficients on prof-itability and capital spending are positive, but only profitability has a sig-nificant effect in 1992. It is also interesting to note that firm size has apositive effect on firm value in the U.K. for both years.
Table III
Regression Models of Excess Value on a DiversificationDummy and Control Variables for 1992 and 1994
The following regression model is estimated for each country and each year:
Excess value 5 a 1 b1~diversification dummy! 1 b2 ~ln assets!
1 b3 ~operating income-to-sales!
1 b4 ~capital expenditures-to-sales! 1 e.
Excess value is defined as the natural logarithm of the ratio of a firm’s actual market-to-salesratio to its imputed market-to-sales ratio. Diversification dummy is an indicator variable setequal to one if the firm operates in two or more segments where a segment is defined as atwo-digit SIC code industry. The p-value of the t-test of equality of the coefficient to zero isreported in parentheses. Data on capital expenditures are not available for Japan.
Variable Germany JapanUnited
Kingdom
1992 regressionsIntercept 20.148 20.137 20.568
~0.56! ~0.52! ~0.00!Diversification dummy 20.011 20.083 20.155
~0.87! ~0.01! ~0.01!Log of total assets 20.007 20.004 0.036
~0.72! ~0.74! ~0.03!Operating income-to-sales 1.130 3.484 1.273
~0.02! ~0.00! ~0.00!Capital expenditures-to-sales 1.642 — 0.024
~0.00! ~0.91!
Adjusted R2 0.11 0.14 0.10Number of observations 158 763 377
1994 regressionsIntercept 0.349 0.265 20.256
~0.01! ~0.23! ~0.00!Diversification dummy 20.057 20.100 20.154
~0.44! ~0.00! ~0.02!Log of total assets 20.066 20.017 0.047
~0.00! ~0.17! ~0.00!Operating income-to-sales 0.268 1.499 0.137
~0.48! ~0.00! ~0.25!Capital expenditures-to-sales 0.308 — 0.188
~0.35! ~0.30!
Adjusted R2 0.05 0.03 0.03Number of observations 219 761 305
2224 The Journal of Finance
Overall, these results indicate that there are differences in the valuationof diversified firms across the three countries. After controlling for otherdeterminants of excess value, we do not find a significant discount for Ger-many, but the effect is not estimated very precisely. There is a discount ofapproximately 10 percent in Japan. This is smaller than the 15 percent doc-umented in the United States by Berger and Ofek ~1995!, but it is still sub-stantial. The discount in the U.K. is about 15 percent, which is basically thesame as the U.S. discount. It is possible, however, that these differences arecaused by differences in sample composition across countries; and the lack ofconsistency of the effect of size across countries suggests that further inqui-ries into the effect of size on excess value are warranted. We perform thesetests in the following section.
III. Robustness Tests
The results reported in Table III suggest that diversified firms trade atless of a discount in Germany and Japan than in the United States. Oneissue of concern is whether these findings can be caused by differences inthe accounting treatment of the revenues of subsidiaries. All of the U.K.firms in our sample present consolidated financial statements, but approx-imately one-quarter of the Japanese firms and 15 percent of the Germanfirms do not. This inconsistency in the preparation of financial statementscould potentially bias our results. Specifically, firms that do not presentconsolidated financial statements have inf lated market-to-sales ratios, be-cause the reported sales figure does not include subsidiary sales. If there aresystematic differences between the accounting practices adopted by single-segment and multisegment firms, they may induce the results reported inthe previous section. To verify whether this is a problem, we remove allfirms from the sample that do not report consolidated financial statements~see Rajan and Zingales ~1995!!, and repeat our analyses. The results arevery similar to those reported in the previous section.
Another possibility is that our findings may be caused by differences inour implementation of the Berger and Ofek ~1995! procedure, and not byactual differences in the discount across countries. As we discuss previously,to cope with the smaller size of our samples we modify the Berger and Ofekmethodology, which may reduce the precision of our estimates and bias thecoefficients. Additionally, the industry composition of the firms in the threecountries differs from the industry composition of U.S. firms. To properlydetermine whether our findings are actually different from U.S. results, weneed to document what the diversification discount would look like in theUnited States using the sample size and industry composition of the firms inour three countries. We use simulation analysis to accomplish this. In par-ticular, we employ the following procedure, using Germany in 1994 as anexample:
~a! We gather data on the universe of all ~U.S.! firms listed on the COM-PUSTAT Business Segment database at the end of 1994.
The Value of Corporate Diversification 2225
~b! We exclude all f irms with segments in the financial or servicesindustries.
~c! We gather a random sample of 81 single-segment firms with the sameindustry distribution as the single-segment firms in Germany.
~d! We gather a random sample of 146 diversified firms whose primaryindustry ~largest in terms of sales! is the same as that of the Germandiversified firms.
~e! Using these samples, we compute excess values and estimate a cross-sectional regression of excess values on a diversification dummy andcontrol variables ~size, profitability, investment!, as in Table III. Thecoefficient on the diversification dummy captures the diversificationdiscount for a sample of U.S. firms that mimics the distribution forGermany.
~f! We repeat steps ~c! through ~e! 5,000 times.
To determine whether our findings for Germany are significantly differentfrom those for the United States, we employ the empirical distribution ob-tained in this procedure. We repeat this simulation process on the U.S. datausing the respective industry compositions of Japan and the U.K. in 1994,and for all three countries using 1992 data. We compare the simulation re-sults to the U.S. discount using the full sample in both years, and applyingthe exact procedure followed by Berger and Ofek ~1995!.
The diversification discount for Germany ~as documented in Table III! is1.1 percent in 1992. The average U.S. simulated discount using the Germansample composition is 21.3 percent, and 99 percent of all simulated dis-counts are larger than the 1.1 percent discount documented in Table III.This implies that the German discount is significantly smaller than the U.S.discount at the two percent level ~after doubling the significance level!.9 For1994, the average U.S. simulated discount using the German sample com-position is 14.1 percent, and 85 percent of all simulated discounts are largerthan the 5.7 percent discount documented in Table III. When we mimic theBerger and Ofek ~1995! procedure, we find a U.S. discount of 14 percent in1994 and 12.5 percent in 1992, based on a regression model of excess valueon a diversification dummy and control variables. Thus, the fact that theU.S. simulated discount is larger than the full-sample discount in 1992 sug-gests that the sample selection procedure or the industry composition affectsthe measured discount. Nevertheless, we can say that the difference in val-uation of U.S. and German diversified firms is significant in 1992, but notin 1994.
For Japan, we report a discount of 8.3 percent in 1992 and 10 percent in1994 ~see Table III!. This compares to an average simulated discount usingU.S. data of 23.3 percent in 1992 and 19.8 percent in 1994. This suggeststhat the discount in Japan is smaller than in the United States. The differ-
9 We double the significance level to obtain the equivalent of a two-tailed test. For example,if 50 percent of all simulated discounts are larger than the actual discounts, and 50 percent aresmaller, this suggests that both are essentially equal. In that case we would report a p-value of1.00, after doubling the significance level.
2226 The Journal of Finance

ence is significant at the one percent level in 1992 and at the four percentlevel in 1994, based on the fraction of simulated U.S. discounts smaller thanthe measured Japanese discount ~and after doubling the significance level!.
The diversification discount for the U.K. is 15.5 percent in 1992 and 15.4 per-cent in 1994 ~Table III!. Using U.S. data and the U.K. sample composition,the average simulated discount is 20.3 percent in 1992 and 16.3 percent in1994. This indicates that the discount in the U.K. is somewhat smaller thanin the United States. The difference between the two countries is not sig-nificant, however. The p-values of the pseudo-significance test based on thesimulations are 0.49 for 1992 and 0.92 for 1994.
Another reason for concern is that the effect of firm size on excess value~reported in Table III! is not consistent across countries. The effect is neg-ative and significant in Germany ~in 1994!, negative and insignificant inJapan, and positive and significant in the U.K. This leads to the question ofwhether the diversification discount is affected by firm size. To answer thisquestion, we reestimate our regression models, but include a dummy vari-able if a firm is larger than the median firm, and an interaction term be-tween the size dummy and the diversification dummy.
Two interesting findings emerge ~not reported in a table!. First, across thethree countries, 10 of the 12 groups ~two size groups in three countries forboth years! show a discount. Thus, there is little evidence of value-enhancingdiversification, even within size groups. Second, only for Germany in 1994 isthere a significant difference between the two size groups: a 20.7 percentdiscount for large firms, but a 12.2 percent premium for small firms. Theseresults suggest that there may be a size effect in the diversification discountfor Germany in 1994. This contrasts with the United States, where Bergerand Ofek ~1995! find a significantly negative coefficient on diversificationfor all size quartiles. As it turns out, for Germany, size is correlated withsome of the corporate governance variables we examine in the next section.We therefore defer this discussion until we have presented those findings.10
Overall, our results support the conjecture that there are differences inthe valuation of diversified firms across countries. In Japan, we find a sig-nificantly lower discount than in the United States. In Germany, the dis-count is also lower for both years, and it is never significantly different fromzero. However, because the sample size is smaller, the discount in Germanyis only significantly different from the U.S. discount in 1992. This does notimply that single-segment firms are not affected by agency problems in thesecountries. However, to the extent that diversification exacerbates the agencyproblem ~or is an outcome of agency problems!, our results suggest that di-versification is less of a problem for shareholders in Japan ~and possibly inGermany! than in the United States or the U.K. Of course, the notion thatagency costs are lower in Germany and Japan is by no means universallyembraced by academics and professionals; Allen ~1996! summarizes and dis-
10 We have also constructed excess values using only the larger half of the single-segmentfirms and only the smaller half of the single-segment firms. The excess values are similar tothose constructed based on the full sample of single-segment firms.
The Value of Corporate Diversification 2227

cusses the conf licting views for Japan. Furthermore, the evidence does notaddress causality—that is, it is unclear whether firms are undervalued be-cause they diversified or whether undervalued single-segment firms are morelikely to diversify. We do not address that question in this paper.
To further explore the relation between the diversification discount and acountry’s institutional environment, we examine next the governance struc-ture of our sample firms.
IV. Corporate Governance and the Costsand Benefits of Diversification
In this section, we investigate whether ownership structure and industrialgroup membership ~for Japan! affect the costs of diversification. Part of thisanalysis is similar in spirit to that of Denis, Denis, and Sarin ~1997! whoexamine the relation between ownership structure, firm value, and diversi-fication for all Value Line firms at the end of 1984. They find that diversi-fied firms have lower insider and blockholder ownership, but the relationbetween ownership structure and the valuation discount associated with di-versification is weak. We perform similar tests for the firms in our sample,but gather more extensive ownership data and focus our analysis on specificdifferences in corporate governance among the three countries. To keep thedata collection process manageable, we limit ourselves in this analysis to the1994 sample.11
A. Ownership Data
Ownership data for Germany and the U.K. are gathered from Worldscope,which provides information on ownership by all individuals and organiza-tions who own at least five percent of the stock of the firm.12 Japanese own-ership data are obtained from The Japan Company Handbook, a publicationthat lists the ten largest shareholders for each corporation, which includesmany shareholders with stakes below five percent. This is particularly im-portant for ownership by banks in Japan, who are restricted from holdingmore than five percent of the shares of a company.
For Japanese companies, we gather additional information on keiretsumembership from Industrial Groupings in Japan, a publication that con-tains detailed information on the 39 largest industrial groups. In particular,it contains comprehensive information on all of the cross-shareholdings withinthe groups. Conveniently, the publication also provides a ranking from oneto four indicating how closely a particular company is linked to a keiretsu,
11 For Germany, we gather 1992 ownership data as well to perform a robustness check on the1994 findings, which turn out to be fragile.
12 The minimum filing requirement for Germany is actually 25 percent, but companies oftenprovide details on smaller shareholdings as well; to make sure that voluntary ownership dis-closures do not bias our findings, we verify that our results remain unchanged when we focusexclusively on required disclosures ~not reported in a table!.
2228 The Journal of Finance

with four being a very strong link and a one being a very weak link. Com-panies not listed in this publication are classified as not being part of akeiretsu.
Table IV summarizes the ownership structure for the firms in our sample.Whenever an ownership position overlaps with the list of officers and direc-tors provided by Worldscope, we classify the position as insider ownership;individual block ownership comprises ownership by persons not on that list.Ownership is further divided into bank ownership and other institutionalinvestor ownership ~pension funds, mutual funds, and insurance compa-nies!.13 We also list in parentheses the fraction of firms for which ownershipin each category is equal to five percent or more. There are substantial dif-ferences in ownership structure across the three countries. Ownership ismuch more concentrated in Germany than in Japan or the United Kingdom.Corporations are the dominant owner in Germany, controlling approxi-mately 40 percent, on average, of the equity of other firms. Sixty-five per-cent of all firms have corporate ownership in excess of five percent. Insiderownership is also substantial at 11.9 percent. Corporations are also the dom-inant owner in Japan, but they own only half the shares of their Germancounterparts. Insider ownership is modest at 3.5 percent and bank owner-ship stands at 12.3 percent. Institutions other than banks are the largestshareholders in the U.K., with 17.2 percent of the stock, followed by insiderswith 7.8 percent and other individuals with three percent.14
B. Does Ownership Structure Explain the Diversification Discount?
In this section, we investigate whether the magnitude of the diversificationdiscount depends on the ownership structure of the corporations. If diversifi-cation is less costly in Japan ~and perhaps in Germany! than in the United Statesand the U.K. because ownership is more concentrated in these countries, thenwe should find a relation between the benefits of diversification and owner-ship concentration within each country. The main problem with this analysisis that ownership structure may be correlated with firm size, and given theevidence we presented previously on the relation between firm size and the di-versification discount in Germany ~in 1994!, it may be impossible to disen-tangle these effects. We do find a significant negative correlation between insiderownership and size in all three countries. Although size is negatively corre-lated with corporate ownership in Germany and Japan, all of the correlationsare relatively small, which may alleviate the problem.
To determine whether the diversification discount is related to ownershipconcentration, we estimate regression models similar to the ones reported inTable III, but we now include ownership variables and interaction terms be-tween the ownership variables and the diversification dummy. To measure own-
13 This classification is based on the Euromoney Bank Atlas ~1995!, Thompson’s Bank Di-rectory ~1995, 1996!, and several publications of Euromoney that contain lists of the world’slargest institutional investors.
14 Actual institutional ownership is likely to be much higher in the U.K., since only institu-tions that meet the five percent reporting cutoff are included in this sample.
The Value of Corporate Diversification 2229
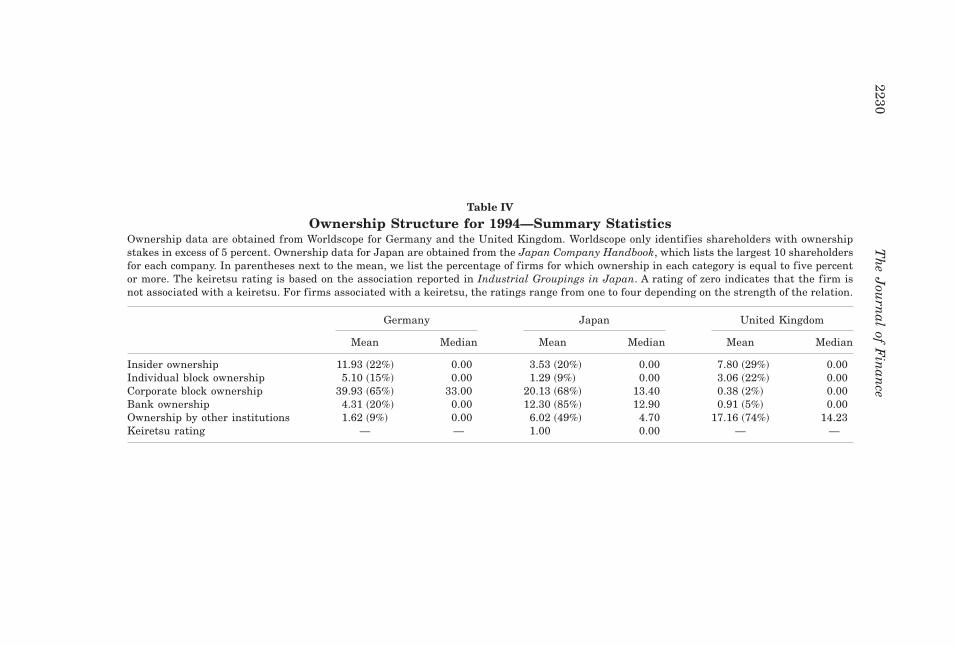
Table IV
Ownership Structure for 1994—Summary StatisticsOwnership data are obtained from Worldscope for Germany and the United Kingdom. Worldscope only identifies shareholders with ownershipstakes in excess of 5 percent. Ownership data for Japan are obtained from the Japan Company Handbook, which lists the largest 10 shareholdersfor each company. In parentheses next to the mean, we list the percentage of firms for which ownership in each category is equal to five percentor more. The keiretsu rating is based on the association reported in Industrial Groupings in Japan. A rating of zero indicates that the firm isnot associated with a keiretsu. For firms associated with a keiretsu, the ratings range from one to four depending on the strength of the relation.
Germany Japan United Kingdom
Mean Median Mean Median Mean Median
Insider ownership 11.93 ~22%! 0.00 3.53 ~20%! 0.00 7.80 ~29%! 0.00Individual block ownership 5.10 ~15%! 0.00 1.29 ~9%! 0.00 3.06 ~22%! 0.00Corporate block ownership 39.93 ~65%! 33.00 20.13 ~68%! 13.40 0.38 ~2%! 0.00Bank ownership 4.31 ~20%! 0.00 12.30 ~85%! 12.90 0.91 ~5%! 0.00Ownership by other institutions 1.62 ~9%! 0.00 6.02 ~49%! 4.70 17.16 ~74%! 14.23Keiretsu rating — — 1.00 0.00 — —
2230T
he
Jou
rnal
ofF
inan
ce

ership, we construct indicator variables that we set equal to one when ownershipin a particular category equals or exceeds the five percent threshold, and zerootherwise. We use indicator variables for three reasons. First, Worldscope onlyprovides information for ownership at or above this level. Since we do not knowthe level of ownership for stakes lower than five percent ~for Germany and theU.K.!, it is not clear that a continuous variable would better capture the own-ership effect. Second, the impact of ownership on the value of diversificationis not necessarily linear. Third, using dummy variables eases the interpreta-tion of the coefficients. Our results are similar when we include the level ofownership, albeit they are only significant for 1992.
Table V contains the results.15 For Germany, we find that there is a di-versification discount of 27.8 percent when insiders control less than fivepercent of the company. When insiders control at least five percent of thecompany, the effect of diversification on excess value increases by 49 per-centage points. However, insider ownership, by itself, has an insignificantnegative effect on firm value. As a result, firms that are diversified andhave insider ownership above five percent are actually valued at a smallpremium of 3.7 percent ~227.8 2 17.6 1 49.1!, which is not significantlydifferent from zero ~ p-value 5 0.89!. The difference between the 27.8 percentdiscount and the 3.7 percent premium is significant at the five percent level.Corporate ownership and bank ownership do not significantly affect the val-uation of diversified firms in Germany.
These results also shed light on our earlier finding that the diversificationdiscount in Germany is significant only for large companies. Insider owner-ship is negatively correlated with size and positively correlated with thevaluation effects of diversification. Thus, the ownership result could be drivenjust by size. When we estimate separate regressions for large and smallfirms, however, we continue to find that insider ownership enhances thevalue of diversification, although this effect is significant only for small firms~not reported in a table!. This suggests that the ownership result is ratherfragile.16 Unfortunately, gathering a larger sample is not an option since wehave gathered all available data for German companies. We therefore gatherownership data for 1992 as well, and repeat our analyses. For the sake ofbrevity, these results are not reported in a table. The regression models areconsistent with the findings for 1994: Insider ownership significantly re-duces the diversification discount. These results continue to be significantfor subsets of small and large firms.
15 Germany has 17 diversified firms with insider ownership of five percent or more, 45diversified firms with corporate ownership of five percent or more, and 19 diversified firmswith bank ownership of five percent or more. Japan has 41 diversified firms with insider own-ership of five percent or more, 184 diversified firms with corporate ownership of five percent ormore, and 182 diversified firms with bank ownership of five percent or more. The UnitedKingdom has 21 diversified firms with insider ownership of five percent or more, one diversi-fied firm with corporate ownership of five percent or more, and six diversified firms with bankownership of five percent or more.
16 Of course, dividing the sample into two subsets reduces the power of the tests.
The Value of Corporate Diversification 2231
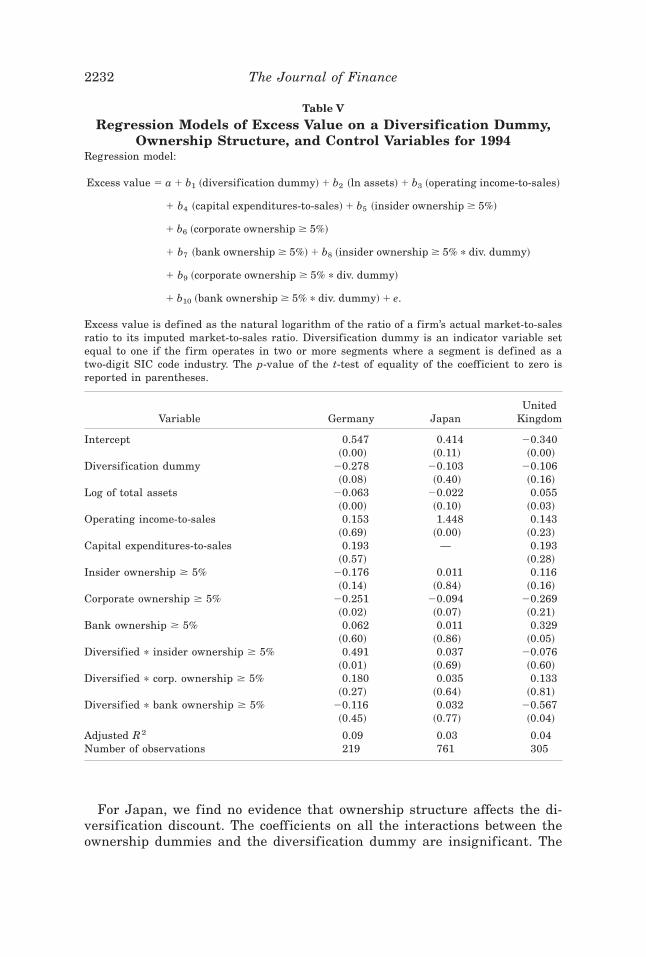
For Japan, we find no evidence that ownership structure affects the di-versification discount. The coefficients on all the interactions between theownership dummies and the diversification dummy are insignificant. The
Table V
Regression Models of Excess Value on a Diversification Dummy,Ownership Structure, and Control Variables for 1994
Regression model:
Excess value 5 a 1 b1 ~diversification dummy! 1 b2 ~ln assets! 1 b3 ~operating income-to-sales!
1 b4 ~capital expenditures-to-sales! 1 b5 ~insider ownership $ 5%!
1 b6 ~corporate ownership $ 5%!
1 b7 ~bank ownership $ 5%! 1 b8 ~insider ownership $ 5% * div. dummy!
1 b9 ~corporate ownership $ 5% * div. dummy!
1 b10 ~bank ownership $ 5% * div. dummy! 1 e.
Excess value is defined as the natural logarithm of the ratio of a firm’s actual market-to-salesratio to its imputed market-to-sales ratio. Diversification dummy is an indicator variable setequal to one if the firm operates in two or more segments where a segment is defined as atwo-digit SIC code industry. The p-value of the t-test of equality of the coefficient to zero isreported in parentheses.
Variable Germany JapanUnited
Kingdom
Intercept 0.547 0.414 20.340~0.00! ~0.11! ~0.00!
Diversification dummy 20.278 20.103 20.106~0.08! ~0.40! ~0.16!
Log of total assets 20.063 20.022 0.055~0.00! ~0.10! ~0.03!
Operating income-to-sales 0.153 1.448 0.143~0.69! ~0.00! ~0.23!
Capital expenditures-to-sales 0.193 — 0.193~0.57! ~0.28!
Insider ownership $ 5% 20.176 0.011 0.116~0.14! ~0.84! ~0.16!
Corporate ownership $ 5% 20.251 20.094 20.269~0.02! ~0.07! ~0.21!
Bank ownership $ 5% 0.062 0.011 0.329~0.60! ~0.86! ~0.05!
Diversified * insider ownership $ 5% 0.491 0.037 20.076~0.01! ~0.69! ~0.60!
Diversified * corp. ownership $ 5% 0.180 0.035 0.133~0.27! ~0.64! ~0.81!
Diversified * bank ownership $ 5% 20.116 0.032 20.567~0.45! ~0.77! ~0.04!
Adjusted R2 0.09 0.03 0.04Number of observations 219 761 305
2232 The Journal of Finance
results for the U.K. are similar to those for Japan regarding insider own-ership and corporate ownership: The diversification discount is not mate-rially affected by either group of ownership. The results on bank ownershipin the U.K. are quite intriguing. We find a large discount for diversifiedfirms that are owned by banks, but a large premium on bank ownership byitself. These findings are difficult to reconcile with any of the argumentson the costs and benefits of concentrated ownership. Further examination,however, reveals that only 16 firms in our sample ~four percent of thesample! have bank ownership in excess of five percent, and only six ofthese firms are diversified. We are therefore reluctant to draw any conclu-sions from this result.
To summarize, the results in Table V indicate that ownership struc-ture affects the benefits of diversification in Germany, but not in Japannor the U.K. We find a relation only for insider ownership. Ownership byother corporations or by banks is not related to the valuation effect ofdiversification. Either these parties are not effective monitors, or they de-rive private benefits from diversification. For example, diversification mayenhance the ability of a corporation to repay its bank debt, which is ben-eficial for the bank shareholders who may also be major lenders to thecorporation.
If insider ownership is important in Germany, why do we not find asimilar effect in Japan or the U.K.? One possibility is that the dummyvariables do not capture the cross-sectional variation in insider ownershipacross the three countries. Insider ownership is higher in Germany and inthe U.K. than in Japan, and it is possible that insider ownership is onlyeffective when it reaches a threshold higher than five percent. However,redefining all the ownership dummies at the 10 percent level does notalter the statistical significance of the results for all three countries. Whenwe use 25 percent level dummies in Japan, we find a significant effect ofinsider ownership on diversified firm value. The coefficient on the ownership-diversification interaction dummy is 0.38 ~ p-value 5 0.06!. However, onlyeight diversified firms have insider ownership equal to or above the 25percent threshold. For the U.K., we can only use 25 percent dummies forinsider ownership since only one diversified firm has bank ownership inexcess of 25 percent and no firms have corporate ownership in excess of 25percent. We do not find a significant ownership effect. For Germany, weobtain equivalent results if we define the ownership dummies at the 25percent level.
Another explanation for the lack of consistency of the effect of insiderownership concentration on the diversification discount is that, in both Ja-pan and the U.K., diversification and insider ownership are significantlycorrelated. The correlation for Japan is 20.11 ~ p-value 5 0.00!, and for theU.K. it is 20.17 ~ p-value 5 0.00!. In Germany, this correlation is small andinsignificant ~ r 5 20.03, p-value 5 0.66!. Thus, insider ownership may ac-tually be beneficial to the extent that companies with high insider owner-ship are less likely to be diversified. Denis et al. ~1997! reach the sameconclusion in their study of U.S. firms.
The Value of Corporate Diversification 2233
C. Diversification and the Keiretsu Structure
Another feature of the Japanese corporate governance system that de-serves further examination in light of the significant diversification dis-count reported in previous sections is the keiretsu system. As mentionedpreviously, keiretsu organizations are industrial groups with strong cross-shareholdings often organized around a main bank.17
One of the alleged benefits of corporate diversification is that it allows forthe creation of an internal capital market which functions more efficientlythan the external market. To the extent that the industrial group achievesthese internal capital market benefits, there is no need for an individualfirm member to mimic the process. Li and Li ~1996! argue that “keiretsuorganizations are not fundamentally different from conglomerates ~p. 703!”and Milgrom and Roberts ~1992! contend that “member companies will sup-port one another in projects that make economic sense ~p. 580!.”18 Of course,keiretsu organizations cannot be expected to create an internal capital mar-ket that is as integrated as that of a conglomerate. It is unlikely that cashf lows of companies with poor investment opportunities f low freely to thosecompanies with excellent opportunities. However, Hoshi, Kashyap, and Scharf-stein ~1991! document that the sensitivity of investment to cash flow is smallerfor group member firms, which suggests that these firms are less finan-cially constrained. Moreover, Hoshi, Kashyap, and Scharfstein ~1990! findthat group firms ~and firms with close bank ties! are able to invest moreafter the onset of financial distress. This indicates that member firms dohave better access to financial resources. If that is the case, then there isless need for diversification. Agency motives may, therefore, be more prom-inent in member firms that decide to diversify than in nonmember firmsthat decide to diversify. If this is true, we should observe a larger diversifi-cation discount for group firms. It is also possible that the banks who pro-vide the financing to the group firms encourage diversification because itreduces the riskiness of their loans. Alternatively, group members may beunder closer scrutiny from the other companies in the group, and these firmsmay not be allowed to diversify unless it is beneficial to shareholders ~or, atthe very least, not harmful to shareholders!. If this enhanced monitoring bygroup members is not accomplished through increased share ownership, it isnot ref lected in our ownership results, and therefore not captured by themodels reported in Section IV.B.
To examine these conjectures, we include the keiretsu ratings discussed inSection IV.A in our regression models and interact our diversification mea-sures with these ratings. We report the results in Table VI. We do not in-clude ownership interactions in our models because they are insignificant in
17 See Khanna and Palepu ~1998! for empirical evidence on the costs and benefits of indus-trial group structures in India.
18 Reitman ~1997! discusses how Toyota’s suppliers, who are also members of its industrialgroup, immediately retooled to start making brake valves when the primary supplier, AisinSeiki Co., experienced a major fire.
2234 The Journal of Finance

Table VI
The Effect of Keiretsu Membership on the Valueof Diversification in Japan in 1994
Two regression models are estimated:
~1! Excess value 5 a 1 b1 ~diversification dummy! 1 b2 ~ln assets!
1 b3 ~operating income-to-sales!
1 b4 ~keiretsu dummy! 1 b5 ~keiretsu dummy * diversification dummy! 1 e.
~2! Excess value 5 a 1 b1 ~diversification dummy! 1 b2 ~ln assets!
1 b3 ~operating income-to-sales!
1 ( bj ~keiretsu rating j dummy!
1 ( bj13 ~keiretsu rating j dummy * diversification dummy! 1 e.
Excess value is defined as the natural logarithm of the ratio of a firm’s actual market-to-salesratio to its imputed market-to-sales ratio. Diversification dummy is an indicator variable setequal to one if the firm operates in two or more segments where a segment is defined as atwo-digit SIC code industry. The keiretsu rating is based on the association reported in Indus-trial Groupings in Japan. A rating of zero indicates that the firm is not associated with akeiretsu. For firms associated with a keiretsu, the ratings range from one to four depending onthe strength of the relation, where four corresponds to the strongest relation. The p-value of thet-test of equality of the coefficient to zero is reported in parentheses.
Variable ~1! ~2!
Intercept 0.159 0.107~0.47! ~0.63!
Diversification dummy 20.048 20.048~0.31! ~0.31!
Log of total assets 20.010 20.007~0.42! ~0.58!
Operating income-to-sales 1.411 1.397~0.00! ~0.00!
Keiretsu member 20.050~0.27!
Keiretsu rating 1 20.027~0.74!
Keiretsu rating 2 20.049~0.46!
Keiretsu rating 3 or 4 20.066~0.29!
Diversified * keiretsu member 20.101~0.16!
Diversified * keiretsu rating 1 0.019~0.88!
Diversified * keiretsu rating 2 20.040~0.71!
Diversified * keiretsu rating 3 or 4 20.182~0.04!
Adjusted R2 0.04 0.05Number of observations 761
The Value of Corporate Diversification 2235
Table V.19 The first model includes a dummy equal to one if a firm belongsto a keiretsu ~322 firms! and the interaction between this dummy and thediversification dummy ~146 firms!. The model indicates that diversificationis not harmful to shareholder wealth unless the firm belongs to a keiretsu,in which case the diversification discount increases by 10 percentage points.Diversified firms that belong to a keiretsu trade at a discount of 19.9 per-cent ~20.048 2 0.050 2 0.101!, which is highly significant ~ p-value 5 0.00!.However, the interaction between the diversification dummy and the keiretsudummy is insignificant.
To further enhance our understanding of this issue, we measure the effectof keiretsu inf luence on the diversification discount in the second model. Inthis specification we include three keiretsu dummies, one each for the firsttwo levels of association and one where we combine levels three and four,and three keiretsu-diversification interaction dummies.20 The model showsthat a relatively weak relation with a keiretsu ~levels one and two! does notaffect the valuation of diversified firms. Similarly, there is no significantdiscount for nonmember firms. However, a strong keiretsu affiliation ~levelsthree and four! increases the value loss to diversification by about 18 per-centage points ~ p-value 5 0.04! to a total discount of 30 percent ~20.048 20.066 2 0.182!. We also verify that our results remain unchanged if we focuson the eight largest horizontal groups.
These findings are consistent with the notion that agency problems are astronger motive for diversification in companies associated with industrialgroups. Of course, this argument does not explain why the other group mem-bers are not effective in restraining unjustified diversification, and they castdoubt on the keiretsu structure as an effective monitoring mechanism. Sincemany of the keiretsu organizations are formed around a main bank, ourresults are also consistent with recent work that emphasizes the costs ofbanking relationships ~Rajan ~1992!, Weinstein and Yafeh ~1998!!.
VI. Conclusion
This paper contains three major results. First, we find significant differ-ences in the valuation of diversified firms in Germany, Japan, and the U.K.After making appropriate industry adjustments, we find no evidence of adiversification discount in Germany. There is a discount of approximately10 percent in Japan, and of 15 percent in the United Kingdom. The discountin Japan is smaller than in the United States, but this is not the case for theU.K. The valuation of diversified firms in Germany is significantly differentfrom the valuation for similar U.S. firms in one of the two years in our
19 The effect of keiretsu membership on the diversification discount is not related to owner-ship structure. However, ownership structure and keiretsu membership are correlated. Keiretsumembers have lower insider ownership, higher corporate ownership, and higher bank ownership.
20 There are 69 firms with keiretsu rating one, 31 of which are diversified; there are 104firms with keiretsu rating two, 40 of which are diversified; and there are 149 firms with keiretsurating three and four, 75 of which are diversified.
2236 The Journal of Finance

sample. Second, we explore whether the differences in the discount are causedby differences in ownership structure. We find that concentrated ownershipin the hands of insiders enhances the valuation of diversified firms in Ger-many, but it does not affect the valuation in Japan or the United Kingdom.Third, for Japan we find that the diversification discount is only present forfirms with a strong association to keiretsu organizations.
Taken together, this evidence supports the notion that differences in cor-porate governance matter; however, a number of questions and issues re-main. First, if insider ownership concentration attenuates the diversificationdiscount in Germany, why does it not have the same effect in Japan or in theU.K.? There may be counteracting forces that we have not identified in thispaper. Second, if diversified keiretsu members trade at a substantial dis-count, why does the group structure allow it to happen? It is possible thatthese firms already performed poorly before they diversified ~see Lang andStulz ~1994! and Hyland ~1996! who report U.S. evidence in support of thisconjecture, and Servaes ~1996! who does not!.21 Alternatively, group mem-bership may insulate the firm from control pressures. These questions war-rant further investigation.
REFERENCES
Allen, Franklin, 1996, The future of the Japanese financial system, Working paper, WhartonSchool, University of Pennsylvania.
Berger, Philip, and Eli Ofek, 1995, Diversification’s effect on firm value, Journal of FinancialEconomics 37, 39–65.
Bianco, Magda, 1997, Diversification and synergies: Effects on profitability, Working paper,Bank of Italy.
Campbell, John Y., 1996, Understanding risk and return, Journal of Political Economy 104,298–345.
Denis, David J., Diane K. Denis, and Atulya Sarin, 1997, Agency problems, equity ownership,and corporate diversification, Journal of Finance 52, 135–160.
Franks, Julian, and Colin Mayer, 1998, Ownership and control of German corporations, Work-ing paper, London Business School.
Grundfest, Joseph A, 1990, Subordination of American capital, Journal of Financial Economics27, 89–114.
Hoshi, Takeo, Anil Kashyap, and David Scharfstein, 1990, The role of banks in reducing thecosts of financial distress in Japan, Journal of Financial Economics 27, 67–88.
Hoshi, Takeo, Anil Kashyap, and David Scharfstein, 1991, Corporate structure, liquidity, andinvestment: Evidence from Japanese industrial groups, Quarterly Journal of Economics106, 33–60.
Houston, Joel, Christopher James, and David Marcus, 1997, Capital market frictions and therole of internal capital markets in banking, Journal of Financial Economics 46, 135–164.
Hubbard, R. Glenn, and Darius Palia, 1999, A reexamination of the conglomerate merger wavein the 1960s: An internal capital markets view, Journal of Finance 54, 1131–1152.
Hyland, David, 1996, Why firms diversify: An empirical examination, Working paper, OhioState University.
Industrial Groupings in Japan, 1991 ~Dodwell Marketing Consultants!.Japan Company Handbook, 1995 ~Toyo Keizai Inc., Tokyo!.
21 See also Matsusaka ~1995! and Bianco ~1997! for theories unrelated to agency costs ex-plaining why diversified firms may trade at a discount.
The Value of Corporate Diversification 2237
Jensen, Michael C., 1986, Agency costs of free cash f low, corporate finance and takeovers,American Economic Review 76, 323–329.
Kang, Jun-Koo, and Anil Shivdasani, 1995, Firm performance, corporate governance, and topexecutive turnover in Japan, Journal of Financial Economics 38, 29–58.
Kaplan, Steven, 1994a, Top executives, turnover, and firm performance in Germany, Journal ofLaw, Economics and Organization 10, 142–159.
Kaplan, Steven, 1994b, Top executive rewards and firm performance: A comparison of Japanand the US, Journal of Political Economy 102, 510–546.
Khanna, Tarun, and Krishna Palepu, 1998, Is group affiliation profitable in emerging markets?An analysis of diversified Indian business groups, Working paper, Harvard Business School.
Lamont, Owen, 1997, Cash f low and investment: Evidence from internal capital markets, Jour-nal of Finance 52, 83-109.
Lang, Larry H. P., and René M. Stulz, 1994, Tobin’s q, corporate diversification and firm per-formance, Journal of Political Economy 102, 1248–1280.
Lewellen, Wilbur G., 1971, A pure financial rationale for the conglomerate merger, Journal ofFinance 26, 521–537.
Li, David D., and Shan Li, 1996, A theory of corporate scope and financial structure, Journal ofFinance 51, 691–709.
Matsusaka, John G., 1993, Takeover motives during the conglomerate merger wave, RANDJournal of Economics 24, 357–379.
Matsusaka, John G., 1995, Match-seeking: A dynamic theory of corporate diversification, Work-ing paper, University of Southern California.
Matsusaka, John G., and Vikram Nanda, 1996, Internal capital markets and corporate refo-cusing, Working paper, University of Southern California and University of Michigan.
Meyer, M., P. Milgrom, and J. Roberts, 1992, Organizational prospects, inf luence costs, andownership changes, Journal of Economics and Management Strategy 1, 9–35.
Milgrom, Paul, and John Roberts, 1992, Economics, Organization & Management ~PrenticeHall, Englewood Cliffs, N.J.!.
Price Waterhouse, 1994, Doing Business in Germany ~Price Waterhouse, New York!.Price Waterhouse, 1994, Doing Business in the United Kingdom ~Price Waterhouse, New York!.Price Waterhouse, 1995, Doing Business in Japan ~Price Waterhouse, New York!.Prowse, Stephen D, 1990, Institutional investment patterns and corporate financial behavior in
the United States and Japan, Journal of Financial Economics 27, 43–66.Rajan, Raghuram, 1992, Insider and outsiders: The choice between informed and arm’s-length
debt, Journal of Finance 47, 1367–1400.Rajan, Raghuram, Henri Servaes, and Luigi Zingales, 2000, The cost of diversity: The diversi-
fication discount and inefficient investment, Journal of Finance, forthcoming.Rajan, Raghuram, and Luigi Zingales, 1995, What do we know about capital structure? Some
evidence from international data, Journal of Finance 50, 1421–1460.Rajan, Raghuram, and Luigi Zingales, 1998, The tyranny of the inefficient: An enquiry into the
adverse consequences of power struggles, Working paper, University of Chicago.Reitman, Valerie, 1997, Toyota’s fast rebound after fire at supplier shows why it is tough, Wall
Street Journal, May 8, A1.Roberts, Clare, Pauline Weetman, and Paul Gordon, 1998, International Financial Accounting,
A Comparative Approach ~Financial Times Management, London!.Roe, Mark J., 1990, Political and legal restraints on ownership and control of public corpora-
tions, Journal of Financial Economics 27, 7–41.Scharfstein, David S., 1997, The dark side of internal capital markets II: Evidence from diver-
sified conglomerates, Working paper, MIT Sloan School of Management.Scharfstein, David S., and Jeremy C. Stein, 1997, The dark side of internal capital markets:
Divisional rent-seeking and inefficient investment, Working paper, MIT Sloan School ofManagement.
Servaes, Henri, 1996, The value of diversification during the conglomerate merger wave, Jour-nal of Finance 51, 1201–1225.
2238 The Journal of Finance

Shin, Hyun-Han, and René M. Stulz, 1998, Are internal capital markets efficient?, QuarterlyJournal of Economics 113, 531–552.
Stein, Jeremy C., 1997, Internal capital markets and the competition for corporate resources,Journal of Finance 52, 111–133.
Stulz, René M., 1990, Managerial discretion and optimal financing policies, Journal of Finan-cial Economics 26, 3–27.
Teece, David J., 1980, Economies of scope and the scope of the enterprise, Journal of EconomicBehavior and Organization 1, 223–247.
Weinstein, David E., and Yishay Yafeh, 1998, On the costs of a bank centered financial system:Evidence from the changing main bank relations in Japan, Journal of Finance 53, 635–672.
Williamson, Oliver E., 1975, Markets and Hierarchies: Analysis and Antitrust Implications ~Col-lier Macmillan Publishers, Inc., New York!.
The Value of Corporate Diversification 2239