international economics - managing the brazilian real (2013 devaluation)
TRANSCRIPT

Celine Yeo . Harvard Chan . Jonathan Ang . Nicholas Teo . Yeo Ding Run G3

Flow of Presentation
Pre 2013
Pre-2013: A strong real & currency wars
NicholasCelineDing RunJonathanHarvard
Part A
Key Developments that led to the devaluation
Part B
The actions taken by the BCB to manage the ER
Part C
India and it’s economy
Part CMeasures taken to
prevent deflation in India

0
5E+11
1E+12
1.5E+12
2E+12
2.5E+12
3E+12
1980 1981 1982 1983 1984 1985 1986 1987 1988 1989 1990 1991 1992 1993 1994 199519961997 1998 1999 2000 2001 2002 2003 2004 2005 2006 2007 2008 2009 2010 2011 2012 2013
Brazil GDP (US $)
1980 - 1984Oil Shock doubles price of imported oil. Lowered terms of trade, high debt and faced austerity from IMF
Cruzado Plan (1986)Readjust wages, freeze prices, rents and exchange rate. Inflation resumed at end of year.
Summer Plan (1989)Avoid inflation in election year. Less revenue for federal governments
New president (1990)Stabilization plan, 18 month freeze to most of private sector assets, liquidity freeze, reduce inflation
Plano Real (1994)New stabilization plan. 1) Introduction
of equilibrium budget
2) Introduction of BZL
3) Monetary Reform
Asian Financial Crisis (1997)Risk adverse as a result of EM exposure, large current account deficits
Luis Re-elected (2006)Strong economic growth under his stewardship
IMF support (1998)$41.5 bn support after crafting fiscal adjustment and structural reform
Slowing Economic Growth (2006)Sluggish consumer spending contributed to lower GDP growth

Govt ConsumptionImports
Household Consumption
InvestmentsExports
12.4%
62.5%
-14.9%
18.7%
21.7%
GDP
Household Consumption 62.5%
Investments 18.7%
Imports 14.9%
Govt Consumption 21.7%
Exports 12.4%
Introduction Before 2013Part A: After
2013
Part B:
BCB Policies
Part C: Comparison with India
GDP Composition 2013

48%
11%
24%
17%
United States
Others
China
Europe
Exports Destinations 2013
Introduction Before 2013Part A: After
2013
Part B:
BCB Policies
Part C: Comparison with India

Top Exports of Brazil
5.3%
7%
8.4%
13%
Raw Sugar
Soybeans
Crude Petroleum
Iron Ore
Introduction Before 2013Part A: After
2013
Part B:
BCB Policies
Part C: Comparison with India

The Strong Real Before 2013

Strength of the real (2010 to 2012)
Introduction Before 2013Part A: After
2013
Part B:
BCB Policies
Part C: Comparison with India
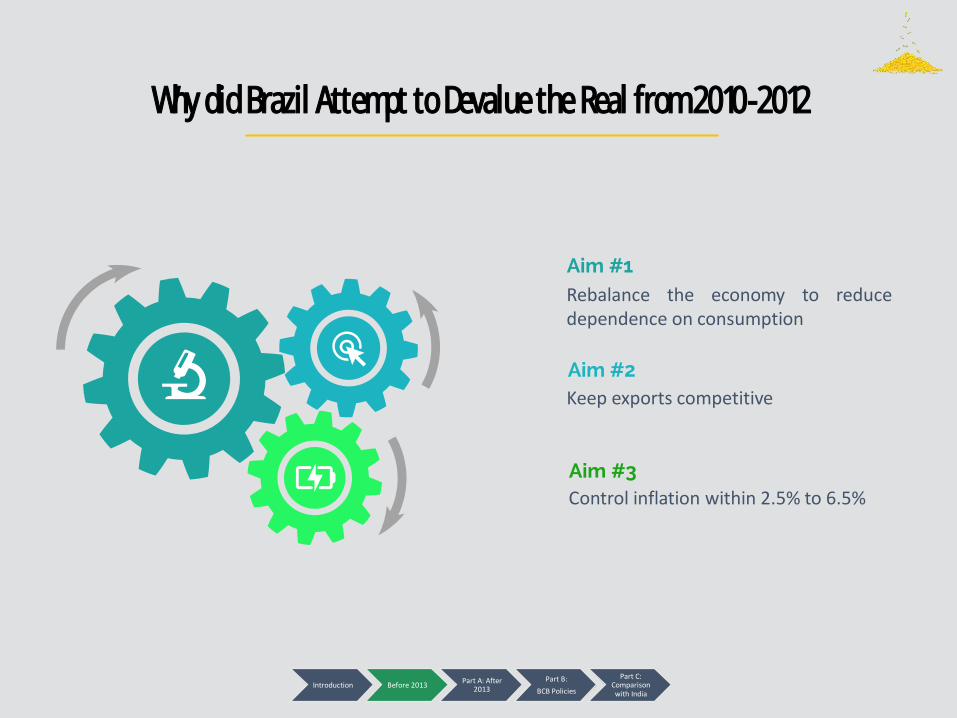
Aim #1Rebalance the economy to reducedependence on consumption
Aim #2
Aim #3
Keep exports competitive
Control inflation within 2.5% to 6.5%
Why did Brazil Attempt to Devalue the Real from 2010 -2012
Introduction Before 2013Part A: After
2013
Part B:
BCB Policies
Part C: Comparison with India

Why did Brazil Attempt to Devalue the Real from 2010 -2012
Introduction Before 2013Part A: After
2013
Part B:
BCB Policies
Part C: Comparison with India
Demand affected the realBCB decreased Selic rates 2011-
2012 before maintaining a constant rate of 7.25%. However,
it was comparatively higher to other countries, causing hot
money inflow.
High Demand for Brazilian Debt
The strong real is due to investors buying up high yielding Brazilian debt,
and this may make exports more expensive, hurting the exports.
Brazilian Central Bank (BCB) imposesextra IOF taxes on foreign investors to
reduce buyers and weaken the real. BCB also wants to devalue the real so
that it will not hurt exports.
Strong Real Hurting ExportsThe strong real is hurting the
exports of price-sensitive commodities, the bedrock of Brazil’s economy. BCB has to
devalues its currency to keep exports competitive
Protectionist PoliciesDue to years of protectionist policies, Brazilian manufacturing becomes inefficient and overpriced, losing export competitiveness
Port BureaucracyInefficient port bureaucracy and port infrastructure: turn-around time for containers of 21 days at Santos, compared to 1 or 2 days internationally. This has affected Brazil’s trade.
Reduce Dependence on ConsumptionSince Brazil has current account deficit, it shows that Brazil is dependent on consumption for growth and the source of inflation is from imports. The govt believes that devaluing the real can reduce consumption and reduce inflation.

Competitive devaluation (2009 2013)
1. Competitive devaluation from 2009 – 2013 which became prominent in Sept 2010
2. Fed, BoJ introduced loose monetary policies (i.e. QE) post 2008
3. Coined by Brazil finance minster Guido Mantega
4. Mercantilist approach to support cheaper exports
Introduction Before 2013Part A: After
2013
Part B:
BCB Policies
Part C: Comparison with India

Nov 2009Goldman Sachs declares real most overvalued currency in the world
Oct 2010Brazil increases capital controls. Doubles taxes on fixed income assets to 4%. Taxed capital inflows from 2% to 6%
Dec 2009QE1 is announced
Sept 2012QE3 is announced
June 2013Tapering is announced
Nov 2010QE 2 announced
Competitive devaluation (2009 2013) - Timeline
Introduction Before 2013Part A: After
2013
Part B:
BCB Policies
Part C: Comparison with India

What is QE?
What happens
in QE?
Unconventional formof monetary policy
Central Bank prints “new” money or use
electronically created money to buy government securities and other assets
from banks
• Aimed at lowering interest rates
• Banks use these money and lend to
consumers/businesses and buy other assets like bonds
• Creates a virtuous cycle of spending and investment
Competitive devaluation (2009 2013) - Quantitative Easing (QE)
Introduction Before 2013Part A: After
2013
Part B:
BCB Policies
Part C: Comparison with India

Competitive devaluation (2009 2013) USA
Introduction Before 2013Part A: After
2013
Part B:
BCB Policies
Part C: Comparison with India

-2013
Introduction Before 2013Part A: After
2013
Part B:
BCB Policies
Part C: Comparison with India

Strategies used to devalue currency
1. Use of interest rates – high interest rates mean constrained economic growth but higher foreign capital inflow
2. Foreign currency trades –international reserves used as insurance against crisis to smooth forex rates
3. Intervene with swap operations – To prevent depreciation of domestic currency (BZL to USD)
4. Reverse swap – Selling contacts to limit appreciation of currency (USD to BZL)
Introduction Before 2013Part A: After
2013
Part B:
BCB Policies
Part C: Comparison with India

Government carried out 36 currency swap operations between July 2011 to Dec 2012
Does not directly affect supply of foreign currency, affects the exchange rate as to alter demand for forex (short term)
FX purchases of real decreased
Introduction Before 2013Part A: After
2013
Part B:
BCB Policies
Part C: Comparison with India
Strategies used to devalue currency Currency Swap Operations

In 2012, BRL sales outweighed U.S dollar purchases inflow
BCB auctions swaps and shorts the USD
Contrato de Swap Cambial com Ajuste Periódico – the swap contracts
When the BCB believes the BRL is too cheap (undervalued) it auctions swaps and effectively goes short the USD, when it believes the real is overvalued
It auctions reverse swaps and goes long the USD– short its own currency.
Foreign reserves do not need to come into play
Introduction Before 2013Part A: After
2013
Part B:
BCB Policies
Part C: Comparison with India
Strategies used to devalue currency Currency Swap Operations

2006 – BCB bet on appreciation on USD to contain BRL rise
Flat line – represented no use of swaps
“Free floating” but actually managed currency
Adjusted with swaps
Introduction Before 2013Part A: After
2013
Part B:
BCB Policies
Part C: Comparison with India
Strategies used to devalue currency Currency Swap Operations

1. Raised IOF tax in fixed income securities from 4% to 6%
2. Boosted levy on money for margin deposits for futures trades from 0.38% to 6%
3. Measures taken to erode foreigner’s short term demand for investments
4. Between May 2009 to Dec 2012, BCB intervened 62% of all trading days
Introduction Before 2013Part A: After
2013
Part B:
BCB Policies
Part C: Comparison with India
Strategies used to devalue currency IOF Tax
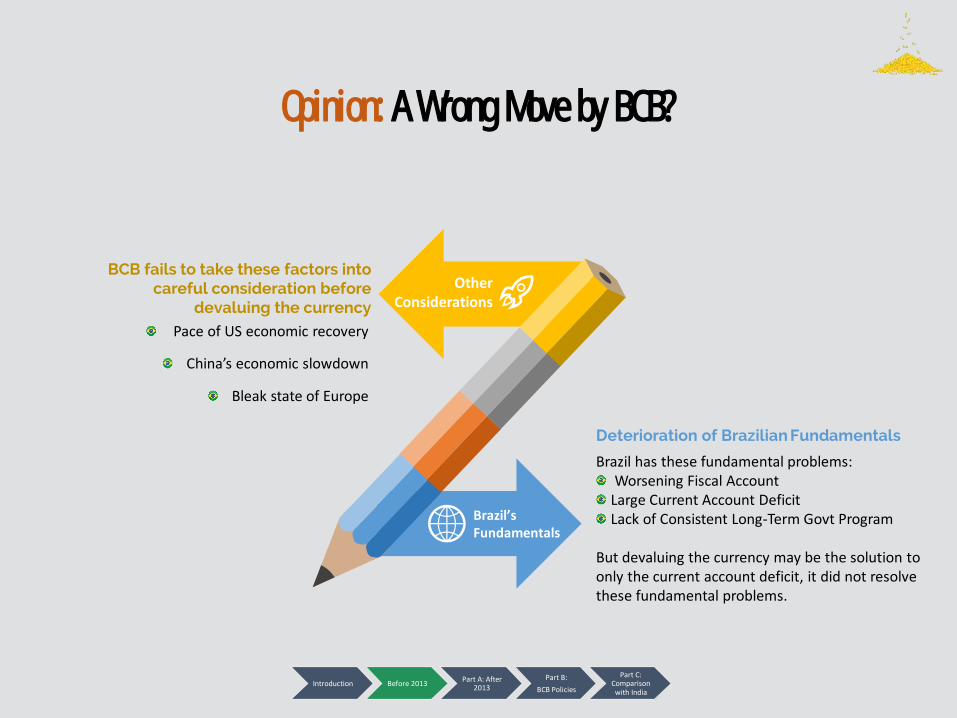
Other Considerations
BCB fails to take these factors into careful consideration before
devaluing the currency
Opinion: A Wrong Move by BCB?
Pace of US economic recovery
China’s economic slowdown
Bleak state of Europe
Deterioration of Brazilian Fundamentals
Brazil has these fundamental problems:Worsening Fiscal Account
Large Current Account DeficitLack of Consistent Long-Term Govt Program
But devaluing the currency may be the solution to only the current account deficit, it did not resolve these fundamental problems.
Introduction Before 2013Part A: After
2013
Part B:
BCB Policies
Part C: Comparison with India
Brazil’s Fundamentals

Key economic & financial developments Leading to
Devaluation
Part A

• Stagnant growth• Fiscal shocks
(Govt budget cut and Tax increases)
1.7%
7.7%
2.9%
Europe Stagnating
• Experiencing slowing growth, well below the double-digit growth it chalked up over the past 30 years.
• Slow growth as China begins to address the costs of the rapid growth that include pollution, wasted spending, corruption and finacial frugality.
• China wants to restructure the economy to rely less on heavy investments in real estate, infrastructure, capital-intesive industries and exports abroad.
China’s Slowing Growth
US Gradual Recovery
Gradually recovering from recession
Major Economies 2013
Introduction Before 2013Part A: After
2013
Part B:
BCB Policies
Part C: Comparison with India

Key developments that led to devaluation
Introduction Before 2013Part A: After
2013
Part B:
BCB Policies
Part C: Comparison with India

Key developments that led to devaluation
Balance of Payments
Current Account
Capital Account
Asset Market Approach
i*
ee
Balance of Payments

Commodity Prices
Introduction Before 2013Part A: After
2013
Part B:
BCB Policies
Part C: Comparison with India
Current Account

Commodity Exports
Image Source: MarketLineData Source: IMF, MarketLine
Dependence on commodity exports (Risks)
• Manufactured exports declined from close to 60% to 40% of total exports
• Rising prominence of iron ore and soybeans among exports, economy is more vulnerable to price shocks
• China is Brazil’s main trading partner since 2012; major importer of iron ore
• With slowing growth from china, china demands less imports from brazil. Causing Brazil’s Export to fall further
Current Account

Current Account Deficit
• Current Account Deficit increased
• Reasons for the deficit: Fall in trade surplus
• Import still continued to increase, especially fuel import
• Widening deficit( 4.17% of GDP)weaken currency additional inflation pressure as imports more costly (serious challenge for Brazil, struggling with subdued global economy and productivity shortcomings at home.)
• X-M <0 Current Account Deficit
0
5E+10
1E+11
1.5E+11
2E+11
2.5E+11
3E+11
3.5E+11
Exports of goods andservices (BoP, currentUS$)
Imports of goods andservices (BoP, currentUS$)
Image Source: Rabobank and WorldBankData Source: Rabobank
Current Account

Current Account Deficit
Image Source: Rabobank
• Increase in deficits in the Services Account (High increase of international travelling expenditure)
• Increase in deficits in Income Accounts
Although FDI remained consistent in 2013 at USD64 billion, because of the increase in CA deficit, it can no longer cover the deficit
Current Account

Weak Capital Account
Gross fixed capital formation stood at 5% lower than peak 2011 levelMost other EMs had investment growth, however Brazil has contracted
Investment in Brazil is lower than average compared to other EMs
Introduction Before 2013Part A: After
2013
Part B:
BCB Policies
Part C: Comparison with India
Capital Account

Why are there low investments rate in Brazil?
Reliance on FDI
Introduction Before 2013Part A: After
2013
Part B:
BCB Policies
Part C: Comparison with India
Poor legal rights, ease of doing businessPoor ratings in time to open a business and prepare and pay taxes
Difficulty in doing business deters FDI
Capital Account

Reliance on FDI Capital Account
In May 2013, there was a riot due to public outcry due to the large sum spent on building stadiums when transportation, healthcare and
education require funds more urgently.Brazil govt was slow in its response to the protests and this has
severely affected investors’ confidence and decapitated FDI in BrazilWith the US signaling a tapering of its monetary policy, the FDI in Brazil
has been severely affected.

Reliance on FDI
Introduction Before 2013Part A: After
2013
Part B:
BCB Policies
Part C: Comparison with India
Balance of payments has mainly been funded via capital accountFDIs have been remaining constant but portfolio investment fluctuates greatly
Massive and rapid change in capital inflows affects export competitiveness
Brazil relies on its capital account to finance its BOP. The fluctuations may lead to deeper CA deficit & speculative attacks may occur.
Capital Account

Large Commercial Outflows
Extremely open capital account – short term capital flows bring instability to economy
Ineffective elimination of capital outflows –reduction of Financial Transactions Tax on fixed income securities from 6% to 0%
These short term portfolio investments lead to instability of the BOP and may lead to currency crisis.
Introduction Before 2013Part A: After
2013
Part B:
BCB Policies
Part C: Comparison with India
Capital Account

Balance of Payments - Conclusion
The BOP in Brazil is mainly funded through the capital account
Commodity prices have affect exports and CA is in deficit
The capital account is also contributed to by “hot money” or short term portfolio investments
These factors may lead to an instability of the BOP and a persistent current account deficit. Ultimately, these could lead to a currency crisis.
Introduction Before 2013Part A: After
2013
Part B:
BCB Policies
Part C: Comparison with India
Balance of Payments

Asset Market Approach

Asset market approach - Interest Rates i*
• US Fed Funds rates remained constant
• 2013, Federal Reserve has considered tapering its QE Program – Market has expectation of an increase in interest rates
An expectation of the rise in US interest rates also led to a devaluation in Brazilian Real, as brazil experiences capital outflow to US.

Asset market approach - Interest Rates
Brazilian exchange rate expectation
ee
• Brazil’s relys on its capital account, particularly short term portfolio investment
• This “hot money” is expected to flow out with the backdrop of an improving US economy
There is an expectation for the Brazilian real to depreciate due to projected trade account deficit

Asset market theory - Conclusion
Interest rates in USA are expected to rise due to the taper
The trade deficit has created expectations of devaluation
These factors support the devaluation of the real.
Introduction Before 2013Part A: After
2013
Part B:
BCB Policies
Part C: Comparison with India
Asset Market

• Brazil has faced persistent high inflation in recent years and this has led to an increase in Selic rate to curb inflation
• Central Bank’s Inflation target is 4.5% with a ± 2% expectation
• Central only managed to hit the high side of 6.5% with interest rate of more than 10%
To curb the high inflation, BCB raised the high Selic rate, this in-turn increase the cost of borrowing, hurting the consumption in the Brazil.
Introduction Before 2013Part A: After
2013
Part B:
BCB Policies
Part C: Comparison with India

The Brazilian Lifestyle
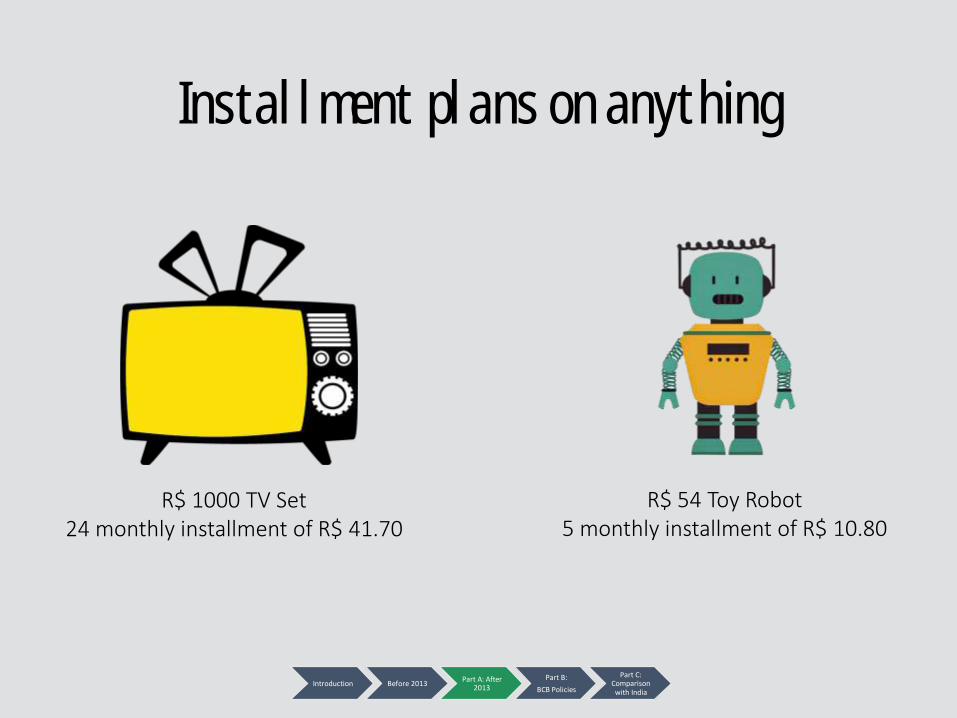
Installment plans on anything
R$ 1000 TV Set24 monthly installment of R$ 41.70
R$ 54 Toy Robot5 monthly installment of R$ 10.80
Introduction Before 2013Part A: After
2013
Part B:
BCB Policies
Part C: Comparison with India

• Steady credit growth in Brazil from the consumer and companies.
• This shows a culture and reliance of credit for consumption.
• At some point, the interest charged will be too much and there will be defaults which will affect consumption in brazil, worsening its economic state.
A Culture of Credit
Introduction Before 2013Part A: After
2013
Part B:
BCB Policies
Part C: Comparison with India

• One of highest Govt Debt in the world and financed with a deficit
• Brazil Govt reliance on debt to finance policies
A Culture of Credit in Govt
Introduction Before 2013Part A: After
2013
Part B:
BCB Policies
Part C: Comparison with India

Managing the
ER
Managing the ERPart B

Policy Instruments To Manage the Exchange Rate
Brazilian Central Bank (BCB)
Deepening of Financial Markets
Monetary Policy
- Interest Rate Policy
Macro-Prudential Policy
- Eliminates Reserve Requirement Ratio
Capital Control Management
- Eliminate IOF Tax on Fixed-Income Instruments
Government Fiscal Policies
IPI Tax on Automobiles
*Will not be covered in details

Brazilian Central Bank
(BCB)
Deepening of Financial Markets
Monetary Policy
- Interest Rate Policy
Capital Control Management
- Eliminate IOF Tax on Fixed-Income Instruments
Policy Instruments To Manage the Exchange Rate
Stabilization of the Real
Price Stability Objectives
Maintain Financial Market Stability
Macro-Prudential Policy
- Eliminates Reserve Requirement Ratio
Mitigate Reversal of Short-Term Capital Flows

Inflation Rate TargetingWhen planning monetary policy: BCB sets Selic rate to target inflation at 4.5%, with tolerance range between 2.5% and 6.5%
Set direction and focus for monetary policy
Improves investors’ confidence in Brazil
Achieve stability in exchange rate
Introduction Before 2013Part A: After
2013
Part B:
BCB Policies
Part C: Comparison with India

On 22 Aug 2013, BCB announced $60 billion currency intervention program:
o $500 million worth of currency swap auctions and derivative contracts auctions from Mon-Thu
o $1 billion on spot market through repurchase agreements on Fri
Currency Intervention Program
Introduction Before 2013Part A: After
2013
Part B:
BCB Policies
Part C: Comparison with India

$500 million worth of currency swaps auctions and derivative contracts auctions from Mon-Thu
o Daily auctions of derivative contracts that investors use to place future bets against the Brazilian real.
o These derivative contracts are seen as a method to protect investors' holdings of the local currency, so that they do not rush to sell at the first sign of weakness.
This widens the range of money market instruments, build financial market external resilience and stabilizes the real
Ensure both the stability in exchange rate and Brazilian real liquidity
1. Deepening of Financial Markets via Currency Swap Auctions
Introduction Before 2013Part A: After
2013
Part B:
BCB Policies
Part C: Comparison with India
Deepening of Financial
Markets

2. Monetary Policy - Interest Rate PolicyBrazil’s interest rate is known as SELIC (Sistema Especial de Liquidação e de Custódia)
FIs participate with SELIC as custody account holders
Selic – the overnight rate
Selic transaction process through repurchase agreements (Repos)
Introduction Before 2013Part A: After
2013
Part B:
BCB Policies
Part C: Comparison with India
Monetary Policy

• Gradual increases as a result of Fed tapering & repatriation of capital• BCB pressured into defending the real through increase of interest rates and the selling of foreign
reserves• Brazil’s vehicle for undertaking OMO – like the FOMC • Objectives:
o Price stabilityo Reduce inflation effectso Guide inflation to its target of 4.5% ± 2%
2
4
6
8
10
12
14
16
2015
2014
2013
2012
2011
2010
2009
2008
2007
2006
Selic Rates
Introduction Before 2013Part A: After
2013
Part B:
BCB Policies
Part C: Comparison with India
Monetary Policy

How does it works?• When Selic rate increase, it is more
attractive for international investors who are seeking for high returns.
• This leads to more portfolio capital inflows into Brazil.
• Increasing the demand for real.• Strengthening the real against other
currency.
Increasing Selic Rate via RepoBCB offer $1 billion repos every Friday to pull short-term funds from the financial system. This means that money supply is reduced, in-turn pushing up the Selic rate as a monetary policy instrument to mange its currency stability and at the same time, meet its economic goals.
2. Increasing Selic Rate
Introduction Before 2013Part A: After
2013
Part B:
BCB Policies
Part C: Comparison with India
Portfolio Capital Inflows
Value of Real
Selic RateMoney SS
Monetary Policy

3. Macro-Prudential Policy
Introduction Before 2013Part A: After
2013
Part B:
BCB Policies
Part C: Comparison with India
Eliminated the local banks reserve requirement on short dollar positions against the real• This increases lending to the economy, increasing the
returns on domestic and forex deposits, resulting in an appreciation of the real
• Objective:o Address financial market instability
Macro-Prudential
Policy
Monetary Policy
Macro-Prudential
Policy
Price StabilityFinancial
Market Stability

• Introduced in June 2013
• By lifting the IOF tax on fixed-income, BCB is aiming to attract more investments and capital inflow into Brazil.
• This will attract more investors seeking higher returns, given that the Selic rate has increase after that.
• The demand for real will increase and the real will strengthen against the USD.
o However, the removal of fixed-income IOF can be a double-edged sword.
o While the removal of fixed-income IOF is aimed at attracting investments and portfolio capital inflow, it canactually increase volatility in the market.
o The initial high IOF of 6% had initially “locked” investors’ capital in Brazil as they are unwilling to withdrawcapital out of Brazil’s fixed-income market as they have to fork out 6% to bring it back in again.
o However, with the IOF reduced to 0%, coupled with the US signaling a tightening of the monetary policy, thishas led to capital flight from Brazil into US which has better near-term prospects.
Reducing Fixed-Income IOF from 6% to 0%
IOF is the Brazilian tax on fixed-income foreign portfolio investments
4. Capital Control Management
How does it works?
Introduction Before 2013Part A: After
2013
Part B:
BCB Policies
Part C: Comparison with India
Capital Control
Management

Effectiveness of Policy Instruments
Ensuring Price Stability• Inflation of 6% to 6.5% in 2013• Targeted inflation of 4.5% ± 2%
achieved in 2013
Worsening Current Account Deficit• CAD worsened from -3% in Q3
2013 to -3.7% in Q1 2014• Resulted from declining demand
for its exports
Introduction Before 2013Part A: After
2013
Part B:
BCB Policies
Part C: Comparison with India

Effectiveness of Policy Instruments
Introduction Before 2013Part A: After
2013
Part B:
BCB Policies
Part C: Comparison with India
Improving Capital Account• The initial fall in capital flows in Aug 2013
could be attributed to the removal of IOF tax on fixed-income instruments. The initial high IOF could have “locked” investors’ capital in Brazil. With the removal of IOF tax on fixed-income instruments, coupled with US signaling a tightening of its monetary policy, this could have led to the capital flight from Brazil in late Q3 2013.
• Eventually, capital flows increased from from Q4 2013 to Q1 2014, posting an overall increase trend in the capital account.
Stabilization of Brazilian real• Achieved through improving its
capital account via increasing Selic rate, currency swap auctions

ComparisonwithIndia
India Vs BrazilPart C

Nominal GDP of US$1.876Trillion
G IX-M C
16.47%
-3.6%
30.02%
57.11%
Net Importer
High Dependence on Investments
India’s Current Account Deficit (CAD)
Introduction Before 2013Part A: After
2013
Part B:
BCB Policies
Part C: Comparison with India

61
Causes of Downward Pressure on Rupee
High Dependency
on Investments
US Economy Gradual
Recovery
Weak Balance of Payments
Rising Oil Prices
India’s Low
Foreign Reserves

WEAK BALANCE OF PAYMENTS
• Large Current Account Deficit (CAD) since 2003, with a negative growth of 2293% in the last 10 years
• CAD of US$75.8 billion as at 2013• Global Rank of 192, just above Brazil• Large and Persistent CAD implies higher vulnerability
to sudden capital flow reversal, resulting in currency collapse
Introduction Before 2013Part A: After
2013
Part B:
BCB Policies
Part C: Comparison with India

WEAK BALANCE OF PAYMENTS
• Persistent Fiscal Deficit since 1991• Implies Government is spending more than it is receiving• Increase chances of speculative attacks as it is assumed that
the government do not have enough reserves to protect its economy
• Large and persistent twin deficits makes India very susceptible to pressure on its rupee
Introduction Before 2013Part A: After
2013
Part B:
BCB Policies
Part C: Comparison with India

RISING OIL PRICES
• Brent crude oil has rose to a 6-month high of US$115.59 in August 2013
• Almost 79% of India’s crude oil needs are imported
• The rise in oil prices implies that India has to pay an increased amount of USD for the same quantity of oil
• India has to sell more rupees to buy more USD
Value of Rupee
Domestic Money Supply
Introduction Before 2013Part A: After
2013
Part B:
BCB Policies
Part C: Comparison with India

HIGH DEPENDENCY ON INVESTMENTS
• 30% of India’s GDP is on investments• After 2008 Global Financial Crisis, Federal Reserve
cut interest rateo Lower cost of borrowings causes investors to borrow
from US and invest in higher yielding assets in emerging markets like India, strengthening the rupee
o This is how India is able to finance its CAD
• However, speculations of QE tapering caused investors to pull out a record US$10 billion from Indian debt & equity markets
Foreign Capital Outflow
Domestic Money Supply
Value of Rupee
Introduction Before 2013Part A: After
2013
Part B:
BCB Policies
Part C: Comparison with India

US Economy Gradual Recovery
• Signs of recovery from the impact of Global Financial Crisis gave rise to expectations of a stronger US dollar
• Resulted in capital inflow into the US Economy• Some of these capital flows out from India to US
Domestic Money Supply
Value of Rupee
Foreign Capital OutflowIntroduction Before 2013
Part A: After 2013
Part B:
BCB Policies
Part C: Comparison with India

Foreign Reserves
• Foreign Reserves grown by a little over 2 times (from US$138 billion in 2005 to US$295 billion in 2013)
• However, CAD have grown by more than 5 times in the same period(from US$12.95 billion to US$74.8 billion)
• Foreign reserves are able to cover CAD from more than 10 times in 2005 to less than 4 times in 2013o India is unable to intervene in its foreign currency
markets as aggressively as beforeo Declining ability to protect its currency from
currency shocks, making it more susceptible to speculative attacks
0
5
10
15
20
25
30
2005 2006 2007 2008 2009 2010 2011 2012 2013
Number of times Foreign Reserves can cover CAD
Introduction Before 2013Part A: After
2013
Part B:
BCB Policies
Part C: Comparison with India

68
OTHER POLICIES
MACRO-PRUDENTIAL POLICIES
MONETARY POLICIES
FISCAL POLICIES
Measures Taken to Prevent Devaluation

1. FISCAL POLICIES
• The government imposed higher import tax on gold and silver, the largest luxury import, from 6%to 10%
• 20% of every lot of import of gold must be for export purposes
Increased Tax on Silver and Gold Imports
• Increased deposit rates for Non-Resident Indians (NRIs)
• Relaxed FDI’s routes for investments in India (changed from government to automatic) for various sectors such as commodity and retail
Encouraging Capital Inflows
Healthier BOP
Current Account Deficit
Foreign Capital Inflows
More Resistant to Currency
Shocks

2. MONETARY POLICIES
• Reserve Bank of India (RBI) have increased the MSF (interest) rate from 8.25% to 10.25%
• Aim at influencing the multiplier effect, reducing the money creation process and hence reducing money supply
Increasing Marginal Standing Facility (MSF)
Rate
Value of Rupee
Domestic Money Supply
Open Market Sales of Government Securities
• RBI announced the sale of government securities worth Rs 12,000 crore via Open Market Operations to reduce liquidity via reducing money supply
3. CAPITAL CONTROLSIntroduction Before 2013
Part A: After 2013
Part B:
BCB Policies
Part C: Comparison with India
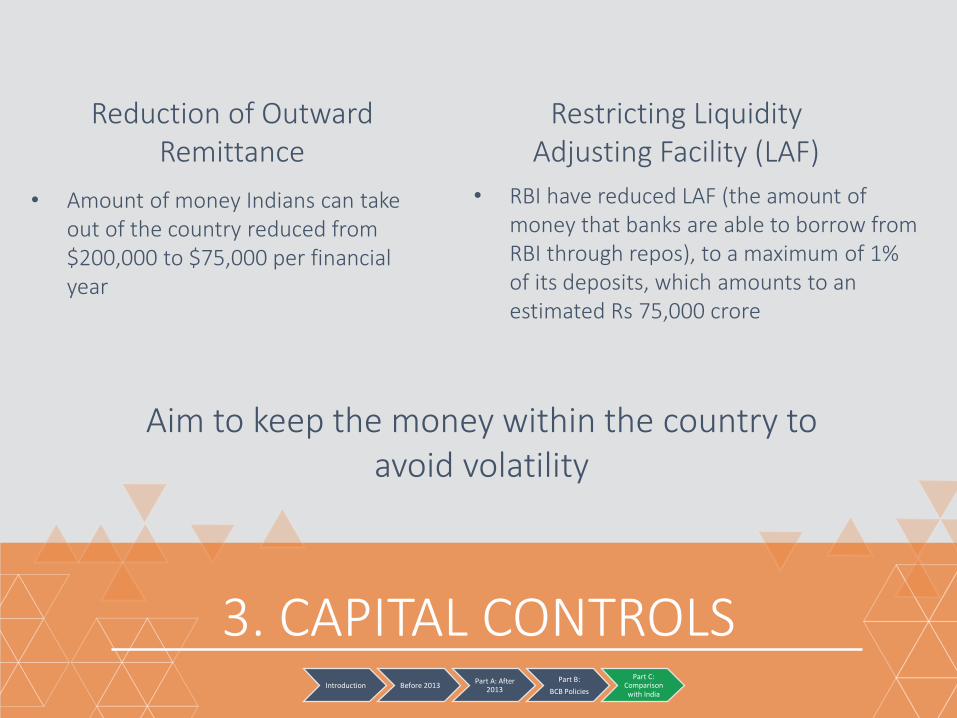
• Amount of money Indians can take out of the country reduced from $200,000 to $75,000 per financial year
Reduction of Outward Remittance
• RBI have reduced LAF (the amount of money that banks are able to borrow from RBI through repos), to a maximum of 1% of its deposits, which amounts to an estimated Rs 75,000 crore
Restricting Liquidity Adjusting Facility (LAF)
Aim to keep the money within the country to avoid volatility

4. OTHER POLICIES
• RBI provided US dollars directly to 3 state-owned oil companies (Indian Oil Pte Ltd, Hindustan Pentroleum Corp, Bharat Petroleum Corp), which have the biggest demand for USD of $400 to $500 million daily
Dollar Aid to State-Owned Oil Companies
Value of Rupee
Domestic Money SupplyIntroduction Before 2013
Part A: After 2013
Part B:
BCB Policies
Part C: Comparison with India
This is to isolate these demands from the market, hence reducing pressure on the rupee

VSBRAZIL INDIA
Introduction Before 2013Part A: After
2013
Part B:
BCB Policies
Part C: Comparison with India

India stabilized its devaluation from a high of 67.39 Rupee per USD to a current value of 62.36 rupee per USD
VALUE OF CURRENCY
Real continued its devaluation from 2.433 to a current value of 3.117 per USD in the same period
Introduction Before 2013Part A: After
2013
Part B:
BCB Policies
Part C: Comparison with India

July 2013 to 5.37% currently
INFLATION RATE
July 2013 to 7.7% currently
Introduction Before 2013Part A: After
2013
Part B:
BCB Policies
Part C: Comparison with India

India achieved a healthier CAD, narrowing the deficit from US$12 billion in July 2013 to US$6.84 billion currently
CURRENT ACCOUNT DEFICIT
US$2.84 billion currently
Introduction Before 2013Part A: After
2013
Part B:
BCB Policies
Part C: Comparison with India

India FDI increased from US$2 billion from July 2013 to US$5.5 billion currently
FOREIGN DIRECT INVESTMENTS
Brazil FDI decreased from US$6 billion to US$2.76 billion currently
Introduction Before 2013Part A: After
2013
Part B:
BCB Policies
Part C: Comparison with India

HOW MUCH OF THE DIFFERENT OUTCOMES ARE ATTRIBUTED TO
Introduction Before 2013Part A: After
2013
Part B:
BCB Policies
Part C: Comparison with India

However external effects like the decrease in oil prices could have improve its current account deficit, leading to an improvement in India’s economy
FDI liberalization & restriction of outward
remittance & cuts in MSF and LAF
Tax on luxury imports & currency
swaps with oil companies
economy in a bid to support the rupee
These policies aim at C and I component of its GDP
Tax of luxury imports reduce M component of GDP
Currency swaps allow the cost of oil imports to be kept low, reducing the
pressure on inflation
India’s policies are well rounded because it addresses its currency pressure issues by targeting both domestic and foreign factors, hence India did not suffer from the side effects by emphasizing too much on one policy.
Introduction Before 2013Part A: After
2013
Part B:
BCB Policies
Part C: Comparison with India

However external effects such as the recent slow growth in China and Europe crisis could have contributed to its economy worsening, which is largely uncontrollable by Brazil.
capital outflow
Selic rate hike & reducing IOF
These policies aim at I component of its GDP
Brazil’s policies are too focused on trying to keep capital from flowing out of the country. This has actually caused its economy to worsen due to conflicting effects• Increasing SELIC rate & reducing fixed-income IOF tax
aim to attract hot money and this should have strengthen the real.
• However, with the gradual recovery of the US economy, the reduction of fixed-income IOF actually backfired and led to more outflow of portfolio capital from Brazil. This further weakens the real.
• The increasing selic rate also increased the cost of borrowings for both consumers and businesses, impeding domestic growth in Brazil.

India is able to lessen the external effects on its economy more than that of Brazil. • India, being a net importer, is able to directly control demands
for imports by raising taxes. • Brazil on the other hand, are not able to increase demands
from its exports apart from depreciating its currency.
However, we cannot deny that the policies implemented indeed have an impact on its currencies.
Our group feels that in terms of managing its exchange rate, India’s policies have managed it better than Brazil’s policies.
Conclusion
References• Liquidity and Reserve Requirements in Brazil – Patrice Robitaille, June 2011
• The Legacy of the Real Plan: A stabilization without economic growth. (n.d.). Retrieved March 28, 2015, from http://www.ufrgs.br/ppge/pcientifica/2001_06.pdf
• Brazil Real Posts Longest Losing Streak in 8 Weeks After Tax. (n.d.). Retrieved March 28, 2015, from http://www.bloomberg.com/news/articles/2010-10-19/brazil-steps-up-action-in-currency-war-even-as-mantega-seeks-ceasefire
•Wattret, K. (n.d.). BNP Market Outlook. Retrieved March 28, 2015, from http://bnpparibasinvestindia.com/files/1007_MM.pdf
•Fernandes, G. (n.d.). Interventions in the Brazilian Foreign Exchange Market: An Empirical Investigation of the Determinants. Retrieved March 28, 2015, from https://www.itau.com.br/_arquivosestaticos/itauBBA/contents/common/docs/Itau_WP9_FX_may13.pdf
•Ogier, T. (2011, September 23). Brazil vows continued currency intervention. Retrieved March 28, 2015, from http://www.emergingmarkets.org/Article/2906418/Brazil-vows-continued-currency-intervention.html
•Tabak, B. (2013, July 1). Official Intervention through Derivatives: Affecting the foreign exchange demand. Retrieved March 28, 2015, from http://www.bcb.gov.br/pec/wps/ingl/wps317.pdf
• The limits of Brazil’s FX intervention programme. (2014, August 25). Retrieved March 28, 2015, from http://blogs.ft.com/beyond-brics/2014/08/25/guest-post-the-limits-of-brazils-fx-intervention-programme
• OECD: Brazil (BRA) Profile Of Exports, Imports And Trade Partners. (N.p., 2015). Retrieved March 23, 2015, from
• http://atlas.media.mit.edu/profile/country/bra/
• The World bank. (N.p., 2015). Retrieved March 24, 2015, from http://www.worldbank.org/en/country/brazil
• Brazil Exports, Imports & Trade | Economy Watch. (N.p., 2015). Retrieved March 21, 2015,
• http://www.economywatch.com/world_economy/brazil/export-import.html
• Commercial Banks In Brazil | Economy Watch. (N.p., 2015). Retrieved March 23, 2015, from http://www.economywatch.com/banks/commercial-banks/latin-america-and-caribbean/brazil-banks.html
• Holanda Barbosa Filho, Fernando, and Samuel Abreu Pessôa. International Macroeconomic Impacts On The Brazilian Economy. 1st ed. Retrieved March 25, 2015 from http://www.oecd.org/eco/International-Macroeconomic-Impacts-on-the-Brazilian-Economy-paper.pdf
• Holland, Marcio. Capital Account Management In Brazil. 1st ed. Brazil: (N.p., 2015). Retrieved March 21, 2015 from https://www.imf.org/external/np/seminars/eng/2013/macro2/pdf/mh.pdf

• Wikipedia- List Of Banks In The Americas. (N.p., 2015). Retrieved March 25, 2015 from http://en.wikipedia.org/wiki/List_of_banks_in_the_Americas
• Brazil Economy Profile 2014. (N.p., 2014). Retrieved March 25, 2015 from http://www.indexmundi.com/brazil/
• Lorman, Herwin. Country Report Brazil. Rabobank. (N.p., 2014). Retrieved March 24, 2015 from • https://economics.rabobank.com/publications/2014/february/country-report-brazil/
• Country Profile Series: Brazil In-Depth PESTLE Insights. 1st ed. MarketLine, 2014. Print. Retrieved March 24, 2015
• BBC News- Brazil Profile - Timeline. (N.p., 2015). Retrieved March 20, 2015 from http://news.bbc.co.uk/2/hi/americas/1231075.stm
• Biller, David, and Arnaldo Galvao. China, Brazil Sign $30 Billion Swap Accord To Bolster BRICS. Bloomberg. (N.p., 2013). Retrieved March 24, 2015 from http://www.bloomberg.com/news/articles/2013-03-26/china-brazil-sign-currency-swap-agreement-for-30-billion
• The end of poverty? (2013, February 28). Retrieved March 22, 2015, from http://www.economist.com/blogs/americasview/2013/02/social-spending-brazil
• Grounded. (2013, September 28). Retrieved March 22, 2015, from http://www.economist.com.libproxy.smu.edu.sg/news/special-report/21586667-having-come-tantalisingly-close-taking-brazil-has-stalled-helen-joyce-explains
• Going for broke. (2013, October 18). Retrieved March 22, 2015, from http://www.economist.com.libproxy.smu.edu.sg/blogs/americasview/2013/10/public-finances-brazil
• An ever-deeper hole. (2013, June 10). Retrieved March 22, 2015, from http://www.economist.com.libproxy.smu.edu.sg/blogs/americasview/2013/06/brazils-public-finances
• Stuck in the mud. (2013, June 8). Retrieved March 22, 2015, from http://www.economist.com.libproxy.smu.edu.sg/news/americas/21579048-feeble-growth-has-forced-change-course-governments-room-manoeuvre-more
• A fall from grace. (2013, June 8). Retrieved March 22, 2015, from http://www.economist.com.libproxy.smu.edu.sg/news/leaders/21579007-how-squander-inheritanceand-how-easily-it-could-be-restored-fall-grace
• Looking for change. (2013, October 18). Retrieved March 22, 2015, from http://www.economist.com.libproxy.smu.edu.sg/news/briefing/21625661-under-dilma-rousseff-brazils-economy-has-stalled-she-promises-reignite-growthbut-faces#
• Why Brazil needs change. (2014, October 18). Retrieved October 22, 2015, from http://www.economist.com/news/leaders/21625780-voters-should-ditch-dilma-rousseff-and-elect-cio-neves-why-brazil-needs-change
• Has Brazil blown it? (2013, September 28). Retrieved March 22, 2015, from http://www.economist.com/news/leaders/21586833-stagnant-economy-bloated-state-and-mass-protests-mean-dilma-rousseff-must-change-course-has
• RBI opens special window for forex purchase by oil companies. (n.d.). Retrieved March 28, 2015, from http://businesstoday.intoday.in/story/rbi-opens-special-window-for-forex-purchase-by-oil-companies/1/198183.html
• The PRS Blog. (n.d.). Retrieved March 28, 2015, from http://www.prsindia.org/theprsblog/?p=3009

• India’s reliance on imported energy threatens long-term recovery - FT.com. (n.d.). Retrieved March 28, 2015, from http://www.ft.com/intl/cms/s/0/c20792e2-1b84-11e3-b678-00144feab7de.html#axzz3V22V1e4g
• India | Economic Indicators | Data List By Country. (n.d.). Retrieved March 28, 2015, from http://www.tradingeconomics.com/india/
• Collapsing Asian Currencies? Why is the Indian Rupee Depreciating? (n.d.). Retrieved March 28, 2015, from http://www.globalresearch.ca/collapsing-asian-currencies-why-is-the-indian-rupee-depreciating/5350017
• RBI steps in to ease rupee volatility. (2013, July 15). Retrieved March 28, 2015, from http://www.thehindu.com/business/Economy/rbi-steps-in-to-ease-rupee-volatility/article4918136.ece
• Gold duty raised to record 10 percent as imports revive. (2013, August 13). Retrieved March 28, 2015, from http://in.reuters.com/article/2013/08/13/india-tax-finmin-idINDEE97C03J20130813?type=economicNews
• Key 2013 FDI Policy Changes in India - India Briefing News. (2014, February 20). Retrieved March 28, 2015, from http://www.india-briefing.com/news/key-2013-foreign-direct-investment-policy-changes-in-india-7902.html/

Getting RealWith
The REAL
History & Backdrop

Short term fiscal adjustment
Introduction of new currency
De-indexation of economy
Floating of currency with floor value
The Real Plan

Short term fiscal austerity implemented
Cut expenditures while creating tax over financial transactions to increase revenue
In June 1994, fiscal surplus was 2.6%
(i) Short term fiscal adjustment
Unit of real value (URV) was introduced, while cruzerio real continued to be used as legal tender
The URV was an average of inflation indexes in Brazil
Pushed to find a sustainable price set
Market mechanisms were respected
(ii) Introduction of Real

June 1994, 5150%
Dec 2000, 10%
Fighting inflation

Conjunction of bringing inflation down + short run demand in durable goods forced government to slow down economy
Controlled domestic credit & increased interest rates
ER thus became overvalued
Current account deficit due to high ER
Net ST capital inflows financed BOP
Current account deficit increased by 958.85% between 1994 to 1995
Effects of the Real Plan Demand Expansion

Eliminated inflation
Exchange rate trap brought SR macroeconomic inconsistency
BOB keeps inflation target, lets levels of output and unemployment be determined by supply side
High trade openness which affects import inputs
Must hold economic growth target while stabilization of ERManage ER against speculators (dirty floating)
Bring FDIs that can impact future exports
Overall Effectiveness