international cross-listing, firm performance, and top...
TRANSCRIPT
THE JOURNAL OF FINANCE • VOL. LXIII, NO. 4 • AUGUST 2008
International Cross-Listing, Firm Performance,and Top Management Turnover: A Test of the
Bonding Hypothesis
UGUR LEL and DARIUS P. MILLER∗
ABSTRACT
We examine a primary outcome of corporate governance, namely, the ability to iden-tify and terminate poorly performing CEOs, to test the effectiveness of U.S. investorprotections in improving the corporate governance of cross-listed firms. We find thatfirms from weak investor protection regimes that are cross-listed on a major U.S. Ex-change are more likely to terminate poorly performing CEOs than non-cross-listedfirms. Cross-listings on exchanges that do not require the adoption of stringent in-vestor protections (OTC, private placements, and London listings) are not associatedwith a higher propensity to remove poorly performing CEOs.
DOES CROSS-LISTING IN THE UNITED STATES IMPROVE the corporate governance offoreign firms? The “bonding hypothesis” proposed by Coffee (1999, 2002) andStulz (1999) predicts that after listing on a major U.S. stock exchange, foreignfirms become subject to stringent U.S. investor protections that constrain in-siders from expropriating minority shareholders. Because this hypothesis hasimportant implications for the effectiveness of U.S. laws and enforcement aswell as the efficacy of market-based approaches in improving global corporategovernance, it has attracted the recent attention of academics and practitionersalike.
To date, empirical support for the bonding hypothesis is principally drawnfrom the large literature that examines the economic consequences of cross-listing in the United States.1 However, as Leuz (2006) notes, the evidence inmany of these studies is fairly indirect, as it is difficult to attribute the economicconsequences of cross-listing directly to the bonding hypothesis because many
∗Lel is from the Federal Reserve Board and Miller is from Edwin L. Cox School of Business atSouthern Methodist University. We thank an anonymous referee and associate editor; CampbellHarvey (the editor); Mark Carey, Craig Doidge, Art Durnev, Nandini Gupta, David Mauer, ChipRyan, Chester Spatt, and Wendy Wilson; and seminar participants at the 2006 University of NorthCarolina GIA Conference, the 2006 University of Oregon Corporate Finance Conference, the 2006Financial Research Association Conference, the 2006 Utah Winter Finance Conference, LouisianaState University, and the University of Texas at Dallas. We thank Bill Megginson and MeghannaAyyagari for data access and Charles Murry and Laurel Nguyen for excellent research assistance.This paper represents the authors’ opinions and not necessarily those of the Federal Reserve Board.All errors are the sole responsibility of the authors.
1 Karolyi (1998, 2006) and Benos and Weisbach (2004) provide comprehensive surveys. We alsodiscuss the literature in Section II of this paper.
1897

1898 The Journal of Finance
theories of cross-listing have similar economic predictions.2 Moreover, the va-lidity of the bonding hypothesis has been called into question by a number ofrecent studies that document cross-listed firms’ lack of compliance with certainU.S. laws and the low number of enforcement actions by U.S. legal institutions(see, for example, Siegel (2005) and Lang, Raedy, and Wilson (2006)). Therefore,whether U.S. securities laws and regulations improve the corporate governanceof cross-listed firms is under debate as the nascent empirical evidence is pre-dominantly indirect and yields mixed results.
In this paper we pursue a different approach in testing the bonding hypothe-sis and examine a direct outcome of corporate governance: the propensity toreplace poorly performing CEOs. We argue that if cross-listing actually re-sults in increased shareholder protections, we should be able to observe spe-cific outcomes that are consistent with improved corporate governance. Wefocus on the sensitivity of top executive turnover to performance since an ex-tensive body of international research shows that a necessary component ofeffective corporate governance is the ability to identify and replace poorly per-forming CEOs (see, for example, Kaplan (1994), Coffee (1999), Murphy (1999),Volpin (2002), Dahya, McConnell, and Travlos (2002), Gibson (2003), DeFondand Hung (2004)). We compile a database of 70,976 firm-year observations from47 countries from 1992 to 2003 to test the hypothesis that CEOs of cross-listedfirms are more likely to face termination when firm performance is poor. We findthat the relation between CEO turnover and poor performance is stronger forcross-listed firms than non-cross-listed firms, and that the stronger turnover topoor performance relation for cross-listed firms is concentrated in firms listedon major U.S. exchanges (for example, Level 2 and 3 American depositary re-ceipts (ADRs)). Firms that list in the over-the-counter (OTC) market (Level 1),conduct private placements (Rule 144a), or even list in London do not have asignificantly different relation between CEO turnover and performance fromnon-cross-listed firms. Further, we find that the increased relation betweenCEO turnover and poor performance for cross-listed firms is strongest in coun-tries with weak investor protections. Overall, our results are consistent withthe hypothesis that U.S. securities laws and regulations improve the corporategovernance of cross-listed firms.
We also investigate several alternative explanations for our results, includ-ing the potential endogeneities that arise in a study of cross-listing and gover-nance due to the nonrandom nature of the decision to list in the United States.For example, we investigate if our results are due to the notion that better-governed firms are the ones that self-select to cross-list. To do so, we examineseveral specifications that measure the sensitivity of CEO turnover to perfor-mance for cross-listed firms prior to cross-listing. These tests show that therelation of turnover to performance is insignificant (significant) in the pre-cross-listed (post-cross-listed) period, which suggests that our results are notan artifact of the pre-cross-listed governance status of our sample firms. We
2 For further details on other theories that have been argued to generate similar predictions(e.g., market segmentation, investor recognition, increased liquidity, and better information) seethe discussion in Doidge, Karolyi, and Stulz (2004a) and Hail and Leuz (2004).

International Cross-Listing 1899
also examine if other potential control changes around cross-listing such asprivatizations, changes in ownership, M&A events, and changes in the com-position of board of directions can explain our results. We find that our re-sults remain robust to these events. Further, we examine if cross-listing in-duces top management to leave their jobs to pursue employment in the UnitedStates where they are likely to be more highly compensated or if cross-listedfirms terminate poorly performing management because they are able to ac-cess a more international pool of top-management candidates. We find thatfirms that change CEOs tend to replace them with managers from their do-mestic labor pool and that departing CEOs most often get jobs in the localmarket. Therefore, shifts in the labor market also do not appear to explain ourresults.
We subject our tests to a battery of firm- and county-level robustness testsas well. We find our results are robust to country, industry, and year fixedeffects in addition to the possible entrenchment effects of concentrated owner-ship structures. Our findings are also robust when we exclude countries thatcontain the largest portion of our sample, remove observations surroundingthe Asian financial crises, and omit financial and regulated industries. An im-portant methodological note is that all of our analyses control for the recentlyrecognized difficulty in implementing and interpreting interaction effects innonlinear models (see, for example, Ai and Norton, (2003)).
Our results advance the literature in several ways. First, our findings addto the debate on whether U.S. securities laws and enforcement are effective inreaching non-U.S. firms. Second, by showing that CEOs of cross-listed firmsare more likely to face termination when firm performance is poor, our resultsalso contribute to the literature by documenting a specific channel throughwhich cross-listing improves corporate behavior, something that is not well-documented in the literature.3 Finally, our findings also have implications forthe growing literature that examines how global corporate governance can beimproved (see, for example, LaPorta et al. (2000) and Coffee (2002)). This re-search stems from a large number of studies that show that the economic conse-quences for firms located in countries with poor investor protections are severe.4
Given the economic impact of poor investor protections and the correspondingdifficulty in changing a country’s legal structure (i.e., legal convergence), an im-portant question is whether market-based approaches (i.e., functional conver-gence), such as opting-in to a better legal system via cross-listing, can improvecorporate governance. Our finding that cross-listing in the United States is as-sociated with improved corporate governance is consistent with the hypothesisthat the functional convergence of legal systems to a higher global standard ispossible.
The remainder of the paper proceeds as follows. Section I discusses relatedliterature. Section II describes the data. Section III presents the research de-sign. Section IV shows the results and Section V presents robustness tests.Section VI concludes.
3 See, for example, the discussion in Leuz (2006).4 See, for example, LLSV (1997, 1998) as well as the survey by Beck and Levine (2004).

1900 The Journal of Finance
I. Related Literature
The bonding hypothesis of Coffee (1999) and Stulz (1999) posits that firmscross-listed on a major U.S. stock exchange have better corporate governancethan non-cross-listed firms from the same country, ceteris paribus, since cross-listed firms are subject to strong U.S. investor protections.5 For example, cross-listed firms on U.S. exchanges must adhere to U.S. disclosure practices, whichrequire them to reconcile their net income and shareholder’s equity to U.S.generally accepted accounting principle (GAAP), disclose the identity of ma-jority shareholders (10% or greater), and follow detailed procedures duringtender offers and going private transactions. These firms are also subject tofar-reaching U.S. investor protection laws such as the Foreign Corrupt Prac-tices Act and, more recently, the Sarbanes Oxley Act. Cross-listed firms arealso subject to punishment by U.S. law enforcement, both by the Securitiesand Exchange Commission (SEC) as well as private investor law suits, andto increased scrutiny from intermediaries such as financial analysts and debt-rating agencies.6 In contrast, listing on the OTC market or conducting a privateplacement allows substantial exemptions from these laws and regulations.7
Specifically, the bonding hypothesis predicts that, ceteris paribus: (1) cross-listed firms will have better corporate governance than non-cross-listed firms,(2) the difference in governance between cross-listed firms and non-cross-listedfirms will be greatest in the countries with the weakest investor protections,and (3) cross-listings that require the most stringent U.S. investor protections(i.e., on the NYSE, AMEX, or NASDAQ) will have the largest differences incorporate governance. In this way, cross-listing in the United States representsa market-based approach to increased investor protection.
While in theory a cross-listing in the United States should lead to more ef-fective corporate governance, the ability of a cross-listing to serve as a bondingmechanism is under debate. On the one hand, several empirical studies exam-ine the economic impact of cross-listing in the United States and find evidencethat is consistent with the bonding hypothesis. This line of research finds thatcross-listed firms from weak investor protection countries have larger stock-price reactions (Foerster and Karolyi (1999), Miller (1999)), higher valuation(Mitton (2002), Doidge, Karolyi, and Stulz (2004a)), more scrutiny by financialanalysts (Baker, Nofsinger, and Weaver (2002), Lang, Lins, and Miller (2003)),lower cost of capital (Errunza and Miller (2000), Hail and Leuz (2004)), bet-ter information environments (Bailey, Karolyi, and Salva (2005)), lower votingpremiums (Doidge (2004)), and more access to external finance (Reese andWeisbach (2002), Lins, Strickland, and Zenner (2005)). However, ascribing theevidence contained in many of these studies directly to the bonding hypothesis
5 It is important to note that while firms may choose to cross-list for a variety of reasons, oncethey are listed they become subject to U.S. laws and regulations.
6 Coffee (2002) calls these intermediaries “financial watchdogs.”7 For example, these firms are not required to register under the Exchange or Securities acts and
are therefore exempt from most civil liability provisions and do not have to follow U.S. disclosurepractices (Doidge (2004)).

International Cross-Listing 1901
is difficult given the well-known challenge in distinguishing among the varioustheories of cross-listing and the endogeneity issues inherent to this literature.8
On the other hand, the evidence in several recent studies suggests bondingvia cross-listing in the United States is ineffective. For example, Siegel (2005)finds that the SEC and minority shareholders have rarely enforced U.S. lawsagainst cross-listed firms and Lang, Raedy, and Wilson (2006) find that the ac-counting data of cross-listed firms from weak investor protection environmentsare of lower quality even though cross-listed firms are required to follow nom-inally similar accounting standards as U.S. firms. However, the approaches inthese papers are not without their drawbacks, as Coffee (2002) and Benos andWeisbach (2004) suggest that measuring the incidence of legal actions may un-derstate the deterrent benefit of laws, and Leuz (2006) argues that disclosurequality differences between cross-listed and U.S. firms may not be clear evi-dence against bonding as cross-listed firms are allowed considerable discretionin preparing their financial statements to U.S. GAAP.
Another challenge researchers face when testing the bonding hypothesis isthat it is often difficult to assess the quality of governance from observed mech-anisms of governance because governance mechanisms often substitute or com-plement one another, a finding that Doidge, Karolyi, and Stulz (2004b) empha-size is dependant on the extent of a country’s investor protections. Further, thisissue is likely to be exacerbated for cross-listed firms, given the many financialand regulatory changes that take place around a listing (see, for example, Lang,Lins, and Miller (2003, 2004)).
In this paper, rather than calculating the stock-price consequences, legal en-forcement incidents, or changes in governance mechanisms around a cross-listing to infer improvements in investor protections, we measure a directoutcome of corporate governance: the propensity to replace poorly perform-ing CEOs. Why CEO turnover? Replacing poorly performing CEOs is arguedto be a necessary condition for good corporate governance (Shleifer and Vishny(1989, 1997)) and the sensitivity of top executive turnover to performance as ameasure of the quality of corporate governance has been supported by a largenumber of studies in the United States and abroad, including recent researchby Dahya et. al (2002), DeFond and Hung (2004), Gibson (2003), and Volpin(2002).9
II. Sample Selection and Descriptive Statistics
A. Sample Selection
Our empirical analysis consists of three main parts. First, we investigatewhether the sensitivity of top executive turnover to poor firm performance ishigher for cross-listed firms. In these tests we differentiate cross-listings bytype in order to test whether cross-listings on major U.S. exchanges, which re-quire the strongest governance provisions, have the largest effect. Second, we
8 For example, Sarkissian and Schill (2006) argue that valuation gains to cross-listing aretransitory.
9 For U.S.-based studies see Hermalin and Weisbach (2003) and citations contained therein.

1902 The Journal of Finance
test if the effect of bonding is greatest for firms that are located in the countrieswith the weakest investor protection laws. We do so by examining the sensi-tivity of top executive turnover to poor firm performance across legal originsand investor protection laws. Finally, we conduct a battery of tests designedto gauge the robustness of our results by examining the sensitivity of top ex-ecutive turnover to poor firm performance in the pre-cross-listing period, theeffect of other potential governance changes concurrent with cross-listing, theexclusion of turnover that occurs in the list year, and the departing and en-tering CEOs’ work history. We also rerun our tests excluding countries thatcontain the largest portion of our sample firms, omitting firms with large blockownership, removing observations surrounding the Asian financial crisis, andexcluding financial and regulated firms.
To execute this analysis, we gather data on executive turnover and firm per-formance between 1992 and 2003 from the Worldscope database.10 The initialsample consists of approximately 38,000 firms from 59 countries. We excludefirms with missing firm-specific financial and executive data, firms with noidentifiable top manager, and firms located in countries with missing legal en-vironment data. We also exclude U.S. firms as the bonding hypothesis predictsdifferences between cross-listed and non-cross-listed firms, rather than differ-ences between cross-listed and U.S. firms (see, for example, Leuz (2006)). Fi-nally, we exclude firms that are reported in the Worldscope database only oncebecause we need at least two consecutive years of nonmissing data on com-pany officers and their titles to compute CEO turnover. The resulting sampleincludes 70,976 firm-year observations of 19,091 firms from 47 countries over1992–2003. Every country in our final sample except Zimbabwe has at least onecross-listed firm in the United States . A breakdown of the sample distributionacross countries, cross-listing status, and years is reported in Table I.
We obtain the list of cross-listed firms using several sources including theBank of New York, Citibank, NYSE, and Nasdaq and verify the listing datesusing Lexis–Nexis searches, Form 20-F, etc. Exchange-traded cross-listings aredenoted as Level 2/3, over-the-counter cross-listings as Level 1, and privateplacements as Rule 144a. The data set also takes into account ADR programupgrades, such as from a Level 1 to a Level 2 program, and delistings fromthe U.S. market. We also include direct listings. Most notably, Canadian firmslist their shares on U.S. exchanges directly without issuing ADRs . Given thatthe increased disclosure and securities law provisions required in listing on amajor U.S. exchange are functionally equivalent for ADRs and direct listings,we classify Canadian firms that are traded on both a Canadian and a majorU.S. exchange as Level 2/3 ADRs. However, the exclusion of Canadian firmsfrom the sample does not change our conclusions.
We follow DeFond and Hung (2004) and use the titles CEO, Chief ExecutiveOfficer, and Chief Executive to identify the top manager in each firm. However,
10 We use a total of 37 Worldscope CDROMs during our sample period. Because of delays byfirms in releasing information and Worldscope’s backfilling procedure, Worldscope indicated to usthat multiple CDROMs from each year should be used as they often contain different numbers offirms.

International Cross-Listing 1903
Table IDescriptive Statistics
This table presents the distribution of the sample used in the regression analysis by country,cross-listing status, and year, and descriptive statistics for the main firm-level variables. Panel Adescribes the number of observations, number of firms, and CEO turnover percentage across coun-tries. Panel B presents the distribution of the sample over time. Panel C displays the distributionof the sample by cross-listing status. Panel D presents the summary statistics for the sample usedin the regression analysis. The last column in Panel D reports the median differences of the firmperformance variables between the CEO turnover and nonturnover observations and the relatedresults from a nonparametric test on the equality of medians. CL dummy is 1 if the firm cross-listsin the United States, 0 otherwise. Level 2/3 dummy is 1 if the firm has a Level 2 or Level 3 ADRprogram, 0 otherwise. Level 1 dummy is 1 if the firm has a Level 1 ADR program, 0 otherwise. Rule144A dummy is 1 if the firm has a Rule 144A issuance, 0 otherwise. Lagged Earnings Ratio is the1-year lagged ratio of earnings before interest and taxes to total assets. Lagged Excess Returns isthe 1-year lagged total stock returns in excess of the country average. Total Assets is measured inmillion $U.S. ∗∗∗ indicates significance at the 1% level.
Panel A: By Country
Country No of Obs. No of Firms CEO Turnover %
Argentina 36 18 25.00Australia 2,463 1,001 15.79Austria 530 160 15.09Belgium 711 187 14.21Brazil 348 155 11.78Canada 3,455 1,011 19.28Chile 473 152 18.39China 276 170 19.57Colombia 3 3 33.33Czech Republic 83 42 15.66Denmark 1,146 283 14.22Finland 766 212 13.71France 3,200 1,019 12.25Germany 3,692 1,047 17.39Greece 517 216 15.28Hong Kong 2,028 797 16.18Hungary 114 36 19.30India 1,268 358 13.17Indonesia 1,090 324 24.13Ireland 418 93 14.83Israel 217 90 21.66Italy 1,192 318 18.04Japan 21,009 3,776 14.15Korea 1,704 675 38.40Luxembourg 59 18 15.25Malaysia 2,185 687 13.27Mexico 304 117 17.76Netherlands 1,034 305 19.05New Zealand 294 90 18.71Norway 356 110 18.82Pakistan 459 111 12.64Peru 87 43 24.14Philippines 674 205 20.47Poland 239 83 19.67
(continued)

1904 The Journal of Finance
Table I—Continued
Panel A: By Country
Country No of Obs. No of Firms CEO Turnover %
Portugal 152 62 9.21Singapore 1,304 429 17.02South Africa 1,210 450 16.28Spain 590 163 16.95Sri Lanka 37 14 8.11Sweden 1,359 420 18.91Switzerland 1,413 360 20.74Taiwan 1,241 423 25.56Thailand 898 269 18.04Turkey 316 124 15.19United Kingdom 9,981 2,448 14.59Venezuela 25 11 4.00Zimbabwe 20 6 25.00
Panel B: By Year
Year No of Obs. No of Firms CEO Turnover %
1992 1,602 – 17.851993 4,081 – 17.741994 4,721 – 13.851995 5,369 – 11.511996 6,083 – 12.941997 6,790 – 13.781998 6,359 – 15.851999 6,893 – 14.842000 6,813 – 23.162001 7,712 – 19.852002 9,962 – 17.512003 4,591 – 14.75
Panel C: By Cross-listing Status
Cross-listing Status No of Obs. No of Firms CEO Turnover %
Non-CL firms 65,563 17,729 16.06CL firms 5,413 1,362 19.18Level 2/3 2,088 609 21.50Level 1 2,494 565 16.92Rule 144A 801 188 20.22
Total 70,976 19,091 16.30
Panel D: Summary Statistics
Turnover vs.5th 95th Nonturnover
N Mean Median Percentile Percentile (Medians)
Lagged Earnings Ratio 70,976 0.218 0.052 −0.133 0.202 −0.006∗∗∗Lagged Excess Returns 62,333 −0.011 −0.079 −0.724 0.909 −0.030∗∗∗Total Assets 70,976 259,278 372.651 15.534 494,872 –

International Cross-Listing 1905
many countries use other titles for top managers, which vary across and withincountries. We use two sources to determine the top manager in the rest of thesample. When available, we use the top manager titles used by DeFond andHung (2004) and Gibson (2003). For example, the titles CEO, Chief ExecutiveOfficer, Chief Executive, and President are used to identify the top managerin Argentina. We exclude firms in which the top manager title is shared bytwo officers to prevent a split turnover (Gibson (2003)). For the remaining 15countries not covered in DeFond and Hung (2004) or Gibson (2003) (4.68% ofour sample), we use press accounts, country experts’ opinions, and manual datainspections of manager titles in each country to determine the top manager title.A list of top manager titles used in each country is displayed in the Appendix.11
After the top manager in the firm is identified, we first compare the last namesand the first letter of first names of top managers of the firm over time todetermine whether there was a top manager replacement in any given year.We next hand-check CEO turnover events for the entire sample given thatDefond and Hung (2004) find that first names of managers do not consistentlyprecede their last names in several Asian countries such as Korea and Japan,and Worldscope infrequently contains typos on executive names for foreignfirms.
As in DeFond and Hung (2004) and Gibson (2003), we do not know whether aCEO turnover event is voluntary (for example, due to retirement) because theWorldscope does not provide information on CEO age and tenure, and mediacoverage in English for the sample firms varies substantially across countries.Hermalin and Weisbach (2003) argue that voluntary turnover is unlikely to berelated to performance, and hence not distinguishing between voluntary andforced turnovers events leads to additional noise in the dependent variable,which only affects standard errors. Consistent with their assertion, the empir-ical evidence suggests a similar or more sensitive relationship between CEOturnover and performance for involuntary (forced) replacements (see, for exam-ple, Huson, Parrino, and Starks (2001), Dahya et al. (2002), and Kaplan andMinton (1994)). Therefore, we do not expect this data limitation to alter ourconclusions.
B. Descriptive Statistics
Panel A of Table I provides summary statistics for the sample based on afirm’s country of domicile. Turnover ranges from a low of 4% in Venezuela toa high of 38.4% in Korea, with an average of 16.30%. For comparison, overour sample period the U.S. turnover rate was 12.86%. Similar to other studiesthat employ the Worldscope database, there is a clustering of observations inJapan and United Kingdom. Although our analysis is based on fixed countryeffects to ensure we are comparing CEO turnover differences within countries,in robustness tests reported later in the paper we remove observations fromJapan and the United Kingdom and find that our conclusions are unaffected.
11 We use the terms CEO turnover and top manager turnover interchangeably.
1906 The Journal of Finance
Panel B of Table I shows turnover by year, which ranges from a low of 11.51% in1995 to a high of 23.16% in 2000. Panel C of Table I presents turnover by cross-listing status. The panel indicates that cross-listed firms have higher CEOturnover than non-cross-listed firms (19.18% vs. 16.06%). Of the cross-listedfirms, CEO turnover is greatest for Level 2/3 firms, followed by Rule 144a andthen Level 1 companies (21.50%, 16.92%, and 20.22%, respectively). Panel Cof Table I also shows that 1,362 foreign firms are identified as cross-listed inour sample, of which 609 are exchange-traded cross-listings (Level 2/3), 565are OTC cross-listings (Level 1), and 188 are private placements via Rule 144Aissuance (Rule 144a).
We consider various measures of firm performance, including both operat-ing performance measures and stock-price-based measures. We augment stockprice data from Worldscope with data from Datastream International wherepossible. However, we expect the operating performance measures to be a bet-ter proxy in our international setting, as both Volpin (2002) and DeFond andHung (2004) find that stock returns are not related to CEO turnover in coun-tries whose markets are characterized by high stock-price synchronicity andilliquidity, attributes that make stock-price-based measures less informative.12
For our main tests, we focus on the ratio of accounting earnings before inter-est and taxes (EBIT) to book value of assets (earnings ratio), and the total stockreturns in excess of the country average (excess returns). We follow DeFond andHung (2004) and Volpin (2002) and use EBIT among accounting-based firmperformance measures because it is not influenced by firms’ capital structurepolicies or by differential country-level tax regimes. Similar forms of both vari-ables are used extensively to proxy for firm performance in studies examiningthe sensitivity of CEO turnover to firm performance.13 We lag both performancevariables by 1 year to prevent a possible overlap of the replaced CEO’s perfor-mance with that of the new CEO. Panel D of Table 1 reports sample statisticsof the main performance measures and shows that the lagged performancemeasures are significantly lower in firm-years with CEO turnover than in non-turnover years. In terms of the depth of the sample, the mean (median) numberof years a firm is in our regression analysis is 3.84 (3) years.
We also use sales growth and the change in EBIT to total assets as alterna-tive accounting-based measures of firm performance and obtain qualitativelysimilar results. In addition, we recompute our firm performance measures inwhich industry-adjusted performance is calculated as firm performance minusthe median value of the corresponding two-digit SIC global industry and obtainsimilar results.
12 Harvey (1995) shows that first-order autocorrelations in emerging markets are positive andsignificant and Lesmond (2005) finds that liquidity-related transactions costs in countries withweak legal institutions are higher than in markets with strong legal systems.
13 See Huson et al. (2001), Mikkelson and Partch (1997), Gibson (2003), and Kang and Shivdasani(1995) for the accounting-based measure and Weisbach (1988), Kang and Shivdasani (1995), Defondand Hung (2004), Huson, Parrino, and Starks (2001), and Hadlock and Lumer (1997) for the stock-market-based measure.

International Cross-Listing 1907
III. Research Design
A. Empirical Model
To test our hypothesis that CEO turnover is more sensitive to poor perfor-mance for exchange-traded cross-listed firms than non-cross-listed firms, weestimate a series of probit models that take the form:
Pr (Turnover) = φ[α + β1(FirmPerformance)] + β2(L23)
+ β12(L23∗FirmPerformance) + β3(L1)
+ β13(L1∗FirmPerformance) + β4(R144A)
+ β14(R144A∗FirmPerformance) + δX ] (1)
where φ is the standard normal cumulative distribution, L23 refers to exchange-traded cross-listings, L1 refers to OTC cross-listings, R144A refers to privateplacements, and X is a set of firm control variables, country controls, industrycontrols, and year controls. Note that the cross-listed dummies are time-varyingin that they take the value of 1 in the cross-listing year and can switch back to0 if the firm delists or changes level of cross-listing.
We follow previous research and measure turnover as a binary variable thattakes the value 1 if the top manager is changed in that year. We include firmsize measured as the natural logarithm of the book value of total assets inmillions of U.S. dollars. In the regression analysis, we winsorize the continuousvariables at the 1% level for each country.
It is also important to note that throughout our analysis, we include coun-try fixed effects that ensure we are measuring within-country differencesbetween cross-listed and non-cross-listed firms as well as controlling for un-observed country effects. In addition, we include industry dummies using thetwo-digit SIC code to control for global industry-wide factors that may affectCEO turnover and firm performance. Finally, our regressions include indica-tor variables for each year. Our regressions also correct the standard errorsfor possible serial correlation and heteroskedasticity by clustering at the firmlevel.
We test our second hypothesis, which posits that the difference in the sensitiv-ity of top management turnover to performance between cross-listed firms andnon-cross-listed firms is greatest in the countries with the weakest corporategovernance, by classifying countries into strong and weak investor protectionregimes and comparing coefficients across samples. Alternatively, a randomcountry effects specification could be employed with interaction effects, but inour sample this is inappropriate as it fails the Hausman specification test. Wefocus on three country-level measures of investor protection. The first measure,from La Porta, Lopez-De-Silanes, Shleifer, and Vishny (LLSV) (1997, 1998), iswhether the home country has an English legal origin, which is an overallmeasure of strong investor protections. Following Djankov et al. (2005) we usethe anti-director rights index (ADRI), which is a revised version of the originalADRI index from LLSV (1997) that addresses the coding concerns expressed

1908 The Journal of Finance
in Pagano and Volpin (2005) and Spamann (2006). The ADRI represents thedegree of minority shareholder protection. We also use the anti-self-dealingindex from Djankov et al. (2005), which measures how difficult it is for minor-ity shareholders to thwart the consumption of private benefits by controllingshareholders. Djankov et al. (2005) argue that self-dealing is the central prob-lem of corporate governance in most countries. In unreported tests, we alsoexamine other country-level measures of investor protection from LLSV (1998)and La Porta, Lopez-De-Silanes, and Shleifer (LLS) (2006), such as the ruleof law, burden of proof, disclosure, and private law enforcement indexes. In allinstances, our results are consistent across every measure of high versus lowinvestor protection. Further, the results are robust to using Spamann’s (2006)ADRI.
B. Interpretation of Interactions in Probit Models
Recent research by Ai and Norton (2003) and Powers (2005) emphasizes thedifficulty present in interpreting interactions in nonlinear models. Strikingly,the interaction effect cannot be evaluated by looking at the sign, magnitude, orstatistical significance of the coefficient on the conventional interaction term.Ai and Norton (2003) show that the interaction effect is conditional on the inde-pendent variable, and therefore both the magnitude and statistical significanceof the interaction term can vary across observations. For example, in our probitspecification the correct marginal effect of a change in the interaction variablebetween the L23 dummy and firm performance is
�∂F (u)
∂FirmPerformance�L23
= (β1 + β12) ∗ φ[(β1 + β12) ∗ FirmPerformance + β2 + X δ]
− β1 ∗ φ [β1 ∗ FirmPerformance + δX ] (2)
where F (u) = Pr(Turnover), which is given by equation (1) and u denotes theregression specification. Equation (2) shows that the marginal effect of theinteraction variable may not be zero even when β12 is zero. Thus, the standardcoefficient on the interaction term may have an incorrect magnitude, standarderror, and even sign relative to the true interaction effect.
To ensure our inferences are correct, we use the methodology developedby Norton, Wang, and Ai (2004) to compute the correct marginal effect of achange in the interaction variable between the respective cross-listed dummyand firm performance. We report both the marginal effects and their standarderrors and display the graphs of the distribution of marginal effects and theassociated z-statistics over the entire range of predicted probabilities for ourmain models. In tests where our inferences are unambiguous, we also sum-marize the range of corrected interactions by the mean interaction effect andits significance.

International Cross-Listing 1909
IV. The Effect of Cross-Listing on CEO Turnover
A. By Cross-Listing Type
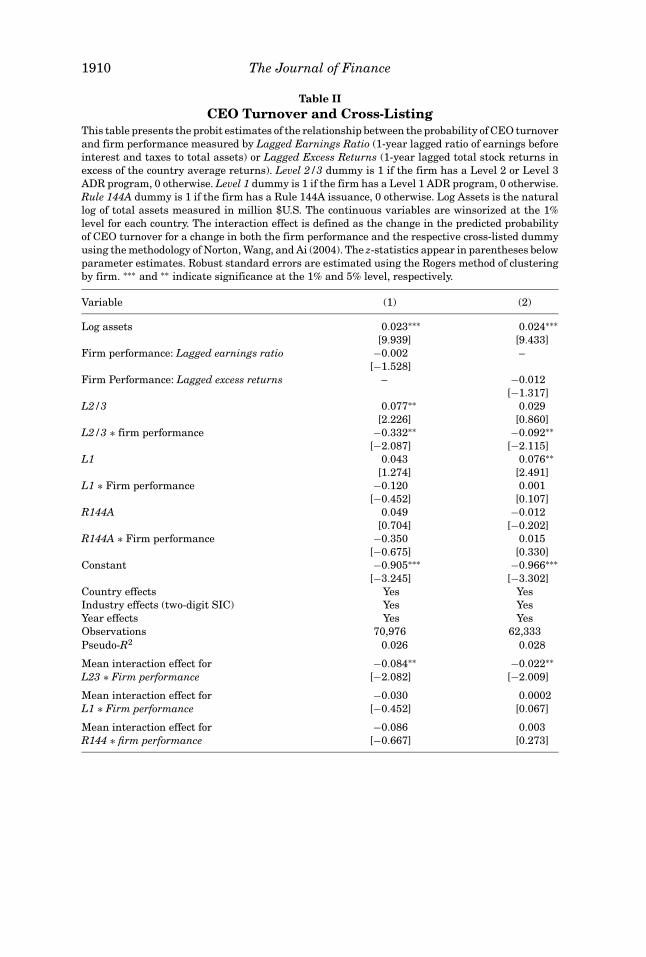
Table II presents a series of probit regressions that include interactionsbetween firm performance and cross-listing type to test the hypothesis thatcross-listed firms have a higher performance to turnover sensitivity than non-cross-listed firms. Model 1 reports the results for the accounting-based per-formance measure and Model 2 presents the results for the stock-price-basedperformance measure. All regression models include country, industry, and yearfixed effects as well as control for firm size.
Model 1 shows that the interaction between Level 2/3 and lagged earningsratio is negative and significant (−0.332, t-statistic = −2.087). In contrast,OTC or Rule 144a cross-listings do not have a significantly higher propensityto terminate poorly performing CEOs than non-cross-listed firms’ interaction(coefficient = −0.120, t-statistic = −0.452 and −0.350, t-statistic = −0.675, re-spectively). This finding is consistent with the hypothesis that non-U.S. firmsadopting the strongest governance and reporting requirements by cross-listingin the United States observe outcomes consistent with improved governanceover similar firms that are not cross-listed in the United States. However,given the aforementioned problems with interpreting simple interaction termsin discrete choice models, we follow Ai and Norton (2003) and evaluate the cor-rected marginal effects and their significance at every predicted probability.Figure 1a shows that for major exchange-traded cross-listings, the correctedinteraction effects are overwhelmingly negative across the predicted probabil-ities, while Figure 1b shows that these interaction effects are also significant(less than −1.96) for most probabilities. We summarize the corrected inter-active effect and its significance in the last row of Table II by reporting themean interaction effect and its significance (−0.084, t-statistic = −2.082). Interms of economic significance, the absolute probability of replacing the CEOincreases by 1.34% for Level 2/3 ADRs when we move from the top quartileto the bottom quartile of firm performance. For OTC (Rule144a) cross-listings,the corrected interactive effects, presented in Figures 1c–f and summarizedin the bottom rows of Table II, further confirm that the interaction effectis rarely significant across the range of predicted probabilities (the mean-corrected effect is −0.030, t-statistic = −0.452, and −0.086, t-statistic = −0.667,respectively).
For the control variables, we find that firm size is positively related to CEOturnover.14 Firm performance (lagged earnings ratio) is negative yet statisti-cally insignificant, a finding that is the result of pooling countries where firmperformance is unlikely to be used to evaluate management.15 The coefficienton L2/3 is positive, indicating that exchange cross-listed firms also have higher
14 In the United States, size is generally thought to capture the effects of CEO and institutionalstock ownership, board composition, managerial depth, and formal succession processes (see, e.g.,Huson et al. (2001)). Gibson (2003) and DeFond and Hung (2004) also find that firm size is positivelyrelated to CEO turnover internationally.
15 When we split by investor protection regimes, the coefficient on lagged earning ratio is negativeand significant in high protection countries.
1910 The Journal of Finance
Table IICEO Turnover and Cross-Listing
This table presents the probit estimates of the relationship between the probability of CEO turnoverand firm performance measured by Lagged Earnings Ratio (1-year lagged ratio of earnings beforeinterest and taxes to total assets) or Lagged Excess Returns (1-year lagged total stock returns inexcess of the country average returns). Level 2/3 dummy is 1 if the firm has a Level 2 or Level 3ADR program, 0 otherwise. Level 1 dummy is 1 if the firm has a Level 1 ADR program, 0 otherwise.Rule 144A dummy is 1 if the firm has a Rule 144A issuance, 0 otherwise. Log Assets is the naturallog of total assets measured in million $U.S. The continuous variables are winsorized at the 1%level for each country. The interaction effect is defined as the change in the predicted probabilityof CEO turnover for a change in both the firm performance and the respective cross-listed dummyusing the methodology of Norton, Wang, and Ai (2004). The z-statistics appear in parentheses belowparameter estimates. Robust standard errors are estimated using the Rogers method of clusteringby firm. ∗∗∗ and ∗∗ indicate significance at the 1% and 5% level, respectively.
Variable (1) (2)
Log assets 0.023∗∗∗ 0.024∗∗∗[9.939] [9.433]
Firm performance: Lagged earnings ratio −0.002 –[−1.528]
Firm Performance: Lagged excess returns – −0.012[−1.317]
L2/3 0.077∗∗ 0.029[2.226] [0.860]
L2/3 ∗ firm performance −0.332∗∗ −0.092∗∗[−2.087] [−2.115]
L1 0.043 0.076∗∗[1.274] [2.491]
L1 ∗ Firm performance −0.120 0.001[−0.452] [0.107]
R144A 0.049 −0.012[0.704] [−0.202]
R144A ∗ Firm performance −0.350 0.015[−0.675] [0.330]
Constant −0.905∗∗∗ −0.966∗∗∗[−3.245] [−3.302]
Country effects Yes YesIndustry effects (two-digit SIC) Yes YesYear effects Yes YesObservations 70,976 62,333Pseudo-R2 0.026 0.028
Mean interaction effect for −0.084∗∗ −0.022∗∗L23 ∗ Firm performance [−2.082] [−2.009]
Mean interaction effect for −0.030 0.0002L1 ∗ Firm performance [−0.452] [0.067]
Mean interaction effect for −0.086 0.003R144 ∗ firm performance [−0.667] [0.273]

International Cross-Listing 1911
Figure 1. The economic significance of the impact of cross-listing on the relationshipbetween CEO turnover and firm performance. The following graphs display the interactioneffects and corresponding z-statistics on the interaction variable between the respective cross-listeddummy and firm performance measure reported in Table II, estimated using Norton, Wang, and Ai(2004). The interaction effect is defined as the change in the predicted probability of CEO turnoverfor a change in both firm performance and the respective cross-listed dummy. Panel A plots thegraphs associated with the lagged earnings ratio measure and Panel B depicts the graphs for thelagged excess returns measure. The lines above and below 0 on the figures located on the right siderepresent the 5% significance levels (±1.96).

1912 The Journal of Finance
Figure 1—Continued.
absolute turnover, a result that is primarily driven by firms from the UnitedKingdom.16
Model 2 of Table II examines the sensitivity of CEO turnover to performanceemploying our alternative firm performance measure, 1-year lagged excess
16 Dahya et al. (2002) show that after the Cadbury Act was passed in 1992, CEO turnoverincreased for U.K. firms.

International Cross-Listing 1913
stock market returns. We find that the interaction between L2/3 and stock-price-based performance is negative and significant, while the interactions be-tween L1 or R144a and stock-price-based performance are insignificant. There-fore, with this alternative performance measure we continue to find that cross-listed firms that are associated with the most stringent U.S. investor protectionsare more likely to terminate poorly performing CEOs.
Overall, the results contained in Table II provide support for the hypothesisthat cross-listing on a major U.S. exchange, which requires the adoption of strin-gent U.S. investor protection laws, results in a significantly higher propensityto terminate poorly performing CEOs than their non-cross-listed counterparts.In addition, firms that cross-list via Level 1 or Rule 144a ADRs do not have anincreased association between CEO turnover and poor firm performance.
In untabulated results, we also split our sample into countries with highand low stock-price informativeness to examine if the CEO turnover to per-formance sensitivity is higher in countries where stock prices are more infor-mative about firm-specific performance. Prior research by DeFond and Hung(2004) and Volpin (2002) argues that only in countries where stock prices areinformative is CEO turnover related to stock market performance.17 However,it is important to note that a significant relation between CEO turnover andperformance in low informativeness countries is possible if stock prices be-come more informative about performance due to cross-listing, something thatFernandes and Ferreira (2006) and Dasgupta, Gan, Ning, (2005) suggest oc-curs. Consistent with DeFond and Hung (2004) and Volpin (2002), we find thatthe interaction between cross-listing types and firm performance is insignif-icant in countries that have below-median stock-price informativeness, whilein countries where stock prices are informative, cross-listing on a major U.S.exchange results in a higher propensity to shed poorly performing CEOs. Theseresults also suggest that the increased CEO turnover to performance sensitiv-ity for cross-listed firms is not driven purely by stock prices becoming moreinformative for cross-listed firms in certain countries.
Overall, the results in Table II provide support for the bonding hypothesis.We find that cross-listed firms have outcomes that are consistent with bettercorporate governance systems than similar non-cross-listed firms. Further, thefindings suggest that governance outcome differences are only significant forthose firms that adopt the strongest U.S. investor protections by listing on amajor U.S. exchange, rather than an OTC listing or private placement. Theseresults provide support for the hypothesis that by cross-listing in the UnitedStates, firms are able to opt-in to superior corporate governance.
B. The Strength of Bonding for Firms in Low Investor Protection Countries
Table III tests the third prediction of the bonding hypothesis that the ef-fect of bonding will be greatest for firms domiciled in the countries with theweakest investor protections. We test this hypothesis by splitting the sample
17 Bushman, Piotroski, and Smith (2004) show that corporate transparency is low in poor investorprotection countries.

1914 The Journal of Finance
Tab
leII
IC
EO
Tu
rnov
er,C
ross
-Lis
tin
g,an
dL
egal
En
viro
nm
ent
Th
ista
ble
pres
ents
the
prob
ites
tim
ates
ofth
ere
lati
onsh
ipbe
twee
nth
epr
obab
ilit
yof
CE
Otu
rnov
eran
dfi
rmpe
rfor
man
ceu
nde
rva
riou
sm
easu
res
ofa
cou
ntr
y’s
lega
len
viro
nm
ent.
Fir
mpe
rfor
man
ceis
mea
sure
dby
Lag
ged
Ear
nin
gsR
atio
,wh
ich
isth
e1-
year
lagg
edra
tio
ofea
rnin
gsbe
fore
inte
rest
and
taxe
sto
tota
lass
ets,
orL
agge
dE
xces
sR
etu
rns,
wh
ich
isth
e1-
year
lagg
edto
tals
tock
retu
rns
inex
cess
ofth
eco
un
try
aver
age
retu
rns.
Th
eC
ivil
Law
sam
ple
incl
ude
sfi
rms
loca
ted
inco
un
trie
sw
ith
aF
ren
ch,
Ger
man
,or
Sca
ndi
nav
ian
lega
lsy
stem
.T
he
Com
mon
Law
sam
ple
refe
rsto
firm
slo
cate
din
cou
ntr
ies
wit
hth
eE
ngl
ish
lega
lori
gin
.An
ti-d
irec
tor
righ
tsin
dex
mea
sure
sth
ede
gree
ofm
inor
ity
shar
ehol
der
prot
ecti
on.A
nti
-sel
f-de
alin
gis
anin
dex
ofth
est
ren
gth
ofm
inor
ity
shar
ehol
der
prot
ecti
onag
ain
stse
lf-d
eali
ng
byth
eco
ntr
olli
ng
shar
ehol
der.
All
thes
eco
un
try-
leve
lin
dice
sar
eob
tain
edfr
omD
jan
kov
etal
.(20
05).
Th
em
edia
ns
of3.
5fo
ran
ti-d
irec
tor
righ
tsan
d0.
42fo
ran
tise
lf-d
eali
ng
inde
xu
sed
inD
jan
kov
etal
.(20
05)
are
use
dto
grou
pfi
rms
into
hig
hve
rsu
slo
win
vest
orpr
otec
tion
regi
mes
(low
erth
anor
equ
alto
the
med
ian
refe
rsto
low
gove
rnan
cesu
bsam
ples
).L
evel
2/3
dum
my
is1
ifth
efi
rmh
asa
Lev
el2
orL
evel
3A
DR
prog
ram
,0ot
her
wis
e.L
evel
1du
mm
yis
1if
the
firm
has
aL
evel
1A
DR
prog
ram
,0ot
her
wis
e.R
ule
144A
dum
my
is1
ifth
efi
rmh
asa
Ru
le14
4Ais
suan
ce,0
oth
erw
ise.
Log
Ass
ets
isth
en
atu
rall
ogof
tota
lass
ets
mea
sure
din
mil
lion
$U.S
.Th
eco
nti
nu
ous
vari
able
sar
ew
inso
rize
dat
the
1%le
velf
orea
chco
un
try.
Th
ein
tera
ctio
nef
fect
isde
fin
edas
the
chan
gein
the
pred
icte
dpr
obab
ilit
yof
CE
Otu
rnov
erfo
ra
chan
gein
both
the
firm
perf
orm
ance
and
the
resp
ecti
vecr
oss-
list
eddu
mm
yu
sin
gth
em
eth
odol
ogy
ofN
orto
n,W
ang,
and
Ai(
2004
).T
he
z-st
atis
tics
appe
arin
pare
nth
eses
belo
wpa
ram
eter
esti
mat
es.R
obu
stst
anda
rder
rors
are
esti
mat
edu
sin
gth
eR
oger
sm
eth
odof
clu
ster
ing
byfi
rm.
∗∗∗
and
∗∗in
dica
tesi
gnif
ican
ceat
the
1%an
d5%
leve
l,re
spec
tive
ly.
Pan
elA
:On
e-Ye
arL
agge
dE
arn
ings
Rat
io
Low
An
ti-
Hig
hA
nti
-L
owA
nti
-H
igh
An
ti-
Civ
ilC
omm
onD
irec
tor
Dir
ecto
rS
elf-
Sel
f-L
awL
awR
igh
tsR
igh
tsD
eali
ng
Hig
hD
eali
ng
Var
iabl
e(1
)(2
)(3
)(4
)(5
)(6
)
Fir
m,c
oun
try,
indu
stry
,yea
rco
ntr
ols
Yes
Yes
Yes
Yes
Yes
Yes
Obs
erva
tion
s44
,735
26,2
3741
,007
29,9
6715
,936
55,0
20P
seu
do-R
20.
033
0.02
20.
034
0.02
30.
031
0.02
9M
ean
inte
ract
ion
effe
ctfo
r−0
.341
∗∗∗
0.01
9−0
.333
∗∗∗
0.01
8−0
.328
∗∗∗
−0.0
45L
23∗l
agge
dea
rnin
gsra
tio
[−3.
435]
[0.4
18]
[−3.
339]
[0.3
86]
[−3.
121]
[−1.
023]
Mea
nin
tera
ctio
nef
fect
for
−0.1
120.
040
−0.1
0400
38−0
.023
−0.0
31L
1∗l
agge
dea
rnin
gsra
tio
[−0.
850]
[0.5
40]
[−0.
763]
[0.5
19]
[−0.
154]
[−0.
440]
Mea
nin
tera
ctio
nef
fect
for
−0.1
640.
129
−0.1
830.
058
−0.1
21−0
.076
R14
4∗l
agge
dea
rnin
gsra
tio
[−1.
071]
[0.5
02]
[−0.
975]
[0.3
31]
[−0.
535]
[−0.
497]

International Cross-Listing 1915
Pan
elB
:On
e-Ye
arL
agge
dE
xces
sR
etu
rns
Low
An
ti-
Hig
hA
nti
-L
owA
nti
-H
igh
An
ti-
Civ
ilC
omm
onD
irec
tor
Dir
ecto
rS
elf-
Sel
f-L
awL
awR
igh
tsR
igh
tsD
eali
ng
Hig
hD
eali
ng
Var
iabl
e(1
)(2
)(3
)(4
)(5
)(6
)
Fir
m,c
oun
try,
indu
stry
,yea
rco
ntr
ols
Yes
Yes
Yes
Yes
Yes
Yes
Obs
erva
tion
s39
,809
22,5
1936
,552
25,7
7113
,455
48,8
54P
seu
do-R
20.
033
0.02
30.
034
0.02
40.
032
0.03
0M
ean
inte
ract
ion
effe
ctfo
r−0
.044
∗∗∗
0.01
3−0
.054
∗∗0.
007
−0.0
35∗∗
−0.0
09L
23∗l
agge
dex
cess
retu
rns
[−3.
256]
[0.8
01]
[−2.
077]
[0.5
00]
[−2.
492]
[−0.
655]
Mea
nin
tera
ctio
nef
fect
for
0.00
040.
002
−0.0
090.
003
−0.0
002
−0.0
03L
1∗l
agge
dex
cess
retu
rns
[0.1
48]
[0.1
10]
[−0.
250]
[0.7
51]
[−0.
077]
[−0.
200]
Mea
nin
tera
ctio
nef
fect
for
−0.0
002
0.02
60.
004
0.00
4−0
.004
0.01
4R
144
∗lag
ged
exce
ssre
turn
s[−
0.01
5][0
.931
][0
.267
][0
.250
][−
0.25
3][1
.148
]

1916 The Journal of Finance
by investor protection regimes and examining the interactions between cross-listing types and firm performance, for both accounting- and stock-market-based performance measures (Panels A and B, respectively). Firm, country,industry, and year controls are included in all regressions.
The first two columns in Panel A of Table III split the sample by legal origin, aclassification that proxies for the overall protection of minority shareholders ina country (see, for example, LLSV (1998)). Model 1 shows that in countries withCivil Law tradition, where investor protection is weakest, the corrected interac-tion between Level 2/3 and Lagged Earnings Ratio is negative and significant(−0.341, t-statistic = −3.435). Model 1 also shows that the corrected interac-tions between firm performance and L1 or R144a are insignificant (−0.112,t-statistic = −0.850, and −0.164, t-statistic = −1.071, respectively). Therefore,in countries with poor investor protections, cross-listing on a major U.S. ex-change is associated with an increased CEO turnover to poor firm performancesensitivity. In terms of economic significance, the probability of replacing theCEO increases by 4.36% in absolute terms for Level 2/3 ADRs when we movefrom the top quartile to the bottom quartile of firm performance measured inCivil Law countries.18
Model 2 of Panel A presents the results for Common Law countries, whereinvestor protection is strongest. In these countries, we find that all the interac-tions between cross-listing type and the Lagged Earnings Ratio are statisticallyinsignificant. Further, the difference in the interaction terms between Civil andCommon Law countries is significant (p-value of lower than 0.01). Therefore,the results indicate that the effect of U.S. investor protections is most signifi-cant when the firm’s home country investor protections are weakest. Althoughnot reported, we find that the Lagged Earnings Ratio coefficient is negative andsignificant, which is consistent with previous research that finds accounting-based performance is used for managerial performance evaluation.
To further test if the extent of bonding is dependent on the category of pro-tections investors are afforded in a particular country, we also investigate al-ternative investor protection indices from Djankov et al. (2005). Models 3 and5 report results for countries classified as having weak protection of minorityshareholders and poor safeguards against corporate tunneling. In both models,we find the interactions (both standard and corrected) between Level 2/3 andLagged Earnings Ratio are negative and significant, indicating that in theselow investor protection countries, cross-listing on a major U.S. exchange is as-sociated with increased CEO turnover to poor firm performance sensitivity.Models 4 and 6 report results for the strong investor protection countries. Inboth these models, the interactions between cross-listing type (Level 2/3, L1, orR144a) are insignificant, indicating no difference in the CEO turnover to firmperformance relation in countries that have strong investor protection.19
18 For comparison, Huson et al. (2001) show that going from the top quartile to the lowest quartilein EBIT/TA ratio increases the probability of CEO turnover by 2%.
19 Using alternative measures of investor protection laws from LLS (2006) and LLSV (1998),such as the burden of proof, investor protection, private law enforcement, disclosure, and ruleof law indexes, produces similar conclusions. Further, the results are robust to using Spamann’s(2006) ADRI.

International Cross-Listing 1917
Panel B provides the results for the stock-price-based firm performance mea-sure. As in Panel A, we find across all weak investor protection subsamples,the interaction between firm performance and Level 2/3 is negative and signifi-cant. For example, the mean-corrected interactive effect in Civil Law countriesis −0.044 (t-statistic = −3.256). For other cross-listing types, the interactioncoefficients are insignificant. Further, Models 2, 4, and 6 show that in stronginvestor protection countries, cross-listing does not increase the sensitivity ofCEO turnover to poor firm performance.
Taken together, the results in Table III show that in countries where investorprotections are weakest, adopting the strongest U.S. investor protection provi-sions results in significantly greater propensity to terminate poorly performingCEOs, while in countries that already have strong investor protections, cross-listing does not change the CEO turnover to performance sensitivity. Further,the results show that in weak investor protection countries, only cross-listingsthat require the most stringent of U.S. investor protections (exchange-listedcross-listings) are associated with better governance outcomes. Therefore, theresults provide support for the second and third main predictions of the bondinghypothesis.
C. Sensitivity of CEO Turnover to Performance in the Pre-Cross-Listing Period
The previous analysis establishes that cross-listed firms on major U.S. ex-changes have outcomes that are consistent with improved corporate gover-nance over non-cross-listed firms. In this analysis, the comparison group isall non-cross-listed firms, which includes firms that may never cross-list aswell as cross-listed firms in their pre-cross-listing period. However, an alterna-tive explanation for our findings is that only the better-governed firms chooseto cross-list on a major U.S. exchange, which would drive our results. Whileour previous tests employed time-varying cross-listing indicator variables thatequal one only after the firm cross-listed, we further examine this issue byperforming two additional tests in which we examine the sensitivity of CEOturnover to performance in the pre-cross-listing period.
In the first test, we examine how the sensitivity of CEO turnover to firmperformance differs before and after cross-listing, where we restrict the sam-ple to firms that will have a cross-listing of the same type during our sampleperiod.20 The advantage of this experiment is that the non-cross-listed compari-son group consists of firms that will have a cross-listing of a similar type duringthe sample period (that is, the pre-cross-listing period of the cross-listed firms).If firms that pursue exchange-traded cross-listings have better governanceprior to cross-listing, then we would expect to find little difference betweencross-listed firms and “to-be” cross-listed firms. Due to space considerations,in this test we focus on the broad Civil versus Common Law classificationsusing the lagged earnings ratio performance measure, but other governance
20 We also examine the comparison groups together with indicator variables for cross-listingtypes (i.e., Level 2/3, Level 1, and Rule144a dummies together) and obtain similar results.

1918 The Journal of Finance
classifications and performance measures produce consistent results.21 Model1 in Table IV shows that the sensitivity of turnover to performance for exchange-traded cross-listings is significantly larger than that for non-cross-listed firmsthat will eventually cross-list on a major exchange in low shareholder protec-tion countries. Therefore, the results suggest that the difference in governanceoutcomes is driven by the post-cross-listing period of cross-listed firms. Thecoefficient on L2/3 also shows that these firms have higher absolute turnoverafter cross-listing. For Level 1 and Rule 144a cross-listings, the interactionsbetween cross-listing type and firm performance are not significantly differentbetween cross-listed and non-cross-listed firms.
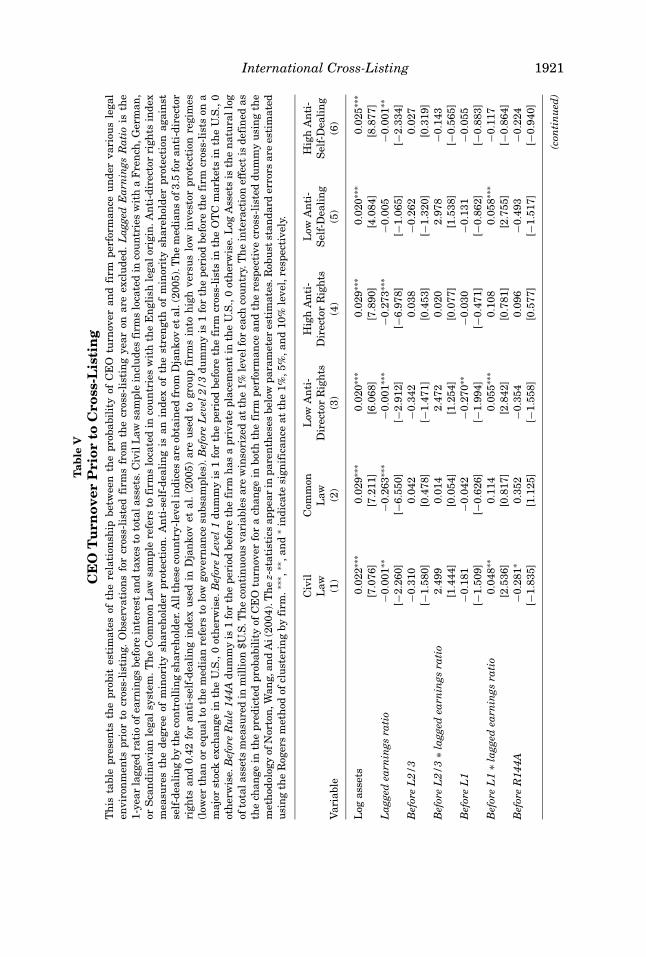
The second way we test if the pre-cross-listing governance of our samplefirms is driving our results is to exclude all observations for cross-listed firmsfollowing the cross-listing year and compare the interactions of “to-be” cross-listed firms’ performance to the full sample of non-cross-listed firms. If the pre-cross-listing status of cross-listed firms is driving our results, we might expectto see results in this analysis similar to our full sample tests presented earlier.An advantage of this test is that we are able to use the full sample of non-cross-listed firms. The disadvantage is that there are relatively few observations inthe prelisting period, which is likely to lower the power of the test. Table V showsthat when the post-cross-listing observations are excluded, we no longer findthat cross-listed firms are more likely to terminate poorly performing CEOs.22
We also find in Table V that Before L1 ∗ Lagged Earnings Ratio is positiveand significant, which suggests these firms see an improvement from a verylow level of corporate governance, where well-performing managers are morelikely to leave, to a low level where there is no relation between turnover andperformance.
Overall, the results in Tables IV and V show that when compared to theirpre-cross-listing status, cross-listing on a major U.S. exchange results in sig-nificantly higher CEO turnover to firm performance sensitivity. Therefore, theresults indicate that it is not the pre-cross-listing governance of firms that isdriving the results. Taken together, the evidence in the preceding sections sug-gests that in countries with poor investor protections, cross-listing on a majorU.S. exchange increases the likelihood that firms will have outcomes consistentwith improved corporate governance systems.
D. London Listings
Listing in London is an often-cited alternative for firms that do not wish tosubject themselves to the stringent listing requirements in the United States.23
21 For example, using the excess returns measure, the interaction between performance andLevel 2/3 is also statistically significant (insignificant) in Civil (Common) Law, weak (strong) anti-director rights, and low (high) anti-self-dealing subsamples.
22 We also estimate a two-stage model for self-selection that controls for the decision to list inthe first stage and find that our results are robust to this specification.
23 See, for example, “London Calling” in Forbes Magazine May 8, 2006.

International Cross-Listing 1919
Tab
leIV
CE
OT
urn
over
and
Cro
ss-L
isti
ng:
Fir
ms
wit
ha
Cro
ss-L
isti
ng
ofth
eS
ame
Typ
eT
his
tabl
epr
esen
tsth
epr
obit
esti
mat
esof
the
rela
tion
ship
betw
een
the
prob
abil
ity
ofC
EO
turn
over
and
firm
perf
orm
ance
for
firm
sth
ath
ave
orw
ill
hav
ea
sim
ilar
type
ofA
DR
prog
ram
duri
ng
the
sam
ple
peri
od.T
he
sam
ple
inco
lum
ns
1–2
isli
mit
edto
firm
sth
ath
ave
orw
illh
ave
list
edon
am
ajor
U.S
.exc
han
gedu
rin
gou
rsa
mpl
epe
riod
.Sim
ilar
ly,t
he
sam
ples
inco
lum
ns
3–4
and
5–6
rest
rict
the
sam
ple
tofi
rms
that
list
onth
eO
TC
mar
ket
and
issu
epr
ivat
epl
acem
ents
via
Ru
le14
4aan
ytim
edu
rin
gou
rsa
mpl
epe
riod
,res
pect
ivel
y.L
agge
dE
arn
ings
Rat
iois
the
1-ye
arla
gged
rati
oof
earn
ings
befo
rein
tere
stan
dta
xes
toto
tal
asse
ts.
Th
eC
ivil
Law
sam
ple
incl
ude
sfi
rms
loca
ted
inco
un
trie
sw
ith
aF
ren
ch,
Ger
man
,or
Sca
ndi
nav
ian
lega
lsy
stem
.Th
eC
omm
onL
awsa
mpl
ere
fers
tofi
rms
loca
ted
inco
un
trie
sw
ith
the
En
glis
hle
galo
rigi
n.T
his
clas
sifi
cati
onof
lega
lreg
imes
isob
tain
edfr
omD
jan
kov
etal
.(20
05).
Lev
el2/
3du
mm
yis
1if
the
firm
has
aL
evel
2or
Lev
el3
AD
Rpr
ogra
m,0
oth
erw
ise.
Lev
el1
dum
my
is1
ifth
efi
rmh
asa
Lev
el1
AD
Rpr
ogra
m,0
oth
erw
ise.
Ru
le14
4Adu
mm
yis
1if
the
firm
has
aR
ule
144A
issu
ance
,0ot
her
wis
e.L
ogA
sset
sis
the
nat
ura
llo
gof
tota
las
sets
mea
sure
din
mil
lion
$U.S
.Th
eco
nti
nu
ous
vari
able
sar
ew
inso
rize
dat
the
1%le
velf
orea
chco
un
try.
Th
ein
tera
ctio
nef
fect
isde
fin
edas
the
chan
gein
the
pred
icte
dpr
obab
ilit
yof
CE
Otu
rnov
erfo
ra
chan
gein
both
the
firm
perf
orm
ance
and
the
resp
ecti
vecr
oss-
list
eddu
mm
yu
sin
gth
em
eth
odol
ogy
ofN
orto
n,W
ang,
and
Ai
(200
4).T
he
z-st
atis
tics
appe
arin
pare
nth
eses
belo
wpa
ram
eter
esti
mat
es.R
obu
stst
anda
rder
rors
are
esti
mat
edu
sin
gth
eR
oger
sm
eth
odof
clu
ster
ing
byfi
rm.∗
∗∗,∗
∗ ,an
d∗
indi
cate
sign
ific
ance
atth
e1%
,5%
,an
d10
%le
vel,
resp
ecti
vely
.
Exc
han
ge-T
rade
dA
DR
sO
TC
-Tra
ded
AD
Rs
Pri
vate
Pla
cem
ents
Civ
ilL
awC
omm
onL
awC
ivil
Law
Com
mon
Law
Civ
ilL
awC
omm
onL
awV
aria
ble
(1)
(2)
(3)
(4)
(5)
(6)
Log
asse
ts−0
.011
0.02
8∗−0
.006
0.01
30.
148∗
∗∗0.
122∗
∗[−
0.48
1][1
.770
][0
.299
][0
.769
][3
.028
][2
.299
]L
agge
dea
rnin
gsra
tio
1.40
5−0
.134
−0.0
27−0
.122
−0.8
88−2
.495
[0.9
64]
[−0.
509]
[−0.
837]
[−0.
829]
[−0.
705]
[−0.
668]
L2/
30.
631∗
∗∗0.
021
––
––
[3.2
19]
[0.2
03]
L2/
3∗l
agge
dea
rnin
gsra
tio
−2.8
52∗
0.02
1–
––
–[−
1.90
3][0
.067
]L
1–
–0.
194
−0.0
63–
–[1
.547
][−
0.56
7]L
1∗l
agge
dea
rnin
gsra
tio
––
−0.2
660.
094
––
[−0.
449]
[0.2
50]
(con
tin
ued
)

1920 The Journal of Finance
Tab
leIV
—C
onti
nu
ed
Exc
han
ge-T
rade
dA
DR
sO
TC
-Tra
ded
AD
Rs
Pri
vate
Pla
cem
ents
Civ
ilL
awC
omm
onL
awC
ivil
Law
Com
mon
Law
Civ
ilL
awC
omm
onL
awV
aria
ble
(1)
(2)
(3)
(4)
(5)
(6)
R14
4A–
––
–0.
196
−0.7
14[0
.899
][−
1.57
5]R
144A
∗lag
ged
earn
ings
rati
o–
––
–0.
472
3.14
4[0
.303
][0
.796
]C
onst
ant
0.47
3−6
.433
∗∗∗
−11.
514∗
∗∗−6
.577
∗∗∗
−0.7
69−0
.320
[0.6
35]
[−10
.192
][−
40.6
28]
[−18
.563
][−
0.82
8][−
0.42
7]C
oun
try
effe
cts
Yes
Yes
Yes
Yes
Yes
Yes
indu
stry
effe
cts
(tw
o-di
git
SIC
)Ye
sYe
sYe
sYe
sYe
sYe
sYe
aref
fect
sYe
sYe
sYe
sYe
sYe
sYe
s
Obs
erva
tion
s73
71,
567
1,49
61,
656
544
367
Pse
udo
-R2
0.14
70.
061
0.05
90.
067
0.24
20.
171
Mea
nin
tera
ctio
nef
fect
−0.5
65∗
0.00
5−0
.092
0.02
30.
046
0.81
9[−
1.70
2][0
.061
][−
0.63
3][0
.266
][0
.084
][0
.748
]
International Cross-Listing 1921T
able
VC
EO
Tu
rnov
erP
rior
toC
ross
-Lis
tin
gT
his
tabl
epr
esen
tsth
epr
obit
esti
mat
esof
the
rela
tion
ship
betw
een
the
prob
abil
ity
ofC
EO
turn
over
and
firm
perf
orm
ance
un
der
vari
ous
lega
len
viro
nm
ents
prio
rto
cros
s-li
stin
g.O
bser
vati
ons
for
cros
s-li
sted
firm
sfr
omth
ecr
oss-
list
ing
year
onar
eex
clu
ded.
Lag
ged
Ear
nin
gsR
atio
isth
e1-
year
lagg
edra
tio
ofea
rnin
gsbe
fore
inte
rest
and
taxe
sto
tota
lass
ets.
Civ
ilL
awsa
mpl
ein
clu
des
firm
slo
cate
din
cou
ntr
ies
wit
ha
Fre
nch
,Ger
man
,or
Sca
ndi
nav
ian
lega
lsys
tem
.Th
eC
omm
onL
awsa
mpl
ere
fers
tofi
rms
loca
ted
inco
un
trie
sw
ith
the
En
glis
hle
galo
rigi
n.A
nti
-dir
ecto
rri
ghts
inde
xm
easu
res
the
degr
eeof
min
orit
ysh
areh
olde
rpr
otec
tion
.A
nti
-sel
f-de
alin
gis
anin
dex
ofth
est
ren
gth
ofm
inor
ity
shar
ehol
der
prot
ecti
onag
ain
stse
lf-d
eali
ng
byth
eco
ntr
olli
ng
shar
ehol
der.
All
thes
eco
un
try-
leve
lin
dice
sar
eob
tain
edfr
omD
jan
kov
etal
.(20
05).
Th
em
edia
ns
of3.
5fo
ran
ti-d
irec
tor
righ
tsan
d0.
42fo
ran
ti-s
elf-
deal
ing
inde
xu
sed
inD
jan
kov
etal
.(2
005)
are
use
dto
grou
pfi
rms
into
hig
hve
rsu
slo
win
vest
orpr
otec
tion
regi
mes
(low
erth
anor
equ
alto
the
med
ian
refe
rsto
low
gove
rnan
cesu
bsam
ples
).B
efor
eL
evel
2/3
dum
my
is1
for
the
peri
odbe
fore
the
firm
cros
s-li
sts
ona
maj
orst
ock
exch
ange
inth
eU
.S.,
0ot
her
wis
e.B
efor
eL
evel
1du
mm
yis
1fo
rth
epe
riod
befo
reth
efi
rmcr
oss-
list
sin
the
OT
Cm
arke
tsin
the
U.S
.,0
oth
erw
ise.
Bef
ore
Ru
le14
4Adu
mm
yis
1fo
rth
epe
riod
befo
reth
efi
rmh
asa
priv
ate
plac
emen
tin
the
U.S
.,0
oth
erw
ise.
Log
Ass
ets
isth
en
atu
rall
ogof
tota
lass
ets
mea
sure
din
mil
lion
$U.S
.Th
eco
nti
nu
ous
vari
able
sar
ew
inso
rize
dat
the
1%le
velf
orea
chco
un
try.
Th
ein
tera
ctio
nef
fect
isde
fin
edas
the
chan
gein
the
pred
icte
dpr
obab
ilit
yof
CE
Otu
rnov
erfo
ra
chan
gein
both
the
firm
perf
orm
ance
and
the
resp
ecti
vecr
oss-
list
eddu
mm
yu
sin
gth
em
eth
odol
ogy
ofN
orto
n,W
ang,
and
Ai(
2004
).T
he
z-st
atis
tics
appe
arin
pare
nth
eses
belo
wpa
ram
eter
esti
mat
es.R
obu
stst
anda
rder
rors
are
esti
mat
edu
sin
gth
eR
oger
sm
eth
odof
clu
ster
ing
byfi
rm.∗
∗∗,∗
∗ ,an
d∗
indi
cate
sign
ific
ance
atth
e1%
,5%
,an
d10
%le
vel,
resp
ecti
vely
.
Civ
ilC
omm
onL
owA
nti
-H
igh
An
ti-
Low
An
ti-
Hig
hA
nti
-L
awL
awD
irec
tor
Rig
hts
Dir
ecto
rR
igh
tsS
elf-
Dea
lin
gS
elf-
Dea
lin
gV
aria
ble
(1)
(2)
(3)
(4)
(5)
(6)
Log
asse
ts0.
022∗
∗∗0.
029∗
∗∗0.
020∗
∗∗0.
029∗
∗∗0.
020∗
∗∗0.
025∗
∗∗[7
.076
][7
.211
][6
.068
][7
.890
][4
.084
][8
.877
]L
agge
dea
rnin
gsra
tio
−0.0
01∗∗
−0.2
63∗∗
∗−0
.001
∗∗∗
−0.2
73∗∗
∗−0
.005
−0.0
01∗∗
[−2.
260]
[−6.
550]
[−2.
912]
[−6.
978]
[−1.
065]
[−2.
334]
Bef
ore
L2/
3−0
.310
0.04
2−0
.342
0.03
8−0
.262
0.02
7[−
1.58
0][0
.478
][−
1.47
1][0
.453
][−
1.32
0][0
.319
]B
efor
eL
2/3
∗lag
ged
earn
ings
rati
o2.
499
0.01
42.
472
0.02
02.
978
−0.1
43[1
.444
][0
.054
][1
.254
][0
.077
][1
.538
][−
0.56
5]B
efor
eL
1−0
.181
−0.0
42−0
.270
∗∗−0
.030
−0.1
31−0
.055
[−1.
509]
[−0.
626]
[−1.
994]
[−0.
471]
[−0.
862]
[−0.
883]
Bef
ore
L1
∗lag
ged
earn
ings
rati
o0.
048∗
∗0.
114
0.05
5∗∗∗
0.10
80.
058∗
∗∗−0
.117
[2.5
36]
[0.8
17]
[2.8
42]
[0.7
81]
[2.7
55]
[−0.
864]
Bef
ore
R14
4A−0
.281
∗0.
352
−0.3
540.
096
−0.4
93−0
.224
[−1.
835]
[1.1
25]
[−1.
558]
[0.5
77]
[−1.
517]
[−0.
940]
(con
tin
ued
)

1922 The Journal of Finance
Tab
leV
—C
onti
nu
ed
Civ
ilC
omm
onL
owA
nti
-H
igh
An
ti-
Low
An
ti-
Hig
hA
nti
-L
awL
awD
irec
tor
Rig
hts
Dir
ecto
rR
igh
tsS
elf-
Dea
lin
gS
elf-
Dea
lin
gV
aria
ble
(1)
(2)
(3)
(4)
(5)
(6)
Bef
ore
R14
4A∗l
agge
dea
rnin
gsra
tio
−0.0
01−1
.171
1.50
50.
270∗
∗∗−0
.516
2.28
2[−
1.04
6][−
0.48
2][0
.694
][6
.895
][−
0.19
2][1
.077
]C
onst
ant
−0.9
36∗∗
−0.6
40∗
−0.8
89∗
−1.4
86∗∗
∗−1
.528
∗∗∗
−0.8
69∗
[−2.
048]
[−1.
676]
[−1.
935]
[−2.
822]
[−3.
415]
[−1.
909]
Cou
ntr
yef
fect
sYe
sYe
sYe
sYe
sYe
sYe
sIn
dust
ryef
fect
s(t
wo-
digi
tS
IC)
Yes
Yes
Yes
Yes
Yes
Yes
Year
effe
cts
Yes
Yes
Yes
Yes
Yes
Yes
Obs
erva
tion
s42
,137
23,4
0938
,556
26,9
9214
,869
50,6
62P
seu
do-R
20.
033
0.02
10.
034
0.02
20.
030
0.02
8
Mea
nin
tera
ctio
nef
fect
for
befo
re0.
494
0.00
10.
466
0.00
20.
660
−0.0
34L
23∗l
agge
dea
rnin
gsra
tio
[1.4
21]
[0.0
13]
[1.2
68]
[0.0
38]
[1.4
06]
[−0.
567]
Mea
nin
tera
ctio
nef
fect
for
befo
re0.
010∗
∗∗0.
028
0.01
0∗∗∗
0.02
60.
012∗
∗∗−0
.026
L1
∗lag
ged
earn
ings
rati
o[2
.916
][0
.896
][3
.509
][0
.842
][3
.100
][−
0.87
1]
Mea
nin
tera
ctio
nef
fect
for
befo
re−0
.000
1−0
.353
0.26
50.
063∗
∗∗−0
.068
0.47
9R
144
∗lag
ged
earn
ings
rati
o[−
0.29
6][−
0.49
0][0
.718
][5
.712
][−
0.18
7][1
.134
]

International Cross-Listing 1923
Consistent with the hypothesis that a London listing does not convey the samegovernance commitment as a U.S. listing, Doidge et al. (2006) find that firmswith high private benefits of control are more likely to list in London ratherthan on a major U.S. exchange. Baker et al. (2002) also find that monitoringby financial analysts is lower in London Stock Exchange (LSE) cross-listingsversus U.S. cross-listings and Seetharaman, Ferdinand, and Lynn (2002) findthat U.K. auditors charge higher fees for client firms that are listed in theUnited States to compensate for the higher risk of litigation.
To test if cross-listing on the LSE also results in improved governance out-comes, we gather a sample of 688 firm-year observations (145 firms from 27countries) that trade in London and rerun our models to examine the sensitiv-ity of CEO turnover to performance between firms that cross-listed in Londonand those firms that did not.24 Since we are examining London listings, weexclude observations from the United Kingdom. Table VI reports that the in-teraction between LSE Listing and firm performance is not significant in anyspecification. In addition, the results are robust when U.S. firms are included.In unreported tests, we also find that the difference between listing on a majorU.S. exchange and on the LSE is statistically significant at the 5% level. There-fore, unlike a major U.S. exchange cross-listing, we do not find that listing onthe LSE is associated with better corporate governance outcomes.
E. Labor Market Effects: The Departing and Replacement CEOs’ Work History
A potential explanation for our results is that cross-listing also changes thelabor market for top management. For example, one possibility is that cross-listing may induce top management to leave their jobs to pursue employment inthe United States where they are likely to receive higher compensation. Anotherpossibility is that by cross-listing, firms are able to tap a more internationalpool of top management candidates and therefore are more likely to fire poorlyperforming managers. To investigate these effects, we examine a subsample of150 cross-listed firms that experienced a CEO turnover after cross-listing. Dueto the labor intensiveness of this investigation, these CEO turnover events arerandomly drawn from sample firms, with an equal number for Level 2/3 ADRs,Level 1 ADRs, and private placements.
We first search news articles as well as reexamine the CEO data on theWorldScope database to find out where the departing CEO found employment.We are able to find the post-turnover employment information for 110 CEOs.Of these, only eight went to a U.S. firm, and only five of these were from amajor exchange cross-listed firm (Level 2/3). Further, only one of the five leftvoluntarily. Therefore, this evidence does not appear to be consistent with alarge number of CEOs leaving to take higher paid jobs in the United States.
We next investigate the newly appointed CEOs’ previous work experienceto see if cross-listed firms may be more likely to terminate poorly performingmanagement when the potential quality of the labor market is higher. For the
24 A list of international firms trading on the LSE is available at www.londonstockexchange.com.

1924 The Journal of FinanceT
able
VI
CE
OT
urn
over
and
Cro
ss-L
isti
ng
onth
eL
ond
onS
tock
Exc
han
geT
his
tabl
epr
esen
tsth
epr
obit
esti
mat
esof
the
rela
tion
ship
betw
een
the
prob
abil
ity
ofC
EO
turn
over
and
firm
perf
orm
ance
un
der
vari
ous
lega
len
viro
nm
ents
for
non
-U.K
.fi
rms
cros
s-li
sted
onth
eL
ondo
nS
tock
Exc
han
ge.T
he
U.K
.fir
ms
are
excl
ude
dfr
omth
esa
mpl
e.T
he
sam
ple
incl
ude
sfi
rms
list
edon
the
LS
E,i
ncl
udi
ng
1fr
omA
rgen
tin
a,3
from
Au
stra
lia,
8fr
omC
anad
a,1
from
Den
mar
k,2
from
Fra
nce
,7fr
omG
erm
any,
7fr
omG
reec
e,5
from
Hon
gK
ong,
2fr
omH
un
gary
,13
from
Indi
a,2
from
Indo
nes
ia,
26fr
omIr
elan
d,7
from
Isra
el,
19fr
omJa
pan
,2
from
Kor
ea,
2fr
omL
uxe
mbo
urg
,1
from
Mal
aysi
a,3
from
Net
her
lan
ds,
2fr
omN
orw
ay,
5fr
omP
olan
d,7
from
Sou
thA
fric
a,2
from
Spa
in,
4fr
omS
wed
en,
2fr
omS
wit
zerl
and,
7fr
omT
aiw
an,
4fr
omT
urk
ey,
and
1fr
omZ
imba
bwe
for
ato
tal
of68
8fi
rm-y
ear
obse
rvat
ion
s.L
SE
Lis
tin
gdu
mm
yis
1if
the
firm
’ssh
ares
are
trad
edon
the
Lon
don
Sto
ckE
xch
ange
,0ot
her
wis
e.T
he
Civ
ilL
awsa
mpl
ein
clu
des
firm
slo
cate
din
cou
ntr
ies
wit
ha
Fre
nch
,Ger
man
,or
Sca
ndi
nav
ian
lega
lsys
tem
.Th
eC
omm
onL
awsa
mpl
ere
fers
tofi
rms
loca
ted
inco
un
trie
sw
ith
the
En
glis
hle
galo
rigi
n.A
nti
-dir
ecto
rri
ghts
inde
xm
easu
res
the
degr
eeof
min
orit
ysh
areh
olde
rpr
otec
tion
.An
ti-s
elf-
deal
ing
isan
inde
xof
the
stre
ngt
hof
min
orit
ysh
areh
olde
rpr
otec
tion
agai
nst
self
-dea
lin
gby
the
con
trol
lin
gsh
areh
olde
r.A
llth
ese
cou
ntr
y-le
vel
indi
ces
are
obta
ined
from
Dja
nko
vet
al.(
2005
).T
he
med
ian
sof
3.5
for
anti
-dir
ecto
rri
ghts
and
0.42
for
anti
-sel
f-de
alin
gin
dex
use
din
Dja
nko
vet
al.
(200
5)ar
eu
sed
togr
oup
firm
sin
toh
igh
vers
us
low
inve
stor
prot
ecti
onre
gim
es(l
ower
than
oreq
ual
toth
em
edia
nre
fers
tolo
wgo
vern
ance
subs
ampl
es).
Log
Ass
ets
isth
en
atu
rall
ogof
tota
lass
ets
mea
sure
din
mil
lion
$U.S
.Th
eco
nti
nu
ous
vari
able
sar
ew
inso
rize
dat
the
1%le
velf
orea
chco
un
try.
Th
ein
tera
ctio
nef
fect
isde
fin
edas
the
chan
gein
the
pred
icte
dpr
obab
ilit
yof
CE
Otu
rnov
erfo
ra
chan
gein
both
the
firm
perf
orm
ance
and
the
resp
ecti
vecr
oss-
list
eddu
mm
yu
sin
gth
em
eth
odol
ogy
ofN
orto
n,
Wan
g,an
dA
i(2
004)
.Th
ez-
stat
isti
csap
pear
inpa
ren
thes
esbe
low
para
met
eres
tim
ates
.Rob
ust
stan
dard
erro
rsar
ees
tim
ated
usi
ng
the
Rog
ers
met
hod
ofcl
ust
erin
gby
firm
.∗∗∗
,∗∗ ,
and
∗in
dica
tesi
gnif
ican
ceat
the
1%,5
%,a
nd
10%
leve
l,re
spec
tive
ly.
Fu
llC
ivil
Com
mon
Low
An
ti-
Hig
hA
nti
-L
owA
nti
-H
igh
An
ti-
Sam
ple
Law
Law
Dir
ecto
rR
igh
tsD
irec
tor
Rig
hts
Sel
f-D
eali
ng
Sel
f-D
eali
ng
Var
iabl
e(1
)(2
)(3
)(4
)(5
)(6
)(7
)
Log
Ass
ets
0.02
2∗∗∗
0.02
0∗∗∗
0.02
6∗∗∗
0.01
8∗∗∗
0.02
7∗∗∗
0.01
8∗∗∗
0.02
4∗∗∗
[8.5
55]
[6.8
44]
[5.0
99]
[5.7
97]
[6.0
15]
[4.0
01]
[7.5
90]
Lag
ged
earn
ings
rati
o−0
.002
∗−0
.001
∗∗−0
.220
∗∗∗
−0.0
01∗∗
−0.2
36∗∗
∗−0
.004
−0.0
01∗∗
∗
[−1.
686]
[−2.
215]
[−4.
692]
[−2.
387]
[−5.
214]
[1.0
73]
[−3.
314]
LS
EL
isti
ng
0.03
70.
172
−0.0
360.
179
−0.0
210.
217
0.01
6[0
.484
][1
.386
][−
0.32
3][1
.425
][−
0.19
4][1
.086
][0
.186
]L
SE
Lis
tin
g∗l
agge
dea
rnin
gsra
tio
−0.0
91−1
.680
0.29
0−1
.662
0.07
9−2
.036
0.04
[−0.
229]
[−1.
290]
[0.7
18]
[−1.
269]
[0.2
01]
[−1.
156]
[0.1
11]
Con
stan
t−0
.791
∗∗∗
−0.7
84∗∗
∗−1
.630
∗∗∗
−0.7
63∗∗
∗−1
.413
∗∗∗
−2.2
24∗∗
∗−0
.778
∗∗∗
[−2.
820]
[−2.
691]
[−3.
240]
[−2.
621]
[−2.
970]
[−3.
894]
[−2.
699]
Cou
ntr
yef
fect
sYe
sYe
sYe
sYe
sYe
sYe
sYe
sIn
dust
ryef
fect
s(t
wo-
digi
tS
IC)
Yes
Yes
Yes
Yes
Yes
Yes
Yes
Year
Eff
ects
Yes
Yes
Yes
Yes
Yes
Yes
Yes
Obs
erva
tion
s60
,971
44,7
3016
,237
41,0
0219
,967
15,9
3145
,016
Pse
udo
-R2
0.02
80.
032
0.02
40.
034
0.02
50.
030
0.03
1
Mea
nin
tera
ctio
nef
fect
−0.0
23−0
.438
0.06
9−0
.435
0.01
9−0
.528
0.00
9[−
0.38
9][−
0.22
0][0
.590
][−
0.22
1][0
.516
][−
0.17
3][0
.396
]

International Cross-Listing 1925
127 turnover events for which we are able to find information about the newCEO’s previous work experience, only six CEOs are recruited from a nondo-mestic labor market, three are recruited by firms with Level 2/3 ADRs, andthe other three by other cross-listed firms.25 The finding that most cross-listedfirms still recruit from the domestic labor market suggests that our results arenot explained by the possibility that the propensity to terminate poorly per-forming CEOs in cross-listed firms increases due to access to a new and moreinternational labor market. Taken together, the results of these two tests sug-gest that potential labor market changes concurrent with cross-listing do notdrive our results.26
V. Robustness Tests
In this section, we perform variations of the tests we conduct in Section IV.The purpose of this analysis is to gauge the sensitivity of our results to the ex-clusion or inclusion of certain observations and to alternative specifications ofthe tests. Where tabulated, we report results for the accounting-based firm per-formance measure (lagged earnings ratio) and note that the results are robustin all cases for the stock-price-based measure (lagged excess returns).
A. Privatizations, Institutional Ownership, Board Composition, and Mergersaround Cross-Listing
One potential concern is that another underlying governance change con-current with cross-listing could be responsible for our results. To investigatethis issue, we gather information on potential control changes for cross-listedcompanies including privatizations, changes in institutional ownership, M&Aevents, as well changes in the composition of board of directors. We focus onfirms that cross-listed between 1992 and 2003 and had pre- and post-turnoverdata for testing purposes. For privatizations, we match our sample of cross-listed firms with the firms that were fully or partially privatized over our sam-ple period and find that 24 of our sample firms over the period from 1992 to2003 were privatized during the year before or after cross-listing.27 For M&Aevents, we match our sample of cross-listed firms with Securities Data Com-pany’s Mergers and Acquisitions database to find cross-listed firms that either
25 To be more specific, of 42 newly appointed CEOs in firms with Level 2/3 ADRs, 39 wererecruited from domestic firms, 1 from a U.S. firm, 1 from a British firm, and 1 from a Dutch firm.For firms with Level 1 ADRs, 2 out of 43 newly appointed CEOs were recruited from internationalfirms (1 U.S. and 1 French firm), and for firms with Rule 144A issues, only 1 CEO out of 42 newlyappointed CEOs was recruited from international firms (a British firm).
26 It is important to note that compensation differences between U.S. and foreign firms couldalso play a role in the willingness of CEOs to leave newly cross-listed firms. However, disaggregatecompensation data are generally unavailable for cross-listed firms (see Bryan, Nash, and Patel(2005)).
27 Fourteen are L2/3, 3 are L1, and 7 are R144 firms. See Megginson and Netter (2001) for asurvey of the privatization literature.

1926 The Journal of Finance
bought or sold controlling stakes in targets during the year before and aftertheir cross-listing. From 1992 to 2003, 44 firms cross-listed and also acquiredor sold controlling stakes in other companies in the year before or after cross-listing: of these, 27 were Level 2/3, 12 were Level 1, and 5 were R144 firms.For data on potential ownership and board of director changes for cross-listedfirms, we hand-collect data from various filings (13F/13D/13G), prospectuses,and annual reports for the year before and after cross-listing. We classify ablockholder as institutional if it was a pension fund, mutual fund, insurancefirm, bank, investment bank, credit institution, private equity fund, or ven-ture capital fund and as foreign if the blockholder (institutional or otherwise)was located in a country different from the cross-listed firm’s home country. Ofthe major exchange firms that cross-listed between 1992 and 2003 and had pre-and post-turnover data, 15% had a new foreign or institutional blockholder. ForLevel 1 (R144a), the percentage of new foreign or institutional blockholders is11% (5%). In tracking changes in the board of directors around cross-listing,we were able to gather data for 101 of the 139 Level 2/3 firms that cross-listedfrom 1992 to 2003 and had pre- and post-turnover data. Of these, 24 (10) hada new outside (foreign) director following the cross-listing.28
Using these data, we conduct a series of robustness tests to examine theinfluence of these potential governance changes that are concurrent with cross-listing. For example, we create indicator variables that equal one if the cross-listing also had one of these potential governance changes and reran our models(both individually and for all events together). In all instances, we find that ourresults are robust. We summarize these results by creating an index in whichthe firm gets an additional point if during the years surrounding cross-listingit was involved in a privatization, M&A event, or change in the ownershipor board of directors. Table VII includes this control variable and reexaminesthe analysis of Table IV, the sensitivity of CEO turnover to firm performancebefore and after cross-listing where we restrict the sample to firms that havea cross-listing of the same type during our sample period. We find that thesepotential governance changes are insignificantly related to turnover, except forexchange-traded firms from Civil Law countries where the coefficient on theindex is negative and significant, a finding that is driven by privatizations.The bottom row of Table VII reports that the mean interaction effect for Level2/3 cross-listings remains negative and significant, which suggests that theseother potential control events do not drive our previous findings.29
B. Exclusion of United Kingdom and Japan
Given that United Kingdom and Japan are the two countries with the greatestnumber of observations in our sample, an obvious concern is that our results
28 Given the disclosure requirements and practices of these non-U.S. firms, board data are gen-erally only available for the major exchange-traded firms (Level 2/3).
29 Adding an interaction on this events index and the lagged earnings ratio in the regressiondoes not alter our findings.

International Cross-Listing 1927T
able
VII
CE
OT
urn
over
and
Cro
ss-L
isti
ng:
Fir
ms
wit
ha
Cro
ss-L
isti
ng
ofth
eS
ame
Typ
ean
dC
oncu
rren
tC
ontr
olC
han
ges
Th
ista
ble
pres
ents
the
prob
ites
tim
ates
ofth
ere
lati
onsh
ipbe
twee
nth
epr
obab
ilit
yof
CE
Otu
rnov
eran
dfi
rmpe
rfor
man
cefo
rfi
rms
that
hav
eor
wil
lh
ave
asi
mil
arty
peof
AD
Rpr
ogra
mdu
rin
gth
esa
mpl
epe
riod
.Th
esa
mpl
ein
colu
mn
s1–
2is
lim
ited
tofi
rms
that
hav
eor
wil
lhav
eli
sted
ona
maj
orU
.S.e
xch
ange
duri
ng
our
sam
ple
peri
od.S
imil
arly
,th
esa
mpl
esin
colu
mn
s3–
4an
d5–
6re
stri
ctth
esa
mpl
eto
firm
sth
atli
ston
the
OT
Cm
arke
tan
dis
sue
priv
ate
plac
emen
tsvi
aR
ule
144a
anyt
ime
duri
ng
our
sam
ple
peri
od,r
espe
ctiv
ely.
Th
eR
elat
edE
ven
tsIn
dex
isth
en
um
ber
ofth
efo
ur
even
tsa
cros
s-li
sted
firm
expe
rien
ces
wit
hin
1ye
arar
oun
dth
eye
arof
cros
s-li
stin
g.T
hes
eev
ents
are
priv
atiz
atio
ns,
M&
Aev
ents
(wh
ere
mor
eth
an50
%of
the
firm
’ssh
ares
are
acqu
ired
),a
new
inst
itu
tion
alor
fore
ign
bloc
khol
der
(mea
sure
dat
the
10%
cuto
ffpo
int)
,or
an
ewin
depe
nde
nt
orfo
reig
ndi
rect
oron
the
boar
dof
dire
ctor
s.T
his
vari
able
ran
ges
betw
een
0an
d4,
wit
h4
bein
gth
em
axim
um
nu
mbe
rof
even
ts.L
agge
dE
arn
ings
Rat
iois
the
1-ye
arla
gged
rati
oof
earn
ings
befo
rein
tere
stan
dta
xes
toto
tal
asse
ts.T
he
Civ
ilL
awsa
mpl
ein
clu
des
firm
slo
cate
din
cou
ntr
ies
wit
ha
Fre
nch
,Ger
man
,or
Sca
ndi
nav
ian
lega
lsys
tem
.Th
eC
omm
onL
awsa
mpl
ere
fers
tofi
rms
loca
ted
inco
un
trie
sw
ith
the
En
glis
hle
galo
rigi
n.T
his
clas
sifi
cati
onof
lega
lre
gim
esis
obta
ined
from
Dja
nko
vet
al.(
2005
).L
evel
2/3
dum
my
is1
ifth
efi
rmh
asa
Lev
el2
orL
evel
3A
DR
prog
ram
,0ot
her
wis
e.L
evel
1du
mm
yis
1if
the
firm
has
aL
evel
1A
DR
prog
ram
,0ot
her
wis
e.R
ule
144A
dum
my
is1
ifth
efi
rmh
asa
Ru
le14
4Ais
suan
ce,0
oth
erw
ise.
Log
Ass
ets
isth
en
atu
rall
ogof
tota
lass
ets
mea
sure
din
mil
lion
$U.S
.Th
eco
nti
nu
ous
vari
able
sar
ew
inso
rize
dat
the
1%le
velf
orea
chco
un
try.
Th
ein
tera
ctio
nef
fect
isde
fin
edas
the
chan
gein
the
pred
icte
dpr
obab
ilit
yof
CE
Otu
rnov
erfo
ra
chan
gein
both
the
firm
perf
orm
ance
and
the
resp
ecti
vecr
oss-
list
eddu
mm
yu
sin
gth
em
eth
odol
ogy
ofN
orto
n,W
ang,
and
Ai(
2004
).T
he
z-st
atis
tics
appe
arin
pare
nth
eses
belo
wpa
ram
eter
esti
mat
es.R
obu
stst
anda
rder
rors
are
esti
mat
edu
sin
gth
eR
oger
sm
eth
odof
clu
ster
ing
byfi
rm.∗
∗∗,∗
∗ ,an
d∗
indi
cate
sign
ific
ance
atth
e1%
,5%
,an
d10
%le
vel,
resp
ecti
vely
.
Exc
han
ge-T
rade
dA
DR
sO
TC
-Tra
ded
AD
Rs
Pri
vate
Pla
cem
ents
Civ
ilC
omm
onC
ivil
Com
mon
Civ
ilC
omm
onL
awL
awL
awL
awL
awL
awV
aria
ble
(1)
(2)
(3)
(4)
(5)
(6)
Rel
ated
even
tsin
dex
−0.3
94∗∗
0.09
00.
089
−0.1
90−0
.418
−0.1
95[−
2.20
0][0
.924
][0
.271
][−
1.20
2][−
1.18
9][−
0.75
8]L
ogas
sets
−0.0
020.
038∗
∗0.
031
0.01
40.
174∗
∗∗0.
236∗
∗∗[−
0.05
9][2
.059
][1
.039
][0
.745
][3
.207
][2
.819
]L
agge
dea
rnin
gsra
tio
2.49
6−0
.172
−0.0
05∗∗
∗−0
.144
−1.1
98−3
.531
[1.3
29]
[−0.
658]
[−4.
932]
[−0.
972]
[−0.
889]
[−0.
808]
L2/
30.
617∗
∗0.
053
––
––
[2.5
40]
[0.4
64]
L2/
3∗L
agge
dea
rnin
gsra
tio
−4.2
67∗∗
0.08
2–
––
–[−
2.22
7][0
.249
]
(con
tin
ued
)

1928 The Journal of Finance
Tab
leV
II—
Con
tin
ued
Exc
han
ge-T
rade
dA
DR
sO
TC
-Tra
ded
AD
Rs
Pri
vate
Pla
cem
ents
Civ
ilC
omm
onC
ivil
Com
mon
Civ
ilC
omm
onL
awL
awL
awL
awL
awL
awV
aria
ble
(1)
(2)
(3)
(4)
(5)
(6)
L1
––
0.23
0∗0.
049
––
[1.7
33]
[0.4
03]
L1
∗lag
ged
earn
ings
rati
o–
–−0
.092
0.21
6–
–[−
0.11
9][0
.573
]R
144A
––
––
0.12
4−0
.765
[0.5
39]
[−1.
439]
R14
4A∗l
agge
dea
rnin
gsra
tio
––
––
0.90
42.
955
[0.5
53]
[0.6
52]
Con
stan
t0.
245
−6.8
77∗∗
∗−0
.016
−6.0
39∗∗
∗4.
634∗
∗∗0.
216
[0.2
41]
[−6.
744]
[−0.
036]
[−12
.339
][4
.147
][0
.158
]C
oun
try
effe
cts
Yes
Yes
Yes
Yes
Yes
Yes
Indu
stry
effe
cts
(tw
o-di
git
SIC
)Ye
sYe
sYe
sYe
sYe
sYe
sYe
aref
fect
sYe
sYe
sYe
sYe
sYe
sYe
sO
bser
vati
ons
594
1,31
960
31,
355
520
336
Pse
udo
-R2
0.19
00.
062
0.17
30.
060
0.24
80.
195
Mea
nin
tera
ctio
nef
fect
−1.0
66∗∗
0.02
1−0
.022
0.05
50.
186
0.84
8[−
2.33
8][0
.646
][−
0.54
9][1
.635
][0
.144
][1
.388
]

International Cross-Listing 1929
may be primarily or completely driven by observations in these countries. PanelA of Table VIII presents results when we omit these observations. We find thatthe mean-corrected interactive effect between L2/3 and lagged Earnings Ratiois negative and significant in low investor protection countries. We continue tofind that the interactions for other cross-listing types are insignificant. Thus,our results are robust to the exclusion of observations from the United Kingdomand Japan.
C. Exclusion of Observations during the Cross-Listing Year
Given managers of cross-listed firms value control (see, for example, Doidgeet al. 2004a), it seems unlikely that managers would choose to cross-list in orderto make their positions more susceptible to termination. Consistent with thishypothesis, recent research by Doidge et al. (2006) shows that firms with highprivate benefits of control are less likely to cross-list on a major U.S. exchange.Doidge (2005) and Ayyagari (2004) find that cross-listed firms continue to haveconcentrated ownership after cross-listing, which suggests that ownership con-centration diffusion after cross-listing is not driving our results. However, thesestudies do find that cross-listed firms often sell control blocks during the listingyear. In order to ensure the turnover we document is not driven by changes incontrol around cross-listing, we reexamine our tests when observations of cross-listed firms in the year of cross-listing are omitted. Similar results obtain. Forexample, Panel B of Table VIII shows that the mean-corrected interactive ef-fect between L2/3 and Lagged Earnings Ratio is negative and significant in lowinvestor protection countries. This panel also shows that the interactions forother cross-listing types are insignificant. Therefore, CEO turnover changes inthe cross-listing year do not explain our results. We also eliminate turnover inthe 2 years surrounding cross-listing and continue to obtain similar results.
D. Relative Industry Performance Measures
Morck, Shleifer, and Vishny (1988), Gibbons and Murphy (1990), and Parrino(1997) suggest that internal monitors use relative industry performance mea-sures to evaluate CEO performance. To examine the robustness of our resultsto this alternative definition of firm performance, we recompute our firm per-formance measures such that industry-adjusted performance is calculated asfirm performance minus the median value of the corresponding two-digit SICglobal industry. Panel C of Table VIII reports results for the industry-adjustedlagged earning ratio. We find that across all models, the corrected interac-tion effect between L2/3 and industry-adjusted firm performance is negativeand statistically significant, while the interactions for OTC and private place-ments remain insignificant. In untabulated results, we find similar results forindustry-adjusted excess stock market returns. The findings indicate that ourresults are robust to this alternative definition of firm performance.

1930 The Journal of Finance
Tab
leV
III
CE
OT
urn
over
and
Cro
ss-L
isti
ng:
Ad
dit
ion
alR
obu
stn
ess
Tes
tsT
his
tabl
epr
esen
tsth
epr
obit
esti
mat
esof
the
rela
tion
ship
betw
een
the
prob
abil
ity
ofC
EO
turn
over
and
firm
perf
orm
ance
un
der
vari
ous
lega
len
viro
nm
ents
.Pan
elA
excl
ude
sob
serv
atio
ns
from
the
Un
ited
Kin
gdom
and
Japa
n,P
anel
Bex
clu
des
obse
rvat
ion
sfr
omth
ecr
oss-
list
ing
sam
ple,
and
Pan
elC
use
san
indu
stry
-adj
ust
edfi
rmpe
rfor
man
cem
easu
re.L
agge
dE
arn
ings
Rat
iois
the
1-ye
arla
gged
rati
oof
earn
ings
befo
rein
tere
stan
dta
xes
toto
tala
sset
s.A
dju
sted
Lag
ged
Ear
nin
gsR
atio
isth
e1-
year
lagg
edra
tio
ofea
rnin
gsbe
fore
inte
rest
and
taxe
sto
tota
lass
ets
min
us
the
med
ian
valu
eof
the
corr
espo
ndi
ng
two-
digi
tS
ICgl
obal
indu
stry
.Th
eC
ivil
Law
sam
ple
incl
ude
sfi
rms
loca
ted
inco
un
trie
sw
ith
aF
ren
ch,G
erm
an,o
rS
can
din
avia
nle
gal
syst
em.
Th
eC
omm
onL
awsa
mpl
ere
fers
tofi
rms
loca
ted
inco
un
trie
sw
ith
the
En
glis
hle
gal
orig
in.
An
ti-d
irec
tor
righ
tsin
dex
mea
sure
sth
ede
gree
ofm
inor
ity
shar
ehol
der
prot
ecti
on.A
nti
-sel
f-de
alin
gis
anin
dex
ofth
est
ren
gth
ofm
inor
ity
shar
ehol
der
prot
ecti
onag
ain
stse
lf-d
eali
ng
byth
eco
ntr
olli
ng
shar
ehol
der.
All
thes
eco
un
try-
leve
lin
dice
sar
eob
tain
edfr
omD
jan
kov
etal
.(20
05).
Th
em
edia
ns
of3.
5fo
ran
ti-d
irec
tor
righ
tsan
d0.
42fo
ran
ti-s
elf-
deal
ing
inde
xu
sed
inD
jan
kov
etal
.(20
05)a
reu
sed
togr
oup
firm
sin
toh
igh
vers
us
low
inve
stor
prot
ecti
onre
gim
es(l
ower
than
oreq
ual
toth
em
edia
nre
fers
tolo
wgo
vern
ance
subs
ampl
es).
Lev
el2/
3du
mm
yis
1if
the
firm
has
aL
evel
2or
Lev
el3
AD
Rpr
ogra
m,0
oth
erw
ise.
Lev
el1
dum
my
is1
ifth
efi
rmh
asa
Lev
el1
AD
Rpr
ogra
m,0
oth
erw
ise.
Ru
le14
4Adu
mm
yis
1if
the
firm
has
aR
ule
144A
issu
ance
,0ot
her
wis
e.L
ogA
sset
sis
the
nat
ura
llog
ofto
tala
sset
sm
easu
red
inm
illi
on$U
.S.T
he
con
tin
uou
sva
riab
les
are
win
sori
zed
atth
e1%
leve
lfor
each
cou
ntr
y.T
he
inte
ract
ion
effe
ctis
defi
ned
asth
ech
ange
inth
epr
edic
ted
prob
abil
ity
ofC
EO
turn
over
for
ach
ange
inbo
thth
efi
rmpe
rfor
man
cean
dth
ere
spec
tive
cros
s-li
sted
dum
my
usi
ng
the
met
hod
olog
yof
Nor
ton
,Wan
g,an
dA
i(2
004)
.Th
ez-
stat
isti
csap
pear
inpa
ren
thes
esbe
low
para
met
eres
tim
ates
.Rob
ust
stan
dard
erro
rsar
ees
tim
ated
usi
ng
the
Rog
ers
met
hod
ofcl
ust
erin
gby
firm
.∗∗∗
indi
cate
ssi
gnif
ican
ceat
the
1%le
vel.
Pan
elA
:Exc
ludi
ng
the
U.K
.an
dJa
pan
Civ
ilC
omm
onL
owA
nti
-H
igh
An
ti-
Low
An
ti-
Hig
hA
nti
-L
awL
awD
irec
tor
Rig
hts
Dir
ecto
rR
igh
tsS
elf
Dea
lin
gS
elf
Dea
lin
gV
aria
ble
(1)
(2)
(3)
(4)
(5)
(6)
Fir
m,c
oun
try,
indu
stry
,yea
rco
ntr
ols
Yes
Yes
Yes
Yes
Yes
Yes
Obs
erva
tion
s23
,717
16,2
4719
,989
19,9
7715
,936
24,0
19P
seu
do-R
20.
048
0.02
40.
055
0.02
60.
031
0.04
3M
ean
inte
ract
ion
effe
ctfo
r−0
.343
∗∗∗
−0.0
04−0
.334
∗∗∗
−0.0
05−0
.328
∗∗∗
−0.0
61L
23∗L
agge
dea
rnin
gsra
tio
[−3.
322]
[−0.
076]
[−3.
206]
[−0.
110]
[−3.
121]
[−1.
240]
Mea
nin
tera
ctio
nef
fect
for
−0.0
590.
094
−0.0
540.
089
−0.0
230.
042
L1
∗Lag
ged
earn
ings
rati
o[−
0.39
5][1
.177
][−
0.33
4][1
.136
][−
0.15
4][0
.517
]M
ean
inte
ract
ion
effe
ctfo
r−0
.157
−0.0
39−0
.152
−0.0
65−0
.121
−0.1
70R
144
∗Lag
ged
earn
ings
rati
o[−
0.97
3][−
0.12
8][−
0.76
5][−
0.35
1][−
0.53
5][−
1.01
2]

International Cross-Listing 1931
Tab
leV
III—
Con
tin
ued
Pan
elB
:Exc
ludi
ng
the
Cro
ss-L
isti
ng
Year
Civ
ilC
omm
onL
owA
nti
-H
igh
An
ti-
Low
An
ti-
Hig
hA
nti
-L
awL
awD
irec
tor
Rig
hts
Dir
ecto
rR
igh
tsS
elf
Dea
lin
gS
elf
Dea
lin
gV
aria
ble
(1)
(2)
(3)
(4)
(5)
(6)
Fir
m,c
oun
try,
indu
stry
,yea
rco
ntr
ols
Yes
Yes
Yes
Yes
Yes
Yes
Obs
erva
tion
s44
,605
26,0
6340
,893
29,7
7715
,865
54,7
87P
seu
do-R
20.
033
0.02
20.
034
0.02
30.
031
0.02
9M
ean
inte
ract
ion
effe
ctfo
r−0
.333
∗∗∗
0.02
3−0
.324
∗∗∗
0.02
2−0
.313
∗∗∗
−0.0
43L
23∗L
agge
dea
rnin
gsra
tio
[−3.
380]
[0.4
91]
[−3.
284]
[0.4
61]
[−3.
026]
[−0.
963]
Mea
nin
tera
ctio
nef
fect
for
−0.1
140.
056
−0.0
970.
051
−0.0
47−0
.014
L1
∗Lag
ged
earn
ings
rati
o[−
0.84
1][0
.742
][−
0.70
6][0
.749
][−
0.30
7][−
0.21
4]M
ean
inte
ract
ion
effe
ctfo
r−0
.189
0.20
5−0
.201
0.07
9−0
.077
−0.0
81R
144
∗Lag
ged
earn
ings
rati
o[−
1.34
1][0
.747
][−
1.14
8][0
.430
][−
0.33
9][−
0.53
5]
Pan
elC
:Rel
ativ
eIn
dust
ryP
erfo
rman
ce
Civ
ilC
omm
onL
owA
nti
-H
igh
An
ti-
Low
An
ti-
Hig
hA
nti
-L
awL
awD
irec
tor
Rig
hts
Dir
ecto
rR
igh
tsS
elf
Dea
lin
gS
elf
Dea
lin
gV
aria
ble
(1)
(2)
(3)
(4)
(5)
(6)
Fir
m,c
oun
try,
indu
stry
,yea
rco
ntr
ols
Yes
Yes
Yes
Yes
Yes
Yes
Obs
erva
tion
s43
,974
26,2
4040
,327
29,8
8715
,466
54,7
48P
seu
do-R
20.
030
0.01
50.
031
0.01
60.
024
0.02
4M
ean
inte
ract
ion
effe
ctfo
r−0
.395
∗∗∗
0.01
9−0
.386
∗∗∗
0.01
5−0
.378
∗∗∗
−0.0
52L
23∗A
dju
sted
lagg
edea
rnin
gsra
tio
[−3.
700]
[0.3
81]
[−3.
621]
[0.3
15]
[−3.
443]
[−1.
110]
Mea
nin
tera
ctio
nef
fect
for
−0.1
010.
062
−0.0
960.
060
0.00
2−0
.016
L1
∗Ad
just
edla
gged
earn
ings
rati
o[−
0.74
7][0
.755
][−
0.68
2][0
.741
][0
.015
][−
0.20
8]M
ean
inte
ract
ion
effe
ctfo
r−0
.167
0.16
2−0
.191
0.10
1−0
.131
−0.0
66R
144
∗Ad
just
edla
gged
earn
ings
rati
o[−
1.00
6][0
.586
][−
0.92
3][0
.549
][−
0.50
7][−
0.40
5]

1932 The Journal of Finance
E. Exclusion of Firms with Large Blockholders
The corporate governance effects of large blockholders have been well doc-umented in the literature (see, e.g., La Porta, Lopez-De-Silanes, and Shleifer(LLS) (1999)). Large blockholders could have a negative effect on corporategovernance if they are aligned with management in nonvalue maximizing ac-tivities and insulate managers from being replaced. Gibson (2003) finds thatthe link between performance and top management turnover is weaker inemerging market firms with a large domestic shareholder. Further, Doidgeet al. (2006) find that the control rights held by the largest blockholder arehigher for firms not cross-listed on a U.S. exchange. This raises the possibilitythat the relation between CEO turnover and performance may be impacted bythe relative influence of large blockholders in cross-listed and non-cross-listedfirms.
To investigate the role of large shareholders in our results, we collect datafrom Worldscope on the percentage of shares held by large shareholders(closely held shares) and exclude observations with large shareholders. Wefollow DeFond and Hung (2004) and exclude observations for which block-holders have direct holdings greater than 20%.30 The results of this test (un-tabulated) indicate that our previous results remain qualitatively unchanged.Further, we also obtain similar results when the percentage of closely heldshares is employed as a control variable in our full sample regressions.Therefore, our results continue to hold after excluding the influence of largeblockholders.
F. Excluding Financial and Regulated Firms
In our previous analysis, we examine the broadest possible sample of firmsand include them as part of our controls industry dummies. We are motivatedby the fact that across countries, the set of industries and firms that are con-trolled by government regulation are likely to differ substantially. However, toensure that our results are not being driven by the inclusion of financial andregulated firms, we omit firms with two-digit SIC codes of 60–69, 48, and 49.In untabulated results, we find that the results are robust to the exclusion ofthese firms.
G. Excluding the Asian Financial Crisis Period
To ensure our findings are not dependent on the inclusion of the firm-yearssurrounding the Asian financial crisis, we reestimate our models excludingvarious windows of observations surrounding the event, including: (1) 1997and 1998, (2) 1996, 1997, and 1998, and (3) 1996, 1997, 1998, and 1999. Inuntabulated results, we find that our results are robust to the exclusion of
30 Because of data availability, we are not able to measure indirect ownership acquired alongownership chains.
International Cross-Listing 1933
these years. We also estimate our models excluding years 2002 and 2003 togauge the effect of Sarbanes–Oxley on our results. Our results are robust toexcluding these observations.
H. Excluding Small Firms
While all our regressions control for firm size, we also conduct our tests inwhich we omit smaller firms and obtain similar results. For example, if weeliminate firms with total assets less than 15 million U.S. dollars, we obtainsimilar results for the interaction between L2/3 and lagged earnings ratio inModels 1 and 2 of Table III (Civil and Common Law).
VI. Conclusions
Despite the large number of studies examining the costs and benefits of cross-listing in the United States, the effectiveness of a U.S. cross-listing as a bondingmechanism is under debate as it is often difficult to distinguish among the var-ious theories for international cross-listings. In this paper, we argue that ifcross-listing in the United States improves investor protection, then we shouldbe able to detect outcomes that are consistent with improved corporate gover-nance. We test our hypotheses by examining the relative propensity for cross-listed firms to terminate poorly performing CEOs. We construct a database ofover 70,000 firm-year observations from 47 countries and find that cross-listedfirms are more likely to shed poorly performing CEOs than non-cross-listedfirms. Further, we find that this effect is concentrated in cross-listings on ma-jor U.S. exchanges with the strongest investor protections, rather than OTC,private placement, or London listings. Finally, we find that the difference be-tween cross-listed and non-cross-listed firms in CEO turnover sensitivity tofirm performance is greatest in the countries with the weakest investor pro-tections. Taken together, our results provide support for the major tenets ofthe bonding hypothesis and for the ability of cross-listings to improve globalcorporate governance.
Appendix: Titles Used to Identify the Top Manager in Additionto Chief Executive Officer
This table presents the top manager title for each country in the sample otherthan “CEO,” “Chief Executive Officer,” and “Chief Executive.” When available,we use the top manager titles used by DeFond and Hung (2004) and Gibson(2003) to identify the top manager. For the remaining countries, we use pressaccounts and country experts’ opinions, and we also visually inspect executivetitles of firms in each country to determine the top manager title. We excludethe top manager titles that contain deputy, vice, or assistant. † refers to the topmanager title classification in either DeFond and Hung (2004) or Gibson (2003).

1934 The Journal of Finance
Country Top Manager Title
Argentina PresidentAustralia Managing director†Austria Chairman, board of management†Belgium Managing director†Brazil President†Canada None†Chile General manager†China General managerColombia General managerCzech Republic Managing directorDenmark Managing director†Finland Managing director†France None†Germany Chairman, board of management†Greece Managing director†Hong Kong Managing director†Hungary Managing directorIndia Managing director†Indonesia President director†Ireland Managing directorIsrael PresidentItaly Managing director†Japan President†Korea President†Luxembourg NoneMalaysia Managing director†Mexico President†Netherlands Chairman, board of management†New Zealand Managing directorNorway President†Pakistan Managing director†Peru General managerPhilippines President†Poland PresidentPortugal President†Singapore Managing director†South Africa Managing director†Spain Managing director†Sri Lanka Managing directorSweden Managing director†Switzerland PresidentTaiwan President†Thailand President†Turkey General manager†United Kingdom Managing director†United States None†Venezuela PresidentZimbabwe Managing director

International Cross-Listing 1935
REFERENCESAi, Chunrong, and Edward Norton, 2003, Interaction terms in logit and probit models, Economics
Letters 80, 123–129.Ayyagari, Meghana, 2004, Does cross-listing lead to functional convergence? Empirical evidence,
World Bank Policy Research Working Paper No. 3264.Bailey, Warren, Andrew Karolyi, and Carolina Salva, 2006, The economic consequences of increased
disclosure: Evidence from international cross-listings, Journal of Financial Economics 81, 175–213.
Baker, Kent, John Nofsinger, and Daniel Weaver, 2002, International cross-listing and visibility,Journal of Financial and Quantitative Analysis 37, 495–521.
Beck, Thorsten, and Ross Levine, 2004, Stock markets, banks, and growth: Panel evidence, Journalof Banking and Finance 28, 423–442.
Benos, Evangelos, and Michael Weisbach, 2004, Private benefits and cross-listings in the UnitedStates, Emerging Markets Review 5, 217–240.
Bryan, Stephen, Robert Nash, and Ajay Patel, 2005, The equity mix in executive compensation: Aninvestigation of cross-country differences, Working paper, Wake Forest University.
Bushman, Robert, Joseph Piotroski, and Abbie Smith, 2004, What determines corporate trans-parency? Journal of Accounting Research 42, 207–252.
Coffee, John, 1999, The future as history: The prospects for global convergence in corporate gover-nance and its implications, Northwestern University Law Review 93, 641–708.
Coffee, John, 2002, Racing towards the top? The impact of cross-listings and stock market compe-tition on international corporate governance, Working paper, Columbia University.
Dahya, Jay, John McConnell, and Nickolaos Travlos, 2002, The Cadbury committee, corporateperformance, and top management turnover, Journal of Finance 57, 461–483.
Dasgupta, Sudipto, Jie Gan, and Gao Ning, 2005, Lumpy information disclosure and stock returnsynchronicity: Evidence from ADR listings, HKUST working paper.
Defond, Mark, and Mingyi Hung, 2004, Investor protection and corporate governance: Evidencefrom worldwide CEO turnover, Journal of Accounting Research 42, 269–312.
Djankov, Simeon, Rafael La Porta, Florencio Lopez-de-Silanes, and Andrei Shleifer, 2005, The lawand economics of self-dealing, Journal of Financial Economics, forthcoming.
Doidge, Craig, 2004, U.S. cross-listings and the private benefits of control: Evidence from dual-classfirms, Journal of Financial Economics 72, 519–553.
Doidge, Craig, 2005, What is the effect of cross-listing on corporate ownership and control? Workingpaper, University of Toronto.
Doidge, Craig, Andrew Karolyi, Karl Lins, Darius Miller, and Rene Stulz, 2006, Private benefits ofcontrol, ownership, and the cross-listing decision, ECGI - Finance Working Paper No. 77/2005and Dice Center Working Paper No. 2005-2.
Doidge, Craig, Andrew Karolyi, and Rene Stulz, 2004a, Why are foreign firms listed in the U.S.worth more? Journal of Financial Economics 71, 205–238.
Doidge, Craig, Andrew Karolyi, and Rene Stulz, 2004b, Why do countries matter so much forcorporate governance? ECGI - Finance Working Paper No. 50/2004.
Errunza, Vihang, and Darius Miller, 2000, Market segmentation and the cost of capital in inter-national equity markets, Journal of Financial and Quantitative Analysis 35, 577–600.
Fernandes, Nuno, and Miguel Ferreira, 2006, Does international cross-listing really improve theinformation environment? Working paper, ISCTE Business School.
Foerster, Stephen, and Andrew Karolyi, 1999, The effects of market segmentation and investorrecognition on asset prices: Evidence from foreign stocks listing in the United States, Journalof Finance 54, 981–1013.
Gibbons, Robert, and Kevin Murphy, 1990, Relative performance evaluation for chief executiveofficers, Industrial and Labor Relations Review 43, 30–51.
Gibson, Michael, 2003, Is corporate governance ineffective in emerging markets? Journal of Finan-cial and Quantitative Analysis 38, 231–250.
Hadlock, Charles, and Gerald Lumer, 1997, Compensation, turnover, and top management incen-tives: Historical evidence, Journal of Business 70, 153–188.

1936 The Journal of Finance
Hail, Luzi, and Christian Leuz, 2004, Cost of capital and cash flow effects of U.S. cross-listings,ECGI - Finance Working Paper No. 46/2004.
Harvey, Campbell R., 1995, Predictable risk and returns in emerging markets, Review of FinancialStudies 8, 773–816.
Hermalin, Benjamin, and Michael Weisbach, 2003, Boards of directors as an endogenously deter-mined institution: A survey of the economic literature, Economic Policy Review 9, 7–26.
Huson, Mark R., Robert Parrino, and Laura T. Starks, 2001, Internal monitoring mechanisms andCEO turnover: A long-term perspective, Journal of Finance 56, 2265–2297.
Kang, Jun-Koo, and Anil Shivdasani, 1995, Firm performance, corporate governance, and top ex-ecutive turnover in Japan, Journal of Financial Economics 38, 29–58.
Kaplan, Steven, 1994, Top executives, turnover, and firm performance in Germany, Journal of LawEconomics and Organization 10, 142–159.
Kaplan, Steven, and Bernadette Minton. 1994, Appointments of outsiders to Japanese boards:Determinants and implications for managers, Journal of Financial Economics 36, 225–258.
Karolyi, Andrew, 1998, Why Do Companies List Their Shares Abroad? A Survey of the Evidence andIts Managerial Implications (Salomon Brothers Monograph Series 7, New York University).
Karolyi, Andrew, 2006, The world of cross-listings and cross-listings of the world: Challengingconventional wisdom, Review of Finance 10, 99–152.
La Porta, Rafael, Florencio Lopez-De-Silanes, and Andrei Shleifer, 1999, Corporate ownershiparound the world, Journal of Finance 54, 471–518.
La Porta, Rafael, Florencio Lopez-De-Silanes, and Andrei Shleifer, 2006, What works in securitieslaws? Journal of Finance 61, 1–32.
La Porta, Rafael, Florencio Lopez-De-Silanes, Andrei Shleifer, and Robert Vishny, 1997, Legaldeterminants of external finance, Journal of Finance 52, 1131–1150.
La Porta, Rafael, Florencio Lopez-De-Silanes, Andrei Shleifer, and Robert Vishny, 1998, Law andfinance, Journal of Political Economy 106, 1113–1155.
La Porta, Rafael, Florencio Lopez-De-Silanes, Andrei Shleifer, and Robert Vishny, 2000, Investorprotection and corporate governance, Journal of Financial Economics 58, 3–27.
Lang, Mark, Karl Lins, and Darius Miller, 2003, ADRs, analysts, and accuracy: Does cross listingin the United States improve a firm’s information environment and increase market value?Journal of Accounting Research 41, 317–345.
Lang, Mark, Karl Lins, and Darius Miller, 2004, Concentrated control, analyst following, andvaluation: Do analysts matter most when investors are protected least? Journal of AccountingResearch 42, 589–623.
Lang, Mark, Jana Smith Raedy, and Wendy Wilson, 2006, Earnings management and cross listing:Are reconciled earnings comparable to U.S. earnings? Journal of Accounting and Economics42, 255–283.
Lesmond, David, 2005, Liquidity of emerging markets, Journal of Financial Economics 77, 411–452.
Leuz, Christian, 2006, Cross listing, bonding, and firms’ reporting incentives: A discussion of Lang,Raedy, and Wilson, Journal of Accounting and Economics 42, 285–299.
Lins, Karl, Deon Strickland, and Marc Zenner, 2005, Do non-U.S. firms issue equity on U.S. stockexchanges to relax capital constraints? Journal of Financial and Quantitative Analysis 40,109–134.
Megginson, William, and Jeffry Netter, 2001, From state to market: A survey of empirical studieson privatization, Journal of Economic Literature 39, 321–389.
Mikkelson, Wayne, and Megan Partch, 1997, The decline of takeovers and disciplinary managerialturnover, Journal of Financial Economics 44, 205–239.
Miller, Darius, 1999, The market reaction to international cross-listings: Evidence from depositaryreceipts, Journal of Financial Economics 51, 103–123.
Mitton, Todd, 2002, A cross-firm analysis of the impact of corporate governance on the East Asianfinancial crisis, Journal of Financial Economics 64, 215–241.
Morck, Randall, Andrei Shleifer, and Robert Vishny, 1988, Management ownership and marketvaluation: An empirical analysis, Journal of Financial Economics 20, 293–315.

International Cross-Listing 1937
Murphy, Kevin, 1999, Executive compensation, in O. Ashenfelter, and D. Card, eds.: Handbook ofLabor Economics (Amsterdam, North Holland).
Norton, Edward, Hua Wang, and Chunrong Ai, 2004, Computing interaction effects and standarderrors in logit and probit models, Stata Journal 4, 103–116.
Pagano, Marco, and Paolo F. Volpin, 2005, The political economy of corporate governance, AmericanEconomic Review 95, 1005–1030.
Parrino, Robert, 1997, CEO turnover and outside succession: A cross-sectional analysis, Journalof Financial Economics 46, 165–197.
Powers, Eric, 2005, Interpreting logit regressions with interaction terms: An application to themanagement turnover literature, Journal of Corporate Finance 11, 504–522.
Reese, William, and Michael Weisbach, 2002, Protection of minority shareholder interests, cross-listings in the United States, and subsequent equity offerings, Journal of Financial Economics66, 65–104.
Sarkissian, Sergei, and Michael Schill, 2006, Are there permanent valuation gains to overseaslisting? Review of Financial Studies, forthcoming.
Seetharaman, Ananth, Ferdinand Gul, and Stephen Lynn, 2002, Litigation risk and audit fees:Evidence from U.K. firms cross-listed on U.S. markets, Journal of Accounting and Economics33, 91–115.
Shleifer, Andrei, and Robert Vishny, 1989, Management entrenchment: The case of manager-specific investment, Journal of Financial Economics 25, 123–140.
Shleifer, Andrei, and Robert Vishny, 1997, A survey of corporate governance, Journal of Finance52, 737–783.
Siegel, Jordan, 2005, Can foreign firms bond themselves effectively by submitting to U.S. law?Journal of Financial Economics 75, 319–359.
Spamann, Holger, 2006, On the insignificance and/or endogeneity of La Porta et al.’s “anti-directorrights index” under consistent coding, Harvard Law School John M. Olin Center DiscussionPaper No. 7.
Stulz, Rene, 1999, Globalization, corporate finance, and the cost of capital, Journal of AppliedCorporate Finance 26, 3–28.
Volpin, Paolo, 2002, Governance with poor investment protection: Evidence from top executiveturnover in Italy, Journal of Financial Economics 64, 61–91.
Weisbach, Michael, 1988, Outside directors and CEO turnover, Journal of Financial Economics 20,431–460.