international crime rates - office of justice programs
TRANSCRIPT

u. S. Department of Justice
Bureau of Justice Statistic~
~ International Crime Rats by Carol B. Kalish
BJS Analyst
Based upon data on crimes reported to la w enforcement authorities collected by the United Nations (UN) and the International Police Organization (Interpol) and upon data from the World Health Organization (WHO), the rate of violent crime in the United States is several times higher than in other countries for which information is available. The rate of property crime in the United States is also higher than in the majority of these countries.
Crimes of violence (homicide, rape, and robbery) are 4-9 times more frequent in the United States than they are in Europe; crimes of theft (burglary, theft, and auto theft) are also more frequent, but not to the same degree. However, between 1980 and 1984 the difference between U.S. crime rates and rates for other countries narrowed because U.S. crime rates decreased while rates for other countries generally increased.
This study was originally intended to include the 20 countries of the world with populations of 50 million or more; all other countries in North America, South America, and Europe; and Australia and New Zealand--a total of 62 countries. Only 41 countries in these categories provided data to at least 1 of the 3 international organizations that collect information on crime.
The study focused on the crimes of homicide, rape, robbery, burglary, theft, and auto theft because these crimes are most likely to be understood and defined in the same general way from country to country. The UN provided statistics on homicide, rape, robbery, and theft (including burglary and auto theft); Interpol, on homicide, rape, robbery, burglary, and auto theft; and WHO, on homicide.
May 1988
This Special Report is the second in a series of publications on international criminal justice statistics and cross-national comparisons. The report brings together all of the international statistical series on crime rates from 1980 to 1984 for a large number of countries. This is the first time these data have been collected into one document, and we hope that it will be of assistance to cri minal justice professionals and researchers.
This report assesses the available international statistical series in terms of their completeness, comparability, and accuracy. It also compares U.S. crime rates with those of other countries. The overall higher rates for the United States, especially for crimes of violence, warrant further investigaiion.
The resul ts of this report suggest that much needs to be done to improve the quality of international crime statistics. A great deal, however, can be accomplished with a modest investment of effort. The consequent improvements in our ability to
! compare crime rates among nations will be well worth that investment.
I Steven R. Schlesinger Director I
I L ___________ _ i ~
Cri me rates from country to country are difficult to compare because of differences in criminal justice systems, in definitions of crime, in crime reporting practices and recordkeeping, and in methods of reporting statistics to international agencies. Two techniques were used to reduce some of the ef-
fects of this variability. First, more than one data source was used whenever possible. Second, for purposes of direct comparison with the United :::ilates, all European countries in each data set were averaged together, and a second group--Canada, Australia, and New Zeaiand--were also averaged when data were reported for at least two of these countries.
Overall comparisons
U.S. crime rates for the three violent ('ri mes studied were several times higher than the averages for reporting European countries. The U.S. homicide rate per 100,000 persons in the population ranged from 10.5 (WHO 1980) to 7.9 (Interpol 1984); the rate of homicide in Europe from all 3 sources was less than 2 per 100,000 (table 1).
The U.S. crime rate for rape was around 36 per 100,000, roughly 7 times higher than the average for Europe. Each data source showed U.S. crime rates for robbery at more than 200 per 100,000, compared to European rates of less than 50 per 100,000.
For the crimes of theft and auto theft the ratio of U.S. rates to average European rates was roughly 2 to 1. Burglary was the only crime examined for which U.S. rates were less than double those for European countries.
The U.S. rates for violent crime were also higher than those of the second group (Canada, Australia, and New Zealand), but the differences were smaller, compared to Europe. For burglary and auto theft the rates were quite similar. In fact, 1984 Interpol data show a burglary rate for the combined group that is about 40% higher than the U.S. rate.

t'Wbe"! wiilM5.S5?? HA. M
-Table 1. Summary data on International crime rates
Number of crimes Eer 100,000 EOEulatlon
United Crime and data series States
Homicide (excluding attempts) WHO 1980 10.5 UN 1980 10.1 Interpol 1980 10.0 Interpol 1984 7.9
Rape UN 1980 36.0 Interpol 1980 36.0 Interpol 1984 35.7
Robbcry UN 1980 240.9 Interpol 1980 244.0 Interpol 19134 205.4
Burglary Interpol 1980 1,669.0 Interpol 1984 1,263.7
Theft UN 1980 5,262.2
Auto theft Interpol 1980 495.0 Interpol 1984 437.1
liRates represent averages for reporting c'Duntries; Interpol data for 1980 and 1984 are not directly comparable since identical sets of countries did not report for both bears; see tables 8 through 12.
Does not include Australia. cOoes not Include Canada. dOoes not include New Zealand.
Between 1980 and 1984 the crime rate in the United \,tates dropped for each crime studied except rape (table 2). The decreases were sizable, ranging from 12% for auto ti1!~ft to 24% for burglary. In contrast, the average crime rates for Europe and for Canada, Australia, and New Zealand increased for all crimes except homicide, for which there were insufficient data to make reliable comparisons. In most cases the increases experienced by European countries and by Canada, Australia, and New Zealand were larger than the decreases in the United States. These countertrends significantly reduced the differences be-
Canada,
Europea Australia, and NeVI Zealanda
1.4 1.5 1.3 ... 1.8 2.3
b 1.5 2.2
5.0 ... 4.2 10.5 5.4 14.1c
25.4 ... 38.4 56.4 49.1 63.8
893.1 1,498.4 1,055.3 1,806.0
2,086.8 ... 233.8 418.0~ 221.8 444.8
Sources: World Health Organization, World Health Statistics Annual, vols. 1982-86; Interpol, International Crime Statistics, vols. 1979-80, 1981-82, 1983-84; United Nations, Second United Nations Crime Survey; U.S. Census Bureau, Statistical Abstract of the United States, 1987.
tween the crime rates of the United States and those of the other countries.
Comparisons with individual countries
In comparing homicide rates of individual countries with that of the United States, WHO is the best source because its data are based on an actual count of deceased persons. Homicide rates for the countries in the study reporting to WHO ranged from .7 per 100,000 to 25.1 per 100,000 (table 3). The U.S. rate of 10.5 per 100,000 was the second highest reported. Twothirds of the countries had rates under 2 per 100,000. Central and South
Table 2. Trends In intemational crime rates, 1981i-84: Interpol data
Percent change in crime rates, 1980-84
Canada, United Austral ia, and
Crime States Europe New Zealand
Homicide -2196 ... ... (excluding attempts)
6396a Rape 0 1996 Robbery -16 50 13 Burglary -24 40 21b Auto theft -12 13 6
Note: Data for Europe and for ••• Not available; too few countries reporting Canada/ Australia/New Zealand Include only for both 1980 and 1984. countries reporting data for both 1980 and aDoes not include Canada. 1984. Percent change was calculated by bDoes not include New Zealand. computing the average rate for each year and then comparing the yearly averages.
2
'I
Table 3. Homicide In selected countries, rates for 1980: World Health Organization data
Number of actual Mmicides per
Country 100,000 population -.
United Stutes 10.5
Australia 1.2 Austria 1.2 Canada 2.1 Chile 2.6 Costa Rica 5.8
Czechoslovakia 1.1-Denmark 1.3 Ecuador 6.0" Egypt .9 England and Wales .8
Finland 3.3 France 1.0 Germany (FRG) 1.2 Greece .7 Hungary 2.6
Ireland .7 Italy 1.9'" Japan 1.0 Luxembourg 1.9 Netherlands .8
New Zealand 1.3 Norway 1.1 Panama 2.2 Portugal 1.3 Scotland 1.6
Spain 1.0 Sweden 1.2 Thailand 25.1 Venezuela 9.7" Yugoslavia 1.7
'"1981 data. Source: World Health Organization, World Health Statistics Annual, vols. 1982-86.
American countries seemed to have somewhat higher rates than other countries, but so few reported that this may not be representative of the whole region.
The most recent information available on international crime rates is the 1984 Interpol data (table 4). Thirty-two countries reported to Interpol for 1984, but not every country reported ev-ery crime. The U.S. rates reflect the downward trend in crime that occurred here during the first part of the 1980's. Even so, the United States had rates substantially higher than the other countries for the crimes of homicide, rape, and robbery.
Although it is at the high end of the range for auto theft, the United States does not have the highest rate; the U.S. rate for burglary is approximately in the middle of the range.
For each crime except burglary, more than half the countries reporting had crime rates that were less than half those of the United States.

J A'.
T8ble 4. Crime I'8tes in selected cou..,trles, 19M: Interpol data
Number of crimes Qer 100,000 QOQulation
Homicides Including
Country Actual attempts Rape Robbery Burglary Auto theft
United States 7.9 ... 35.7 205.4 1,263.7 437.1
Australia ... 3.4 13.8 83.6 1,754.3 584.7 Austria 1.3 2.4 5.3 29.8 B05.8 16.9 Belgium ... 3.3 5.6 50.0 ... 140.6 Canada 2.7 6.3 ... 92.8 1,420.6 304.9 Chile 5.8 6.3 10.6 36.4 ... 7.6
Colombia ... 2.5 4.4 32.8 ... 14.2 Denmark 1.2 5.8 7.7 35.6 2,230.2 469.5 Ecuador ... 4.5 5.9 22.8 . .. 7.8 Egypt 1.0 1.5
2'.'7 a .4
1,639':';a 3.3
England and Wales 1.1a 1.4a 44.6a 656.6a
Finland 2.3 5.6 6.5 33.7 772.6 171.7 France ... 4.6 5.2 105.6 809.8 483.4 Germany (FRG) 1.5 4.5 9.7 45.8 1,554.1 118.0 Greece 1.0 1.8 .9 2.3 72.8 ... Hungary 1.9 3.7 6.1 15.5 211.0 4.0
Indonesia '" .9 1.2 5.1 38.4 4.9 Ireland .8 1.1 2.0 5.4 1,056.8 29.7 Italy 2.18 5.38 1.88 35.7a
'" 276.3 Japan .8 1.5 1.6 1.8 231.2 29.4 Luxembourg ... 5.3 2.8 40.8 50e.8 109.3
Monaco '" ... ... 43.2 500.0 176.3 Netherlands 1.2 ... 7.2 52.9 2,328.7 155.9 New Zealand 1.7 2.5 14.4 14.9 2,243.1 ... Nigeria 1.5a 1.78
119'::i8 1,360:'';8 106':28 Northern Ireland 4.0a 19.8a 5.08
Norway ... .9a 4.2a ... . .. 273.1a
Philippines '" 42.5 2.6 33.0 ... 2.0 Portugal 3.0 4.6 2.0 21.6 99.7 61.3 I Scotland ... 1.4 4.4 86.9 2,178.6 632.7 Spain ... 2.2 3.6 147.3 1,069.9 -278.2
Sweden 1.4 5.7 11.9 44.1 1,708.8 460.0b Switzerland 1.1 2.2 5.8 24.2 276.8
Thailand '" 16.6 5.3 10.0 8.7 2.0 Venezuela ... 9.9 17.4 161.0 '" 85.9
... Not available. bAuto theft in Switzerland omitted because it Source: Interpol, International Crime a1983 data.
Interpol and the UN are the only 1 international organizations that collect i annual crime statistics from a large ;;number of countries. Data are col~lected by the police in member na-~ tions. (In the United States such data 9 are provided by the FBI's Uniform f Crime Reports.) WHO, although it is ,; not an agency with a direct interest ~in crime, collects annual data on causes gof death, including homicide, from pub)lic health agencies. The use of WHO ~data permits the comparison of homi~cide rates from three different sources. 1 ~ Interpol crime data are collected an-1nually but published biennially. The ~most recently published data are for i1984. Interpol has a membership of 145 icountries, but during the 1980-84 period ;no more than 85 countries reported hheir crime statistics in any single year.
* ;r 1-~ . .:'
includes bicyc:les. Statistics, vols. 1983-84.
The UN crime survey was conducted in 1983 and collected information for 1975-80 from 50 of the 154 member nations. (Another UN survey, which will be conducted this year, will collect data on the 1980-86 period.) The survey asked questions about all sectors of the criminal justice system and about crime control, as well as about the level of crime. The UN survey combines theft, burglary, and auto theft into a single category.
The advantage of comparing crime rates from different international data sources is that this provides a way elf checking the reliability of reported crime rates. Many countries, however, reported to none or at most to one of the series. In general, relatively small countries were more likely to report to Interpol, the UN, and WHO than larger ones, and socialist countries were less likely to report than nonsocialist countries.
3
Although the United Kingdom has been counted as one country in terms of c.)untry coverage, the differing criminal justice systems in England and Wales, in Scotland, and in North-ern Ireland necessitate separate reporting of crime rates.
~finitional problems in comparing crime rates among nations
One of the greatest difficulties in making international comparisons of crime rates is the different crime definitions that are used both among different nations and among the available data sources. For international comparisons of crime rates to have validity, however, it is essential for crime definitions to be similar.
Most countries collect crime statistics in categories that reflect their legal code and their cultural mores.
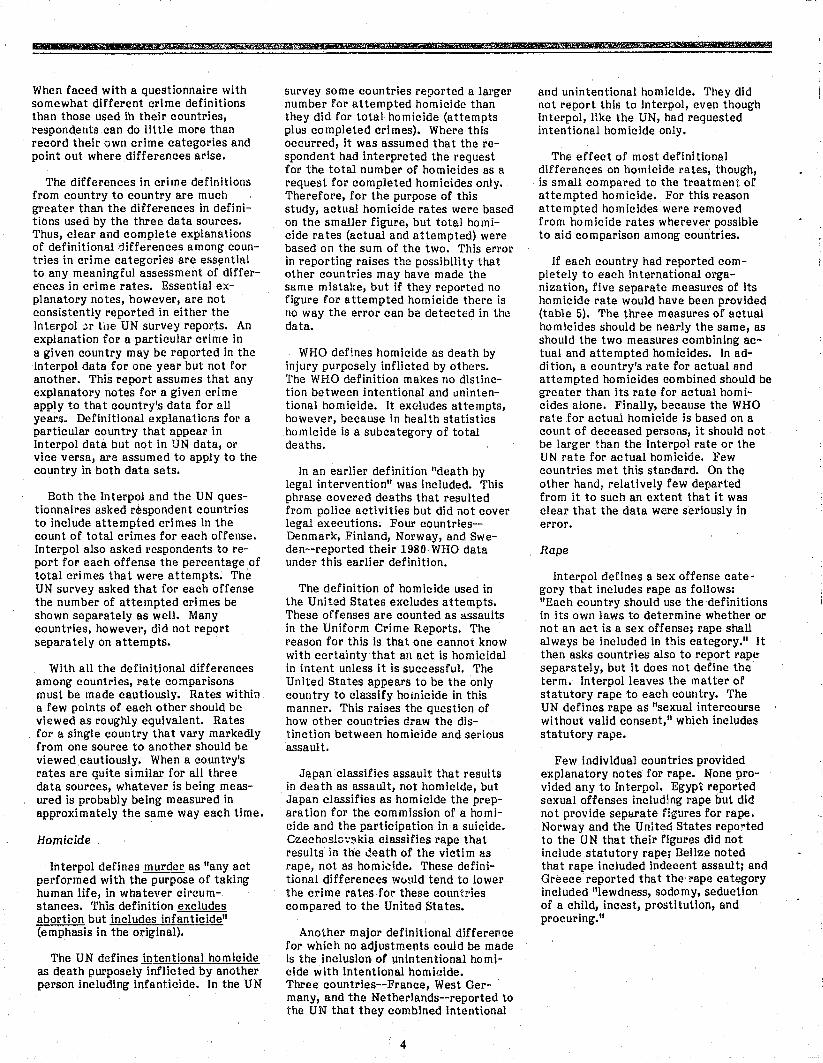
When faced with a questionnaire with somewhat different crime definitions than those used in their countries, respondents can do little more than record their own crime categories and point out where differences arise.
The differences in crime definitions from country to country are much greater than the differences in definitions used by the three data sources. Thus, clear and complete explanations of definitional differences among countries in crime categories are essential to any meaningful assessment of differences in crime rates. Essential explanatory notes, however, are not consistently reported in either the Interpol ".l-r ti1e UN survey reports. An explanation for a particular crime in a given country may be reported in the Interpol data for one year but not for another. This report assumes that any explanatory notes for a given crime apply to that country's data for all years. Definitional explanations for a particular country that appear in Interpol data but not in UN data, or vice versa, are assumed to apply to the country in both data sets.
Both the Interpol and the UN questionnaires asked respondent countries to include attempted crimes in the count of total crimes for each offense. Interpol also asked respondents to report for each offense the percentage of total crimes that were attempts. The UN survey asked that for each offense the number of attempted crimes be shown separately as well. Many countries, however, did not report separately on attempts.
With all the definitional differences among countries, rate comparisons must be made cautiously. Rates within a few points of each other should be viewed as roughly equivalent. Rates for a single country that vary markedly from one source to another should be viewed cautiously. When a country's rates are Quite similar for all three da ta sourc'~s, whatever is being measured is probably being measured in approximately the same way each time.
Homicide
Interpol defines murder as "any act performed with the purpose of taking human life, in whatever circumstances. 'fhis definition excludes abortion but includes infanticide" (emphasis in the original).
The UN defines intentional homicide as death purposely inflicted by another person including infanticide. In the UN
ht #AtNtll
survey some countries reQorted a larger number for attempted homicide than they did for total homicide (attempts plus completed crimes). Where this occurred, it was assumed that the respondent had interpreted the request for the total number of homicides as a request for completed homicides only. Therefore, for the purpose of this study, actual homicide rates were based on the smaller figure, but total homicide rates (actual and attempted) were based on the sum of the two. This error in reporting raises the possibility that other countries may have made the same mistake, but if they reported no figure for attempted homicide there is no way the error can be detected in the data.
WHO defines homicide as death by injury purposely inflicted by others. The WHO definition makes no distinction between intentional and unintentional homicide. It excludes attempts, however, because in health statistics homicide is a subcategory of total deaths.
In an earlier definition "death by legal intervention" was included. This phrase covered deaths that resulted from police activities but did not cover legal executions. Four countrIes-Denmark, Finland, Norway, and Sweden--reported their 1980 WHO data under this earlier definition.
The definition of homicide used in the United States excludes attempts. These offenses are counted as assaults in the Uniform Crime Reports. The reason for this is that one cannot know with certainty that an act is homicidal in intent unless it is successful. The United States appears to be the only country to classify homicide in this manner. 'I'his raises the question of how other countries draw the distinction between homicide and serious assault.
Japan classifies assault that results in death as assault, not homicide, but Japan classifies as homicide the preparation for the commission of a homicide and the participation in a suicide. Czechoslc;"kia classifies rape that results in the death of the victim as rape, not as homi.-:ide. These definitional differences w()~tld tend to lower the crime ratfls for these countries compared to the United States.
Another major definitional difference for which no adjustments could be made is the inclusion of unintentional homicide with intentional homicide. Three countries--France, West Germany, and the Netherlands--reported to the UN that they combined intentional
4
'*'is fEE?
and unintentional homicide. They did not report this to Interpol, even though Interpol, like the UN, had requested intentional homicide only.
The effect of most definitional differences on homicide rates, though, is small compared to the treatment of attempted homicide. For this reason attempted homicides were removed from homicide rates wherever possible to aid comparison among countries.
If each country had reported completely to each international organization, five separate measures of its homicide rate would have been provided (table 5). The three measures of actual homicides should be nearly the same, as should the two measures combining actual and attempted homicides. In addition, a country's rate for actual and attempted homicides combined should be greater than its rate for actual homicides alone. Finally, because the WHO rate for actual homicide is based on a count of deceased persons, it should not be larger than the Interpol rate or the UN rate for actual homicide. Few countries met this standard. On the other hand, relatively few departed from it to such an extent that it was clear that the data were seriously in error.
Rape
Interpol defines a sex offense category that includes rape as follows: "Each country should use the definitions in its own laws to determine whether or not an act is a sex offense; rape shall always be included in this category." It then asks countries also to report rap!! separately, but it does not define the term. Interpol leaves the matter of statutory rape to each country. The UN defines rape as "sexual intercourse without valid consent," which includes statutory rape.
Few individual countries provided explanatory notes for rape. None provided any to Interpol. Egypt reported sexual offenses including rape but did not provide separate figures for rape. Norway and the United States repo!'ted to the UN that their figures did not include statutory rape; Belize noted that rape included indecent assault; and Greece reported that the rape category included "lewdness, sodomy, seduction of a child, incest, prostitution, and procuring."

44 UB' e"'PWN#&i*M4MW +zw * ., THUW
Table 5. Homicide in selected countries, rates for 1980: Comparison of dn.ta <IOurces
Number of homicides l1er 100,000 I1Ql1ulation Actual homicides
World Attempted and Health actual homicides Organi- United United
Country zation Interpol Nations Interpol Nations
United States 10.5 10.0 10.1 ... .. -Australia 1.2 2.5 . ,. 3.1 . .. Austria 1.2 1.0 1.0 2.2 2.2 Canada 2.1 2.6 2.1 6.0 5.4 Chile 2.6 5.7 ... 6.1 13.8 Costa Rica 5.8 4.5 2.7 6.5 5.8
Czechoslovakia 1.la ... .,. .2a .7 Denmark 1.3 1.4 1.5 4.5 4.6 Ecuador 6.0a ... ... .2a ... Egypt .9 2.1 . ,. 2.2 ... England and Wales .8 1.3 1.2 1.6 1.6
Finland 3.3 2.4 2.4 5.3 5.3 France 1.0 ... .,. 3.9 . .. Germany (FRG) 1.2 1.4 1.4 4.4 4.4 Greece .7 .7 ... .9 1.2 Hungary 2.6 ... .,. 3.S .. . Ireland .7
1.:in .4 .6 .6
Italy 1.9a 2.0 3.aa 3.5 Japan 1.0 .S ... 1.4 .. , Netherlands .8 ... ... 10.7 10.6 New Zealand 1.3 1.7 ... 2.2 . .. Norway 1.1 ... . , . .S .S Panama 2.2 l·.Sa
.,. 3'.'2 a
9.6 Portugal 1.3 1.8 3.7 Scotland 1.6 .. , 1.1 1.3 6.6 Spain 1.0 ... .,. 1.2 .1
Sweden 1.2 1.6 1.6 4.7b
4.7 Thailand 25.1 ... ., . 18.3 ... Venezuela 9.7a
'" .,. 13.5 .. , Yugoslavia 1.7 ... ... ... 6.0
Note: Homicide excluding attempts was Sources: World Health Organization, World recalculated from original data whenever Health Statistics Annual, vois. 19112-86; Interpol, possible. International Crime Statistics, vols. 1979-S0, •.• Not available. 1981-82, 1983-84; United Nations, Second United ~19S1 data. Nations Crime Survey; tJ.S. Census Bureau,
1983 data. Statistical Abstract of the United States, 1987.
Nine European countries and thc United States reported identical rates for rape in 1980 to both the UN and to Interpol (table 6). It appears that in boUl cases they simply reported their official rape statistic for that year. !f the official number corresponded to the UN definition, it included statutory rape.
The eight other countries that reported to both the UN and Interpol tended to r~port higher rates to the UN: suggesting that they did not include statutory rape in the number they reported to Interpol.
In any comparison of rape rates, two underlying factors must be noted, even though they cannot be quantified. One is the degree of freedom and ii1dependence women have within a society and, consequently, the degree of exposure they have to the possibility of rape. Anothf'r is the the extent to wltich stigma still attaches to a rape and the consequent reluctance viC"tims may have to report the crime to authorities. The first factor may actually
affect the volume of rape from one country to another. The second will not affect the total volume of rape but will affect the proportion of rape cases reported to the police. Both of these factors will tend to raise the reported rate of rape in developed countries, compared to some less developed nations.
Robbery
The Interpol definition of robbery is "robbery and violent theft." The uN definition is lithe taking away of property from a person overcoming resistance by force or threat of force. II
The United States defines robbery as lithe taking or attempting to take anyth;ng of value from the care, custody, or control of a person or persons by force or threat of forc~ or violence and/or putting the victim in fear."
5
rz e * '.
~,
Table 6. Rape in selected coW1trles, rates for 1980: UN and Interpol datn
Number or rapes per 100,000 I1QQulation
Country UN Interpol -'
United States 36.0 36.0
Australia ... 7.7 Austria 7.5 5.2 Belgium ... .7 Belize 17.7 ... Canadr. 9.6 14.1
Chile 34.2 12.1 Colombia S.6 6.0 Costa Rica 13.5 9.9 Czechoslovakia 2.9 . .. Denmark 6.3 7.0
Ecuador ... .S'" England and Wales 2.5 2.5 Finland '1.'1 7.7 France 3.5 3.5 Germany (FRG) 11.2 11.2
Greece 5.3 1.0 Hungary ... 4.4 India '" .7 Indonesia ... 1.5 Ireland 1.4 1.4
Italy 3.3 1.1'" Japan ... .2 Netherlands 5.6 5.S New Zealand ... 9.6 Nigeria ... 4.3
Northern Ireland 3.1 4.2 Norway 3.2 3.2 Panama 10.2 ... Peru ... 2.3 Philippines . .. 1.2
Poland 4.4 ... Portugal 1.2 1.5'" Scotland 5.9 3.2 Spain 2.5 2.3 Sweden 10.6 10.6
Venezuela . .. 15.6 Yugoslavia 8.5 ... . .• Not available. *19S1 data. dourcas: United Nations, Second United Nations Crime Survey; U.S. Census BUreau, Statistical Abstract of the United ,Sta !.§.198 7; Interpol, lnterna tiona I ('ri me Sta tistics, vols. 1979-80.
England and Wales reported to Interpol that their definition of aggravated theft, which is the sum of robbery and burglary, includes the crime of "going equipp,ed for stealing," It is not clear if this ci'ime is included in robbery or in burglary or is divided between the two.
Czechoslovakia reported to the UN that robbery and crimes of theft refer only to crimes against individuals and individually owned property. Robbery or theft in Czechoslovakia inVOlving socially owned property is classified in a separate category. As a result, robbery and theft rates in Czechoslovakia

uzs.
are strikingly lower than those for other countries (table 7).
The robbery rate reported to the UN for Chile, 403, is extremely high, while its reported theft rate, which includes minor offenses, is rather low, 404 (appendix table). The fact that they are also practically the same suggests the possibility of error. This possibility is enhanced by the fact that the robbery rate Chile reported to Interpol for 1980 was 24 per 100,000. Although its reported rates are lells than half those of Chile, Colombia also reported a higher rate for robbery than for theft, but it did not report whether minor theft was included in the theft rate.
Approximately one-fourth of the countries r,eported the same or nearly the same robbery rates both to Interpol and to the UN.
Burglary anal auto theft
Since the UN groups all of its crimes of theft into one category, it has no statistics for burglary or auto theft. The Interpol dl~finition of burglary is "breaking and Imtering." The U.S. definition is lithe unlawful entry of a structure to commit a felony or theft. The use of force to ~ain entry is not required to classify an offense as a burglary.1I
Interpol defines auto theft as "theft of motor cars.1I The U.S. definition includes theft of any motor vehicle that is self-propelled and runs on a surface instead of rails. This includes motorcycles, motor scooters, and the like; however, the overwhelming number of U.S. motor vehicle thefts are thefts of autos or trucks.
Probably the most important factor in motor vehicle theft is the number of motor vehicles per capita in the country. Developed nations in which automobile ownership jig widespread generally had the highest rates of auto theft (table 4).
Table 7. Rob~ry In selected countries, rates for 1580: UN nnd Interpol data
Number of robberies per 100,000 QQeulation
Country UN Interpol
United Sta tes 240.9 244.0
Australia ... 56.6 Austria 12.6 30.5 Belgium ... 32.5 Belize 29.9 ... Canada 102.1 103.7
Chile 403.4 23.5 Colombia 191.8 36.7 Costa Rica 82.2 21.6 Czechoslovakia 5.3 ... De!lmark 28.3 28.5
Ecuador ... 6.9'" England and Wales 30.2 30.5 Finland 39.1 40.9 Franee 9.0 65.8 Germany (FRG) 38.5 39.3
Greece .8 .7 Hungary ... 9.6 India '" 3.5 Indonesia ... 8.2 Ireland 39.2 33.4
Italy 7.S 18.S-Japan ... 1.9 Monaco ... 11.1 Netherlands 30.0 30.1 New Zealand ... 9.0
Nigeria ... 4.,-Northern Ireland ... 84.2 Norway 8.3 ... Panama 14.3 ... Peru ... 19.3
Philippines ... 13.9 Poland .7 .. , Portugal 16.5 18.3-Scotland 72.3 72.2 Spain 73.2 63.S
Sweden 41.2 41.2 Venezuela ... 149.0 Yugoslavia 4.5 ... ·1981 data. Sources: United Na lions, Second United Nations Crime Survey; U.S. Census Bureau Statistical Abstract of the United States, J~81i Interpol, International Crime Sta tistic!" vols. 1979-80.
6
Theft
The UN definition of theft is an encompassing one: "the stealthy taking away of property without the owner's consent, including burglary and housebreaking. It includes theft of a motor vehicle, and both simple and aggravated theft as defined by the criminall.aw of each country. Shoplifting and other minor offences, for example, pilfering and petty theft, may be included or not according to the usual practice of each country."
Minor theft, when it is included in a country's theft data, constitutes the bulk of this crime. Only two countries reporting theft to the UN indicated that it did not include minor thefts in this category. Nine of the 26 countries reporting theft did not say whether they included minor theft, making their data difficult to assess. Two countries --Finland and Poland--did not include auto theft in their general theft category •

----------1
Table 8. Homicide In selected countries, rates for 1980-84: Interpol data
Number of actual homicides Number of attempted and actual Qer 100,000 QOQulatlon homicides Qer 100,000 QOQulation
Country 1980 1981 1982 1983 1984 1980 1981 1982 1983 1984
United Statesa 10.0 9.Sb 9.1b 8.3 7.9 ... ... ... ... .. . Australia 2.5 2.5 ... ... ... 3.1 2.6 2.< 3.1 3.4 Austria 1.0 1.1 1.2 1.4 1.3 2.2 2.1 2.1 2.5 2.4 Belgium 1.4 1.1 1.8 1.3 ... 2.9 2.7 3.3 2.7 3.3 Canada 2.6 2.8 2.7 2.8 2.7 6.0 6.6 6.6 6.3 6.3 Chile 5.7 6.4 5.8 5.0 5.8 6.1 7.1 6.3 5.5 6.3
Colombia ... ... . .. ... ... 2.0 1.9 2.2 30.2 2.5 Costa Rica 4.5 ... ... ... ... 6.5 ... . .. ... ... Denmark 1.4 1.3 1.3 1.4 1.2 4.5 5.0 5.8 5.0 5.8 Ecuador ... ... ... ... ... .. . .2 1.5 2.3 4.5 Egypt 2.1 ... . .. .9 1.0 2.2 ... . .. 1.4 1.5
England and Wales 1.3 1.1 1.2 1.1 ... 1.6 1.5 1.6 1.4 ... Finland 2.4 2.3 2.2 2.4 2.3 5.3 5.3 6.4 6.1 5.6 France ... ... ... ... ... 3.9 . .. ... 4.7 4.6 Germany (FRG) 1.4 1.5 1.6 1.5 1.5 4.4 4.8 4.9 4.5 4.5 Greece .7 .6 .8 .8 1.0 .9 1.4 1.7 1.B 1.B
Hungary ... ... . .. 1.9 1.9 3.5 ... .. . 3.8 3.7 India 3.3 ... ... . .. . .. 3.3 ... .. . ... .. . Indonesia .5 ... ... ... ... 1.2 1.2 1.1 1.4 .9 Ireland ... ... ... 1.0 .8 .6 .7 ... 1.3 1.1 Italy ... 1.4 2.5 2.1 . .. ... 3.3 4.4 5.3 . .. Japan .8 .8 .8 .8 .8 1.4 1.5 1.5 1.5 1.5 Luxembourg ... ... ... ... ... ... . .. .. . 7.4 5.3 Monaco ... ... . .. . .. ... ... 3.7 .. . ... ... Netherlands ... ... .7 1.3 1.2 10.7 10.6 10.6 11.2 . .. New Zealand 1.7 1.9 ... 1.9 1.7 2.2 2.4 ... 2.6 2.5
Nigeria ... ... .. . 1.5 ... 3.0 ... ... 1.7 .. . Northern Ireland 6.0 6.8 6.5 4.0 ... 23.1 37.6 24.0 19.8 ... Norway ... ... ... ... ... .8 .7 1.1 .9 . .. Peru ... ... ... ... ... 2.2 . .. ... ... .. . Philippines ... ... . .. . .. ... 13.4 31.8 ... 43.4 42.5
Portugal ... 1.6 . .. 2.8 3.0 ... 3.2 ... 4.6 4.6 Scotland ... ... ... ... .. . 1.3 ... . .. .. . 1.4 Spain ... ... '" ... ... 1.2 .. . 1.1 1.8 2.2 Sweden 1.6 1.8 ... 1.5 1.4 4.7 4.9 ... 5.4 5.7 Switzerland ... ... ... 1.4 1.1 ... ... ... 2.3 2.2
Thailand ... ... ... ... ... ... ... .. . 18.3 16.6 Venezuela ... ... ... ... . .. 13.5 11.0 11.0 12.5 9.9
Note: Homicide rates excluding attempts ~he United States classifies all at.~mpted Source: Interpol, International Crime were calculated from original data nomicides as assaults. Statistics, vols. 1979-80, 1981-82, 1983-84. wherever possible. Not reported by Interpol; number is from ... Not available. the FBI, Crime in the United States, 1982 •
Comparing rates over time
Because of all of the definitional and reporting difficulties noted above, directly comparing the crime rate of one country to that of another is often problematical. Yet, if the international reporting of crime rates is to have any usefulness at all, it must be in describing crime trends. The ability to say with some confidence that the rate of crime as reported to law enforcement authorities is rising in one coun-try, while falling in another and remaining basically unchanged in a third, is a fairly minimal expectation from international crime rates.
Examining a country's crime rates for the same crime over several years is another way of assessing the reliability of the measurements. Rates that inspire a higher degree of confidence are those that vary slightly from one year to another or those that seem to show a definite trend throughout the period, such as the U.S. homicide rate (table 8).
Rates that vary sharply from year to year highlight the danger of citing a rate for only 1 year and suggest that, at a minimum, different respondents were reporting for the country during the period. On the other hand, rates that are identical throughout the 5-year
7
period, while they may be entirely accurate, should be viewed with caution.
Fewer countries could report actual homicide rates for 198Q-8:i than could report actual and attempted homicides combined. Since the user cannot know from reports to Interpol what each country includes in attempted homicide, the direction of the trend is probably more important than the absolute level of the rate.
The total homicide rates for most countries did not show a definite trend but varied within what seemed to be
b .A rr
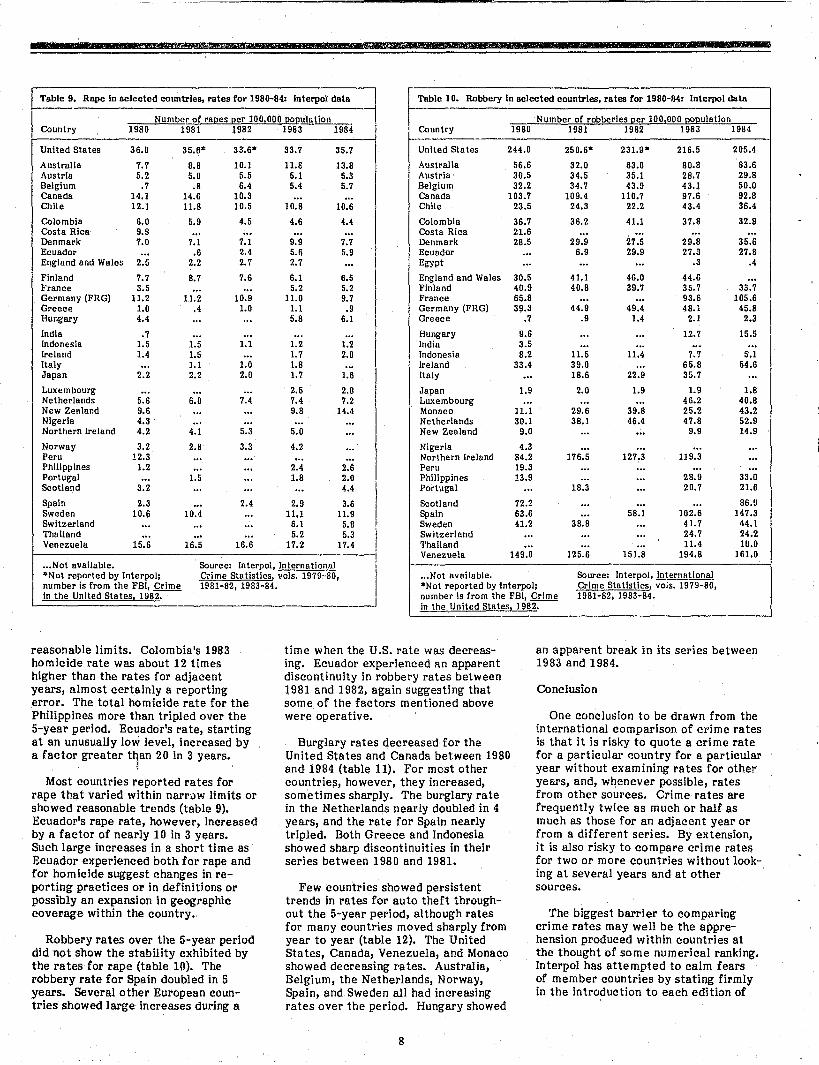
Table 9. Rape In seleeted coWltrles, rates for 1980-84: Interpoi data Table 10. Robber'll In selected countries, rates for 1980-84: Interpol data '-__ Number of ra~s I!er 100,000 I!QQulatlon Number of robberies Qer 100,000 I!QQulation
Country 1980 1981 1982 1983 1984 C..ountry 1980 1981 1982 1983 1984
United Sta tes 36.0 35.6" 33.6" 33.7 35.7 United States 244.0 250.6- 231.9* 216.5 205.4
Australia 7.7 8.8 10.1 11.8 13.8 Australia 56.6 32.0 63.6 SO.8 83.6 Austria 5.2 5.0 5.5 5.1 5.3 Austria 30.5 34.5 35.1 2S.7 29.8 Belgium .7 .8 6.4 5.4 5.7 Belgium 32.2 34.7 43.9 43.1 50.0 Canada 14.1 14.6 10.3 ... ... Canada 103.7 109.4 110.7 97.6 92.8 Chile 12.1 11.8 10.5 10.8 10.6 Chile 23.5 24.3 22.2 43.4 36.4
Colombia 6.0 5.9 4.5 4.6 4.4 Colombia 36.7 36.2 41.1 37.8 32.S Costa Rica 9.S .. , ... ... ... Costa Rica 21.6 ... . .. .. , ... Denmark 7.0 7.1 7.1 9.9 7.7 Denmark 28.5 29.9 27.5 29.S 35.6 Ecuador ... .6 2.4 5.6 5.9 Ecuador ... 6.9 29.9 27.3 27.8 England and Wales 2.5 2.2 2~ .. 2.7 ... Egypt ... ... .. . .3 .4
Finland 7.7 8.7 7.6 6.1 6.5 England and Wales 30.5 41.1 46.0 44.6 ... France 3.5 ... ... 5.2 5.2 Finland 40.9 40.8 39.7 35.7 33.7 Germany (FRG) 1l.2 11.2 10.9 11.0 9.7 France 65.8 ... ... 93.6 105.6 Greece 1.0 .4 1.0 1.1 .9 Germany (FRG) 39.3 44.9 49.4 48.1 45.8 Hungary 4.4 ... ... 5.8 6.1 Greece .7 .9 1.4 2.1 2.3
India .7 ... ... . .. . .. Hungary 9.6 ... ... 12.7 15.5 Indonesia 1.5 1.5 1.1 1.2 1.2 India 3.5 ... ... .. . ... Ireland 1.4 1.5 ... 1.7 2.0 Indonesia 8.2 11.5 11.4 7.7 5.1 Italy ... 1.1 1.0 1.8 '" Ireland 33.4 39.0 ... 65.8 54.6 Japan 2.2 2.2 2.0 1.7 1.6 Italy ... 18.6 22.9 35.7 ... Luxembourg ... ... ... 2.5 2.0 Japan 1.9 2.0 1.9 1.9 1.8 Netherlands 5.6 6.0 7.4 7.4 7.2 Luxembourg ... ... .. . 46.2 40.8 New Zealand 9.6 'u" ... 9.S 14.4 Monaco 11.1 29.6 39.8 25.2 43.2 Nigeria 4.3 .. , ... '" '" Netherlands 30.1 38.1 46.4 47.8 52.9 Northern Ireland 4.2 4.1 5.3 5.0 ... New Zealand 9.0 ... ... 9.9 14.9
Norway 3.2 2.8 3.3 4.2 ... Nigeria 4.3 ... ... ... .. , Peru 12.3 .. , ... '" ... Northern Ireland 84.2 176.5 127.3 119.3 ... Philippines 1.2 .. , '" 2.4 2.6 Peru 19.3 .. , ... ... ... Portugal ... 1.5 ... 1.8 2.0 Philippines 13.9 ... '" 28.9 33.0 Scotland 3.2 ... . .. . .. 4.4 Portugal .. , 18.3 ... 20.7 21.6
Spain 2.3 ... 2.4 2.9 3.6 Scotland 72.2 ... ... . .. 86.9 Sweden 10.6 10.4 ... 11.1 11.9 Spain 63.6 ... 58.1 102.6 147.3 Switzerland ... .. , ... 6.1 5.8 Sweden 41.2 38.8 '" 41.7 44.1 Thailand ... ... . .. 5.2 5.3 Switzerland ... ... .. . 24.7 24.2 Venezuela 15.6 16.5 16.6 17.2 17.4 Thailand ... ... ... 11.4 10.0
Venezuela 149.0 125.6 151.8 194.8 ]61.0 ... Not available. Source: Interpol, Internationlli "Not reported by Interpol; Crime Statistics. vols. 1979--80, ... Not available. Source: Interpol, International number is from the FBI, Crime 19S1-82, 1983-84. in the United Sta tes, 1982.
reasonable limits. Colombia's 1983 homicide rate was about 12 times higher than the rates for adjacent years, almost certainly a reporting error. The total homicide rate for the Philippines more than tripled over the 5-year period. Ecuador's rate, starting at an unusually low level, increased by a factor greater t~an 20 in 3 years.
Most countries reported rates for rape that varied within narrow limits or showed reasonable trends (table 9). Ecuador's rape rate, however, increased by Ii factor of nearly 10 in 3 years. Such large increases in a short time as Ecuador experienced both for rape and for homicide suggest changes in reporting practices or in definitions or possibly an expansion in geographic coverage within the country.
Robbery rates over the 5-year period did not show the stability exhibited by the rates for rape (table 10). The robbery rate for Spain doubled in 5 years. Several other European countries showed large increases during a
*Not reported by Interpol; Crime Statistics, vo;s. 1979-80, number is from the FBI, Crime 1981-82, 1983-84. in the United States, 1982.
time when the U.S. rate was decreasing. Ecuador experienced an apparent discontinuity in robbery rates between 1981 and 1982, again suggesting that some of the factors mentioned above were operative.
Burglary rates decreased for the United States and Canada between 1980 and 1984 (table 11). For most other countries, however, they increased, sometimes sharply. The burglary rate in the Netherlands nearly doubled in 4 years, and the rate for Spain nearly tripled. Both Greece and Indonesia showed sharp discontinuities in their series between 1980 and 1981.
Few countries showed persistent trends in rates for auto theft throughout the 5-year period, although rates for many countries moved sharply from year to year (table 12). The United States, Canada, Venezuela, and Monaco showed decreasing r'ates. Australia, Belgium, the Netherlands, Norway, Spain, and Sweden all had increasing rates over the period. Hungary showed
8
an apparent break in its series between 1983 and 1984.
Conclusion
One conclusion to be drawn from the international comparison of crime rates is that it is risky to quote a crime rate for a particular (!Quntry for a particular year without examining rates for other years, and, whenever possible, rates from other sources. Crime rates are frequently twice as much or half as much as those for an adjacent year or from a different series. By extension, it is also risky to compare crime rates for two or more countries without looking at several years and at other sources.
The biggest barrier to comparing crime rates may well be the apprehension produced within countries at the thought of some numerical ranking. Interpol has attempted to calm fears of member countries by stating firmly in the introduction to each edition of

w ;- &W riMe 1M'
Table 11. Burglary In selected countries, rates for 1980-84: Interpol data Table 12. Auto theft In selected countries, rates lor 1980-84: Interpol data
Number of bu~laries !1er 100,000 ll2!1ulation Number oC auto thefts !1er 100,000 !1o!1ulatlon Country 1980 1981 1982 1983 1984 Country 1980 1981 1982 1983 1984
United Sta tes 1,669.0 1,632.1 a 1,475.2a 1,337.7 1,263.7 United States 495.0 468.7· 452.8· 430.8 437.1
Australia 1,26B.3 896.1 1,538.2 1,748.5 1,754.3 Australia 399.2 432.0 533.8 586.2 584.7 Austria 746.3 874.1 893.2 843.0 805.8 Austria 18.0 21.1 19.5 17.2 16.9 Belgium 504.8 599.2 695.4 705.2 ... Belp;ium 66.5 78.2 127.8 134.6 140.6 Canada 1,497.1 1,552.6 1,501.6 1,456.2 1,420.6 Canada 436.7 442.8 353.2 305.4 304.9 Denmark 1,893.9 1,837.6 1,943.4 2,052.3 2,230.2 Chile 7.6 8.0 9.5 11.8 7.6
Ecuador ... 28.6 .. , ... ... Colombia 11.0 15.3 16.5 14.3 14.2 Egypt 9.2 ... ... .., ... Denmark 411.0 391.1 394.8 426.9 469.5 England and Wales 1,264.4 1,465.3 1,634.0 1,639.7 ... Ecuador ... 11.1 1.9 3.3 7.8 l"inland ... 762.1 808.1 762.8 772.6 Egypt 1.9 ... ... 2.7 3.3 France 512.0 ... ... 735.5 80-9.8 England and Wales 653.7 673.9 708.1 656.6 .., Germa'(1 (FRG) 1,18S.3 1,319.7 1,450.1 1,535.4 1,554.1 Greece .2 67.0 70.S '.IS.5 72.8
Finland 163.1 168.8 168.2 177.1 171.7 France 398.9 ... ... 465,3 483.4
Hungary 147.7 ... ... IS4.6 211.0 Germany (FRG) 104.2 116.6 127.4 130.6 118.0 India 24.4 ... ... ... ... Greece .3 . .. ... ... .., Indonesia 3.5 62.4 53.4 46.1 38.4 Hungary 34.9 ... ... 3M.I 4.0
Ireland 647.2 735.4 ... 1,065.0 1,056.8 Indonesia 3.5 4.8 6.4 5.3 4.9 Italy ... 4S.2 44.6 ... ... Ireland 15.2 19.2 . .. 31.8 29.7 Japan 248.3 255.8 254.6 249.1 251.2 Italy ... 230.8 209.1 276.3 .., Luxembourg ... ... .. . 504.8 509.8 Japan 27.6 28.4 28.2 29.1 29.4 Monaco 433.3 292.6 590.1 590.4 500.0 Luxembourg ... ... '" 121.8 109.3
Netherlands 1,219.1 1,512.5 1,754.0 1,954.4 2,32S.7 Monaco 222.2 203.7 213.6 194.4 176.3 New Zealand 1,729.8 ... ... 2,269.9 2,243.1 Netherlands 102.0 119.9 135.0 138.2 155.9 Nigeria 16.0 ... ... ... .., Northern Ireland 349.3 87.7 85 .. 8 106.2 . .. Northern Ireland 1,275.8 1,324.8 1,390.2 1,360.7 ... Norwey 177.5 216.7 249.4 273.1 .., Peru 255.1 ... ... ... ... Peru 11.9 . .. ... .. . ..,
Portugal ... 86.0 ... 87.0 99.7 Philippines ... ... .. . 1.8 2.0 Scotland 1,522.3 ... ... ... 2,178.6 Portugal '" 49.2 .. . 57.8 61.3 Spain 357.4 ... 440.S 784.1 1,069.9 Scotland 625.5 ... ... ... 632.7 Sweden 1,682.4 1,648.1 ... 1,678.0 1,708.8 Spain 214.6 ... 173.6 255.0 298.2 Switzerland ... ... ... 1,069.4 976.8 Sweden 412.4 393.0 ... 418.8 460.0
Thailand ... ... ... 8.8 8.7 Thailand ... ... .. . 1.7 2.0 Venezuela 271.3 ... ... ... .. . Venezuela 168.3 129.4 129.3 115.5 85.9
... N ot available. than the rates for 1981-84. It is ...Not available. Source: Interpol, International aN ot reported by Interpol; likely an error. "Not reported by Interpol; Crime Statistics, vols. 1979-80, number is from the FBI, Crime Source: Interpol, International ~ the United States, 198-2-. -
number is from the FBI, Crime in the United States, 198-2-. -
1981-82, 1983-84. Crime Statistics, vols. 1979-80,
t is not known why the 1980 1981-82,1983-84. rate of .2 Is so much lower
International Crime Statistics that lithe information given is in no way intended for use as a basis for comparisons between different countries."
The introduction continues: "Our statistics cannot take account of the differences that exist between the legal definitions of punishable offences in various countries, of the different methods of calculation, or of any changes which may have occurred in the countries concerned during the reference period. All these factors obviously have repercussions on the figures supplied. Police statistics reflect the crimes reported to or detected by the police and therefore cover only part of the total number of offenses actually committed. Moreover, the volume of unreported crime depends to some extent on action taken by the police, and may therefore vary from one point in time to another and from one country to another. Consequently, the figures given In these statistics must be interpreted with caution."
To make the international comparison of crime rates as meaningful as possible, the data gatherer and the data provider must take joint responsibility for assuring that complete explanatory notes are reported each year, minimizing the assumptions that users must make. Apparent errors must be examined and corrected if they are actually errors. The definitions or each crime reported by each country must be stated in full so that differences among countries may be taken into account. Wherever a country can show detail for a crime category, it should do so in order to facilitate comparison with countries that can report only part of that crime group. Finally, each country should report in full on the degree of geographical coverage its crime statistics represent. Only after these things have been accomplished will it be useful to begin looking at other causes of differences in crime rates among nations.
9
Appendix: Country notes
Interpol data
Countries were asked to report both the total number of crimes and the percent of crimes that were attempts. Countries also reported their total population and their crime rates. Where the percentage of attempts was available for homicide, homicide rates were recalculated to obtain rates for completed homicides so that the rates would be comparable to those for the United States. Some homicide rates that included attempts were extremely low, suggesting that only actual homicides had been reportetl for total homicides.
Country notes were reported in each of the three International Crime Statistics volumes used in this report. When notes were given for a single year only, that year is noted in parentheses at the end of the note. If no year appears, then the note applies to all 5 years of data. The nature of some
if!
-I I

&3 .... notes strongly suggests that they apply to all 5 years of data, even though they appear only In certain years.
Only comments relating to the crimes pres<:!nted in this report are shown below. Some {!ountries may have reported comments relating to other crimes.
Australia. The Australian Capital Territory, New South Wales, and S!>uth Australia do not record attempted crimes. The Northern Territory and Queensland record attempted crimes for murder; Western Australia, for murder and rape; Victoria, for murder, rape, and car theft; Tasmania, for all crimes. The Australian ~llpltel Territory, the Northern Territory, and Victoria do not record robbery 01' burglary. Western Australia does not record auto theft.
Belgium. Percentage of attempted homicides not shown in 1984.
Colombia. Percentage of attempted homicides not shown.
Costa Riea. Data supplied for 1980 only.
Ecuador. No data supplied for 1980. Percentage of attempted homicides not shown.
Egypt. No data supplied for 1981 or 1982.
England and Wales. The cri mes of robbery and burglary may each Include some number of the crime of "going equipped for stealing" (1980-82).
Finland. Homicide Includes manslaughtet (1981-84). Auto thMt Includes "taking and driving away" (1981-84).
l'rance. No data reported for 1981 and 1982. Percentage of attempted homicides not shown.
Greecc. Automobile theft not shown separately (1981-84).
Hungary. No data reported for 1981 and 1982. Percentage of attempted homicides not shown for 1980.
india. Data reported for 1980 only. Percentage of attempted homicides not shown.
Indonesia. Percentage of attempted hom icicles shown for 1980 only.
Ireland. No data shown for 1982. Percentage of attempted homicides not shown for 1980.
Italy. No data shown for 1980.
Japan. Homicide includes preparation for the commission of a homicide and participation In a suicide (1980). When inflicted bodily Injury results in death, the crime Is classified as a serious assault and not as a homicide (1980).
Luxembourg. No data for 1980-82. Percentage of attempted homicides not shown for 1983 and 1984.
Monaco. Homicides given for 1981 only; percentage of attempted homicides not shown. "Account should be taken of the very large tourist population" (1980-82).
Netherlands. Percentage of attempted homicides not shown for 1980 or 1981. In 1984 only actual homicides were reported. The homicide rate for 1984 was reported as 12.26 per 100,000, but recalculation using reported homicides and the reported [l':'[lulation produces a rate of 1.2 per 100,000.
New Zealand. No data reported for 1982.
'we
Appendix taWe. Crime rates In aelectcd eounu-Ics, 1980: United Nations data
Number of crimes ~r 100,000 1l0Qulation Homicide
Including Country Actual attempts Rape Robbery Theft
United States 10.1 ... 36.0 240.9 &,262.2
Austria 1.0 2.2 7.5 12.6 2,074.0 Belize ... 16.3 17.7 29.9 1,527.9 Canada 2.1 5.4 9.6 102.1 5,071.5 Chile ... 13.8 34.2 403.4 404.1 Colombia 2.3 7.3 8.6 191.8 138.7
Costa Rica 2.7 5.8 13.5 82.2 183.7 Czechoslovakia ... .7 2.9 5.3 46.9 Denmark 1.5 4.6 6.3 28.5 4,417.2 England and Wales 1.2 1.6 2.5 30.2 4,148.8 Finland 2.4 5.3 7.7 39.1 2,116.2
France ... ... 3.5 9.0 2,983.6 Germany (FRG) 1.4 4.4 11.2 38.5 3,960.0 Greece ... 1.2 5.3 .8 184.1 Ireland .4 .6 1.4 39.2 1,159.8 Italy 2.0 3.5 3.3 7.6 301.4
Netherlands ... 10.6 5.6 30.0 569.5 Northern Ireland 5.6 22.6 3.1 .. , 1,837.8 Norway . .. .8 3.2 8.3 2,420.2 Panama ... 9.6 10.2 14.3 180.1 Poland 1.4 1.8 4.4 .7 515.2
Portugal 1.8 3.7 1.2 16.5 233.1 Scotland 1.1 6.6 5.9 72.3 4,998.3 Spain ... .1 2.5 73.2 1,093.2 Sweden 1.6 4.7 10.6 41.2 6,186.9 Yugoslavia .. , 6.1 8.5 4.5 392.4
... Not available. Bureau, Statistical Abstract of the United Sources: United Nations, Second United States, 1987. Nations Crime Survey; U.S. Census
Nigeria. No dl'ta reported for 1981, 1982, and 1984. Percentage of attempted homicides not shown for 1980.
Norway. No data shown for 1984. Percentage of attempted homicides not shown.
Peru. Data i'eported for 1980 only. Percentage of attempted homicides not shown.
Philippines. No data shown for 1982, Percentage of attempted homicides not shown.
Portugal. Data not reported for 1980 and 1982.
Scotland. No de;a given for 1981-83. Percentage of attempted homicides not shown.
Spain. Data not reported for 1981. Percentage of attempted homicides not shown. Auto theft includes unlawful usage of a car without owner's permission (1980, 1982, and 1983).
Sweden. Data not reported for 1982.
Switzerland. Data reported only for 1983 and 1984. Auto theft includes theft of motorcycles and bicycles (1983-84) and has been excluded from the tables.
Thailand. Data reported only for 1983 and 1984. Percentage of attempted homicides not shown.
United States. Data not reported for 1981 and 1982. Separate attempt statistics are only available for rape and breaking and entering (1980). Auto theft includes theft of any motor vehicle that Is self-propelled and runs on the surface and not on rails (1980). (Note: The comments do not mention that homicide as defined In the United States does not include attempts.)
Crime statistics for a number of cases known to the police Include the estima ted total number of offenses reported to all U.S. agen,1ies. Because some law enforcement agencies are not able to provide data or d9 not pwvide da ta for all 12 months of
10
a year, estimated or extrapolated crime counts for such agencies are used.
The total U.S. population used to compute the crime rates for the volume of crime per 100,000 Inhabitants was based upon census preliminary estimated counts for the nationwide residential population. This population figure may differ significantly from the actual U.S. population.
Venezuela. Percentage of attempted homicides not shown.
United Nations data
Crime rates for UN data were computed using population statistics from the "Comparative International Statistics" section of the 1987 Sta tistical Abstract of the United States.
Countries were instructed to provide a count of total crimes for each crime type reported and a count for attempts only. Some countries reported a number for attempted homicide that was larger than the number reported for total homicide. When this was the case, it was assumed that the number reported as the total was the number of completed murders, and rat~s for actual homicide were computed on that basis. Further, in these cases the number reported for total homicide and the number l'eported for attempted homicide were combined into "actual and attempted homicide," and a rate was computed for that number. For
r
those countries that reported a total count for homicide but no count for attempted homicide, crime rates for the total were computed and shown in the tables as "actual and attempted homicide."
Countries were requested to indicate whether their reported number of total thefts included a count of minor thefts; some countries did not provide this information.
Austria. Theft includes minor offenses.
Belize. Rape Includes indecent assault. Theft excludes minor offenses.
Canada. Total homicides reported were 496; attempted homicides reported, 792. Theft Includes minor offenses.
Chile. Theft includes minor offenses.
Colombia. Total homicides reported were 618; attempted homicides reported, 1,302. No Information given on minor thefts.
Costa Rica. No information given on minor thefts.
Czeehoslovalda. A rape resulting in the unintentional death of the victim is classified as a rape, not a homicide. Robbery and theft include only crimes against individuals and individually owned property. Robbery or theft involving property in socialist ownership is classi-fied separately. Theft excludes minor offenses.
Denmark. Theft includes minor offenses.
England. Theft Incl udes minor offenses.
Finland. Rape excludes statutory rape. Theft includes minor offenses but exclUdes auto theft.
France. Homicide includes unintentional homicides. No Information given on minor tnetts.
Germany (FRG). Homicide includes unintentional homicides. No Information given on minor thefts.
Greeee. The rape category includes lewdness, sodomy, seduction of a child, incest, prostitution, and procuring. 'I'heft Includes minor offenses.
Ireland. Theft includes minor offenses.
Italy. Theft includes minor offenses.
Netherlands. Homicide includes unintentional homicide. There is no crime category cailed robbery; reported in this category are thefts in which violence was used. No information given on minor thefts.
Northern Ireland. Total homicides reported were SS; attempted homicides reported, 264. No information given on minor thefts.
Norway. No information given on minor thefts.
Panama. No information given on minor thefts.
Poland. Theft includes minor offenses.
Portugal. Theft includes minor offenses but excludes auto theft.
Scotland. Theft includes minor offenses.
Sweden. Theft includes minor offenses.
United States. Homicides do not include attempts. Rape excludes statutory rape. Thefts Include minor offenses.
Yugoslavia. No Information given on minor thefts.
~u.s. G.P.O. 1988-Z02-04~:R0046
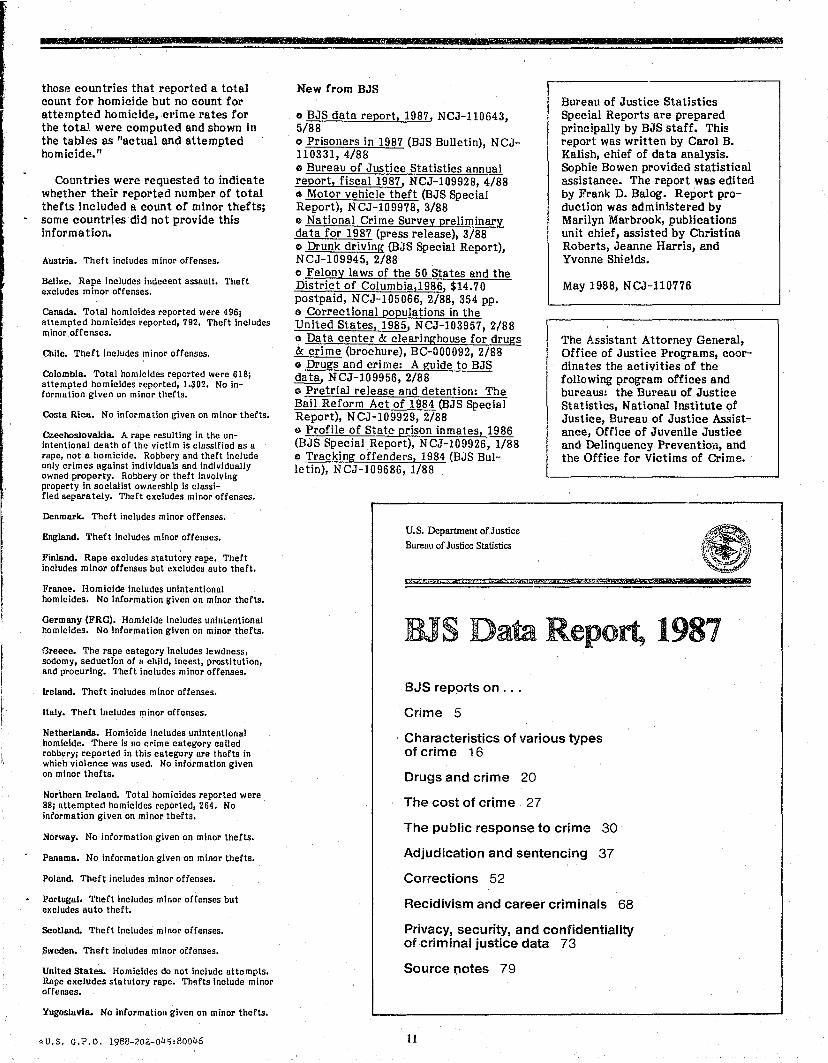
New from BJS
o BJS data report, 1987, NCJ-ll0643, 5/88 o Prisoners in 1987 (BJS Bulletin), N CJ-110331,4/88 ca Bureau of Justice Statistics annual report, fiscal 1987, NCJ-109928, 4/88 " Motor vehicle theft (BJS Special Report), NCJ-109978, 3/88 o National Crime Survey preliminary data for 1987 (press release), 3/88 o Drunk driving (BJS Special Report), NCJ-109945, 2/88 o Felony laws of the 50 States and the District of Columbia,1986, $14.70 postpaid, NCJ-105066, 2/88, 354 pp. I) Correctional populations in the United States, 1985, NCJ-103957, 2/88 c Data center &. clearinghouse for drugs &. crime (brochure), BC-000092, 2/8B o Drugs and crime: A guide to BJS data, NCJ-109956, 2/88 e Pretrial release and detention: The Bail Reform Act of 1984 (BJS Special Report), NCJ-109929, 2/88 o Profile of State prison inmates, 1986 (BJS Special Report), NCJ-109926, 1/88 Ell Tracking offenders, 1984 (BJS Bulletin), NCJ-109686, 1/88
u. S. Department of Justice
Bureau of Justice Statistics
Bureau of Justice Statistics Special Reports are prepared principally by BJS staff. This report was written by Carol B. Kalish, chief of data analysis. Sophie Bowen provided statistical assistance. The report was edited by Frank D. Balog. Report production was administered by Marilyn Marbrook, publications unit chief, assisted by Christina Roberts, Jeanne Harris, and Yvonne Shields.
May 1988, NCJ-110776
The Assistant Attorney General, Office of Justice Programs, coordinates the activities of the following program offices and bureaus: the Bureau of Justice Statistics, National Institute of Justice, Bureau of Justice Assistance, Office of Juvenile Justice and Delinquency Prevention, and the Office for Victims of Crime.
IDS Data Report, 1987
BJS reports on ...
Crime 5
Characteristics of various types of crime 16
Drugs and crime 20
The cost of crime 27
The public response to crime 30
Adjudication and sentencing 37
Corrections 52
Recidivism and career criminals 68
Privacy, security, and confidentiality of criminal justice data 73
Source notes 79
11

- ------ ------:-------------------------------
To be added to any BJS mailing list, copy or cut out this page, fill it in and mail it to:
o If the mailing label below is correct, check here and do not fillinnameandad~e~.
Name:
Title:
Organiza tion:
Street or box:
City, State, Zip:
Daytime phone number:
Justice Statistics Clearinghouse/NCJRS U.S. Department of Justice User Services Department 2 Box 6000 Rockville, MD 20850
You will receive an annual renewal card. If you do not return it, we must drop you from the mailing list.
Interest in criminal justice (or organization and title if you put home address above):
Please put me on the mailing list (01.'-
D
D
Justice expenditure and employment reports--annual spending and staffing by Federal/State/ local governments and by function (police, courts, etc.)
o
o processing of Federal white- New! White-collar crime--data on the}
collar crime cases
D Privacy and security of criminal history information and informa-tion policy--new legislation; D
o
maintaining and releasing intelligence and investigative records; data quality issues
Federal statistics--aa ta describing Federal case processing, from investigation through prosecution, adjudication, and corrections
u. S. Department of Justice
Bureau of Justice Statistics
Washington. D. C. 20531
Speciai Report
D
Juvenile corrections reports-- 0 juveniles in custody in public and private detention and correction-al facilities
Drugs and crime data--sentencing D and time served by drug offend-ers, drug use at time of crime by jail inmates and State prisoners, 0 and other quality data on drugs, crime, and law enforcement
BJS bulletins and special reports --timely reports of the most D current justice data
Prosecution and adjudication in State courts--case processing from prosecution through court disposition, State felony laws, felony sentencing, criminal defense
Official Business Penalty for Private Use $300
Col'Tections reports--results of sample surveys and censuses of jails, prisons, parole, probation, and other corrections da ta
National Crime Survey reports-the only regular national survey of crime victims
Sourcebook of Criminal Justice Sta tisties (annual)--broad-based da ta from 150+ S0urces (400+ tables, 100+ figures, index)
Send me a form to sign up for NlJ Reports (issued free 6 times a year), which abstracts both pri va te and government cri m inal justice publications and lists conferences and training sessions in the field.
BULK RATE POSTAGE & FEES PAID
DOJ/BJS Pennit No. G-91