international center for leadership in education dick jones
Post on 21-Dec-2015
217 views
TRANSCRIPT

International Center for International Center for
Leadership in EducationLeadership in Education
Dick JonesDick Jones

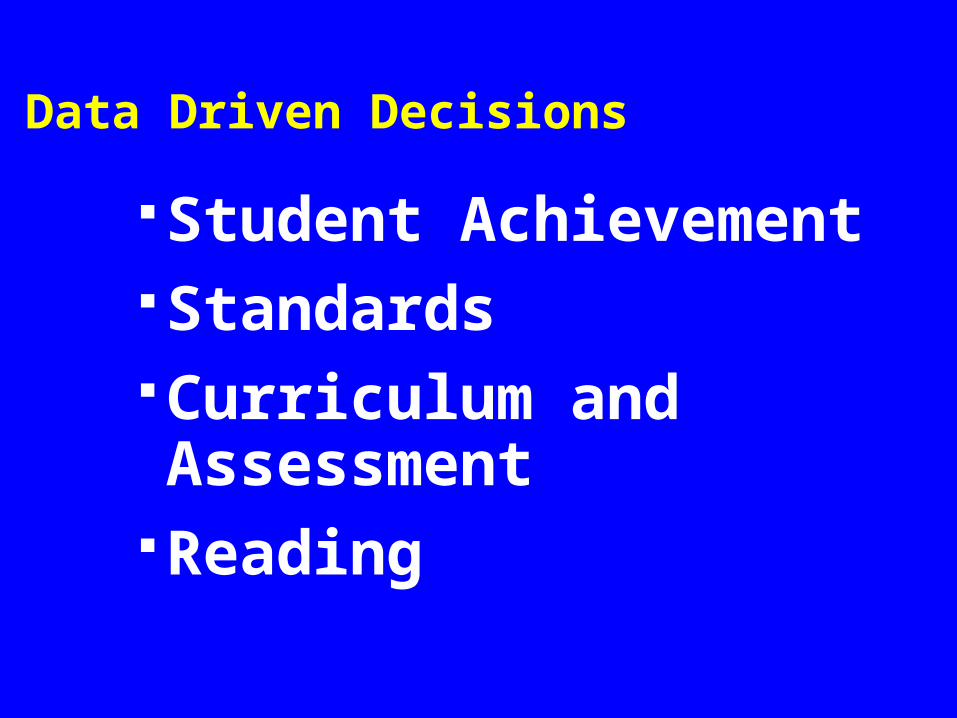
Data Driven Decisions
Student AchievementStandardsCurriculum and Assessment
Reading
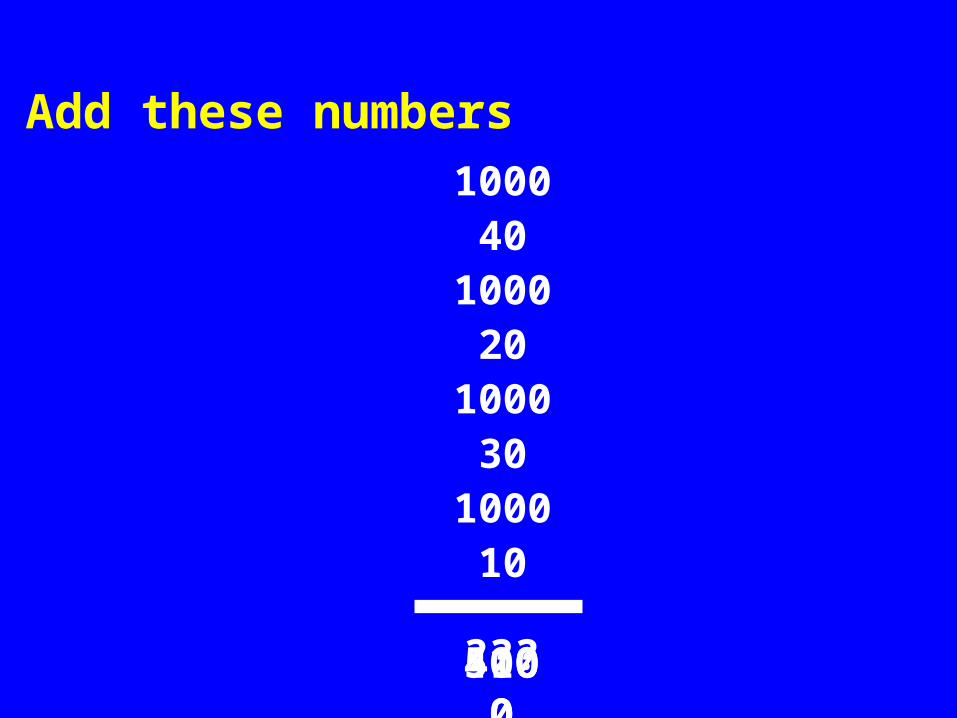
Add these numbers
100040
100020
100030
100010
???41005000

Add these numbers1000
401000
201000
301000
10
4100
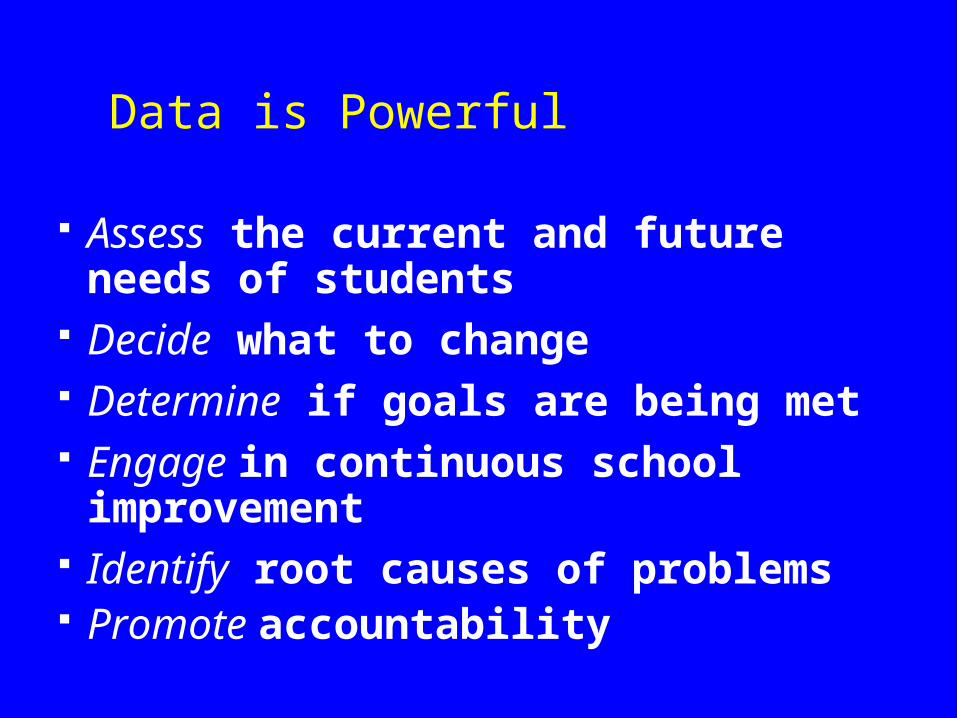
Data is Powerful
Assess the current and future needs of students
Decide what to change Determine if goals are being met Engage in continuous school improvement Identify root causes of problems Promote accountability

Barriers
Lack of training in data use No uniform data collection Lack of leadership at the school
and district level Outdated technology Unclear priorities Distrust of data use
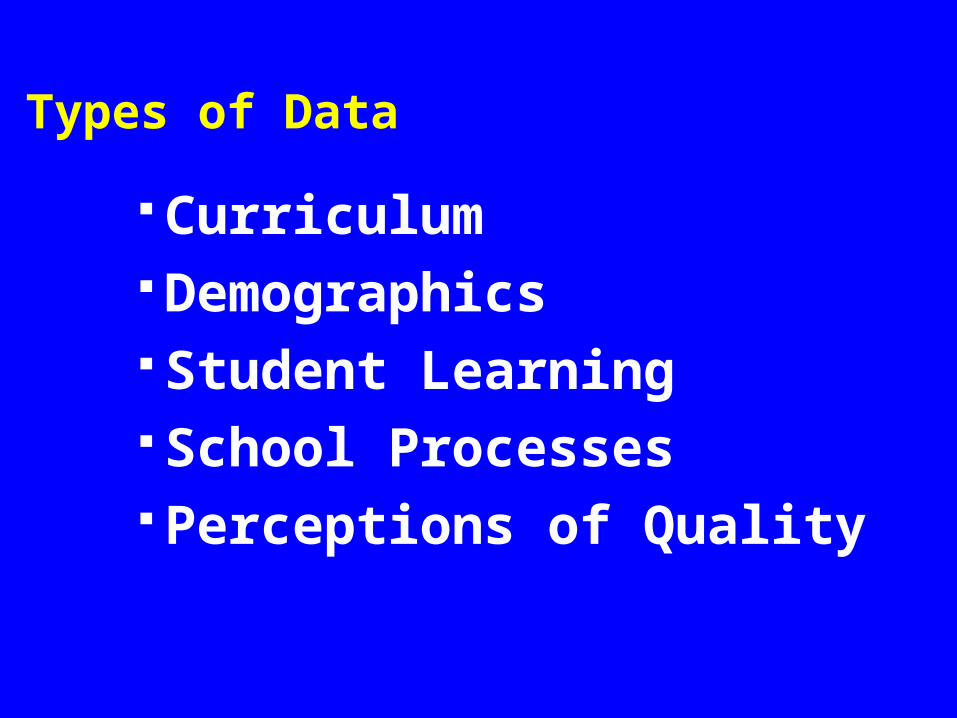
Types of Data
Curriculum Demographics Student Learning School Processes Perceptions of Quality

Types of Data Example
Type of Data Literacy
Curriculum
Demographics
Student Learning Performance on •State Test
Processes
Perceptions of Quality

Types of Data Example
Type of Data Literacy
Curriculum Level of Reading Comprehension on •State Test•Real World•Postsecondary Learning
Demographics Incoming Student Reading Levels
Student Learning Performance on •State Test•Local Assessment
Processes Reading Levels of •Textbooks•Teaching Materials•Success of Reading Practices
Perceptions of Quality
Student Surveys
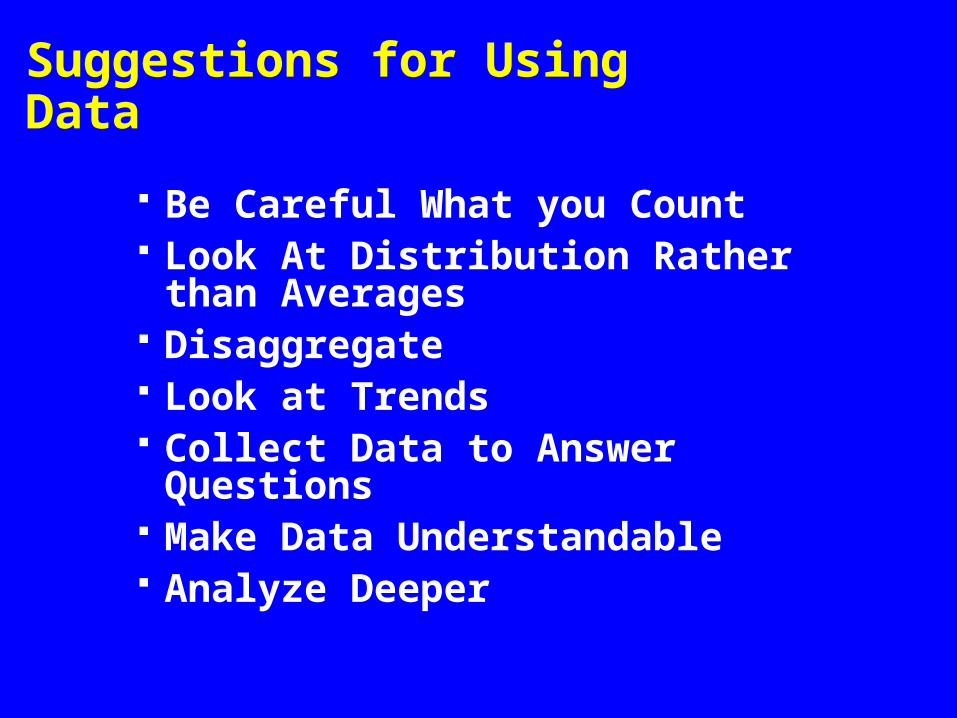
Suggestions for Using Data
Be Careful What you Count Look At Distribution Rather than
Averages Disaggregate Look at Trends Collect Data to Answer Questions Make Data Understandable Analyze Deeper


Student Achievement
Training - group processes, software, definitions
Disaggregate Do item analysis Ask Questions Dig for Root Causes (Don’t accept
excuses) Use multiple sources
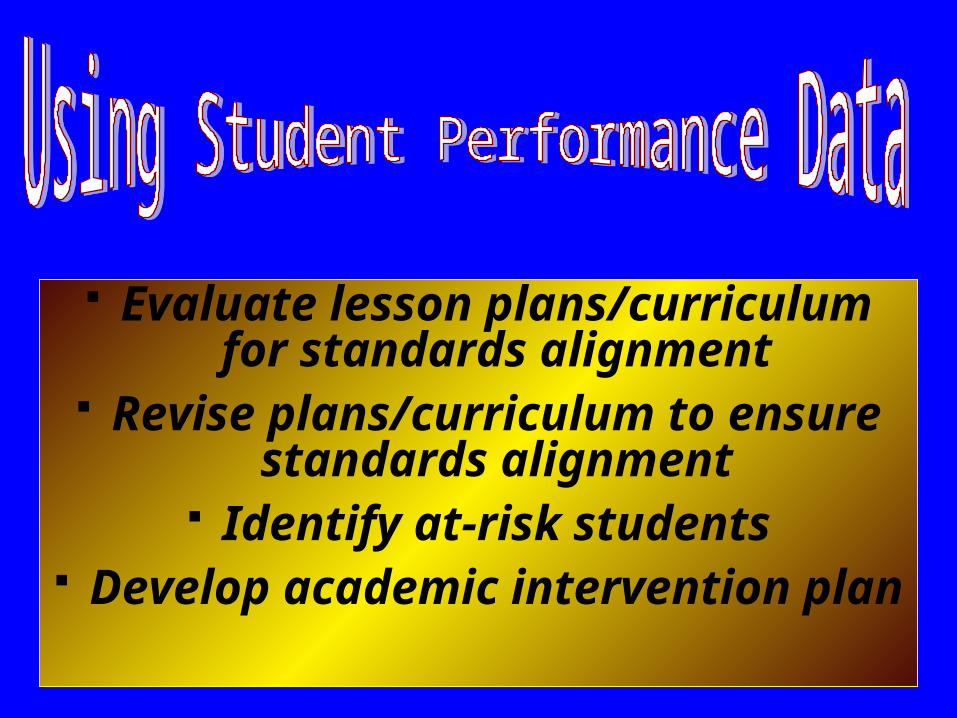
Evaluate lesson plans/curriculum for standards alignment
Revise plans/curriculum to ensure standards alignment
Identify at-risk students Develop academic intervention plan

Recognize need for professional development to support standards
and strengthen instructional strategies
Identify students meeting or exceeding standards

International Center for International Center for Leadership in Education, Inc.Leadership in Education, Inc.
Curriculum MatrixCurriculum Matrix

Needed Time
McREL
15,46515,465 HoursHours
Available Time
9,0429,042 HoursHours
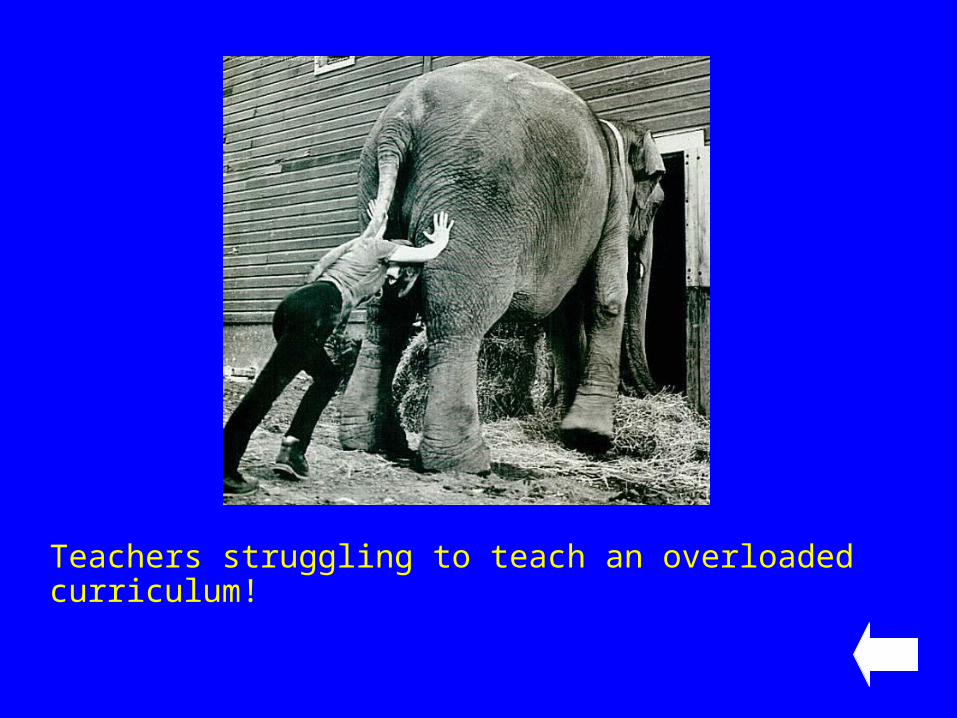
Teachers struggling to teach an overloaded curriculum!
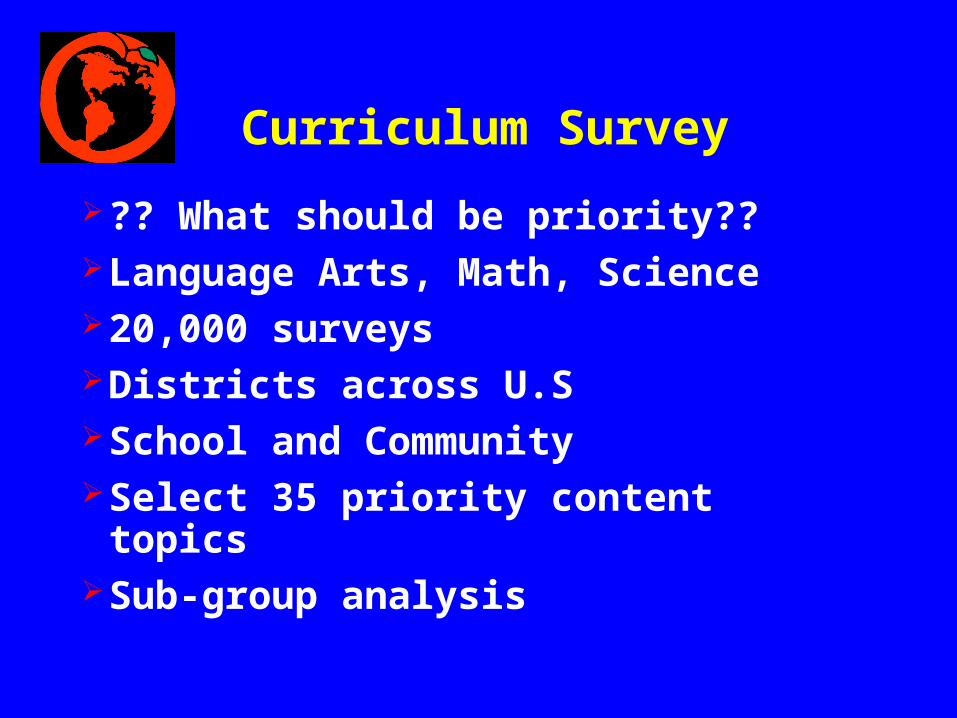
Curriculum Survey
?? What should be priority??Language Arts, Math, Science20,000 surveysDistricts across U.SSchool and CommunitySelect 35 priority content topicsSub-group analysis

Curriculum Survey
Top Ranked - skill and content based Low Ranked - more strategy Educators and Community similar except
subject specialists Basic skills low ranked by subject area
specialists Top Ranked English could be
responsibility of all

ICLE Curriculum SurveyLanguage Arts - Top 10 Topics
Apply in writing the rules of grammar, punctuation and spelling Gather, analyze and summarize information from a variety of
sources Give oral directions that are clear and understood Follow oral directions Identify and select pertinent information while reading Follow written directions carefully and accurately Understand rules of grammar, usage, punctuation, and spelling Develop processes for understanding and remembering Prepare and deliver individual speeches Know how to decipher unfamiliar words
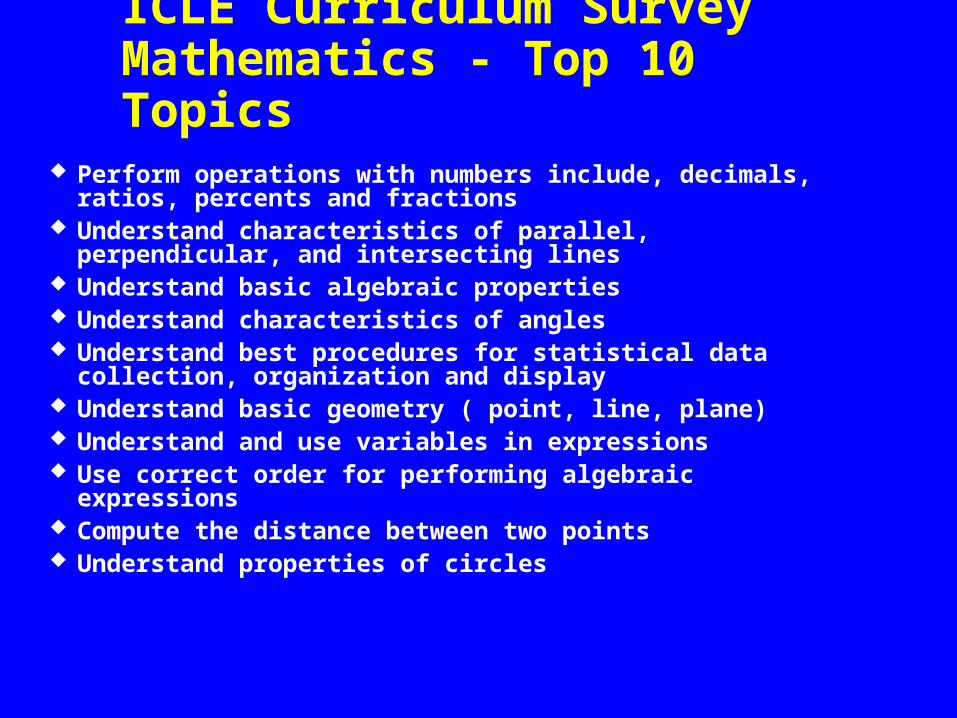
Perform operations with numbers include, decimals, ratios, percents and fractions
Understand characteristics of parallel, perpendicular, and intersecting lines
Understand basic algebraic properties Understand characteristics of angles Understand best procedures for statistical data collection,
organization and display Understand basic geometry ( point, line, plane) Understand and use variables in expressions Use correct order for performing algebraic expressions Compute the distance between two points Understand properties of circles
ICLE Curriculum SurveyMathematics - Top 10 Topics

Understand how and why rotation and revolution of earth affect day, seasons and weather
Understand systems of human body Understand nutrition Know the metric system and conversion Make observation of the local environment using senses and
instruments Understand technology changes environment Know processes in water cycle Understand reproduction of living things from cells to species Understand cells and functions Understand human impact on environment and ways to improve
ICLE Curriculum SurveyScience - Top 10 Topics
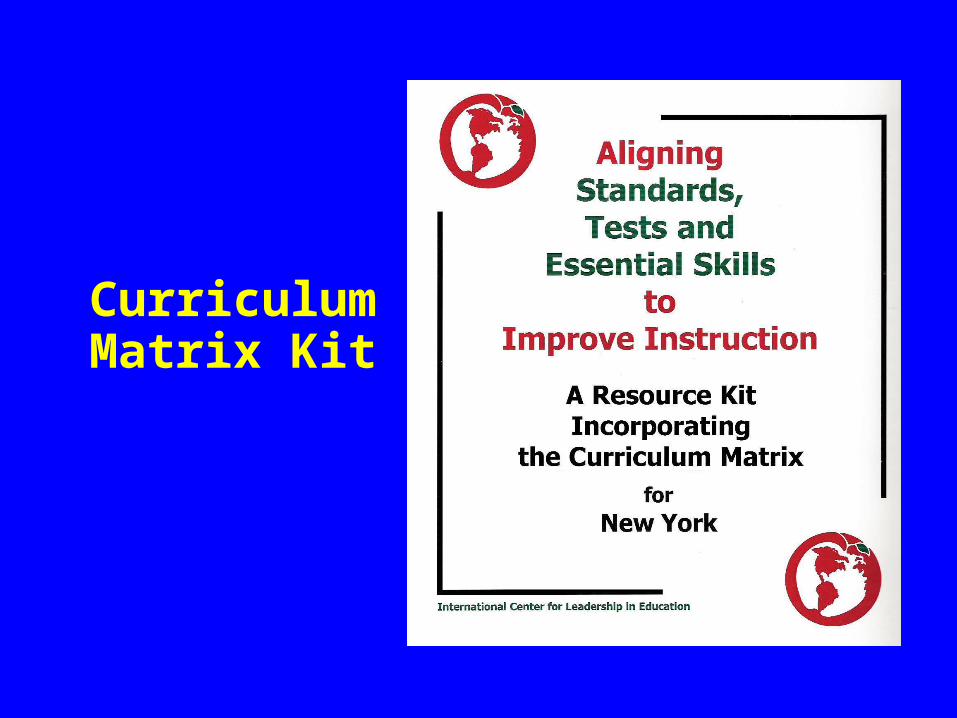
Curriculum Matrix Kit

Curriculum MatrixState StandardRelated Essential
Skills and priority
Priority on State Test
Overall Priority

Summary
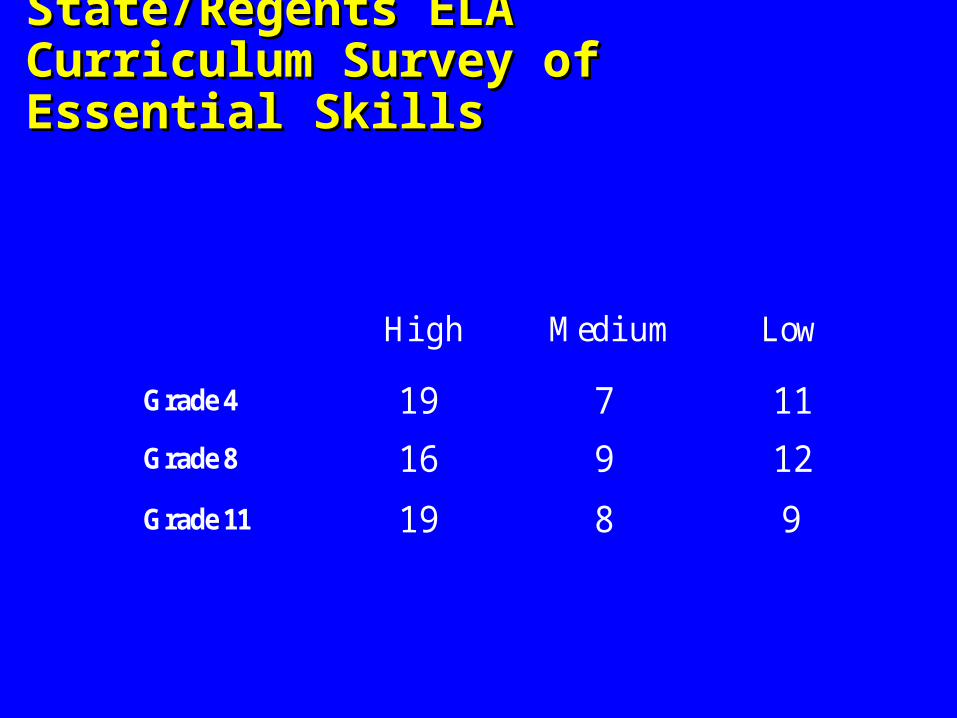
State/Regents ELAState/Regents ELACurriculum Survey of Essential SkillsCurriculum Survey of Essential Skills
High Medium Low
Grade 4 19 7 11
Grade 8 16 9 12
Grade 11 19 8 9
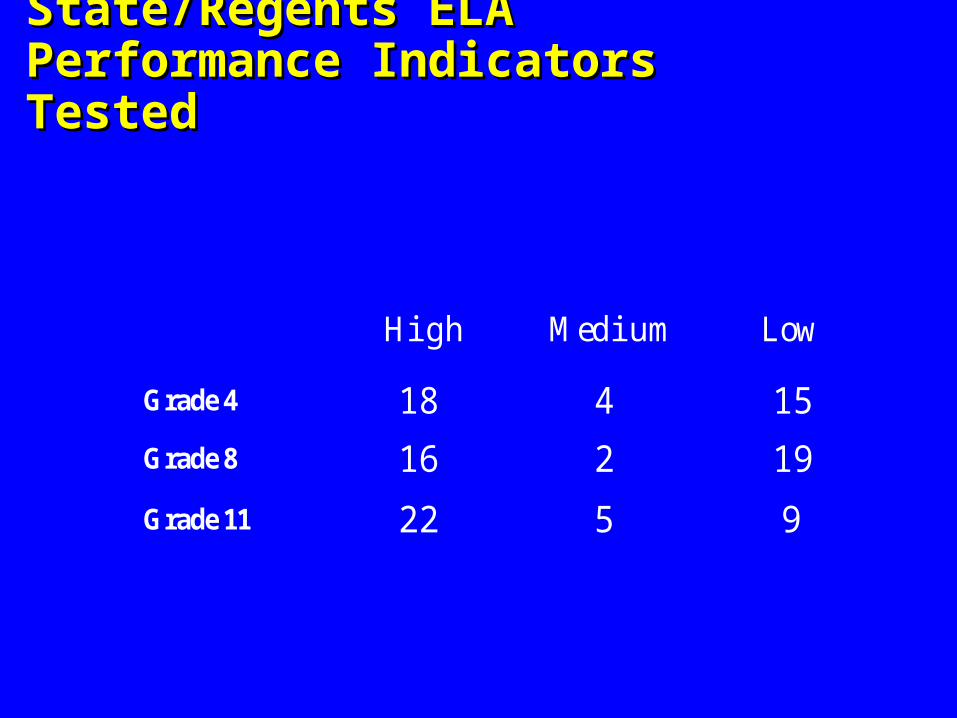
State/Regents ELAState/Regents ELAPerformance Indicators TestedPerformance Indicators Tested
High Medium Low
Grade 4 18 4 15
Grade 8 16 2 19
Grade 11 22 5 9
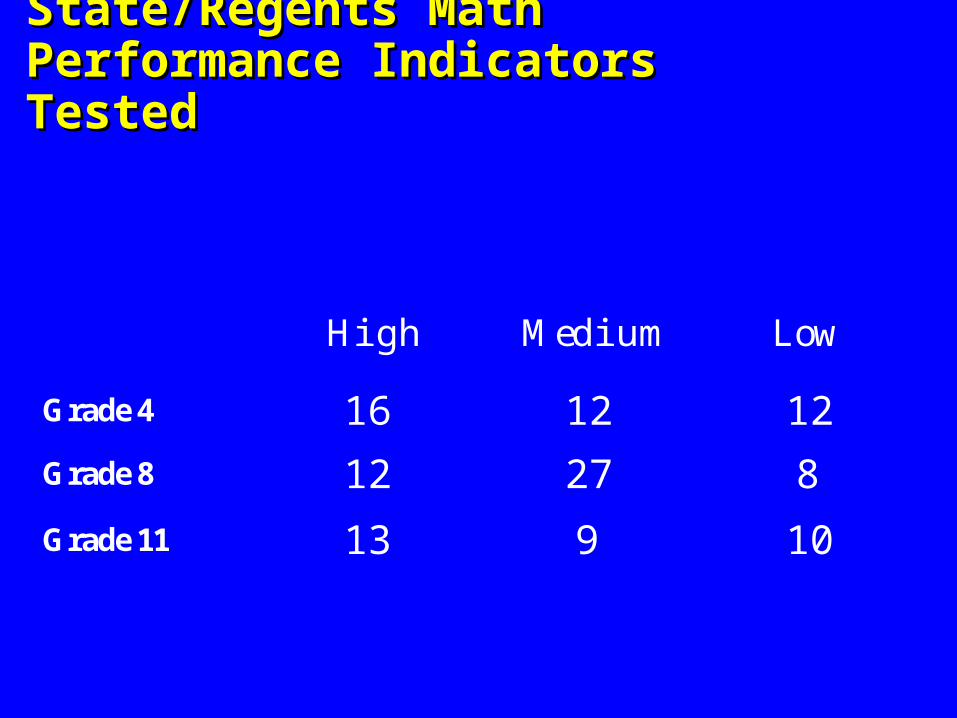
State/Regents MathState/Regents MathPerformance Indicators TestedPerformance Indicators Tested
High Medium Low
Grade 4 16 12 12
Grade 8 12 27 8
Grade 11 13 9 10

State/Regents ScienceState/Regents SciencePerformance Indicators TestedPerformance Indicators Tested
High Medium Low
Grade 4 23 8 4
Grade 8 43 3 30
Earth Science 39 16 3
Biology 29 0 0
Chemistry 4 18 26
Physics 4 19 22

International Center for International Center for Leadership in Education, Inc.Leadership in Education, Inc.
Career and Technical Career and Technical EducationEducation
CTE Kit components
DataPriority standardsIntegration by Cluster
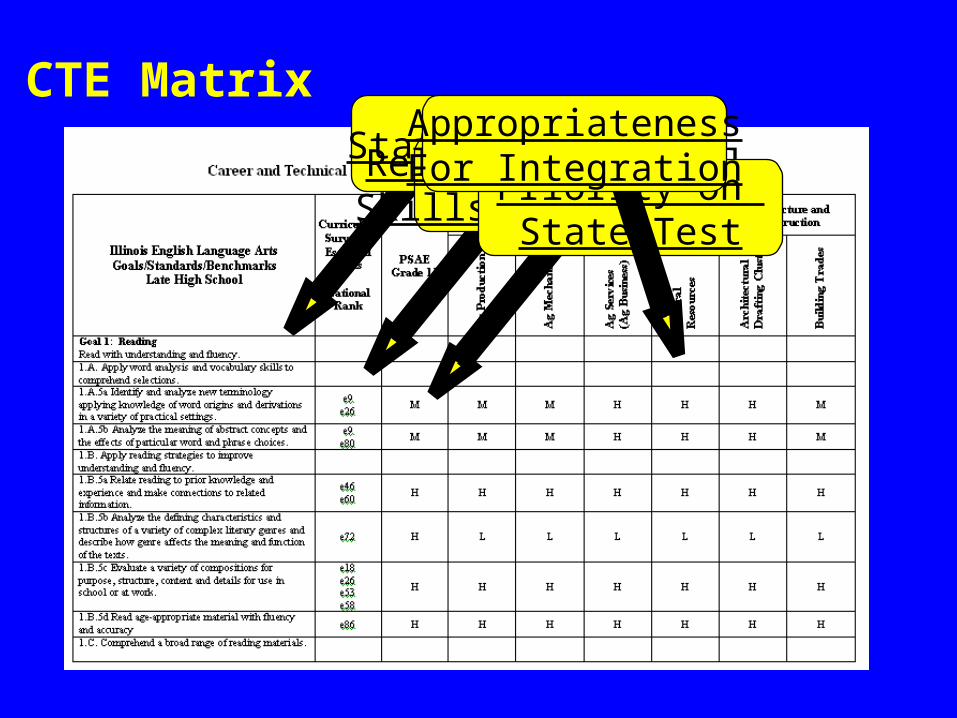
CTE MatrixState StandardRelated Essential
Skills and priorityPriority on State Test
AppropriatenessFor Integration
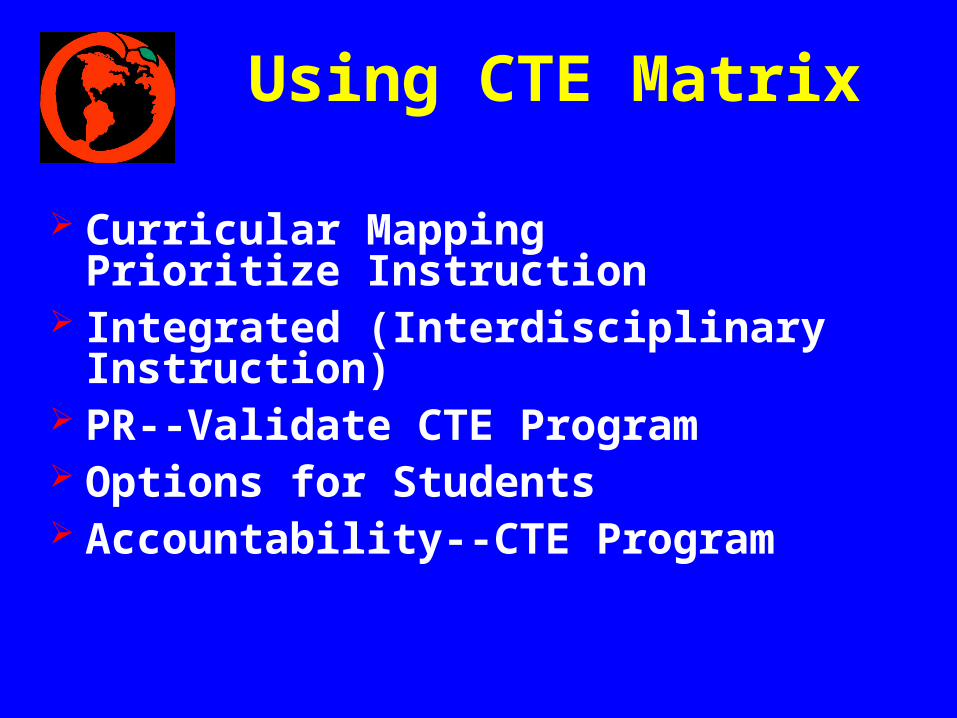
Using CTE Matrix
Curricular Mapping Prioritize Instruction
Integrated (Interdisciplinary Instruction) PR--Validate CTE Program Options for Students Accountability--CTE Program

International Center for International Center for Leadership in Education, Inc.Leadership in Education, Inc.
ARTSARTS
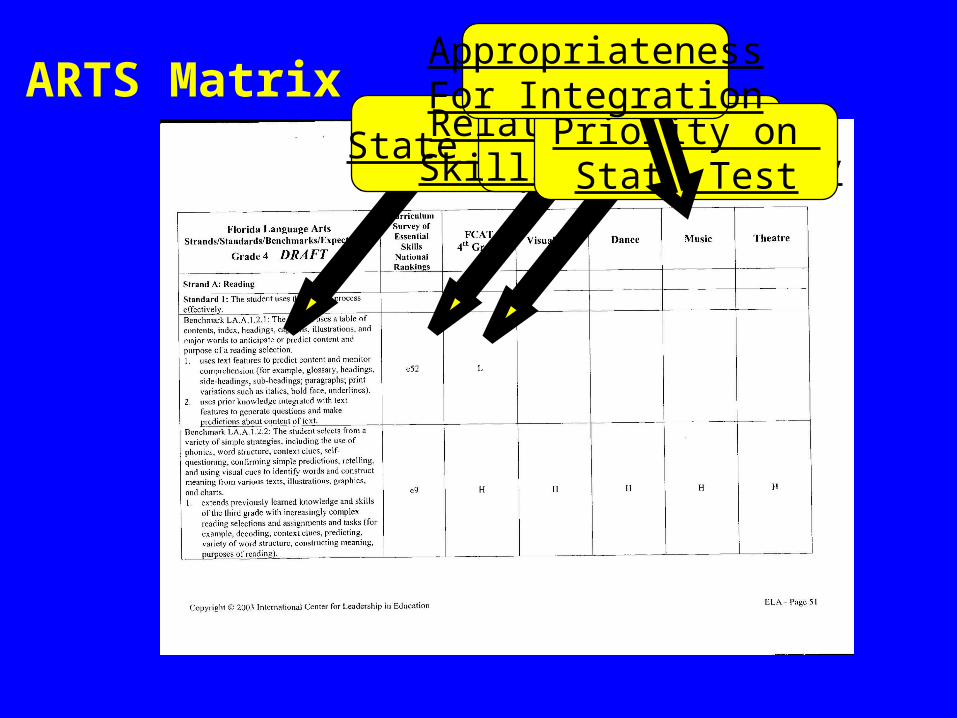
ARTS MatrixState Standard
Related Essential Skills and priority
Priority on State Test
AppropriatenessFor Integration

How would you use this data?

Options
Adding Rigor and Relevance to your instruction
Theme-based Units taught by multiple teachers
Including other Standards in your instruction

RigorRelevanceAll students

Rigor/Relevance Rigor/Relevance FrameworkFramework
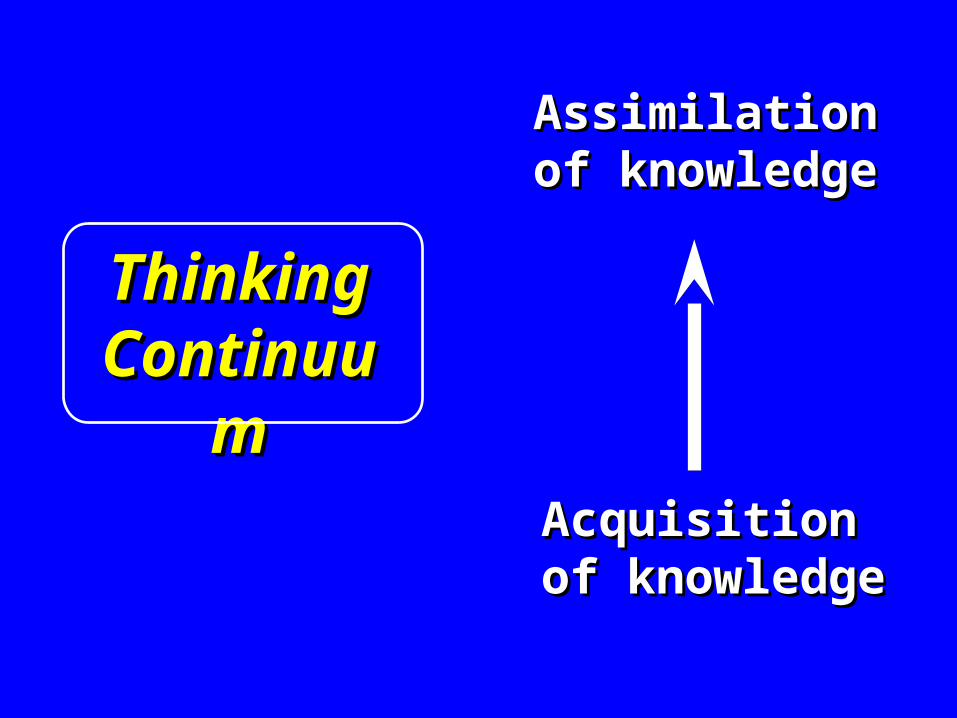
AssimilationAssimilationof knowledgeof knowledge
Acquisition Acquisition of knowledgeof knowledge
Thinking Thinking ContinuumContinuum

1.1. AwarenessAwareness2.2. Comprehension Comprehension 3.3. ApplicationApplication4.4. AnalysisAnalysis5.5. Synthesis Synthesis 6.6. EvaluationEvaluation
Knowledge TaxonomyKnowledge Taxonomy
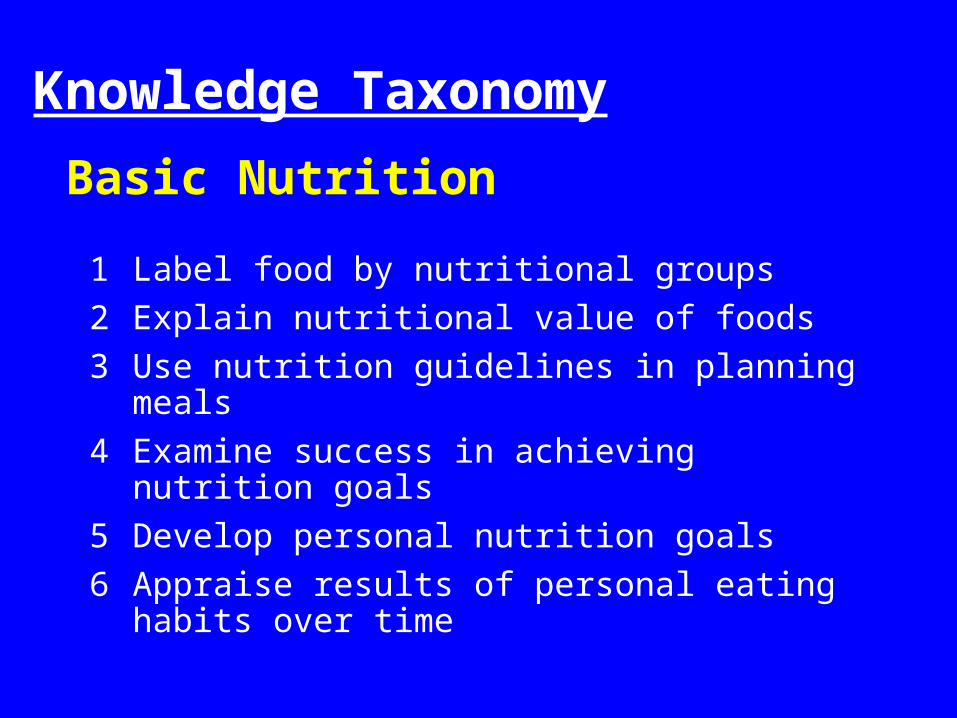
Basic Nutrition
1 Label food by nutritional groups 2 Explain nutritional value of foods3 Use nutrition guidelines in planning meals4 Examine success in achieving nutrition
goals5 Develop personal nutrition goals6 Appraise results of personal eating habits
over time
Knowledge Taxonomy

Application Application ModelModel
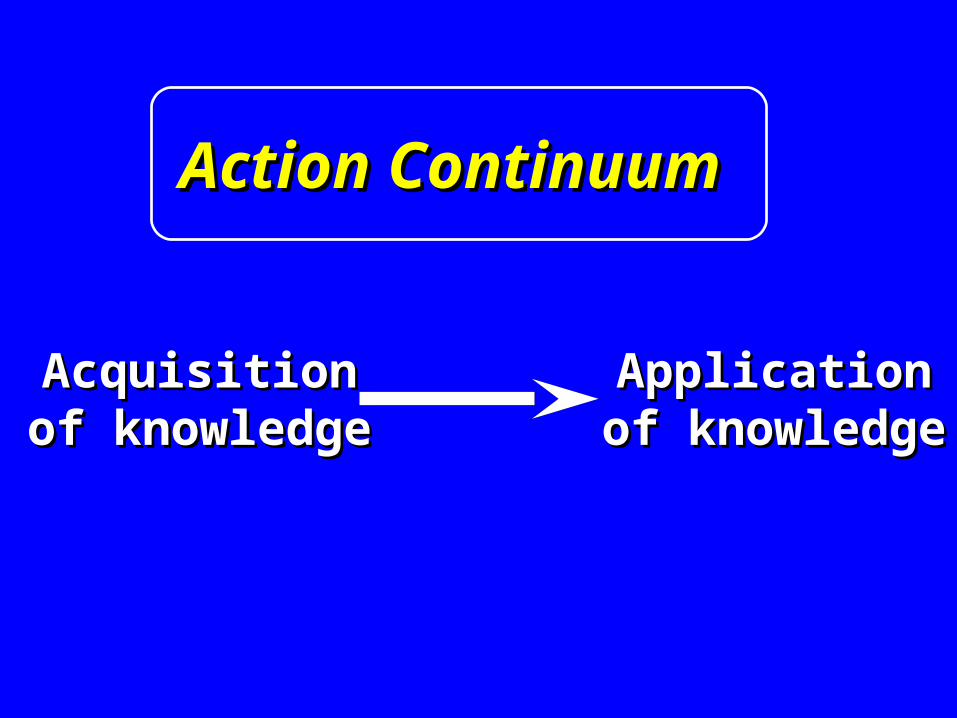
AcquisitionAcquisitionof knowledgeof knowledge
ApplicationApplicationof knowledgeof knowledge
Action ContinuumAction Continuum

Application Model
1 Knowledge of one discipline2 Application within discipline3 Application across disciplines4 Application to real-world
predictable situations5 Application to real-world
unpredictable situations
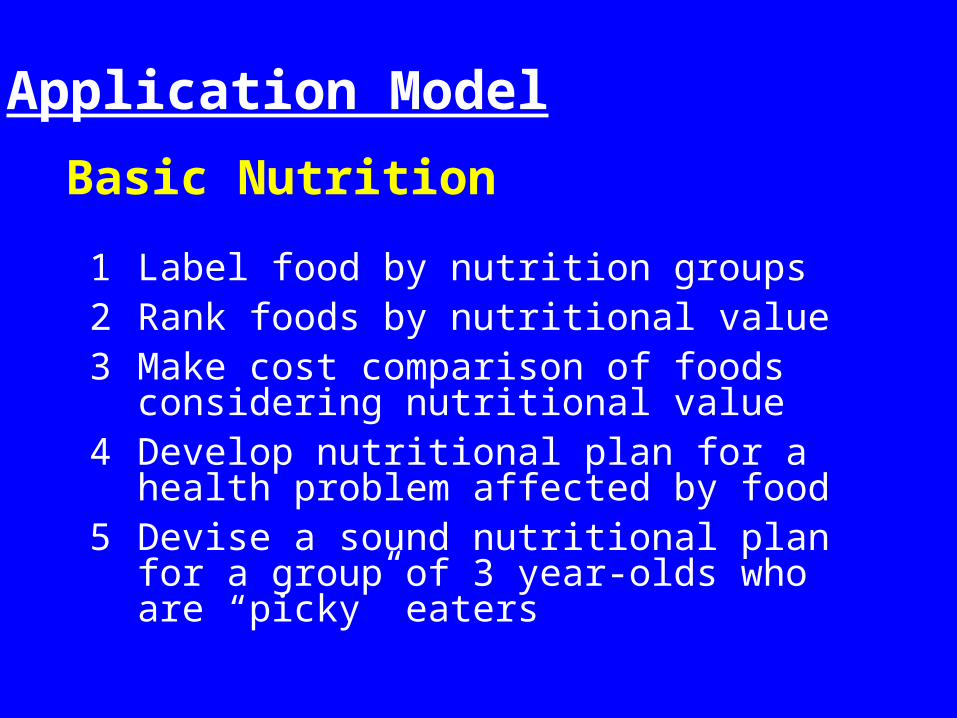
Basic Nutrition
1 Label food by nutrition groups 2 Rank foods by nutritional value3 Make cost comparison of foods
considering nutritional value4 Develop nutritional plan for a health
problem affected by food5 Devise a sound nutritional plan for a
group of 3 year-olds who are “picky” eaters
Application Model

1 2 3 4 5
ApplicationApplication
KnowledgeKnowledge
1
2
3
4
5
6
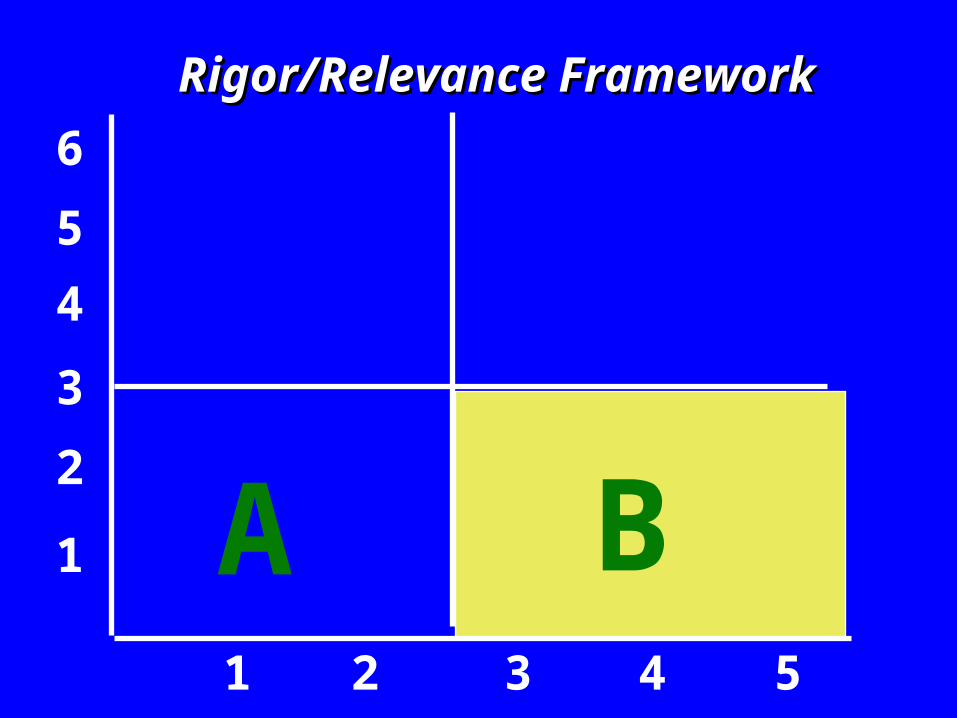
Rigor/Relevance FrameworkRigor/Relevance Framework

1
2
3
4
5
6
1 2 3 4 5
Rigor/Relevance FrameworkRigor/Relevance Framework

1
2
3
4
5
6
1 2 3 4 5
A
Rigor/Relevance FrameworkRigor/Relevance Framework
1
2
3
4
5
6
1 2 3 4 5
A B
Rigor/Relevance FrameworkRigor/Relevance Framework

1
2
3
4
5
6
1 2 3 4 5
A B
C
Rigor/Relevance FrameworkRigor/Relevance Framework

1
2
3
4
5
6
1 2 3 4 5
A B
DC
Rigor/Relevance FrameworkRigor/Relevance Framework
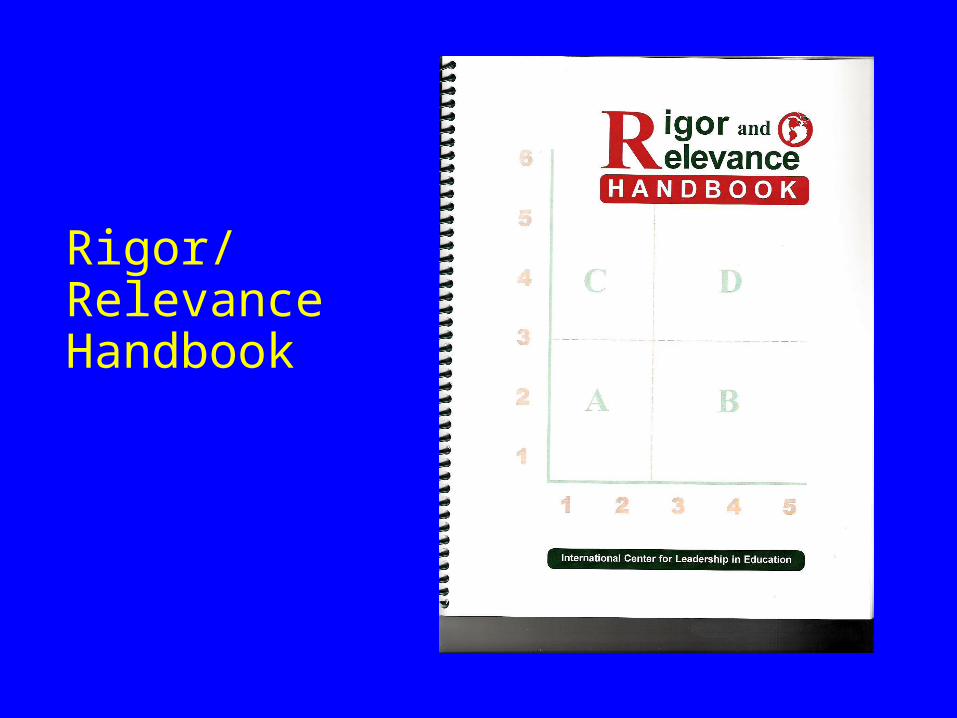
Rigor/ RelevanceHandbook

1
2
3
4
5
6
1 2 3 4 5
A B
DC
Rigor/Relevance FrameworkRigor/Relevance Framework
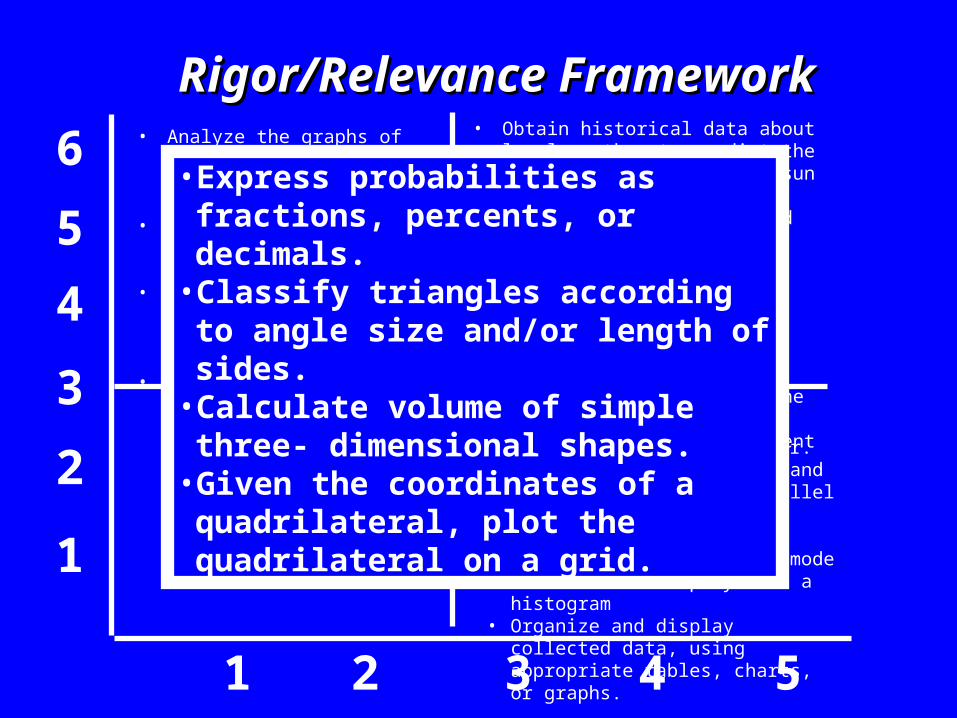
• Express probabilities as fractions, percents, or decimals.
• Classify triangles according to angle size and/or length of sides.
• Calculate volume of simple three- dimensional shapes.
• Given the coordinates of a quadrilateral, plot the quadrilateral on a grid.
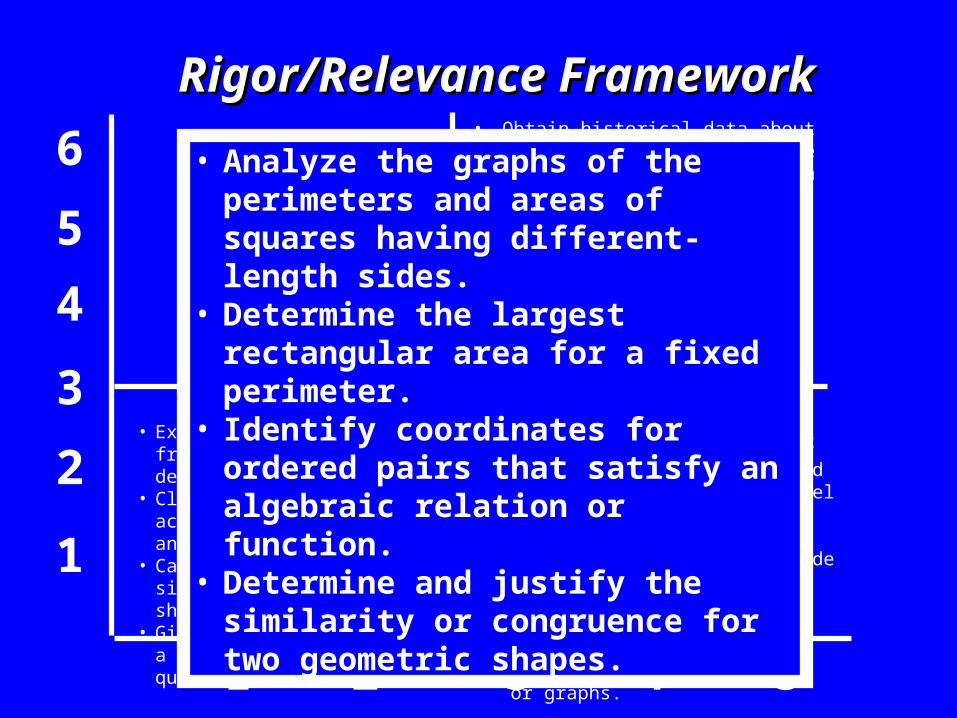
• Analyze the graphs of the perimeters and areas of squares having different-length sides.
• Determine the largest rectangular area for a fixed perimeter.
• Identify coordinates for ordered pairs that satisfy an algebraic relation or function.
• Determine and justify the similarity or congruence for two geometric shapes.
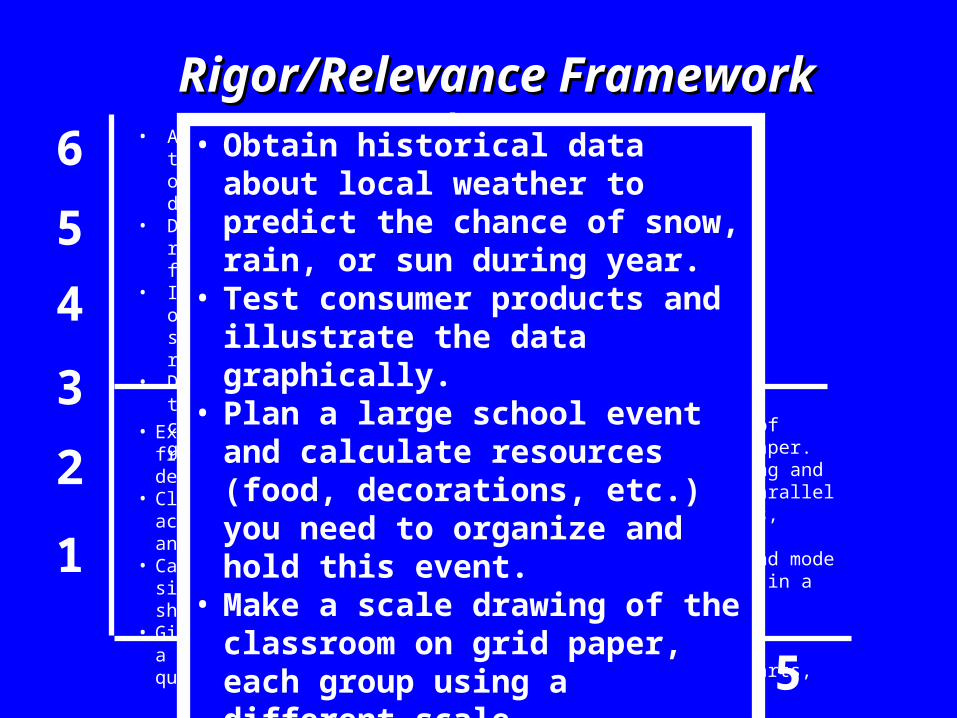
• Obtain historical data about local weather to predict the chance of snow, rain, or sun during year.
• Test consumer products and illustrate the data graphically.
• Plan a large school event and calculate resources (food, decorations, etc.) you need to organize and hold this event.
• Make a scale drawing of the classroom on grid paper, each group using a different scale.
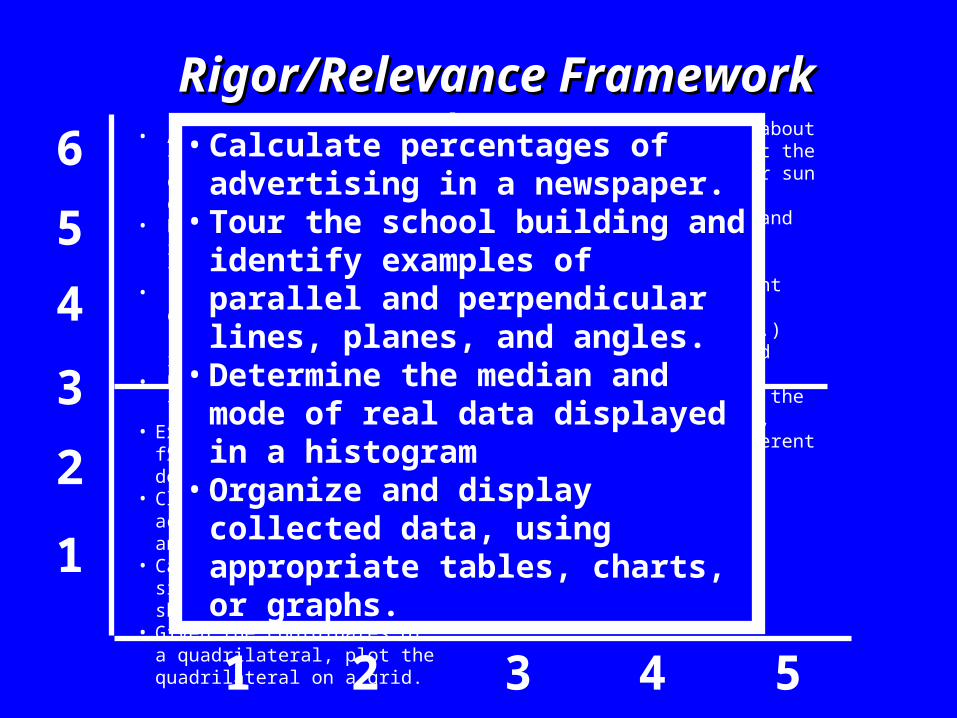
• Calculate percentages of advertising in a newspaper.
• Tour the school building and identify examples of parallel and perpendicular lines, planes, and angles.
• Determine the median and mode of real data displayed in a histogram
• Organize and display collected data, using appropriate tables, charts, or graphs.
1
2
3
4
5
6
1 2 3 4 5
A B
DC
Rigor/Relevance FrameworkRigor/Relevance Framework• Analyze the graphs of the
perimeters and areas of squares having different-length sides.
• Determine the largest rectangular area for a fixed perimeter.
• Identify coordinates for ordered pairs that satisfy an algebraic relation or function.
• Determine and justify the similarity or congruence for two geometric shapes.
• Obtain historical data about local weather to predict the chance of snow, rain, or sun during year.
• Test consumer products and illustrate the data graphically.
• Plan a large school event and calculate resources (food, decorations, etc.) you need to organize and hold this event.
• Make a scale drawing of the classroom on grid paper, each group using a different scale.
• Calculate percentages of advertising in a newspaper.
• Tour the school building and identify examples of parallel and perpendicular lines, planes, and angles.
• Determine the median and mode of real data displayed in a histogram
• Organize and display collected data, using appropriate tables, charts, or graphs.
• Express probabilities as fractions, percents, or decimals.
• Classify triangles according to angle size and/or length of sides.
• Calculate volume of simple three- dimensional shapes.
• Given the coordinates of a quadrilateral, plot the quadrilateral on a grid.
1
2
3
4
5
6
1 2 3 4 5
A B
DC
Rigor/Relevance FrameworkRigor/Relevance Framework
• Express probabilities as fractions, percents, or decimals.
• Classify triangles according to angle size and/or length of sides.
• Calculate volume of simple three- dimensional shapes.
• Given the coordinates of a quadrilateral, plot the quadrilateral on a grid.
• Analyze the graphs of the perimeters and areas of squares having different-length sides.
• Determine the largest rectangular area for a fixed perimeter.
• Identify coordinates for ordered pairs that satisfy an algebraic relation or function.
• Determine and justify the similarity or congruence for two geometric shapes.
• Obtain historical data about local weather to predict the chance of snow, rain, or sun during year.
• Test consumer products and illustrate the data graphically.
• Plan a large school event and calculate resources (food, decorations, etc.) you need to organize and hold this event.
• Make a scale drawing of the classroom on grid paper, each group using a different scale.
• Calculate percentages of advertising in a newspaper.
• Tour the school building and identify examples of parallel and perpendicular lines, planes, and angles.
• Determine the median and mode of real data displayed in a histogram
• Organize and display collected data, using appropriate tables, charts, or graphs.
1
2
3
4
5
6
1 2 3 4 5
A B
DC
Rigor/Relevance FrameworkRigor/Relevance Framework
• Express probabilities as fractions, percents, or decimals.
• Classify triangles according to angle size and/or length of sides.
• Calculate volume of simple three- dimensional shapes.
• Given the coordinates of a quadrilateral, plot the quadrilateral on a grid.
• Obtain historical data about local weather to predict the chance of snow, rain, or sun during year.
• Test consumer products and illustrate the data graphically.
• Plan a large school event and calculate resources (food, decorations, etc.) you need to organize and hold this event.
• Make a scale drawing of the classroom on grid paper, each group using a different scale.
• Calculate percentages of advertising in a newspaper.
• Tour the school building and identify examples of parallel and perpendicular lines, planes, and angles.
• Determine the median and mode of real data displayed in a histogram
• Organize and display collected data, using appropriate tables, charts, or graphs.
• Analyze the graphs of the perimeters and areas of squares having different-length sides.
• Determine the largest rectangular area for a fixed perimeter.
• Identify coordinates for ordered pairs that satisfy an algebraic relation or function.
• Determine and justify the similarity or congruence for two geometric shapes.
1
2
3
4
5
6
1 2 3 4 5
A B
DC
Rigor/Relevance FrameworkRigor/Relevance Framework
• Express probabilities as fractions, percents, or decimals.
• Classify triangles according to angle size and/or length of sides.
• Calculate volume of simple three- dimensional shapes.
• Given the coordinates of a quadrilateral, plot the quadrilateral on a grid.
• Analyze the graphs of the perimeters and areas of squares having different-length sides.
• Determine the largest rectangular area for a fixed perimeter.
• Identify coordinates for ordered pairs that satisfy an algebraic relation or function.
• Determine and justify the similarity or congruence for two geometric shapes.
• Calculate percentages of advertising in a newspaper.
• Tour the school building and identify examples of parallel and perpendicular lines, planes, and angles.
• Determine the median and mode of real data displayed in a histogram
• Organize and display collected data, using appropriate tables, charts, or graphs.
• Obtain historical data about local weather to predict the chance of snow, rain, or sun during year.
• Test consumer products and illustrate the data graphically.
• Plan a large school event and calculate resources (food, decorations, etc.) you need to organize and hold this event.
• Make a scale drawing of the classroom on grid paper, each group using a different scale.
Knowledge Knowledge Taxonomy Taxonomy
Verb ListVerb List
ApplicationApplicationModel Model
Decision TreeDecision Tree

Decision Tree
Application Model
International Center for Leadership in Education 1997
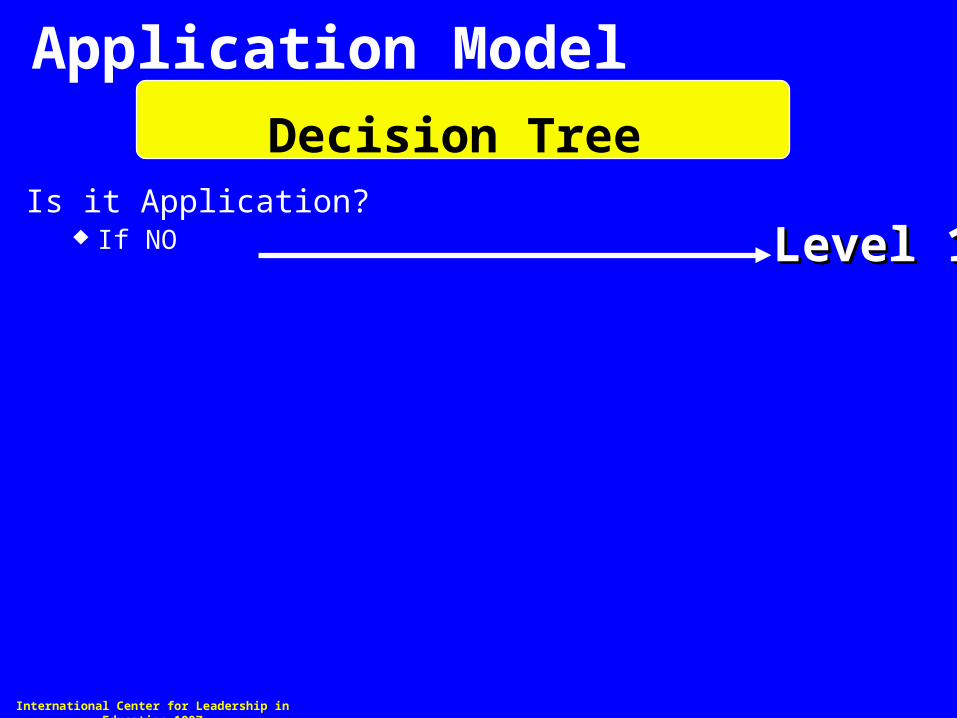
Decision TreeIs it Application?
If NO
Application Model
Level 1Level 1
International Center for Leadership in Education 1997

Decision TreeIs it Application?
If NO
If YES - Is it real world? If NO and one discipline If NO and interdisciplinary
Application Model
Level 1Level 1Level 2Level 2Level 3Level 3
International Center for Leadership in Education 1997

Decision TreeIs it Application?
If NO
If YES - Is it real world? If NO and one discipline If NO and interdisciplinary
If YES - Is it unpredictable? If NO If YES
Application Model
Level 1Level 1Level 2Level 2Level 3Level 3Level 4Level 4
Level 5Level 5
International Center for Leadership in Education 1997
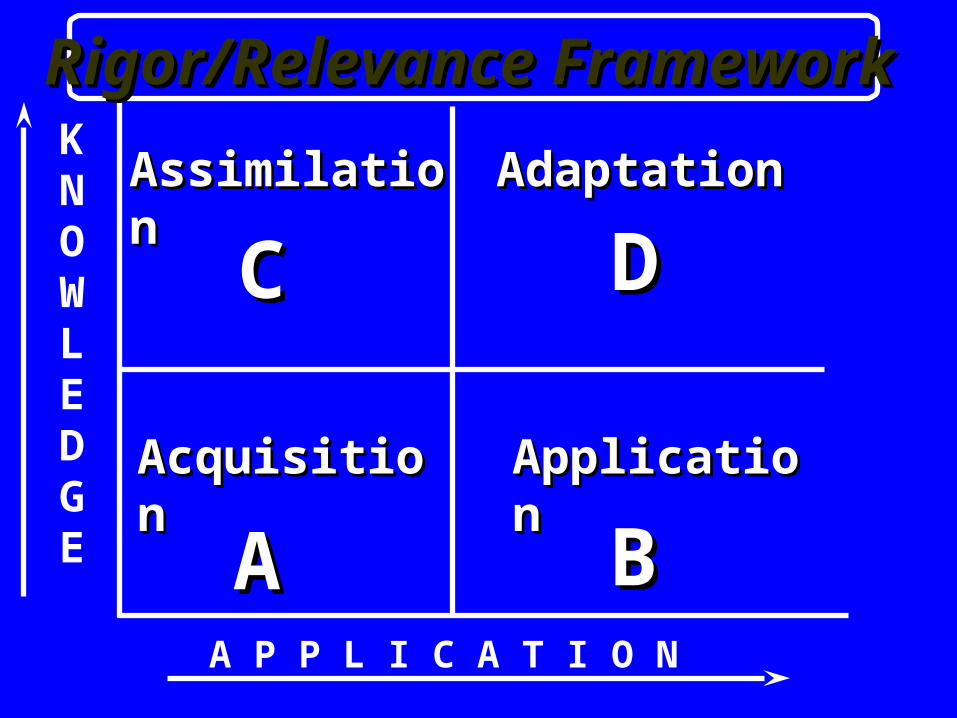
KNOWLEDGE
A P P L I C A T I O N
AA BB
DDCC
AcquisitionAcquisition ApplicationApplication
AdaptationAdaptationAssimilationAssimilation
Rigor/Relevance FrameworkRigor/Relevance Framework

Skill
Identify, collect or sort pertinent information while reading.

Quadrant ARead a science experiment and identify the necessary materials to perform the experiment.
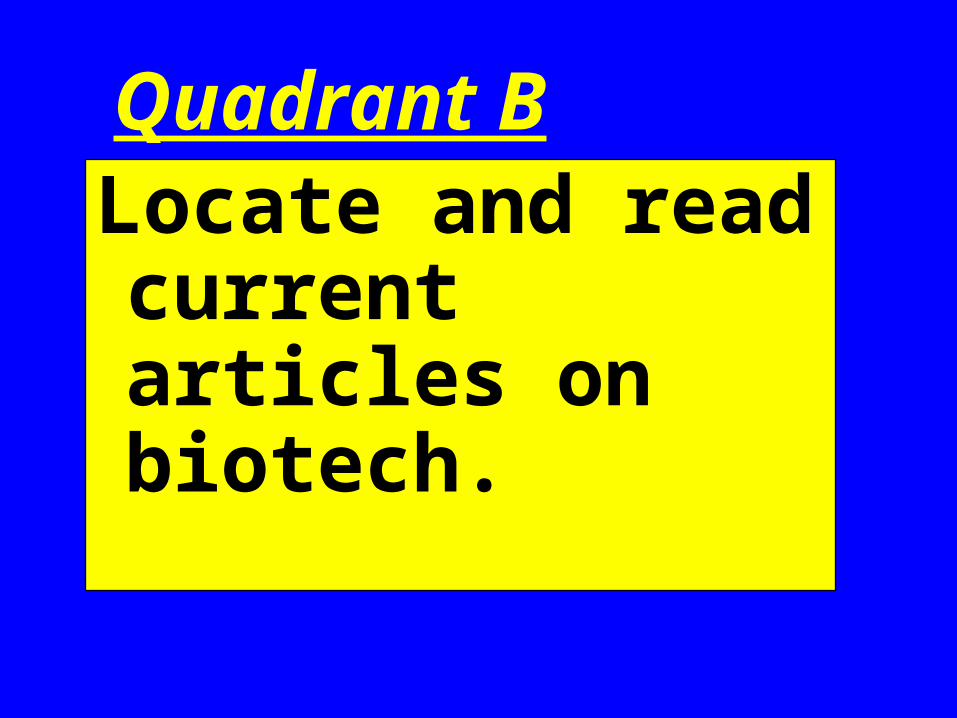
Quadrant BLocate and read current articles on biotech.

Quadrant CRead and analyze 3
original newspaper articles from WW II and identify reasons for opposition to US entry into the war.

Quadrant DRead pertinent information
related to El Nino weather patterns and propose possible summer vacation destinations.
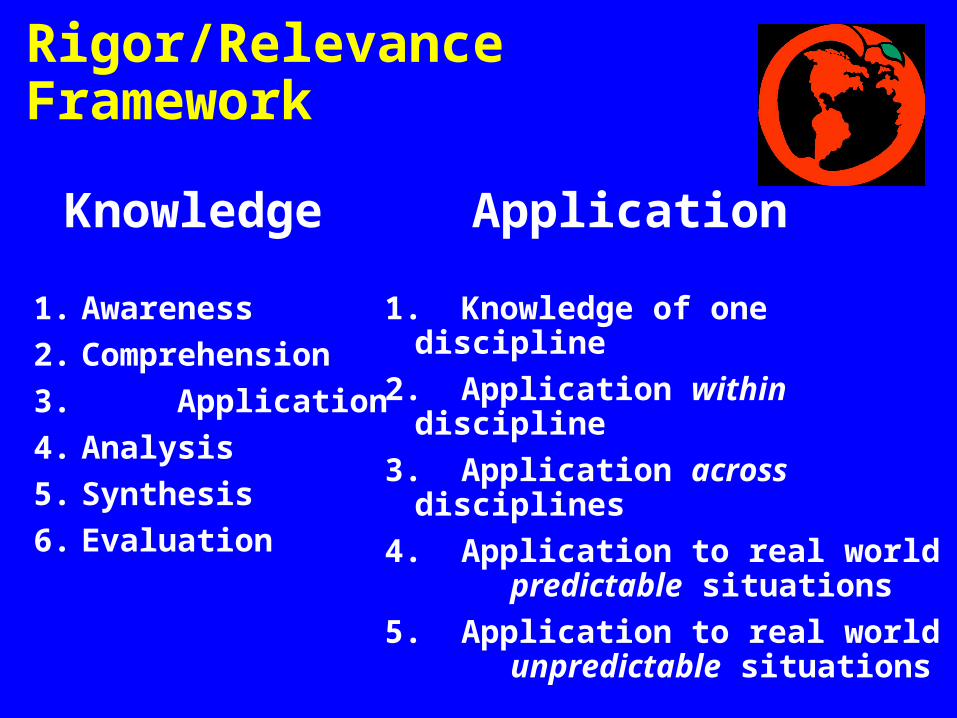
Rigor/Relevance Framework
1. Awareness
2. Comprehension
3. Application
4. Analysis
5. Synthesis
6. Evaluation
1. Knowledge of one discipline
2. Application within discipline
3. Application across disciplines
4. Application to real world predictable situations
5. Application to real world unpredictable
situations
Knowledge Application
Rigorous and Rigorous and Relevant Relevant
AssessmentAssessment
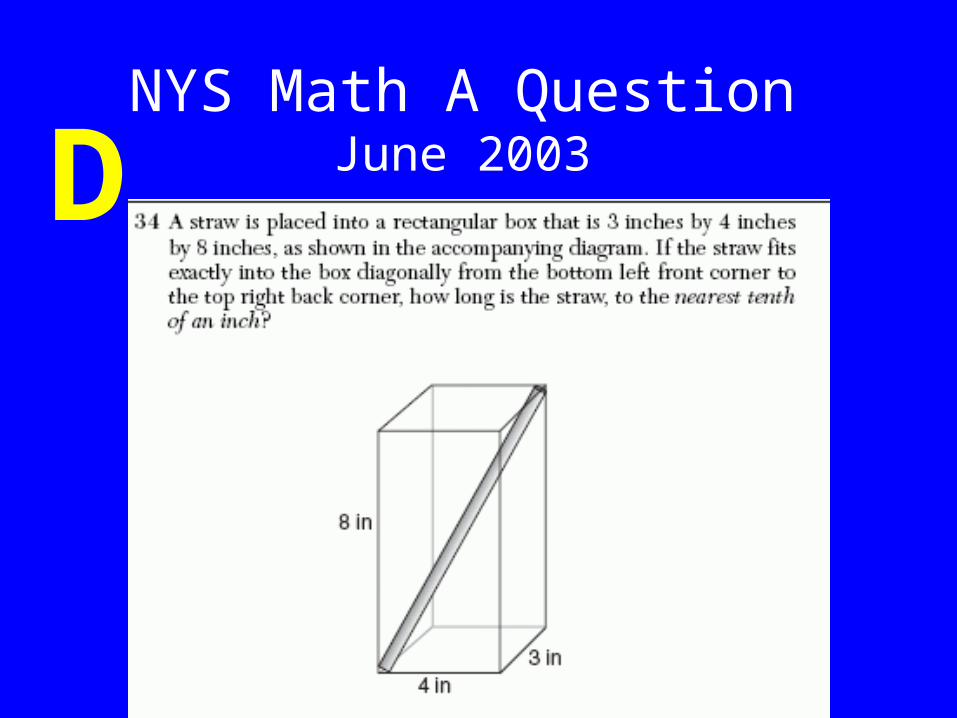
NYS Math A QuestionJune 2003D

NYS Math A QuestionJune 2002C
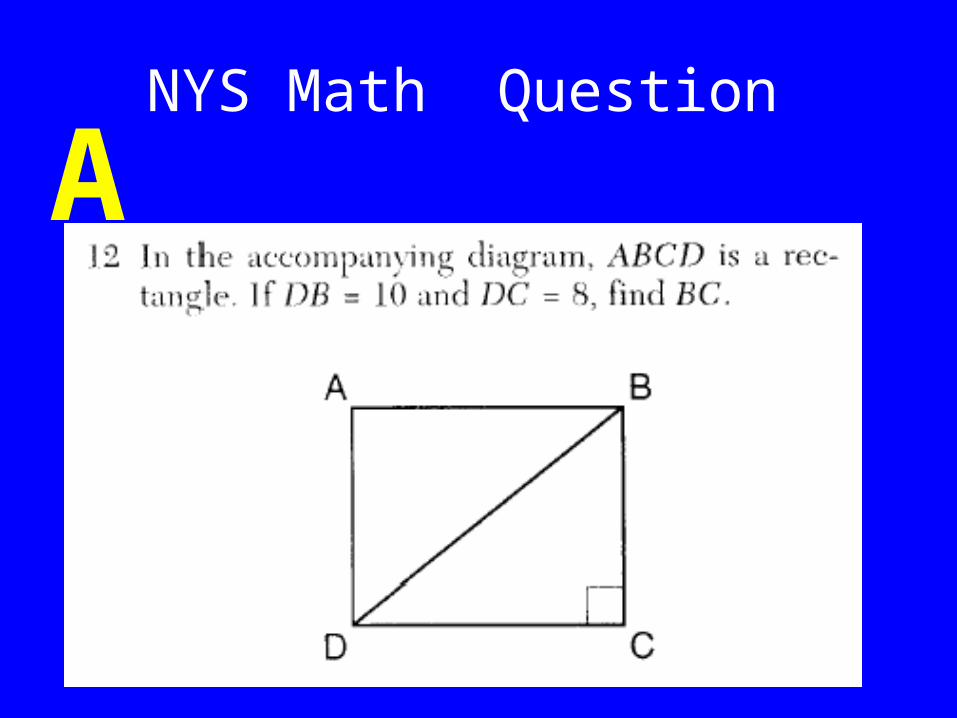
NYS Math Question
A

KNOWLEDGE
A P P L I C A T I O N
AA BB
DDCC
NY Math ANY Math A
26%
42% 10%
22%
KNOWLEDGE
A P P L I C A T I O N
AA BB
DDCC
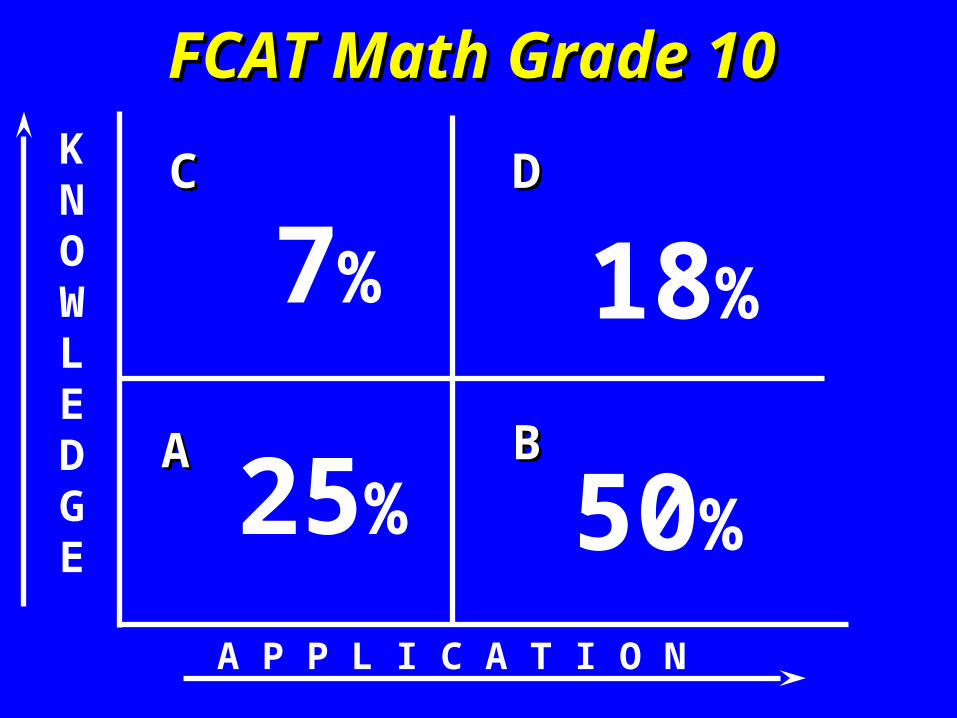
FCAT Math Grade 10FCAT Math Grade 10
7%
25% 50%
18%

R/R and Assessment Determine the level of Rigor and Relevance
on state tests. Develop your tests to parallel state tests when
preparing for them. Use performance assessment when you want
Quadrant D achievement Keep level of assessment consistent with
expectation for performance.
Rigorous and Rigorous and RelevantRelevant
InstructionalInstructionalStrategiesStrategies
Instructional Strategies: How to Teach for Rigor and Relevance

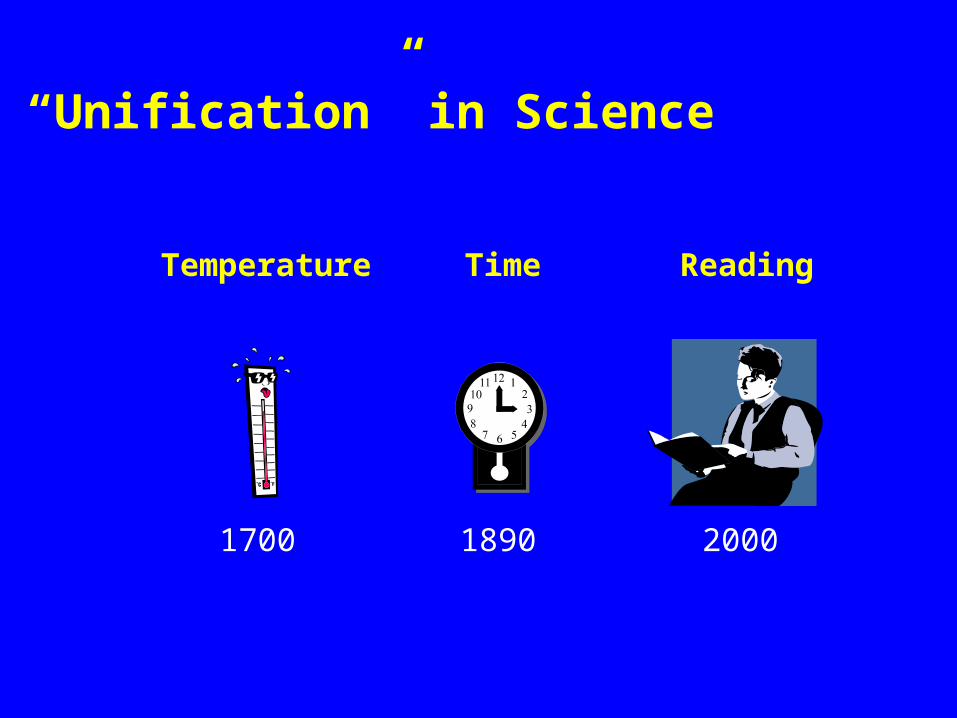
“Unification” in Science
Temperature
1700
Time
1890
Reading
2000
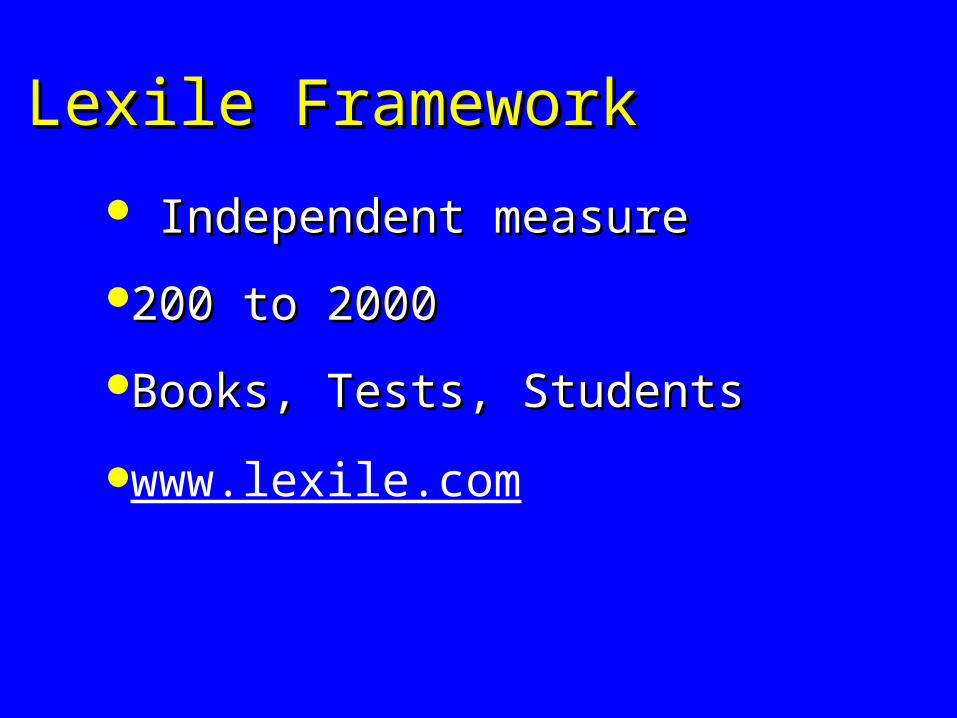
Lexile FrameworkLexile Framework
Independent measureIndependent measure
200 to 2000200 to 2000
Books, Tests, StudentsBooks, Tests, Students
www.lexile.com

Lexile FrameworkLexile Framework
Semantic DifficultySemantic Difficulty
Syntactic ComplexitySyntactic Complexity
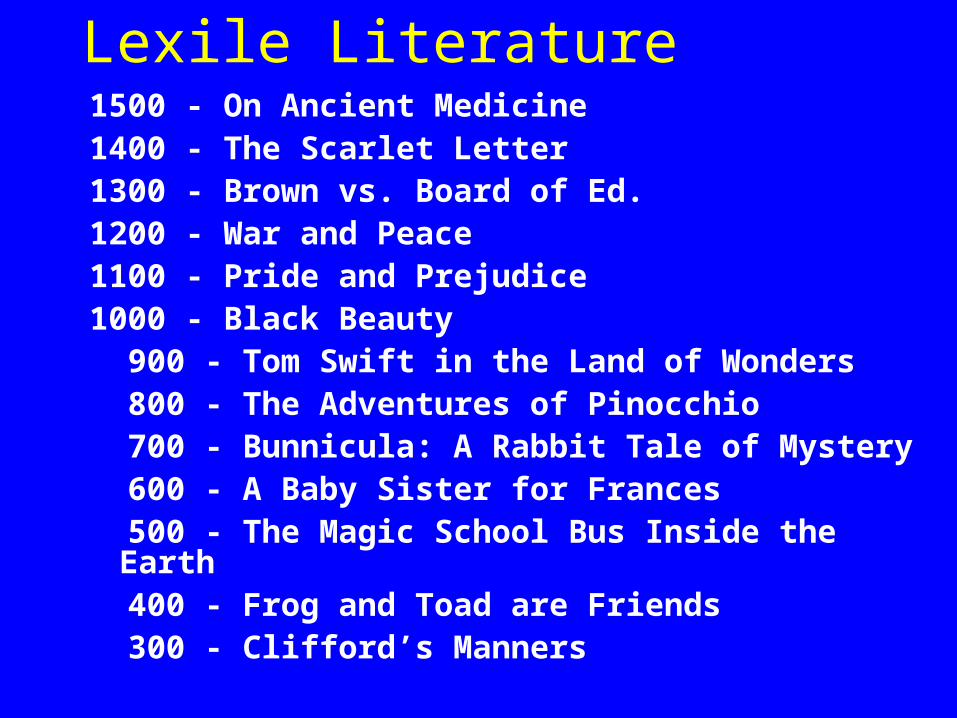
Lexile Literature1500 - On Ancient Medicine1400 - The Scarlet Letter1300 - Brown vs. Board of Ed.1200 - War and Peace1100 - Pride and Prejudice1000 - Black Beauty 900 - Tom Swift in the Land of Wonders 800 - The Adventures of Pinocchio 700 - Bunnicula: A Rabbit Tale of Mystery 600 - A Baby Sister for Frances 500 - The Magic School Bus Inside the Earth 400 - Frog and Toad are Friends 300 - Clifford’s Manners

Last GradeCompletedLa
st G
rade
Com
plet
ed
181716151413121110 9 8 7 6 5 4 3 2
400 600 800 1000 1200 1400 1600 1800
2+3+45
6
7
89
10
11
HS+GEDVocational
College<2
Assoc +>2
BA
Postgrad
••
••
••
••
••
••
•
•
Data: National Adult Literacy Study (1992)
Reader measure (in Lexiles)

Reading Requirements ResearchReading Requirements Research
Analyze actual reading Analyze actual reading materialsmaterials
16 Clusters and sub clusters16 Clusters and sub clusters3 Levels of Workers3 Levels of Workers

Reading Requirements ResearchReading Requirements ResearchAg/Natural Resources 1510Transportation/Distr./Log. 1370Architecture/Construction 1350Manufacturing 1330Retail/Wholesale 1320Business and Admin. 1300Law/Public Safety 1300Scientific Research/Engr. 1260Arts/AV Tech/Comm. 1200Health Services 1200Human Services 1140Information Tech 1100
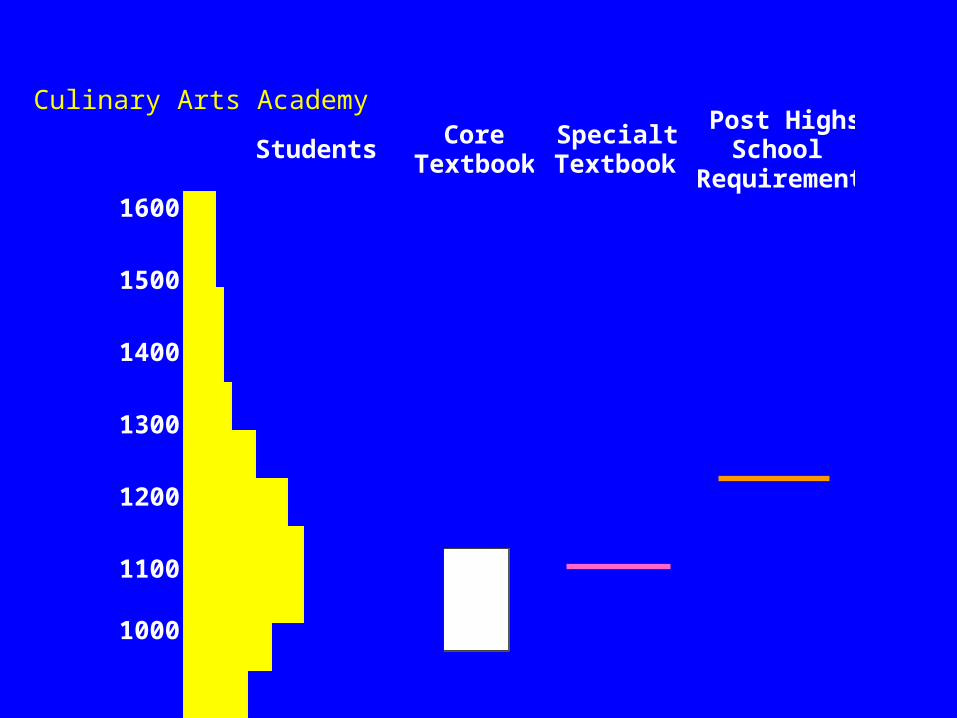
Culinary Arts Academy
Students Core
Textbooks Specialty Textbook
Post Highs School
Requirement 1600
1500
1400
1300
1200
1100
1000 Lexile Range
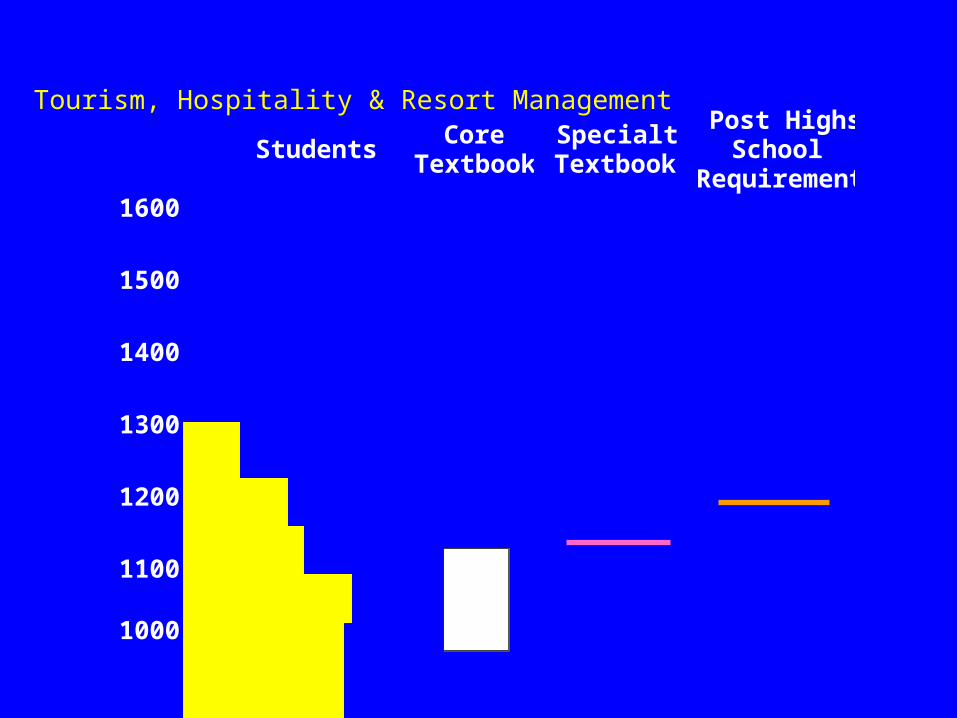
Tourism, Hospitality & Resort Management
Students Core
Textbooks Specialty Textbook
Post Highs School
Requirement 1600
1500
1400
1300
1200
1100
1000 Lexile Range
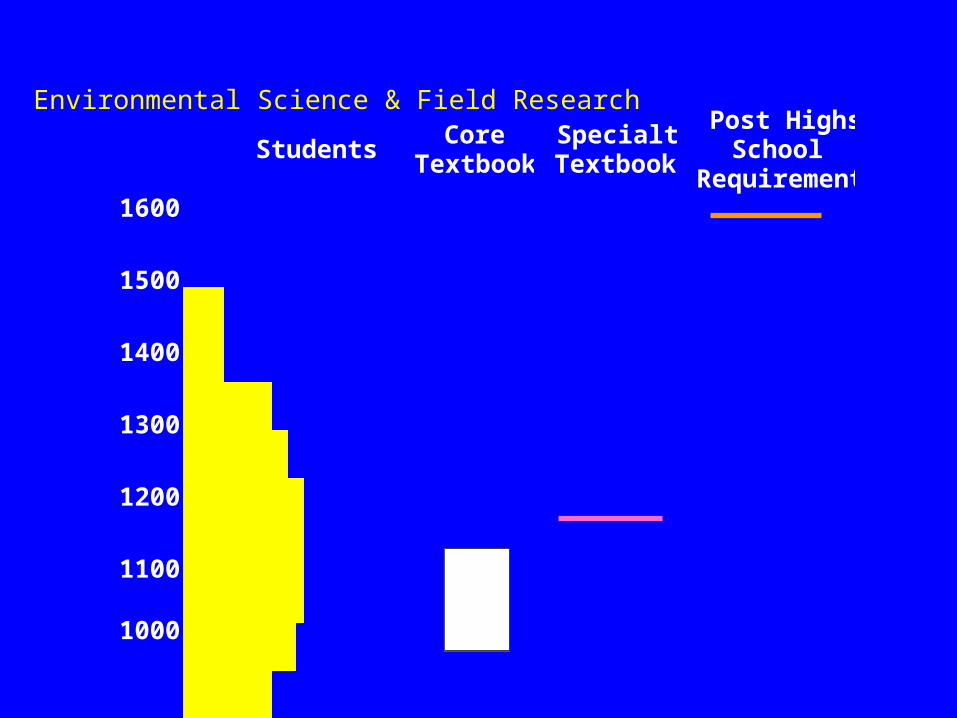
Environmental Science & Field Research
Students Core
Textbooks Specialty Textbook
Post Highs School
Requirement 1600
1500
1400
1300
1200
1100
1000 Lexile Range

International Center for International Center for Leadership in Education, Inc.Leadership in Education, Inc.
DeterminingDeterminingRoot CausesRoot Causes
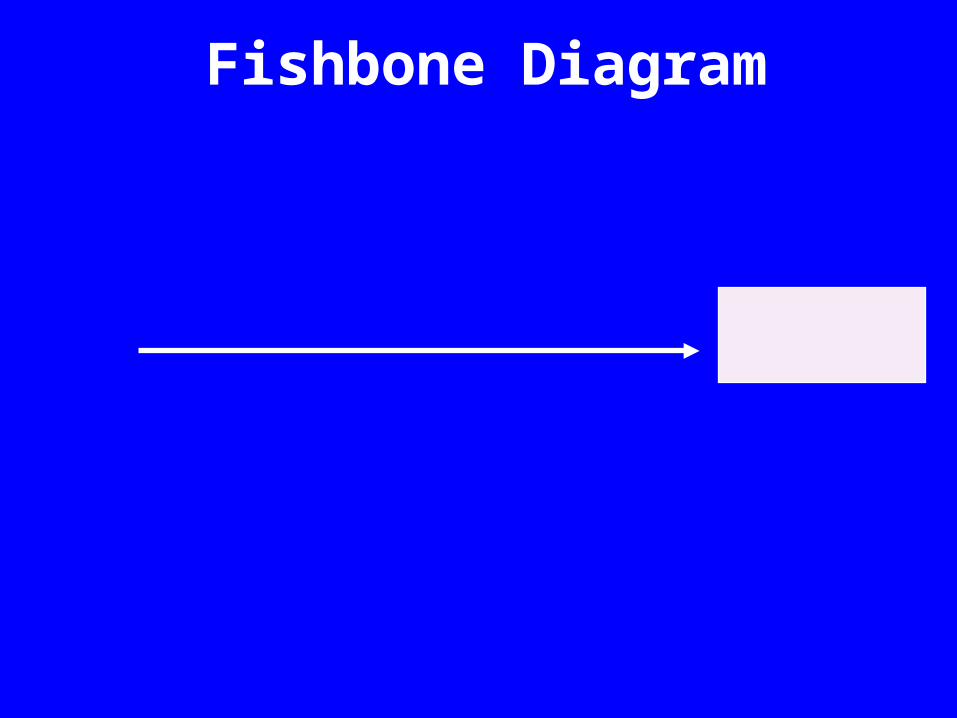
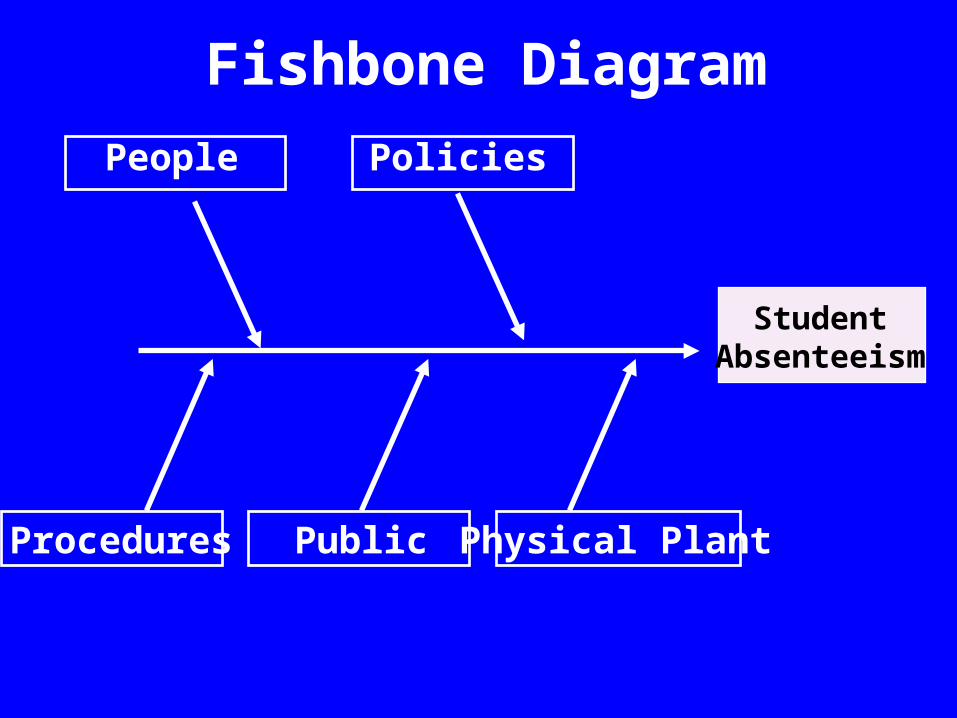
Fishbone Diagram

Fishbone Diagram
StudentAbsenteeism

Fishbone Diagram
StudentAbsenteeism
Fishbone Diagram
StudentAbsenteeism
People
Procedures Public Physical Plant
Policies

Fishbone Diagram
StudentAbsenteeism
People
Procedures Public Physical Plant
Policies
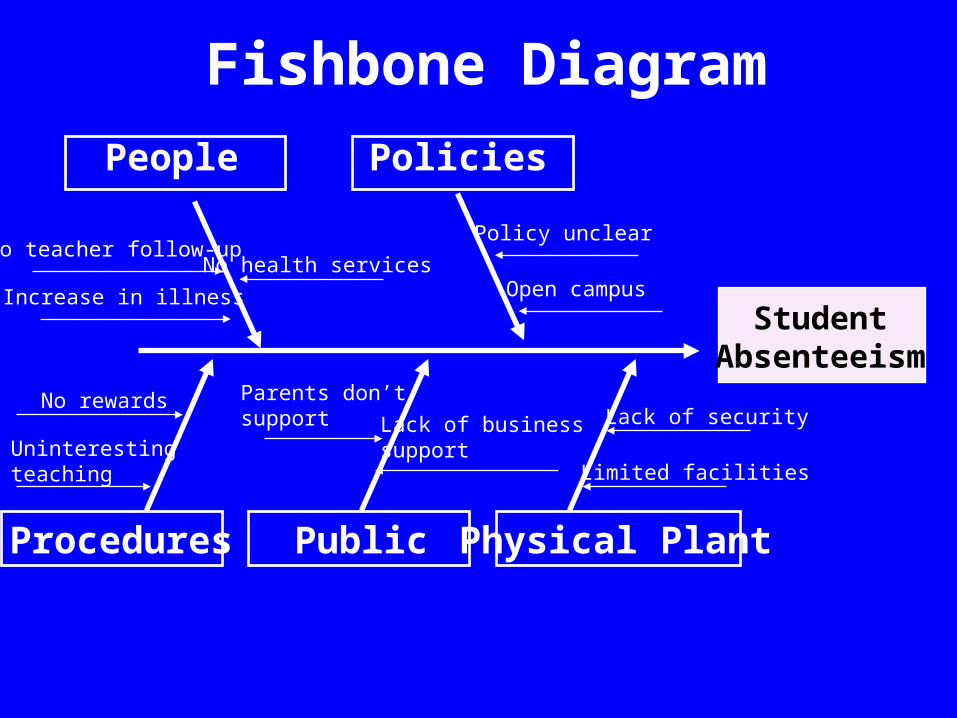
Fishbone Diagram
StudentAbsenteeism
People
Procedures Public Physical Plant
Policies
No teacher follow-up
Increase in illness
Parents don’t support
No rewards
Policy unclear
Lack of business supportUninteresting
teaching
No health servicesOpen campus
Lack of security
Limited facilities
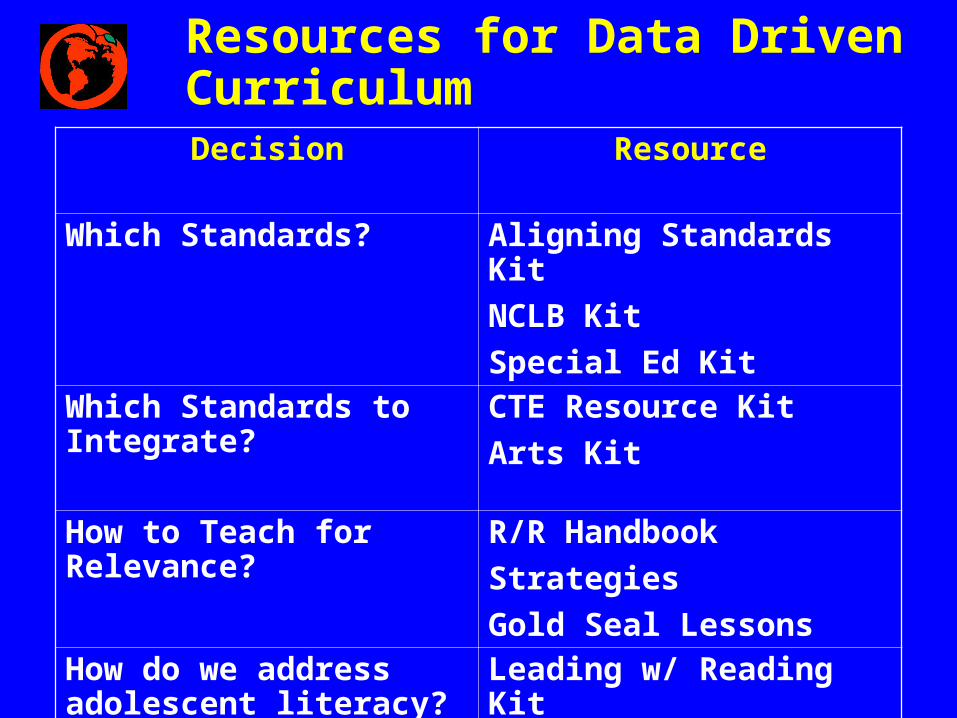
Resources for Data Driven Curriculum
Decision Resource
Which Standards? Aligning Standards Kit
NCLB Kit
Special Ed Kit
Which Standards to Integrate?
CTE Resource Kit
Arts Kit
How to Teach for Relevance? R/R Handbook
Strategies
Gold Seal Lessons
How do we address adolescent literacy?
Leading w/ Reading Kit
Reading in the Content Area

Data References Bernhardt, V. L. The school portfolio toolkit: A
planning, implementation, and evaluation guide for continuous school improvement. Larchmont, NY: Eye On Education. 2002.
Preuss, Paul G. Root Cause Analysis: School Leader’s Guide to Using Data to Dissolve Problems. Larchmont, NY: Eye on Education, 2003.
Love, Nancy. Using Data/Getting Results: A Practical Guide for School Improvement in Mathematics and Science Norwood, MA: Christopher-Gordon Publishers. 2001.
Toolbelt. 10 Feb. 2002 <http://www.ncrel.org/toolbelt/>
COSN <http://3d2know.cosn.org/other.html>.
Data Driven Decisions
Student AchievementStandardsCurriculum and Assessment
Reading