international benchmarking for the information society · international benchmarking for the...
TRANSCRIPT
INTERNATIONAL BENCHMARKING FOR THE INFORMATION SOCIETY
A background paper prepared by
George Sciadas Statistics Canada
for the ITU-KADO Digital Bridges Symposium
Asia Telecom 2004 Busan, Republic of Korea
September 10-11, 2004
International Benchmarking for the Information Society
1
TABLE OF CONTENTS
PART I: CHALLENGES OF OUR TIMES
1. The Information Society……………………………………...2
2. The Digital Divide…………………………………………….3
3. The Issue of Measurements………………………………….5
PART II: MAJOR RESEARCH EFFORTS
4. A Taxonomy of Approaches………………………………....7
5. Internal Country Digital Divides……………………………8
6. International Benchmarking……………………………….12
7. Synoptic Findings…………………………………………...27
PART III: CRITICALLY PLOTTING A COURSE
8. Data Requirements…………………………………………28
9. Critique and Methods……………………………………...29
10. The Way Forward…………………………………………31
References and related bibliography Annex
International Benchmarking for the Information Society
2
INTERNATIONAL BENCHMARKING FOR THE INFORMATION SOCIETY
by George Sciadas
PART 1: CHALLENGES OF OUR TIMES Every era has its challenges. Often times the impacts of such challenges are largely confined within the context of geographically-defined jurisdictions. Only occasionally challenges with limitless scope and widespread impacts arrive in a way that define the evolution of societies globally for a very long time. For the most part, such challenges are technology-related; historians like to refer to them as ‘revolutions’. By all accounts, we are at such a junction today with the set of interrelated Information and Communications Technologies (ICTs). In an increasingly interconnected world, today’s decisions and actions travel through space and time and become critical determinants of the world we live in and humanity’s common future. Many of the economic and societal transformations underway nowadays are ICT-centric, and collectively define what has come to be known as the Information Society. 1. The Information Society Kofi Annan said that the expression Information Society is “…both a description and an aspiration” (WSIS 2003). Initial sensing of the profound importance of the new ICTs and their role in economic development, as well as social re-arrangements, has gradually given rise to more objective and rational efforts at documentation and deeper comprehension of what is involved. While early on the interest came principally from developed countries, one of the most astonishing manifestations of our times has been the explosion of interest around the planet. Literally every corner is aware of what is going on elsewhere and a healthy curiosity has emerged coupled with the quest to understand what it all means and how best to harness these powers for the betterment of economies in need and societies at large. ICT-induced developments have enormous economic implications, as businesses and governments transform every aspect of their supply and demand chains, as well as their internal organization and workings. In the process, every economic variable of interest is affected. The way economic production is organized, distribution of goods and delivery of services takes place, how it all relates to industrial organization, investment, trade and what it means for firm-level performance, including productivity, profitability and even employment arrangements, need to be understood anew, in light of the changes. Thus, the need to study and understand the Information Economy.

International Benchmarking for the Information Society
3
However, the nature of ICTs is such that their usage and impacts extend well beyond the economic domain. They bring about numerous social consequences. New modes of behavior emerge, including new or modified norms of personal communication and interaction. Notions of communities are redefined, family and interpersonal relationships undergo change; so is the scope and nature of participation in the commons. All these phenomena too need to be understood as they impact on social cohesion. Moreover, serious cultural ramifications also come into play. All these, when added to the Information Economy, define the ICT-centric Information Society. All that has come with the realization that the tremendous opportunities offered (albeit they are not automatic) are not devoid of the danger that ICTs can significantly exacerbate the already existing inequalities among ‘haves’ and ‘have-nots’ (G8 2001, 2002). Indeed, developments have been not only fast but asymmetric, something that could potentially have detrimental effects on all. The inequalities associated with access to and use of ICTs have become widely known as the digital divide. 2. The Digital Divide Simply defined as the gap between ICT haves and have-nots, this has been the predominant issue within the whole area of the Information Society during the last decade - and for good reason. As ICTs began to penetrate our lives and the benefits, actual or potential, associated with their usage started to be understood, the undesirability of leaving behind substantial population masses surfaced as a key challenge of our times. Numerous initiatives sprang to identify, profile and help address many issues associated with the digital divide, manifested in countless conferences, symposia, workshops and all sorts of gatherings involving policymakers, businesses and researchers from every discipline and walk of life. The digital divide represents the area of overlap between the economic and social issues of the Information Society. Not only it matters enormously in defining the future of information economies, but it is surrounded by normative overtures regarding the perils of marginalization and social exclusion. ICT-induced benefits extend everywhere, including businesses and governments at large, as well as areas such as health, education and others. For example, massive investments on infrastructures for e-commerce and governments online are taking place; undoubtedly, for the benefits of such activities to materialize fully, the people must come along. This holds true wherever populations can be grouped, certainly both within the context of individual countries and across countries. Indeed, early interest in ICT-related inequalities within countries exploded when the linkages between ICTs and economic development started to be made and untangled. ICTs-for-development has been the driving force behind much recent activity internationally, including the twin World Summits on the Information Society (WSIS) in Geneva (2003) and Tunis (2005).

International Benchmarking for the Information Society
4
As an area of investigation, the digital divide is multi-dimensional and covers a wide range of diverse issues. Some of the approaches have focused on ICT connectivity, with emphasis on infrastructure. Others have been broader in scope, extending to general e-readiness issues, including macro-enabling environments, e-strategies, ICT literacy, skills and training. Echoing many voices, in a recent publication the OECD (2004) states that the digital divide is progressively shifting from an ‘access’ divide to a more complex ‘use’ divide. Of policy interest has been the magnitude of the digital divide but, more importantly due to the implied corrective actions, its evolution - whether it is closing or widening over time, and at what speed. At a minimum, work on this area requires a combination of subject matter knowledge and statistical expertise. While ICT gaps are also manifested among businesses, whether by sector of activity or firm size, most investigations have focused on people, as if to underscore the social dimension of the challenge. Even there, in reality many issues exist. A proper appreciation of what is involved requires an understanding of the role of at least two important dimensions: individual ICTs, and variable of interest. Each of these results in the delineation of different groupings of people, with different size and other particular characteristics. While there is overlap among such groupings, as the same individual or household can be present in many, it is nonetheless important to bear in mind the specific group examined and the reasons for such examination. There are serious reasons related to public policies and business strategies why such itemization of groups may matter - and the two may well differ. Connecting rural areas at ‘reasonable’ cost is non-trivial - especially when broadband is concerned; the use of the Internet by females of a certain age is not insignificant in the deployment of specific online services and the associated business investments. Clearly, even on the basis of these two dimensions alone, analyses of digital divides can be complex. Statistics can support instructive analyses of this type and separate reality from hyperbole. Within countries, they capture the actual time-paths needed for certain levels of penetration to be reached among ICTs - and, indeed, compare them to non-ICT commodities. A spherical view of the digital divide requires the explicit recognition of these dimensions - the specific ICT and its idiosyncrasies, including the timing of its introduction, and the variable of interest that leads to the delineation of groupings of people. Across countries, reliable statistics and their meaningful syntheses can yield results useful for the identification of starting points, relative strengths and weakness, and comparative evolution. Then, these can provide valuable input in the design and implementation of policies and business strategies, as well as help assess their impacts.

International Benchmarking for the Information Society
5
3. The issue of measurements Right from the outset it became abundantly clear that a more complete understanding of the multitude of issues involved in the Information Society cannot be had without reliable quantification. This proved, and remains, a formidable hurdle in making a clear and communicable case. At the same time, it is indicative that our times are more demanding and strong quantification of the underlying changes is paramount, as the burden of decisions weighs more heavily. If decision-making, at all levels, is to be guided by ‘informed ignorance’ rather than ‘uninformed arrogance’, relevant, reliable and timely information is needed, together with insightful analyses. While there will always be room for anecdotal accounts, since antiquity humans understand better the reality in which they live through quantification and measurement. After all, the value of information in an Information Society setting should be straightforward. While, occasionally, new research interests emerge, they tend to be chiefly specific to something with rather defined boundaries – an important activity, an industry or a phenomenon. No other area in recent memory has touched everything, across the board, and generated such thirst for interdisciplinary research than the Information Society. A host of questions, and even controversy, have surrounded it, ranging from the economic (macro, with the productivity paradox and micro, with performance), to the social (what it does to the spatial dimension of personal networks), the socio-economic (the digital divide), the political (e-democracy) and beyond. In order to address such issues, basic information is initially needed. Particularly when the insignificant is blown out of proportions by popular hype or vested interests, pragmatic measurements are indispensable. However, there are many aspects in need of investigation, not all of which are relevant at the same point in time across all countries or communities. Inevitably, things get progressively more complex and the information requirements multiply. Certainly raw data are a problem. These are needed on all fronts, from issues of ICT infrastructure in all its dimensions, to the issue of use and associated skills, and much more. At the same time, though, it also became clear that frameworks that can improve our understanding in a systematic rather than ad hoc ways are needed. Not only these will accommodate and make maximum use of the data (existing and prospective), but they will also form an integral part of the theory-data-analysis loop, feeding back to data gaps with obvious implications for the allocation of resources, the speed of progress and the clarity of communications. While the case for measurements is continuously being made and some progress starts to be discernible, it is acknowledged that the magnitude of the task at hand can be overwhelming. This is more so among many developing countries with not-very-advanced statistical systems. This will suggest that an incremental effort would be in the offing.

International Benchmarking for the Information Society
6
With respect to the need for new raw data, the prioritization implied by the S-curve approach has proven very useful in practice (OECD 2000). Broadly speaking, e-readiness indicators are critical at early stages of ICT penetration; they are then followed by indicators of usage (including intensity, intelligence etc.), and; ultimately lead to quantification of outcomes and longer-term impacts. It is understood that different countries will be at different stages of evolution at any given point in time, and thus their main statistical requirements would differ. This, of course, does not prevent in any way the wide and consistent monitoring of a smaller set of ‘core indicators’ that would greatly assist international comparability. It is extremely instructive to take into account that the initial thrust to new measurements for the Information Society was precipitated by user demand. Vocal demand is a necessary prerequisite for measurement efforts, and indispensable to justify the expended energy and resources. The user community includes practically every walk of life. Policymakers and governments of all levels form a very big part of the demand and, in fact, they have been contributors to the developments so far. Their informational needs and requirements must be taken seriously into account when designing new measures. This way, not only the statistical robustness and quality of the data will be there, but their relevance will be assured. International organizations and donors are now in the mist of all kinds of initiatives for the Information Society, as the link between ICTs and development is taking a firm hold. Their information requirements are twofold: first, to assess realistically the relative situation of countries in their basic components, including unequal distributions across and within countries, and; second, to monitor progress and the impact of investments over time, as issues of performance and accountability are elevated in importance. Our societies are a living, breathing laboratory for the observation of these phenomena. Our times offer a unique opportunity to examine them and proceed in a way that could set cultural precedents for the future. Although we still are at a relatively early stage, many initiatives are underway. These are examined next.

International Benchmarking for the Information Society
7
PART II: MAJOR RESEARCH EFFORTS Emerging issues, in their early stages, are invariably characterized by a lack of common nomenclature to which most researchers would ascribe. The Information Society was no exception. The extreme level of interest, coupled with a thirst for ‘answers’, bumped against the lack of recognized conceptual underpinnings, definitional hurdles and data gaps. As a result, well-meaning researches co-existed with conjectural allegations unsupported by statistical evidence along blurred boundaries. As a corollary, some confusion ensued compromising the interpretability and policy applicability of the findings. It takes time to focus on issues with wide-ranging ramifications and develop a common understanding. While expert users have an advantage in establishing a perspective and deciphering among conflicting messages, it is incumbent upon the research community to work harder and make the case. 4. A taxonomy of approaches Early work took on matters of the information economy, with emphasis on the macro. The effects of ICTs on productivity and growth aggregates were examined, as they diffused widely beyond the ICT sector. In parallel, the arrival of the Internet in its commercial incarnation spurred all kinds of research across disciplines. Much research targeted industrial aggregates (i.e. the ICT sector, health, education) or emerging phenomena (e-commerce is a well-known example), while other efforts followed a sectoral approach, scrutinizing connectivity among households, business and governments. Some research has been theoretical in its thrust, but there have been many variants empirical in nature, with strong quantitative components. Substantial energy has been devoted to the policy-oriented issues of e-readiness and/or competitiveness at large, frequently combined with assessments of competition regimes, as well as legal and regulatory environments. Yet, other thematic approaches have been more focused, such as those relating to the digital divide. While there is substantial overlap between such investigations, they are different. Consequently, their results, whether conflicting or seemingly similar, should not be compared. The area of the digital divide did surface as a distinct area of investigation, and concepts, definitions, methodologies and analytical techniques have gradually been developed. Within the digital divide literature, generally two strands of studies have emerged: one examines divides internal to a country, and another involves cross-country comparisons. However, the two strands are closely linked, as issues of the digital divide are applicable wherever groups of people are concerned. Since work on digital divides internal to countries preceded work involving international comparisons, it is imminently sensible that approaches used and lessons learned are taken into account, even though the precise methodological techniques may well differ.

International Benchmarking for the Information Society
8
5. Internal country digital divides Measurements started around the mid 1990s and their initial focus was on connectivity. Penetration rates of new and older ICTs were used to highlight the gaps among groups of people, whether by socio-economic, geographic or other characteristic. The first notable quantification came from the “Falling through the Net: A Survey of the ‘Have-Nots’ in Urban and Rural America” in the U.S. (1995). This was followed by work in Canada and elsewhere. Of interest were the inequalities among groups of people delineated by variables deemed to be important determinants of access to and use of ICTs, such as income, education, age, gender, as well as others of specific interest to individual countries, e.g. race in the U.S.. The OECD carried out substantial work of a comparative nature, based on syntheses of country member statistics (2001a,b, 2002), as data were developed in more countries. Typically, the magnitude of internal country digital divides was addressed first. It has been measured by the difference in penetration rates among groups of interest, defined by income (whether average income level, income brackets or percentiles), educational attainment, age, gender, geographical location (urban-rural, etc.) and even family type (presence of children or not). These have been key issues of policy interest both in developing and developed countries. Another measure used to quantify the magnitude of the digital divide has been the ratios of the penetration rates – whether among high- and low-income or other groups. With reference to the Internet, for instance, this measure was then interpreted as the ‘likelihood’ of being connected. In the case of perfect equality, the ratio would be 1; the greater the number, the greater the divide. Analyses based on differences in ICT penetration among groups of people provided solid evidence of inequalities, particularly among the newest technologies, especially the Internet. One of the lessons learnt, however, is that such conclusions cannot be generalized outside the specific groups examined, as they are subject to several qualifications and caveats. Blanket statements with regards to the digital divide at large, are not substitutes for differences specific to particular ICTs and well-defined groups. While there is theoretical justification for the differences in penetration rates as a divide measure, this is not the case for the ratios - something that becomes particularly obvious when analyses of the evolution of the divide are concerned. There it can lead to contrary conclusions, and therefore confusing policy messages, as is the case with analyses that rely on the rates of growth. Initial examinations of the more important policy question concerning the evolution of the divide were based on the changes in the differences in penetration rates among groups between time periods (U.S. 1995). Soon, work on the digital divide added rates of growth by group to this type of analysis (Dickinson and Sciadas 1996, 1999), something that was adopted in subsequent work (“Falling through the Net”, U.S. 1998, 1999, 2000

International Benchmarking for the Information Society
9
and its offspring “A Nation Online”, U.S. 2002, OECD 2001a, b, 2002 and elsewhere). Obviously, such measures are computed on the basis of the absolute numbers of users (the numerators of the penetration rates) and not the penetration rates themselves. Although such measures were meant to add to our understanding of trends and gain some appreciation of their underlying speed, they were not meant to be measures of the evolution of the divide. When interpreted as such, they can lead to controversial and confusing conclusions. That is, while the change in penetration rates over time can unveil a widening divide, the rates of growth could well point to the opposite. The methodological details in this area were eventually dealt with, and the conditions involved in the relationship between the evolution of penetration rates and rates of growth, as well as the interplay between absolute and relative magnitudes of the divide, were worked out (Sciadas 2002a, b). That penetration increases with income, for instance, is not specific to ICTs and in any event is hardly newsworthy. Diffusion patterns of new goods and services, technological or otherwise, are gradual. At any given time, the overall penetration rate separates the haves from the have-nots – what the divide purports to measure. This is rather trivial; any higher penetration rate necessarily narrows the divide as there will be more haves and less have-nots from one period to the next, something quite typically observed in diffusion rates. New ICTs have lower penetration early on compared to ICTs that have reached a plateau, and even more so when compared with saturated ICTs. (No wonder the biggest divide was in cell phones and the Internet, where the have-nots exceeded the haves, whereas the overall divides for telephones and televisions barely existed – at least among OECD countries). The real issue has been a relative concept of the divide, which compares penetration rates among groups. When groups of people are delineated by income (or any other variable), each group has its own penetration rate. In effect, the overall penetration rate is a weighted average of these. The evolution of the divide refers, then, to the asymmetric progress between more and less connected groups. Thus, its measurement really involves comparisons of the ‘haves’ between ‘have-more’ and ‘have-less’ groups. Strictly speaking, it does not involve the have-nots1. The absence of such a divide would require the penetration rates of a certain ICT to be the same regardless of the group of people examined. This should not be expected to happen in early measures of Internet penetration, though - simply because it is not observed anywhere else. Moreover, detailed methodological work showed that the changes in the differences in penetration rates and their evolution over time are only approximations of the true magnitude of the divide. Depending on the case at hand (i.e. variable of interest, time span involved etc.) they may be good or not-so-good approximations. This is so because the changes in the differences in the penetration rates over time are only the numerators needed and, as such, they offer good measures as long as the denominators remain more or less constant – something which may or may not be the case. Particularly when income percentiles are concerned, and over a period of time, this cannot be assumed to be the case and adjustments must be made that may well reverse the conclusions regarding 1 Alternatively, it could involve comparisons between the have-nots in these groups, but not the haves.

International Benchmarking for the Information Society
10
the direction of the divide’s evolution. The measure will be less prone to biases when the delineation of only two groups is permissible by a variable (i.e. gender), but the theoretical reasoning still holds. Thus, while aggregate measures may find that in an overall sense the digital divide is closing, analytically this is a poor substitute for what truly happens between two specific groups of people. For example, in the case of the Internet in Canada between 1996-2002, it was found that although the divide was narrowing overall, this was entirely due to the fact that the middle and upper-middle income deciles were gaining ground against the top, whilst the bottom three deciles not only were not closing the gap vis-à-vis the top decile, but they were losing ground. Similar findings have been found in studying the digital divide internationally. Thus, the divide must be examined between well-defined groups and time periods. Specificity is a virtue in this case, with regard to both ICT and variable used.
Furthermore, rates of growth and ratios of penetration rates are inappropriate in analyses of the evolution of the divide. Historically, the diffusion of new commodities, technological or not, has been gradual, as early adopters are eventually followed by the rest of the population. While the speed of adoption among commodities differs, their penetration generally follows the pattern of an S-curve, a pattern characterized by accelerating growth in the initial period, which eventually gives way to decelerating growth. Then, for a period, starting from an initial situation involving unequal penetration rates, rates of growth tend to be higher for the low-penetration groups compared to the high-penetration groups. This leads to lower ratios from one period to the next and can cause unnecessary confusion by casting doubt on the direction of the evolution of the digital divide. This apparent contradiction occurs because ratios are not true measures of the digital divide. Decreasing ratios will be obtained always as long as the rate of growth of penetration among the low-penetration group exceeds that of the high-penetration group – regardless of how small the margin may be. However, it has been shown that for the divide to remain unchanged, the rate of growth of the low-penetration group must be higher than the rate of growth of the high-penetration group by as many times as the ratio of the penetration rate of the high- to the low-penetration group was in the initial period.
Other analytical techniques that have been used to study the evolution of the digital divide include numerical or diagrammatic trend analysis and appropriately-adapted Lorenz curves. The former tend to be detailed and apply to specific groups of interest, whereas the latter aim at providing an overall direction of the movement – in the average sense. When inconclusive, due to overlapping curves, Gini coefficients are also constructed (Italy 2000, U.S. 2002, OECD 2004). It must be emphasized that while useful in the detection of overall movements, Lorenz curves and Gini coefficients cannot unveil the true evolution of the gap between specific groups, as the detailed and direct comparisons necessary are camouflaged under the general trend and go undetected. A sub-component of the study of the evolution of the digital divide deals with its underlying speed. When the direction of the evolution is found, the next policy question
International Benchmarking for the Information Society
11
is how fast. If, say, the divide is closing, the speed at which this is happening has a direct bearing on the potential timeline and dosage of policy responses. Not much empirical work has been done on this, and inferences involving speed have been drawn rather haphazardly. However, a theory of growth was proposed that accounted not only for the overall S-curve diffusion pattern of new ICTs, but dissected it with the individual behaviour of different income groups. On the basis of differing behaviours between high- and low-income groups, within the overall pattern of diffusion, the accuracy of the predictions can be improved by postulating growth scenarios specific to each group, as well as factoring in as much as possible the individual ICT’s diffusion based on its unique characteristics and available statistical history. Composite measures: The analyses above concentrated on individual ICTs, notably the Internet. However, work through composite ICT measures have also been proposed for the study of internal country digital divides. An example came from Italy (2000), which proposed a multivariate technique to arrive at an index based on principal component analysis. It focused on the densities of: fixed and mobile telephony, personal computers, Internet hosts and secure servers, and produced results by geographical area. A more recent example came from Korea (2004) by means of the Personal Informatization Index (PII). The digital divide was defined as the difference in PIIs among groups. The approach recognizes both access and use of ICTs and argues for cross-sectional and longitudinal measures and analyses. (Since the data come from a survey conducted in 2004, however, only cross- sectional work is carried out for several groups by age, type of employment and income). The PPI is the aggregate of three sub-indexes:
The Personal Access Index (PAI), which “measures the degree to which each person has access” to ICTs and is calculated on the basis of: ease of access to computer and the Internet when needed (60% weight), capacity of computer and speed of Internet connection (30% weight), and variety of ICT owned (10% weight). The Personal Capacity Index (PCI), which “reflects a person’s preparedness for information society” and refers to ability to use ICTs. Variables were: the ability to use computers (50% weight) and the Internet (50% weight). Considering the different individual needs, computer software and Internet applications were categorized by the difficult to learn. The highest score in each category was included.
The Personal Usage Index (PUI) deals with the usage of computers and the Internet, both in terms of quantity (40%) and quality (60%) of usage. Quantity is measured by the hours of computer and Internet use and the number of memberships in Internet sites; quality by the perceived usefulness of computers and the degree of using ‘desirable’ software and content (desirable was pre-selected for each group, including various levels of students, housewives, blue- and white-colour workers). The overall index was arrived at as a weighted sum, as follows: PII= 0.2*PAI + 0.3* PCI + .5*PUI The total score of the index was adjusted to 100. Gini coefficients were also computed.

International Benchmarking for the Information Society
12
6. International benchmarking General measurements related to ICTs and specific quantifications of the digital divide across a large number of countries has been a more difficult area since, by definition, the interest was in benchmarking across countries at various stages of development, with emphasis on the least developed ones. Not surprisingly, this is exactly where data gaps pose a more severe limitation, as precious little exists in terms of comparable indicators worldwide beyond the well-known, mostly supply-side, ITU data. This practical impediment was coupled by the lack of a conceptual framework that would make possible an orderly integration of the existing statistics and would support the meaningful analysis of the findings. Considering how indispensable measurements in this area are, however, several and diverse efforts started to emerge in recent years. They came in a variety of approaches, focused on different aspects of the Information Society and differed in their objectives, thematic emphasis, scope of issues covered, number of countries included, indicators used and methodologies. Most have been quantitative in nature (see GITR 2002, 2003, Orbicom 2002, 2003, ITU 2003), whereas some were more qualitative (McConnell 2000, 2001); a few cover many countries, others focus on a small set (i.e. Sibis, Conference Board of Canada 2003); most produced aggregate measures, while others produced comparisons on a variable-by-variable basis for a limited number of countries without an overall comparative assessment (OECD 2001, 2004); some focused primarily on broader issues of competitiveness and e-readiness, while others were specific to the issue of the digital divide; some relied on public data (ITU, Orbicom), others on a combination of public and proprietary (GITR); some have continuity, others were one-off. Collectively, they offered insights and contributed towards an improved understanding of what is involved. As well, to varying degrees, they are capable of providing input to the formulation of national and international e-strategies for development. This section contains a synoptic overview of several such efforts. The approach is intended to be descriptive rather than offer an assessment, and relies on the actual reports – each must be looked against its stated objectives and intended uses. The Global Information Technology Report (GITR – WEF, INSEAD) Produced by the World Economic Forum, in collaboration with InfoDev and INSEAD, (initially with Harvard University), this report has been well marketed. It covers a variety of policy issues related to the benefits conferred by ICTs on growth, development and competitiveness through in-depth studies. The GITR “assesses the progress of networked readiness in countries, revealing the obstacles that prevent countries from fully capturing the benefits of ICT” (p. v). While the aim of this effort is to go beyond a snapshot of current developments and lead to a more continuous process of issue assessment, one of its main outputs is a quantitative instrument.
International Benchmarking for the Information Society
13
“The Networked Readiness Index (NRI) is defined as a nation’s or community’s degree of preparation to participate in and benefit from ICT developments”. The NRI was introduced in 2001-2002, and was refined further in 2002-2003 (Dutta et al 2003). While the methodology remains largely the same, the number of variables was more limited due to the inclusion of more countries in the last two editions. The last edition (GITR 2003) refers to 2002 and extends to 102 countries from 82 the year before. The aggregate NRI is based on a framework comprising three main constituent components: environment, readiness and usage (Fig). Under environment, the overall macroeconomic and regulatory environment for ICTs is considerer, with sub-indexes for market environment, political and regulatory environment and infrastructure environment. This component is designed to measure the degree of conduciveness of the environment that a country provides for the development and use of ICT. The market environment sub-component is meant to assess the presence of the appropriate human resources and ancillary businesses to support a knowledge-based society. Forces that play an important role in determining such an environment include fundamental macroeconomic variables like GDP, exports and imports, the availability of funding and skilled labour, as well as the level of development of the corporate environment. The sub-component that refers to the political and regulatory environment is an attempt to measure the impact of a nation’s policies, laws and regulations, as well as their implementation on the development and use of ICTs. The infrastructure sub-component is defined as the level of availability and quality of the key ICT infrastructure needed for access within a country. The degree of ICT usage is linked to the degrees of readiness (or capability) of a country’s citizens, businesses and governments to use and benefit from ICT. This is conferred through a combination of factors, such as relevant skills among individuals, access and affordability by corporations, and government’s use of ICT for own services and internal processes. The usage component in principle aims to measure the degree of usage by all sectors of the economy. “In the absence of reliable data about the specific impact of ICT on the key stakeholders, the Usage component provides an indication of the changes in behaviors, lifestyles and other economic and non-economic benefits brought about by the adoption of ICT” (p. 8). Usage is assessed through the following measures: for individuals through measures of the deployment of ICTs, such as telephones, Internet connections, level of Internet usage and money spent online; for businesses through the level of B2B and B2C e-commerce, and the use of ICT for activities like marketing, and; for governments through the presence of government services online, and the volume of transactions that businesses have with governments.

International Benchmarking for the Information Society
14
The effort starts with a selection of variables based on their “qualitative relevance to the NRI” . Two sets of data are involved, referred to by the authors as “hard” and “soft”. Hard data are statistics available that can be used in international comparisons across a large number of countries and are collected by independent agencies (World Development Indicators, the World Information Technology and Service Alliance, the ITU, Pyramid and WEF). Soft data are subjective data gathered from questionnaires of the Executive Opinion Survey conducted by WEF and represent an attempt to go beyond what information exists. The report acknowledges that “While soft data are critical in establishing the opinions of decision makers and influencers who are intimately familiar with a particular economy, the hard data captures fundamental elements related to the development of infrastructure, human capital, and e-commerce” (p. 217). The selection of countries to be included in the benchmarking exercise was based on the availability and reliability of the data. There is an interplay involved between the number of countries and the number of variables, though. Staring with 91 variables at the outset, those with less than 65 observations were dropped, as were soft data variables whose survey results appeared questionable. Highly correlated variables within each block were also dropped. Thus, 48 usable variables remained, which were used for the computations. Even so, some of the data were not available for a number of the 102 countries. Missing data were estimated through regression analysis and, when this was not sufficient, through a clustering technique (according to which countries were grouped by their per capita GDPs) and a pro-rata technique. Appropriate adjustments were made to ensure the consistent direction of the data. As is typically the case, several variables needed transformation from their absolute states to relatives in order to be comparable across countries. Such transformations took place with the use of typical denominators, such as GDP per capita and population. The hard data were subsequently standardized through conversion on a scale from 1 to 7 - to match the scale of the soft data collected through the opinion poll. The NRI consists of nine sub-indexes, each of whom was calculated by taking the average of all variables in each block. The average of the three sub-indexes was then used to calculate the three main components. The same was repeated in turn to arrive at the aggregate NRI, with weights of 1/3 each. The variables included are contained in the table below. The results were then analyzed, as well as value-added work was performed examining the relationship between the NRI and GDPs.

International Benchmarking for the Information Society
15
The NRI has been criticized for the quality of the soft data, coming from polling the opinions of “leading” business people in several countries. There are significant biases involved due to the subjectivity of such responses. Moreover, such biases are not consistent across countries, as cultural and other attitudes differ. On the other hand, the costs of conducting a scientific survey across a very large number of countries are prohibitive. As well, the soft GITR data are proprietary; thus, their usefulness is confined within the WEF studies. The methodology utilized by the GITR study belongs to the family where country scores do not measure anything in particular - in the sense that they can be consistently traced and monitored over time. Therefore, while changes in country rankings from one year to the next allow the comparative performance of one country versus another, country scores cannot be used to ascertain the degree of progress an individual country made from one year to the next.
Networked Readiness Index
I. EnvironmentI.1. Market I.2 Political and Regulatory I.3 InfrastructureState of cluster development Overall administrative burden Overall infrastructure qualityVenture capital availability Quality of the legal system Waiting time for telephone linesSubsidies for firm-level R&D Laws relating to ICT Telephone mainlinesQuality of scientific research institutions Competition in the ISP sector Public pay telephonesAvailability of scientists and engineers Foreign ownership restrictions Internet serversBrain drain Efficiency of the tax systemUtility patents Freedom of the pressICT manufactured exportsICT service exports
II. ReadinessII.1. Individuals II.2 Business II.3 GovernmentPublic expenditure on education Ease of obtaining telephone lines Government prioritization of ICTAdult literacy Cost of business phone subscription Government procurement of ICTTertiary enrollment Extent of staff training Government online presenceRadios Quality of business schoolsTelevision sets Scientists and engineers in R&DHouseholds onlineQuality of math and science educationAffordability of local fixed line callsAffordability of Internet telephone accessAffordability of Internet service provider fees
III. UsageIII.1 Individual III.2 Business IV. GovernmentPersonal computers 2.01 Computers installed in businesses Government success in ICT promotionISDN subscribers 2.02 Firm-level technology adoption Government online servicesCable television subscribers 2.03 Prevalence of foreign technology licensing Internet users

International Benchmarking for the Information Society
16
Monitoring the Digital Divide (ORBICOM) This effort is specific to the measurement of the Digital Divide, both across countries and over time. The project is carried out by Orbicom, the UNESCO network of Chairs in Communications, and its initial contribution was the development of a conceptual framework on which measurements could be based (Orbicom 2002). Its encouraging receipt by the international community led to a fully-blown application across 192 countries (Orbicom 2003). In partnership with a growing number of organizations worldwide, which have included Canada’s International Development Research Centre (IDRC), the Canadian International Development Agency (CIDA), UNESCO, ITU, UNCTAD, InfoDev, APEC, La Francophonie and regional bodies, the project now continues for the Tunis WSIS The conceptual framework: The framework introduced the notion of a country’s Infostate, as the aggregation of infodensity and info-use. Infodensity refers to the country’s overall ICT capital and ICT labour stocks, which are directly linked to the country’s productive capacity and thus offers the links between ICTs and growth, as well as economic development. Info-use refers to ICT consumption flows per period. The digital divide is then defined as the difference in infostates among countries. The framework offers intuitive linkages to economic theory. The productive capacity of a country is determined by the quantity and quality of its factors of production. At any given point in time, the productive capacity is fixed because the factor stocks and the technology with which they are combined in production are fixed, but over time they are all expandable. Factor growth, technological improvements and productivity gains are instrumental and ICTs affect them all. ICT and non-ICT factor inputs are combined to produce ICT and non-ICT goods and services, without a one-to-one correspondence. At the end of the numerous production processes, part of the outputs will be in the form of ICT outputs, which will be absorbed as consumables (final demand) or will be added back to the capital stock (gross investment – replenishing the used-up ICT capital and labour stocks and augmenting them). The same holds true for labour skills, produced and consumed. Attrition, obsolescence, training, movements in and out of the labour force, brain drain, all affect the skills stock. ICT capital comprises network infrastructure and ICT machinery and equipment. ICT labour is perceived not as a collection of individuals, but as the stock of the ICT skills of those in the labour force. In this formulation, produced output will be an increasing function of these ICT stocks, as it is for all other forms of capital and labour. Uptake of ICT goods is indispensable for the consumption of ICT services that would satisfy ultimate needs. In fact, ICT consumption involves the use of both ICT capital and skills, both of which are becoming increasingly complex as consumption expands to progressively more sophisticated technological goods and services. Thus, building ‘consumptive capacity’ is a prerequisite to generating consumption flows. In that vein, a distinction is made between ICT uptake and ICT intensity of use. (Roughly, uptake corresponds to ICT goods and intensity of use to ICT services). Again, consumption

International Benchmarking for the Information Society
17
flows per time period are measurable. The Figure below provides a schematic of the framework.
It is evident from the framework that domestic production of ICTs is not crucial. Capitalized and consumed ICT goods can come from imports. Alternatively, a developing country may manufacture ICT goods, which will not be seen in domestic consumption (exports). Thus, the supply-side ICT sector, although important for all the spillovers entailed, is not prominent. As well, what really matters for development is the utilization of the productive stocks rather than their availability. Having underutilized roads, abandoned factories and rusted telecommunications networks does not increase productive capacity. The same holds true for unemployed or underutilized labour and its skills. The supply-side refers clearly to the productive capacity of the country, but it is differentiated from actual production both because of capacity underutilization and trade. Considering the intuitive and inextricable link of ICTs with the overall factor stocks and the continuous introduction of new ICTs in consumption, ICTs are clearly not bounded upwards but instead are expandable over time. Even as consumables, achieving complete uptake today means nothing for tomorrow. For instance, if every available ICT had achieved 100% penetration and use rates prior to the arrival of the Internet, the ceiling would have moved upwards immediately after. The same holds true for skills, with obvious implications for productivity. Consequently, there is no pre-set, absolute upper limit of infostate that can be achieved over time. The unique characteristics of this international benchmarking tool enable the quantification of the digital divide at any given point in time, but it also allows the monitoring of evolution over time. This way, not only cross-country comparisons can be made, but the time paths of individual countries can also be monitored. Comparisons,
Socio-economic, geopolitical and cultural environment
Economy
capital labour
ICT uptakeICT intensity of use
INFOSTATEICT infrastructure ICT skillsInfodensity
Info-use

International Benchmarking for the Information Society
18
then, are not reduced to the more usual country rankings and their changes from year to year. (In fact, country rankings are only an incidental by-product of this method). The model and its application: For measurement purposes the framework serves as a guide for an operational model which approximates pragmatically the purity of concepts across a very large number of countries. Such an exercise involves several nuances, including the constraints of existing indicators and their lopsided availability. The empirical application relied on the use of indicators. Practically, each component of the model was populated with indicators, which were then converted to indexes. Consistent with the need for policy relevance of the model, as opposed to its business usefulness, a relativistic approach was followed to quantify and express infostates. Thus, a small country like Luxembourg can have a higher level of infostate than a much larger one, say, India. In absolute terms something like that is unlikely to happen and this matters for businesses with an eye on market size. Considering the relative nature of the digital divide due to the constant evolution of infostates everywhere, the model calls for a reference country and a reference year. The reference country facilitates comparisons and the reference year makes possible the monitoring of the evolution of each country’s infostate components over time. The choice of a reference year is subject to well-known considerations. In the case of the specific empirical application, 2001 was chosen due to the availability of additional indicators, which are expected to continue to exist. Rather than use a real country as a reference, Hypothetica was created, a country that represents the average values of all countries examined. As an alternative benchmark, Planetia was created and included in the calculations. In this case, the values are those of the planet as a whole, if viewed as one country and, in this setting, each country could be seen as a region of the planet. Aggregations were performed by choice of geometric means, which favour symmetrical rather than lopsided developments across infostate components. The project used 21 indicators and covered the years 1996 to 2001. It is now being updated with 2003 data. Considering the empirical application’s reliance on public data, it offers comparisons between countries with high and low infstates in some detail by component and indicators, which are in no way affected by the exact choice of technique or method of aggregation. However, the level of detail is not judged sufficient for detailed comparisons among countries at the top of the Infostate list.
Infodensity Info-useNetworks Uptake
Main telephone lines per 100 Television householdsWaiting lines/mainlines Residential phone linesdigital lines/mainlines PCsCell phones per 100 Internet usersCable per householdInternet hosts per 1000Secure servers/Internet hosts International bandwidth (per inhabitant)
Skills Intensity adult literacy rates Broadband usersgross enrollment ratios Outgoing telephone traffic primary education Incoming telephone traffic secondary education tertiary education
INFOSTATE

International Benchmarking for the Information Society
19
The Digital Access Index (ITU) The ITU also produced an aggregate measure in time for the Geneva WSIS (ITU 2003). The emphasis was placed squarely on access to ICTs, which is argued to be the most fundamental prerequisite for an Information Society. The DAI has three main aims. One is to measure a country’s capacity to use ICTs. The second is to be ‘digitally inclusive’ by maximizing the number of countries covered as much as possible - something that clearly entails obvious trade-offs with variables used. The third is to make the index as transparent as possible. The DAI is built around four fundamental factors that impact a country’s ability to access ICTs: infrastructure, affordability, knowledge and quality. “If the infrastructure is not available, there can be no access. If the population cannot afford to pay for ICT products and services, there can be no access. If citizens do not have a certain level of education, they will not be able to use newer ICTs such as computers and the Internet. If the ICT experience is poor, people will either cease using them or be incapable of using them effectively or creatively” (p. 103). In addition to the above, a fifth factor is important for matching the theory of the index with the reality of a country; this is the actual usage of ICTs, which is intended to capture other aspects, not explicitly accounted for by the previous four. Acknowledging that an ‘ideal’ index would require data at a much more detailed level, well beyond of what is currently available, the ITU makes the case of ‘quality versus quantity’. Eight indicators are used to represent these five factors. Infrastructure contains variables that proxy overall network development. The educational attainment of the adult population and the number of students proxy the capacity to use new ICTs. Affordability is approximated by the price of Internet access. Quality deals with the impact of the experience in using ICTs and allows for greater differentiation among countries. Finally, the usage category gauges the extent of ICT utilization. The following indicators, goalposts and weights were used:
DAI
Category Indicator Goalpost NoteInfrastructure Fixed telephone subscribers per 100 inhabitants 60
Mobile subscribers per 100 inhabitants 100Knowledge Adult literacy 100
Overall school enrolment (primary, secondary and tertiary) 100Affordability Internet access price 100Based on 20 hrs per month Quality Broadband subscribers per 100 inhabitants 30
International Internet bandwidth per capita 10,000Usage Internet users per 100 inhabitants 85
Each is assigned 1/2 weight in infrastructure
Literacy is assigned a weight of 2/3 and enrolment of 1/3 in knowledge
Each was assigned a weight of 1/2 for quality

International Benchmarking for the Information Society
20
Variables were converted to indicators and were then normalized so that they can be added or averaged. They were transformed into values between 0 and 1 through the use of “goalposts” - the maximum values permissible for each indicator. This requires care, as developments in ICTs are fast and goalpost can get outdated. If the goalpost is surpassed, the index must either assign a value of 1 to the variables or the goalpost must be increased – something that would require recalculation of all previous years. A single index was computed for each of the five categories, and weights had to be assigned to each indicator in categories with multiple indicators. For instance, in infrastructure, fixed telephone and mobile subscribers got ½ each, while in knowledge, adult literacy got a 2/3 weight and enrolment 1/3. Then, scores were summed over all categories to obtain an overall index score. Sensitivity analysis revealed that this is a good and transparent way compared to more complicated weighting schemes. The DAI was calculated for 178 countries, which were subsequently classified as high (25 economies), upper (40), medium (58) and low (55) ICT access. McConnell International McConnell International, in collaboration with WITSA, offered an assessment of e-readiness across 42 countries in 2000, which was expanded to 53 in 2001. This work was largely on qualitative indicators, assessing e-readiness or capacity to participate in the global digital economy in five interrelated attributes:
Connectivity, which considers the availability of infrastructure, such as wireline and wireless communications, community access centres (paid and free), networked computers in business and homes, affordability and reliability of network access, including the cost of service, downtime and the prevalence of sharing among individuals.
e-leadership, which looks at the priority given by government policies and regulations to the promotion of an e-society, the extent of demonstrated progress on e-government, including the offering of services electronically and the creation of national portals, the quality of partnerships with businesses and overall efforts to promote access for all citizens.
information security, which refers to the strength of legal protections and progress in protecting intellectual property rights (especially for software), electronic privacy, and the strength and effectiveness of the legal frameworks to address and prosecute computer crimes, authorize digital signatures and enable public key infrastructures.
human capital, referring to the education necessary for a skilled workforce, the penetration of ICTs in schools and the ability of educators to use them, as well as the culture of local creativity.
e-business climate, taking into account the existence of effective competition among ICT services providers, political and financial stability, foreign investment, ability of the financial infrastructure to support e-transactions, sponsorship of science and technology parks as innovation hubs, etc..

International Benchmarking for the Information Society
21
The reports contain analyses of each attribute, pay attention to public-private partnerships and offer e-readiness ratings. An ‘e-ready’ country has extensive usage of computers in schools, businesses, government, and homes; affordable reliable access in a competitive market; free trade; skilled workforces and training in schools; a culture of creativity; government-business partnerships; transparency and stability in government and an evenly enforced legal system; secure networks and personal privacy; and regulations allowing digital signatures and encryption. For each country and each category, the report performs a "dynamic evaluation of the relevance and accuracy of available quantitative data with an understanding of myriad cultural, institutional, and historical factors." These general ratings and their narratives can then be used as a starting point for further planning. Countries are rated in the five categories listed above on a scale of one to three (blue, amber, red), and extensive recommendations are provided. Mosaic Mosaic developed a framework intended to capture the state of Internet development within a country at a particular point in time. It is based on six dimensions:
1. pervasiveness (per capita usage), 2. geographic dispersion, 3. sectoral absorption (usage within major sectors of the economy), 4. connectivity infrastructure, 5. organizational infrastructure (the state of the Internet service market), and 6. sophistication of use.
Each factor is ranked on a scale of zero (non-existent) to four (highly developed). A country's movement along these dimensions is shaped by a set of determining factors that includes such metrics as teledensity, PC density, per capita GDP, foreign and domestic investment, geography, educational system, and government policy. The analyses focus on major social, economic, and political events, and the legal and regulatory environments as they affect the countries' Internet. The report uses a combination of statistics, narrative description and comparison to explain the growth of the countries' Internet, focusing on the six Internet statistics described above. It can contain detailed descriptions of the political and economic factors that have affected Internet growth and usage, and forecasts future Internet developments. The framework does not describe an ‘e-ready’ society per se, but the reasons behind and readiness for growth of Internet infrastructure and usage (which are, by most accounts, requirements of an e-ready society). Unique interactions among the government and businesses, aided by market competition, help cause the growth and distribution of the Internet. Mosaic can come in several variants and does not combine the six factors to produce an overall index score. The mix of quantitative and qualitative data means that scores are more vulnerable to subjective interpretation.

International Benchmarking for the Information Society
22
The Economist Index The Economist Intelligent Unit produces an annual index with e-readiness rankings. Covering the 60 largest economies, it allows “countries to compare an assess their e-business environments” and determines “the extent to which a market is conducive to Internet-based opportunities”. It utilizes around 100 variables organized in six groups: connectivity and technology infrastructure, business environment, consumer and business adoption, social and cultural environment, legal and policy environment and supporting e-services. It also includes a large number of variables considered qualitative. Statistical Indicators Benchmarking the Information Society (SIBIS) This project, undertaken under the EU’s IST Programme, uses a mixture of survey and other data to examine in detail the situation in EU, EU accession (at the time) countries, Switzerland and the US. It contains detailed analyses by country and theme. It focuses on ICT access and usage elements, such as Internet readiness, the digital divide and information security. It also includes measurements and analysis on factors determining access to and use of ICTs, such as perceptions of barriers, digital literacy, learning and training, and benchmarks applications like e-commerce, e-work, e-science, e-government and e-health (SIBIS 2003). Connectedness Index (Conference Board of Canada) This specialized work produced several reports quantifying Canada’s progress in connectedness compared to nine other OECD economies: US, Sweden, Finland, UK, Australia, Germany, Japan, France, Italy. It is indicative of efforts to compare among highly connected countries. Connectedness was defined as “The availability and use of ICTs to facilitate communications, interactions and transactions whenever and wherever”. The following framework is used as a way to group and link indicators:
Inputs • Factors of
production • Land • Labour • Capital • Entrepre-
neurial ability
Impacts • Quality of life • Com pe-
titiveness • Prosperity
Availability • Supply • Infrastructure • Products • Services • Content
Reach • Dem and • Market
penetration
Use • Com m uni-
cations • Interactions • Transactions
Connectedness Framework: A Value Chain Approach
Price
Socio-Economic Enablers • Financial system s • Taxation • Regulations • Literacy and Educational Attainm ent
• Incom e per capita

International Benchmarking for the Information Society
23
While it is explicitly recognized that the socio-economic environment may enable or hinder a country’s connectedness and thus influences the index, the latter is based on:
Availability, which refers to the potential to be connected and includes supply-side, market-ready infrastructure, networks and systems; Reach, which is a measure of demand and reflects those who actually subscribe to the network; Use, which measures mostly intensity, such as actual hours online, number of transactions and revenues generated through the Internet, and; Price, reflecting both supply and demand and relates to individuals’ potential to be connected. Numerous indicators were used, attesting to the trade-off between quantity of data and the more narrow scope of the investigation, as well as to the level of detail required to compare among very connected countries. Even under these circumstances, many additional variables were available for use only in bilateral comparisons between Canada and the US.
Connectedness Index Availability
Telecommunication channels (per 100 inhabitants) Internet/ Web sites (per 1000 inhabitants) PCs (per 100 inhabitants) Secure Web servers (per 1 million inhabitants) Percentage of PCs networked Government online services Percentage of households with access to a home computer Businesses that provide information on goods and services Student to computer ratio Businesses that allow customers to order goods and services Internet hosts (per 1000 inhabitants) Businesses that allow customers to make payments online
Reach Telephones (per cent of households) Internet users (per 10000 inhabitants) Percentage of households connected to cable Internet subscribers (per 100 inhabitants) Percentage of direct broadcast satellite (DBS) subscribers Percentage of students who had access to the Internet Per cent of TV households receiving digital TV (DTV) for instructional purposes Cellular subscribers (per 100 inhabitants) Percentage of people with internet access from home Percentage of the population that have accessed the Internet Percentage of businesses online via a mobile device Broadband penetration (subscribers per 100 inhabitants)
Use International telecommunications traffic (outgoing minutes of Information gathering about products and services on the Internet international telecommunications traffic per capita) (as a percentage of the population) E-commerce revenue (as a percentage of GDP) Music (or MP3) downloads (as a percentage of the population) Internet use (percentage of the population who have used Online banking with a financial institution At least once in the three months prior to being surveyed) (percentage of the population) Average time spent per month on the Internet (hours) Percentage of employees using the Internet at least once a month Purchases of products or services directly online Businesses that use online banking or investment services (per cent) (percentage of the population)
Price Residential phone connection charge (US$) Internet access price basket Business phone connection charge (US$) (total cost of 40 hours at peak time in US$ at PPP) Basket of consumer mobile telephone charges (US$ at PPP) Composite basket of business telephone charges (US$ at PPP) Basket of business mobile telephone charges (US$ at PPP) Composite basket of residential telephone charges (US$ at PPP) Basket of national leased line charges (US$ at PPP)

International Benchmarking for the Information Society
24
Standardized scores were arrived at by subtracting a country’s raw variable values from the mean of all ten countries and then dividing by the standard deviation. This gives a measure of the relative gap of an individual country’s score to the mean compared to the standard gap. Data were further transformed by multiplying by 10 and adding 100 so that each variable has an expected value of 100. (The inverse was taken for price data). Overall average and weighted scores were calculated for each of the four categories. The overall index was a weighted average, the weights being: availability 20%, reach 25%, use 50% and price 5%. Despite the low weight, like the DAI, it endogeneizes prices, which are one of the predominant explanatory variables.
Technology Achievement Index (UNDP) The 2001 Human Development Report included a Technology Achievement Index (TAI), which relied on eight variables spread over four categories. The first category looked at the creation of technology, the second and third at diffusion and the fourth on how prepared users were for new technologies. It compiled scores for 72 countries, which were subject to missing data. Many of the variables were ICT-related, although the scope of the approach was broader than ICTs. ICT and Human Development: Towards Building a Composite Index for Asia In another study the UNDP (2003) attempted to explore linkages between ICTs and MDGs in nine Asian countries, by examining the interdependency between ICTs and human development and identifying relevant ICT indicators. It also explored methodologies for the construction of composite indices to capture ICT-related progress in the context of attaining the MDGs. Following the UNDP’s HDI, “the methodology attempts aggregation of the indicators at several stages” (p. 13). All indicators were made ‘unidirectional’ within each category. The component index per category was obtained by first making each indicator scale-free. After subtracting the minimum value from each observation, two variants were explored: one adopts division by the range (range equalization method), while in the
UNDP Composite IndexAvailability or supply-linked - skill independent Telephone mainlines per 1,000 Cellular subscribers per 1,000 Television sets per 1,000 Radios per 1,000Availability or supply-linked - skill dependent Internet users per 100 PCs in use per 100 ICT expenditure per capita ($US)Efficiency and speed Internet service provider charges ($US) Telephone usage charge for Internet service ($US) Cost of local call per 3 min ($US) Cost of call to US per 3 min ($US) Internet speed and access Training and education in ITTargeting social sectors Internet access in schools Computers installed in education Government prioritization in IT Government online service availabilityTargeting vulnerable groups Female professional and technical workers (% of total female) Public access to Internet Government's success in IT promotion Competition among ISPs Laws related to ICT use

International Benchmarking for the Information Society
25
other indicators are divided by their own mean. Then, the average of these values across indicators within each category becomes the value of the component index for each country. Equal weights were assigned to all indices. (A country with all values equal to the maximum will score 1 and one with all values equal to minimum 0). “The larger the value of the aggregate index, the higher the role played by ICTs towards the attainment of MDGs”. The report included critically contrasted the results of the two indexing variants which, although roughly comparable, do produce discrepancies in country rankings. Information and Communication Technology Development Indices (UNCTAD) This represents an additional one-time effort to evaluate ICT development across a large number of countries with emphasis on “pervasive technologies of global impact, wide application and growing potential” (p. vii). The expectation was that such a measure would provide useful benchmarking of existing ICT infrastructure, and measures of future potential of countries to absorb, adopt and make use of rapidly evolving technologies. The basic framework was based on three components: Connectivity, defined as “the minimum set of measures necessary for ICT access” and referring to physical infrastructure available in a country as distinct from broader factors determining access (i.e. literacy, costs); Access, used in a broader context than the more narrowly-defined connectivity and referring to much more than hardware, and; Policy, referring to the overall environment of a country. (Usage was also used but omitted from the Index of ICT Diffusion and subsequent analysis). The ICT Diffusion index was calculated for 1999, 2000 and 2001 across 166-200 countries. The methodology employed used an aggregated index approach, similar to UNDP’s HDI. Countries’ overall scores could be disaggregated into component indices of interest, permitting “a finer discernment of profiles across ICTs”. Scores were arrived at as indexes relative to the maximum and minimum achieved by countries in the group in any indicator. Since the minimum was mostly zero: Index score=value/maximum (the exception to this were telephone mainlines and telecoms traffic). Simple unweighted averaging of indicators was then performed. Based on the results, countries were classified as falling behind, keeping up or getting ahead. Then categorical analysis was performed by income, region or culture. The indices revealed that country rankings are relative stable and consistent over time. In addition, the study included selective literature review on digital divide work, and measured the unequal distribution of hardware equipment and Internet users across countries using Gini coefficients. Despite stable country rankings, trends in connectivity over time suggested some small reductions in the inequality of distributions across country, supporting a closing divide - starting from very unequal levels, though. Gini
International Benchmarking for the Information Society
26
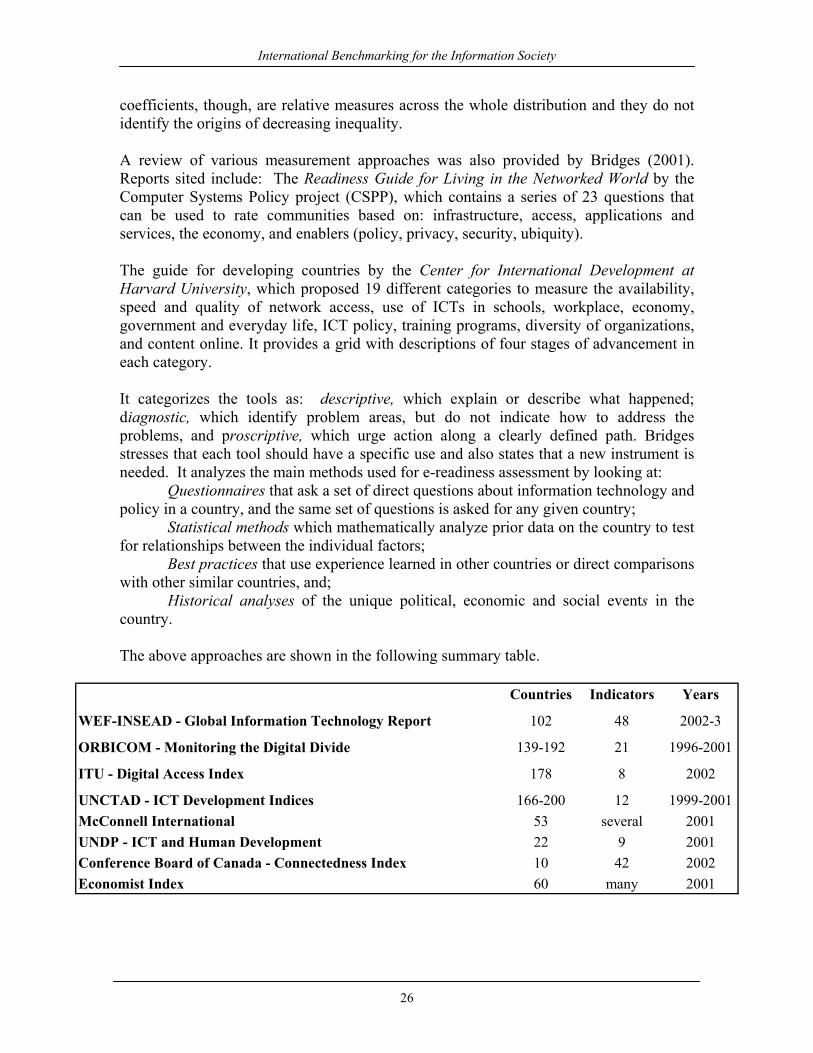
coefficients, though, are relative measures across the whole distribution and they do not identify the origins of decreasing inequality. A review of various measurement approaches was also provided by Bridges (2001). Reports sited include: The Readiness Guide for Living in the Networked World by the Computer Systems Policy project (CSPP), which contains a series of 23 questions that can be used to rate communities based on: infrastructure, access, applications and services, the economy, and enablers (policy, privacy, security, ubiquity). The guide for developing countries by the Center for International Development at Harvard University, which proposed 19 different categories to measure the availability, speed and quality of network access, use of ICTs in schools, workplace, economy, government and everyday life, ICT policy, training programs, diversity of organizations, and content online. It provides a grid with descriptions of four stages of advancement in each category. It categorizes the tools as: descriptive, which explain or describe what happened; diagnostic, which identify problem areas, but do not indicate how to address the problems, and proscriptive, which urge action along a clearly defined path. Bridges stresses that each tool should have a specific use and also states that a new instrument is needed. It analyzes the main methods used for e-readiness assessment by looking at:
Questionnaires that ask a set of direct questions about information technology and policy in a country, and the same set of questions is asked for any given country;
Statistical methods which mathematically analyze prior data on the country to test for relationships between the individual factors;
Best practices that use experience learned in other countries or direct comparisons with other similar countries, and;
Historical analyses of the unique political, economic and social events in the country.
The above approaches are shown in the following summary table.
Countries Indicators Years
WEF-INSEAD - Global Information Technology Report 102 48 2002-3
ORBICOM - Monitoring the Digital Divide 139-192 21 1996-2001
ITU - Digital Access Index 178 8 2002
UNCTAD - ICT Development Indices 166-200 12 1999-2001McConnell International 53 several 2001UNDP - ICT and Human Development 22 9 2001Conference Board of Canada - Connectedness Index 10 42 2002Economist Index 60 many 2001
International Benchmarking for the Information Society
27
7. Synoptic findings In early studies of internal digital divides, sizeable gaps between population sub-groups were identified. Clearly, income had quite an effect on the penetration of new ICTs. There have always been people, though, at high income levels without access – certainly at home. Education was also found to exert a significant influence, independent of income. Even in developed countries, there were also discrepancies by age, gender, and connectivity has been higher in urban centers. However, although such discrepancies remain to varying degrees, users are no longer the stereotypical “affluent, well-educated, younger males”. As ICT penetration continues to rise, for instance, the profile of Internet users starts to resemble that of the population at large. Findings from the international studies have been generally consistent. Huge gaps exist between developed and developing countries. Some of these relate to older technologies, such as wireline telephony and televisions, and are accentuated by the newer ICTs, notably the Internet and cell phones. Interesting leapfrogging in wireless networks is observed. Obviously, the detailed findings differ depending on the scope and methods of the study, as well as the countries examined. Together with different methodologies, they affect country rankings. For the most part, however, the results are consistent – especially to the extent that they stem from the use of the same limited hard data in existence. (Detailed findings from the Global Information Technology Report, Monitoring the Digital Divide and the Digital Access Index are contained in the Annex). Numerous other issues exist relating to technological, policy and resource issues. For instance, the situation of bandwidth and its international allocation and pricing are not satisfactory; hopes are increasingly vested in open source software, but complexities of all sorts remain; the issue of Internet governance remains open etc. Awareness among policymakers is still an issue, although it should be much improved especially around the two World Summits. Mainstreaming ICTs in development efforts is gaining momentum. With regards to the digital divide, specifically, findings unveiled tremendous and systematic gaps. Not only the divide is very wide, but its evolution is far from satisfactory. Results-based comments to the effect that the divide is closing somewhat may be true, but they hold only in an overall, aggregate sense. Several middle-level countries are closing the gap vis-à-vis the top countries, but the bottom ones do not. That list includes many African countries, in particular. As was explained earlier, the fact that measured rates of ICT growth are higher in have-not countries is explained by the very low starting point and the huge differences in levels with top countries. They are not a measure of a closing digital divide. Furthermore, the speed of developments is slow. It has been shown that specific comparisons are needed, on a country-by-country basis, as well as components or individual technologies of interest. The bottom line is that considering the magnitude of the tasks involved in even attempting to bridge such divides, prioritization must take place. In that context, measurements are extremely valuable as they can seriously assist in the allocation of scarce resources, in conjunction with context-specific objectives.

International Benchmarking for the Information Society
28
PART III: CRITICALLY PLOTTING A COURSE 8. Data requirements A consistent by-product of most studies has been the finding that there is a dearth of adequate and reliable statistical information that can be used in international comparisons. It may come across as an oxymoron in the context of Information Society work, but not to the practitioners. No such work can be carried out without raw data. Currently, there are attempts underway to rectify the situation, which must be supported. At the same time, appropriate frameworks are also needed that can integrate the data in a way that would maximize our understanding. Frameworks also help identify data gaps, as this area too involved trade-offs between the quantity of measurements and their costs. The data requirements for internal country and cross-country divides are quite different. For international comparisons, typically indicators at the national level suffice – provided that they are available and sufficiently comparable across a very large number of countries. Like all other exercises in international benchmarking and comparisons, this requires aggregation across constituent components. Invariably, the quality of the output measures will depend on the quality of the input data. The study of internal country divides requires very detailed data in order to adequately examine the key aspects that policymakers and other users are interested in. These include data on ICT penetration rates by detailed level of income, disaggregated by age, gender, geographical location for regional and urban-rural comparisons, education and other characteristics of interest. Moreover, consistent time-series data are needed if evolution is to be understood and monitored. Studies based on such detailed information can complement very well international benchmarking. For the most part, Information Society data cannot be obtained from administrative sources, but they involve survey-taking. This is both resource- and time-consuming, as well as is dependant on the overall statistical capacity of a country. Throughout, the issue of using harmonized concepts, definitions and standards adds additional complications. (The forthcoming Guide to Information Society Measurements by the OECD (2005) should help in that respect, as it will make available the collective wisdom of many early practitioners. For parallels in the areas of S&T and innovation see Gault (2003)). Moreover, different focus will inevitably be needed depending on a country’s stage of ICT development. Practically, when the policy focus is on access to ICTs, the associated analysis can be well supported by data from household surveys, whereas when use of ICTs is concerned, surveys of individuals are definitely the vehicle of choice. The implications for surveys are that size and stratification of samples matter if quality detailed estimates that would support analyses of this type are to be produced. Otherwise, as analysis moves on to define more specific groups of people, survey observations will be thin and cells may be even empty.

International Benchmarking for the Information Society
29
9. Critique and methods Research in the Information Society area is still at an early stage. Inevitably, our understanding will develop incrementally, as data, theories and other needed pieces fall into place. In the process, however, we have to make do with interim steps. The lack of ‘perfection’ has not been an impediment in well-established research areas. I do not see why it should be allowed to lead to inactivity and paralysis in the Information Society. Surely, there are data gaps, not universally-accepted frameworks and other hurdles, but it is incumbent on the research community to try and do the best we can with what we got at any given point in time. In the process, we pave the way to improve in the future; this is how progress is made. Benchmarking exercises, particularly aggregates that produce country rankings have long been subject to criticism. However, they continue to proliferate in all arenas, something indicative of their value as tools that help manage complexity. Whether the GDP, the CPI or the Dow Jones, aggregates and indexes are used to detect direction and movement. They provide important early signals and greatly assist the efficiency of basic communication. They are not substitutes for detailed investigations, but they help identify where these should take place. ICTs constitute a very representative area for this. There are many networks, both wireline and wireless, computers, the Internet, applications, the issues of access and usage, including intensity, intelligence, skills and the like. Getting lost in the maze is an option not conducive to international comparisons, and aggregate measures definitely help. The ITU states that in recent years “virtually every country has succeeded in improving its telecommunications sector. Thus, every country can show that its particular blend of policies has been successful” (ITU 2002, World telecommunications Development Report). This would lose the importance of better practice and learning from relatively more successful policies. It proceeds to state that an index number may be more robust than a single indicator for some purposes and that “An approach based on comparative rankings may be more meaningful than one that uses absolute growth rates”. This is particularly so when a cluster of technologies can be identified, some of which may be close substitutes - a view is consistent with the idea of technology neutrality in research, i.e. not picking winners. No one has ever argued that a single aggregate can capture the dynamism inherent in profound transformations. Managing complexity to improve our understanding is not the same as reducing complexity to triviality. Aggregates help considerably to reduce the noise of details, which can be examined subsequently once an overall understanding of relative strengths and weaknesses has been achieved. It has already been argued that in the case of the digital divide international comparisons would be well complemented by detailed county studies. In that sense, it becomes more a matter of educating the users than any inherent advantage or drawback of any index or other aggregate measure. Numeracy is always an asset in such cases.
International Benchmarking for the Information Society
30
Challenges in benchmarking exercises are many. They include: the framework of integration of the results; the depth vs. breadth trade-offs in country coverage; the selection, nature, number and clustering of indicators and; numerous methodological details related to statistical theory and practice. The phrase “Give me a theory and I can measure everything” is applicable in this context. Establishing a logic, complete with clear concepts and definitions, for what is measured is paramount. It provides a foundation for subsequent clustering of indicators, as well as linkages to the context that matters for interpretation of the findings. Often times, groupings of interesting yet disparate subjects are passed on as “frameworks”. However, like in other aspects of life, ‘competition in approaches’ can be healthy and informed users can critically decide. In Information Society and digital divide benchmarking, country coverage should be the maximum possible. Practically, there a trade-off is involved between such coverage and the availability of data. While admissible imputation techniques can be used in cases of missing observations, the issue of ‘the lowest common denominator’ results in country exclusions is very difficult to escape - with the existing know-how. Alternative approaches have been tried, but they are not advisable as the results are subject to biases that are statistically non-defendable. A key issue is that of indicators, the selection of which is more of an art than science. Apart from availability, not only substantial statistical and subject-matter experience is needed but also the researcher’s judgment. In principle, whether indicators are simple or composite, it is their suitability that matters and not their quantity. Plenty of evidence exists that, following an initial appreciation based on key indicators, the gains from adding more detailed ones become marginal. A related issues concerns the appropriateness or not of weighting schemes. In general, weights are used extensively in index measures, but they are chiefly based on objective data sets from external sources. In Information Society, no such outside intelligence exists. Therefore, any use of weights will be inevitably subjective. On the other hand, the absence of any weights implicitly assumes that all indicators or their groupings are equally important, and there are certainly occasions where a good case for weights can be made. Such issues will have to be judged within the context of individual studies and preferably be accompanied by sensitivity analysis. Issues such as enablers relate more to the notion of a framework rather than the indicators. Considering the research thresholds set over a very long time by statistical and economic theories, generally they cannot be endogeneized but serve as prime explanatory variables. As for causation, indexes do not imply it – unless embodied in the framework. They can be used, though, together with other variables in standard techniques that aim at unveiling cause and effect.

International Benchmarking for the Information Society
31
All in all, good research must define and communicate clearly what is being measured. The Information Society is an area of such dynamism where intertemporal evolution must be captured. For this, reference points in benchmarking are preferable. This will also eliminate much of the criticism stemming from changing country rankings between periods with little or no real explanation. Such approaches need a solid theoretical foundation, but they raise the bar in such work. 10. The way forward The enormous interest in the quantification of the Information Society offers encouragement in trying to meet the challenge. The WSIS Plan of Action makes reference to the need for the development of statistical indicators for benchmarking and performance evaluation, and links such efforts to the implementation of the Plan of Action to track global progress. It calls upon all countries and regions to develop coherent and internationally comparable statistical information and outlines a series of indicative targets to be achieved by 2015. In addition to raw statistical data, the international community needs the systematic monitoring of evolution through cohesive instruments applicable across a great number of countries, with emphasis on developing ones. This would then make possible policy analyses of countries’ relative strengths and weaknesses, and assist in the allocation of investments, as well as serve as a performance assessment tool.
The short term Realistically, there will be no new data of the type needed for global comparisons in the immediate future. Therefore, the approach followed to date, to make the most out of what we got, must continue. Indeed, many organizations are joining forces and collaborate in such efforts. Frameworks and models that can compare not only across countries but over time offer distinct advantages as instruments for the integration of data. The ITU is currently exploring the possibility of joining the consortium of organizations involved in the Monitoring the Digital Divide project and contribute to the update of the empirical application, as well the in-depth analytical work undertaken for the Tunis WSIS – with a view to potentially lead the project on behalf of the international community afterwards. This bodes well with the fact that the ITU maintains the major source of internationally comparable data on ICTs, particularly for the developing world, and exemplifies the collaborative spirit needed today. Several other efforts are paving the way for the long term and are expected to come to fruition in the near future. One concerns the pioneering work on definitions, methods and model surveys related to measuring ICTs at the household and enterprise levels that has been developed by the OECD’s Working Party on Indicators for the Information Society (WPIIS). This is currently being documented and will be released as a Guide to Information Society Measurements next year. It is expected that it will add to the arsenal of resources needed for harmonization of ICT data, as well as capacity building.

International Benchmarking for the Information Society
32
The UN ICT Task Force has formed a Working Party on "ICT indicators and MDG Mapping". The group's work focuses on two main tracks: (i) ICT indicators development and adoption, and (ii) impact measurement and monitoring. This effort is expected to make clear the significance of ICTs in achieving the MDGs, and as such it will provide additional political profile to measurement efforts. At the regional level, several initiatives are underway aiming to advance the measurement of ICTs: in Africa the UNECA Scan-ICT initiative, in Asia the ASEAN e-measurement group, in Latin America UNECLAC, OSILAC and RICYT are active. A global stocktaking exercise on ICT statistics has been initiated by UNECLAC. At present, it involves a metadata questionnaire on ICT statistics, prepared, in cooperation with other UN Regional Commissions (ECA, ESCAP and ESCWA), ITU, OECD, UNCTAD, and the UIS. The questionnaire has been sent to offices having responsibility for official statistical data collection in all developing countries. The stock-taking exercise is expected to lead to statistical collection in the future.
The longer term – towards an international partnership
The only progress acceptable for the long run is the production of new data in countries where currently little exists. This poses a formidable challenge, but the bar cannot be set any lower. Worthy attempts started recently by the ITU, UNCTAD and other organizations to bring these issues to the fore of the international agenda. Following initial meetings hosted by these organizations, the international statistically-minded community came together during the Geneva WSIS under an event titled "Monitoring the Information Society" organized jointly by UNECE, UNCTAD, ITU, OECD, UIS and Eurostat. An important objective of the meeting was to bring ICT data and indicators into the realm of official statistics, so that current global data gaps can be identified and closed. The role of ICTs in economic and societal transformations, business usage of ICTs, individual and household use of ICTs, and measuring social implications of ICTs were discussed. The meeting concluded with an action plan, calling upon the UN Regional Commissions to cooperate with competent regional bodies and organize ICT-related meeting on the monitoring of Information Society issues with the participation of both users and producers of official statistics. These would be followed by a global meeting in 2005 that would prepare an action plan for the Tunis WSIS. UNCTAD would take the lead in coordinating the overall effort. That meeting provided the impetus for a more ambitious - and unprecedented - effort by international organizations. Recognizing the need and seizing the moment, a major global initiative is under way bringing together key stakeholders involved in the statistical measurement of ICTs to create a partnership that will contribute to closing the data gap at the international level, and in particular in developing countries. Based on the commitments of the partners, which include the ITU, OECD, UNCTAD, UNESCO Institute for Statistics, UNECA, UNECLAC, UNESCAP, UNESCWA, the UN ICT Task Force, the World Bank and national statistical offices, the partnership will work towards
International Benchmarking for the Information Society
33
defining and collecting a set of common ICT indicators and assisting developing countries in their efforts to produce information society statistics. “This partnership provides an open framework for coordinating ongoing and future activities, and for developing a coherent and structured approach to advancing the development of ICT indicators globally, and in particular in the developing countries. It particularly aims at assisting developing countries in their efforts to produce information society statistics by mobilizing the resources necessary to build local capacities. This will result in an expansion of ICT statistics harmonized internationally, providing a key input to future policy and analytical work on the information society, including the digital divide” (UNCTAD 2004). The partnership’s objectives are:
• to achieve a common set of core ICT indicators, which will be harmonized and agreed upon internationally and will constitute the basis for a database on ICT statistics
• to enhance the capacities of national statistical offices in developing countries and
build competence to develop statistical compilation programs on the information society, based on internationally agreed upon indicators
• to develop a global database on ICT indicators and make it available on the
Internet To the extent that this initiative is supported in the near future, it will provide a fighting chance in meeting the challenge of Information Society measurements.

International Benchmarking for the Information Society
34
References and related bibliography Bridges (2001) “Comparisons of E-readiness Assessment Models”, www.bridges.org Castells M. (2001) “The Internet Galaxy”, Oxford University Press. Chin Saik Yoon (1998) “New Information and Communication Technologies: Freeing Information Flows or Widening South-North Gaps”?, in Freedom of Expression and New Communication Technologies, eds. Michele Pare and Peter Desbarats, Orbicom. Dickinson P. and Sciadas G. (1996) “Access to the Information Highway”, Canadian Economic Observer, Cat. No. 11-010, December. Dickinson P. and Sciadas G. (1999) “Canadians Connected”, Canadian Economic Observer, Cat. No. 11-010, February. Dutta S. et al (2003) “Networked Readiness of Nations” ECLAC (2004) “Toward an Information Society Measurement Instrument for Latin America and the Caribbean: Getting Started with Census, Household and Business Surveys” ETS (2002) “Digital Transformation: A Framework for ICT Literacy”, EU (2001a) “eEurope”, Lisbon. EU (2001b) “Information and Communication Technologies in Development: The Role of ICTs in EC Development Policy “, Communication from the Commission to the Council and the European Parliament, Brussels, December. EU (2003) “Statistical Indicators for Benchmarking the Information Society”, www.sibis_eu.org Gault F. (ed) ( 2003) “Understanding Innovation in Canadian Industry”, McGill-Queen’s University Press. G-8 (2001a) “Digital Opportunities for All: Meeting the Challenge”, Report of the Digital Opportunities Task Force (DOT Force), including a proposal for a Genoa Action Plan. G-8 (2001b) “Global Bridges, Digital Opportunities", www.dotforce.org GITR (2003) “Global Information Technology Report, WEF-INSEAD. GITR (2002) “Global Information Technology Report, WEF-INSEAD.

International Benchmarking for the Information Society
35
Italy (2000) “The Digital Divide: Enhancing Access to ICTs”, OECD joint WPTISP/WPIE workshop. ITU (2001) “World Telecommunication Indicators”, Geneva. ITU (2003) “World Telecommunication Development Report: Access Indicators for the Information Society” Korea (2004) “Measuring the Digital Divide with personal Informatization Indices” McConnell International (2000) “Risk E-business: Seizing the Opportunity of Global E-readiness” McConnell International (2001) “Ready? Net. Go! Partnerships Leading the Global Economy”, May. National Science Foundation (2001) “The Application and Implications of Information Technologies in the Home: Where are the Data and What Do they Say”?, February. OECD/UN/UNDP/World Bank Forum (2002) “Exploiting the Digital Opportunities for Poverty Reduction”, Paris, March. OECD (2001a) “Understanding the Digital Divide”, Paris. OECD (2001b) “The Digital Divide: Diffusion and Use of ICTs”, DSTI/ICCP/IE (2000)9/REV2, October. OECD (2002) “ICT Diffusion and the Digital Divide”, DSTI/ICCP/IE (2001)9/CHAP6/REV1, prepared as Chapter 6 for the Information Technology Outlook 2002, February. OECD (2004 - forthcoming) “Information Technology Outlook”, Chapter 4, ICT Diffusion and Use, Paris. OECD (2005 – forthcoming) “Guide to Information Society Measurements” Orbicom (1999) “Information Societies: Crises in the Making”? Orbicom (2002) “Monitoring the Digital Divide”, National Research Council of Canada. Orbicom (2003) “Monitoring the Digital Divide…and Beyond”, National Research Council of Canada. Sciadas G. (2000) “Digital Households in Canada” in Information, Innovation and Impacts, eds. John de la Moth and Gilles Paquet, Economics of Science, Technology and Innovation, Kluwer Academic Publishers.

International Benchmarking for the Information Society
36
Sciadas George (2002a) “Unveiling the Digital Divide”, New Economy Statistical Information System, proceedings, http://nesis.jrc.cec.eu.int/downld/event/doc/305_SciadasFinal.zip Sciadas George (2002b) “Unveiling the Digital Divide”, Connectedness Series, No. 7, Statistics Canada, Cat. No. 56F0004MPE, October. The Conference Board of Canada (2001) “Connectedness and the Economy: Measuring Our Performance”, January. The Conference Board of Canada (2002) “Connecting Canadians: 3rd Annual Report” U.N. (2001) “Information and Communication Technologies Task Force”, Report of the Secretary General, February. UNCTAD (2003) “Information and Communication technology Development Indices”. UNCTAD (2004) “Partnership on Measuring ICT for Development”, project document. UNDP (2003) “ICT and Human Development: Towards Building a Composite Index for Asia”, technical paper. UN ICT Task Force (2003) “Tools for Development: Using ICT to Achieve the Millennium Development Goals” U.S. (1995) “Falling through the Net: A Survey of the ‘Have-Nots’ in Urban and Rural America”, Department of Commerce, July. U.S. (1998) “Falling through the Net II: New Data on the Digital Divide”, Department of Commerce, July. U.S. (1999) Falling through the Net III: Defining the Digital Divide”, Department of Commerce, July. U.S. (2000) “Falling through the Net IV: Toward Digital Inclusion”, Department of Commerce, October. U.S. (2002) “A Nation Online: How Americans Are Expanding Their Use of the Internet”, Department of Commerce, February. World Economic Forum (2002) “Annual report of the Global Digital Divide Initiative”, www.weforum.org WSIS (2003) “Connecting the World”, Geneva.

International Benchmarking for the Information Society
37
The Networked Readiness Index, 2002-3 (WEF-INSEAD)
country score NRI rank country score NRI rankUnited States 5.50 1 Lithuania 3.63 42Singapore 5.40 2 Mauritius 3.62 43Finland 5.23 3 Mexico 3.57 44Sweden 5.20 4 India 3.54 45Denmark 5.19 5 Jordan 3.53 46Canada 5.07 6 Poland 3.51 47Switzerland 5.06 7 Croatia 3.48 48Norway 5.03 8 Costa Rica 3.46 49Australia 4.88 9 Argentina 3.45 50Iceland 4.88 10 China 3.38 51Germany 4.85 11 Trinidad and Tobago 3.37 52Japan 4.80 12 Jamaica 3.36 53Netherlands 4.79 13 Uruguay 3.35 54Luxembourg 4.76 14 Botswana 3.34 55United Kingdom 4.68 15 Turkey 3.32 56Israel 4.64 16 Dominican Republic 3.32 57Taiwan 4.62 17 Panama 3.31 58Hong Kong SAR 4.61 18 Namibia 3.28 59France 4.60 19 Colombia 3.28 60Korea 4.60 20 Romania 3.26 61Austria 4.56 21 El Salvador 3.22 62Ireland 4.55 22 Russian Federation 3.19 63New Zealand 4.48 23 Morocco 3.19 64Belgium 4.43 24 Egypt 3.19 65Estonia 4.25 25 Sri Lanka 3.15 66Malaysia 4.19 26 Bulgaria 3.15 67Malta 4.15 27 Vietnam 3.13 68Italy 4.07 28 Philippines 3.10 69Spain 4.01 29 Peru 3.09 70Slovenia 3.99 30 Tanzania 3.09 71Portugal 3.94 31 Venezuela 3.09 72Chile 3.94 32 Indonesia 3.06 73Czech Republic 3.80 33 Ghana 3.06 74Greece 3.76 34 Macedonia, FYR 3.05 75Latvia 3.74 35 Pakistan 3.03 76Hungary 3.74 36 Serbia 2.98 77South Africa 3.72 37 Ukraine 2.96 78Thailand 3.72 38 Nigeria 2.92 79Brazil 3.67 39 Uganda 2.90 80Tunisia 3.67 40 Senegal 2.90 81Slovak Republic 3.66 41 Gambia 2.85 82
con't

International Benchmarking for the Information Society
38
con't
country score NRI rank country score NRI rankCameroon 2.82 83 Bangladesh 2.57 93Kenya 2.81 84 Nicaragua 2.56 94Zambia 2.80 85 Zimbabwe 2.53 95Guatemala 2.76 86 Mali 2.52 96Algeria 2.75 87 Mozambique 2.51 97Malawi 2.71 88 Honduras 2.41 98Ecuador 2.68 89 Angola 2.32 99Bolivia 2.66 90 Haiti 2.27 100Paraguay 2.62 91 Ethiopia 2.13 101Madagascar 2.60 92 Chad 2.09 102
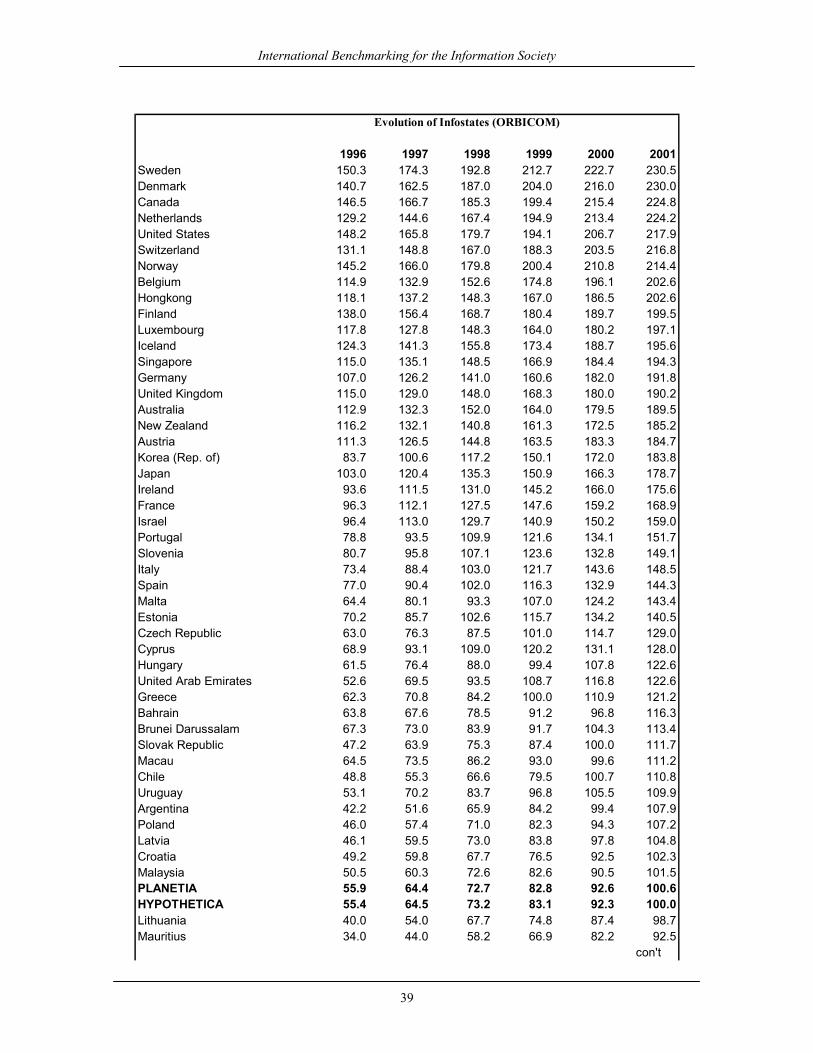
International Benchmarking for the Information Society
39
Evolution of Infostates (ORBICOM)
1996 1997 1998 1999 2000 2001Sweden 150.3 174.3 192.8 212.7 222.7 230.5Denmark 140.7 162.5 187.0 204.0 216.0 230.0Canada 146.5 166.7 185.3 199.4 215.4 224.8Netherlands 129.2 144.6 167.4 194.9 213.4 224.2United States 148.2 165.8 179.7 194.1 206.7 217.9Switzerland 131.1 148.8 167.0 188.3 203.5 216.8Norway 145.2 166.0 179.8 200.4 210.8 214.4Belgium 114.9 132.9 152.6 174.8 196.1 202.6Hongkong 118.1 137.2 148.3 167.0 186.5 202.6Finland 138.0 156.4 168.7 180.4 189.7 199.5Luxembourg 117.8 127.8 148.3 164.0 180.2 197.1Iceland 124.3 141.3 155.8 173.4 188.7 195.6Singapore 115.0 135.1 148.5 166.9 184.4 194.3Germany 107.0 126.2 141.0 160.6 182.0 191.8United Kingdom 115.0 129.0 148.0 168.3 180.0 190.2Australia 112.9 132.3 152.0 164.0 179.5 189.5New Zealand 116.2 132.1 140.8 161.3 172.5 185.2Austria 111.3 126.5 144.8 163.5 183.3 184.7Korea (Rep. of) 83.7 100.6 117.2 150.1 172.0 183.8Japan 103.0 120.4 135.3 150.9 166.3 178.7Ireland 93.6 111.5 131.0 145.2 166.0 175.6France 96.3 112.1 127.5 147.6 159.2 168.9Israel 96.4 113.0 129.7 140.9 150.2 159.0Portugal 78.8 93.5 109.9 121.6 134.1 151.7Slovenia 80.7 95.8 107.1 123.6 132.8 149.1Italy 73.4 88.4 103.0 121.7 143.6 148.5Spain 77.0 90.4 102.0 116.3 132.9 144.3Malta 64.4 80.1 93.3 107.0 124.2 143.4Estonia 70.2 85.7 102.6 115.7 134.2 140.5Czech Republic 63.0 76.3 87.5 101.0 114.7 129.0Cyprus 68.9 93.1 109.0 120.2 131.1 128.0Hungary 61.5 76.4 88.0 99.4 107.8 122.6United Arab Emirates 52.6 69.5 93.5 108.7 116.8 122.6Greece 62.3 70.8 84.2 100.0 110.9 121.2Bahrain 63.8 67.6 78.5 91.2 96.8 116.3Brunei Darussalam 67.3 73.0 83.9 91.7 104.3 113.4Slovak Republic 47.2 63.9 75.3 87.4 100.0 111.7Macau 64.5 73.5 86.2 93.0 99.6 111.2Chile 48.8 55.3 66.6 79.5 100.7 110.8Uruguay 53.1 70.2 83.7 96.8 105.5 109.9Argentina 42.2 51.6 65.9 84.2 99.4 107.9Poland 46.0 57.4 71.0 82.3 94.3 107.2Latvia 46.1 59.5 73.0 83.8 97.8 104.8Croatia 49.2 59.8 67.7 76.5 92.5 102.3Malaysia 50.5 60.3 72.6 82.6 90.5 101.5PLANETIA 55.9 64.4 72.7 82.8 92.6 100.6HYPOTHETICA 55.4 64.5 73.2 83.1 92.3 100.0Lithuania 40.0 54.0 67.7 74.8 87.4 98.7Mauritius 34.0 44.0 58.2 66.9 82.2 92.5
con't

International Benchmarking for the Information Society
40
con't1996 1997 1998 1999 2000 2001
Brazil 36.6 43.6 52.1 63.9 77.3 91.6Barbados 47.8 53.3 63.9 69.9 79.6 91.2Qatar 51.6 72.6 65.7 92.4 102.4 90.8Trinidad and Tobago 36.2 49.5 59.8 71.7 84.7 90.6Kuwait 60.2 69.1 75.4 78.7 82.6 88.1Lebanon 38.6 55.5 66.0 75.5 82.5 87.4Bulgaria 38.1 46.3 53.7 65.0 77.0 86.8Costa Rica 48.6 53.9 59.8 67.6 76.4 86.0Mexico 35.0 42.2 51.6 63.6 73.6 83.0Turkey 36.4 45.3 52.4 66.0 70.9 79.9Belize 31.3 48.0 53.4 62.3 69.7 75.5South Africa 46.6 54.1 61.9 67.5 71.8 74.5Romania 28.2 38.1 51.7 59.3 68.7 73.4Russia 35.1 43.3 48.8 50.6 63.8 72.9Panama 32.1 39.7 48.7 57.2 74.6 72.6Venezuela 36.7 42.8 51.9 61.9 65.8 72.3Jamaica 34.2 40.5 49.8 54.5 66.3 70.8Yugoslavia 29.3 38.0 44.2 49.5 64.0 69.1Colombia 37.2 44.1 51.8 58.6 62.3 67.8Jordan 20.7 31.3 40.8 49.0 56.0 66.9Thailand 32.1 39.1 41.9 48.9 55.6 64.7Oman 20.0 36.7 42.6 48.1 52.8 64.3Peru 31.5 35.4 42.2 49.0 53.2 61.8Saudi Arabia 23.3 23.3 31.0 46.6 52.3 61.5Fiji 27.6 33.1 40.2 47.0 54.2 58.4Ukraine 26.2 31.7 36.5 41.2 49.4 58.2Georgia 20.3 26.8 31.5 39.1 46.0 54.7Samoa 12.5 20.4 24.1 28.0 44.4 54.1Ecuador 24.4 28.7 31.8 41.4 46.6 53.9Namibia 17.6 24.9 34.6 36.0 48.3 53.7El Salvador 20.6 25.3 32.7 42.4 47.1 51.9China 15.7 19.6 26.0 36.3 44.7 51.4Philippines 21.0 24.7 34.1 37.9 44.1 50.4Botswana 10.2 14.1 29.5 41.0 46.4 50.3Guyana 21.5 24.2 25.4 32.3 45.3 49.4Iran (Islamic Rep. of) 18.1 22.5 26.4 35.0 42.1 49.0Moldova 11.2 19.1 29.8 34.1 45.5 48.9Tunisia 15.5 17.4 21.3 30.9 35.8 48.0Bolivia 20.9 25.2 30.7 37.5 42.6 47.0Paraguay 17.7 24.1 31.3 36.2 40.7 45.0Armenia 17.3 23.5 26.9 36.1 40.8 44.5Guatemala 13.5 18.6 24.3 29.6 35.8 41.9Kyrgyzstan 6.2 9.7 18.3 25.2 33.5 41.3Egypt 15.8 19.9 23.2 29.7 35.5 40.4Mongolia 11.6 15.5 19.1 26.0 36.2 38.6Nicaragua 19.7 22.9 25.9 29.5 34.7 38.4Indonesia 17.7 21.8 23.7 27.5 32.1 37.6Morocco 12.8 16.8 22.7 25.9 33.4 37.5Honduras 12.7 16.8 21.5 25.5 28.6 33.7Gabon 6.2 12.7 16.8 19.1 28.2 33.5
con't

International Benchmarking for the Information Society
41
con't1996 1997 1998 1999 2000 2001
Cuba 12.7 15.0 17.8 21.6 26.5 32.4Albania 10.3 13.2 16.1 19.3 22.6 32.2Sri Lanka 13.7 17.6 21.2 24.9 29.4 31.7Zimbabwe 6.5 13.9 17.6 22.9 27.4 30.2Senegal 8.9 11.8 15.6 20.7 25.3 29.4Viet Nam 5.5 7.8 12.1 17.9 21.7 29.2Algeria 9.9 13.0 14.9 22.2 22.6 29.0Togo 4.2 10.8 13.7 17.3 23.9 28.4India 10.5 13.2 15.8 19.1 23.4 27.9Cote d'Ivoire 8.9 11.8 14.8 18.1 21.8 26.9Gambia 7.3 9.7 13.2 17.1 18.9 26.8Syria 3.0 7.6 8.5 17.4 21.7 26.6Pakistan 8.2 11.6 14.3 15.8 18.7 21.9Kenya 6.9 8.8 10.0 13.1 17.6 21.0Papua New Guinea 6.5 10.4 12.7 17.5 19.8 20.2Mauritania 3.0 4.0 6.1 8.0 15.9 20.2Djibouti 10.8 12.6 12.9 15.6 16.7 20.1Cameroon 5.4 6.2 7.2 12.1 16.5 18.7Zambia 9.2 9.6 11.6 15.4 17.7 18.6Lao P.D.R. 4.1 6.0 7.6 9.4 11.6 17.3Yemen 5.7 9.2 10.8 13.2 14.8 17.0Ghana 7.2 9.3 10.6 13.0 13.0 16.2Benin 4.5 6.5 7.4 9.2 9.2 15.4Nepal 3.1 4.0 4.9 10.6 13.0 14.5Nigeria 5.8 7.3 8.9 10.0 10.8 14.4Tanzania 3.6 5.3 6.5 8.9 11.8 14.3Sudan 1.9 6.1 8.4 11.8 10.9 13.5Madagascar 4.9 5.9 8.2 11.2 12.7 12.9Guinea 3.6 4.6 5.4 9.6 10.8 12.1Uganda 4.2 5.0 7.9 9.2 10.7 11.5Cambodia 3.9 6.0 7.1 8.3 9.6 11.2Burkina Faso 2.5 4.8 6.2 7.0 8.6 10.7Angola 4.2 5.8 6.9 8.8 9.3 10.6Mozambique 2.4 5.3 6.8 8.2 10.2 10.5Mali 3.1 3.5 4.1 6.0 8.3 9.9Bangladesh 2.0 4.2 6.9 10.2 12.3 9.5Malawi 3.1 3.8 4.6 6.2 8.2 9.5Eritrea 1.7 3.3 3.7 4.7 8.0 8.5Central African Rep. 4.5 5.2 5.8 6.9 7.3 7.8Myanmar 2.2 2.5 3.3 4.8 6.3 6.5Ethiopia 1.2 1.9 2.2 4.4 5.1 6.1Chad 1.2 1.6 2.1 2.6 5.1 5.2

International Benchmarking for the Information Society
42
Digital Access Index, 2002 (ITU)
High UpperSweden 0.85 Ireland 0.69Denmark 0.83 Cyprus 0.68Iceland 0.82 Estonia 0.67Korea (Rep.) 0.82 Spain 0.67Norway 0.79 Malta 0.67Netherlands 0.79 Czech Republic 0.66Hong Kong, China 0.79 Greece 0.66Finland 0.79 Portugal 0.65Taiwan, China 0.79 UAE 0.64Canada 0.78 Macao, China 0.64United States 0.78 Hungary 0.63United Kingdom 0.77 Bahamas 0.62Switzerland 0.76 Bahrain 0.60Singapore 0.75 St. Kitts and Nevis 0.60Japan 0.75 Poland 0.59Luxembourg 0.75 Slovak Republic 0.59Austria 0.75 Croatia 0.59Germany 0.74 Chile 0.58Australia 0.74 Antigua & Barbuda 0.57Belgium 0.74 Barbados 0.57New Zealand 0.72 Malaysia 0.57Italy 0.72 Lithuania 0.56France 0.72 Qatar 0.55Slovenia 0.72 Brunei Darussalam 0.55Israel 0.70 Latvia 0.54
Uruguay 0.54Seychelles 0.54Dominica 0.54Argentina 0.53Trinidad & Tobago 0.53Bulgaria 0.53Jamaica 0.53Costa Rica 0.52St. Lucia 0.52Kuwait 0.51Grenada 0.51Mauritius 0.50Russia 0.50Mexico 0.50Brazil 0.50
con't
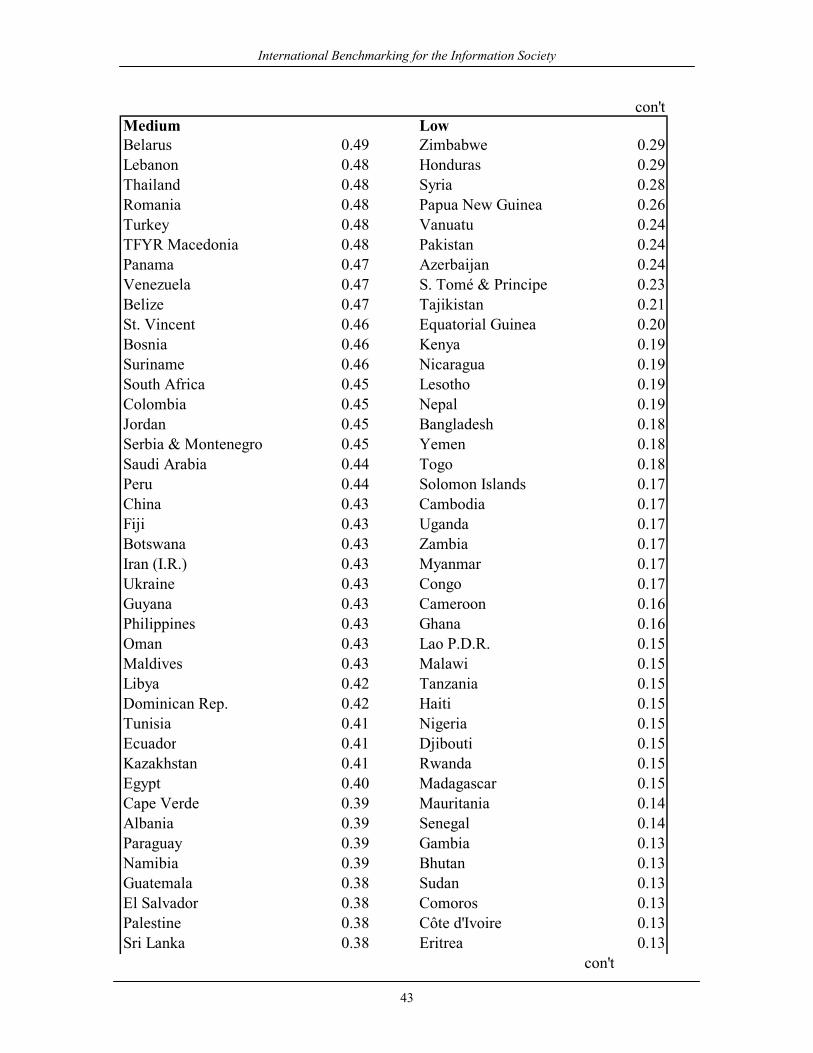
International Benchmarking for the Information Society
43
Medium LowBelarus 0.49 Zimbabwe 0.29Lebanon 0.48 Honduras 0.29Thailand 0.48 Syria 0.28Romania 0.48 Papua New Guinea 0.26Turkey 0.48 Vanuatu 0.24TFYR Macedonia 0.48 Pakistan 0.24Panama 0.47 Azerbaijan 0.24Venezuela 0.47 S. Tomé & Principe 0.23Belize 0.47 Tajikistan 0.21St. Vincent 0.46 Equatorial Guinea 0.20Bosnia 0.46 Kenya 0.19Suriname 0.46 Nicaragua 0.19South Africa 0.45 Lesotho 0.19Colombia 0.45 Nepal 0.19Jordan 0.45 Bangladesh 0.18Serbia & Montenegro 0.45 Yemen 0.18Saudi Arabia 0.44 Togo 0.18Peru 0.44 Solomon Islands 0.17China 0.43 Cambodia 0.17Fiji 0.43 Uganda 0.17Botswana 0.43 Zambia 0.17Iran (I.R.) 0.43 Myanmar 0.17Ukraine 0.43 Congo 0.17Guyana 0.43 Cameroon 0.16Philippines 0.43 Ghana 0.16Oman 0.43 Lao P.D.R. 0.15Maldives 0.43 Malawi 0.15Libya 0.42 Tanzania 0.15Dominican Rep. 0.42 Haiti 0.15Tunisia 0.41 Nigeria 0.15Ecuador 0.41 Djibouti 0.15Kazakhstan 0.41 Rwanda 0.15Egypt 0.40 Madagascar 0.15Cape Verde 0.39 Mauritania 0.14Albania 0.39 Senegal 0.14Paraguay 0.39 Gambia 0.13Namibia 0.39 Bhutan 0.13Guatemala 0.38 Sudan 0.13El Salvador 0.38 Comoros 0.13Palestine 0.38 Côte d'Ivoire 0.13Sri Lanka 0.38 Eritrea 0.13
con't
con't

International Benchmarking for the Information Society
44
con'tMedium LowBolivia 0.38 D.R. Congo 0.12Cuba 0.38 Benin 0.12Samoa 0.37 Mozambique 0.12Algeria 0.37 Angola 0.11Turkmenistan 0.37 Burundi 0.10Georgia 0.37 Guinea 0.10Swaziland 0.37 Sierra Leone 0.10Moldova 0.37 Central Af. Rep. 0.10Mongolia 0.35 Ethiopia 0.10Indonesia 0.34 Guinea-Bissau 0.10Gabon 0.34 Chad 0.10Morocco 0.33 Mali 0.09India 0.32 Burkina Faso 0.08Kyrgyzstan 0.32 Niger 0.04Uzbekistan 0.31Viet Nam 0.31Armenia 0.30