international b. schmidt hull college of business augusta state university
TRANSCRIPT
A n d e x c h a r t sW e b p a g eH a n d o u t s
C r o s s r e l a t i o a l e c o n s t a n d a r d s
INTERNATIONAL
B. Schmidt
Hull College of Business
Augusta State University

OPPORTUNITY COST
• The Opportunity Cost of a Cell Phone– The opportunity cost of a cell phone is the
decrease in the quantity of DVDs divided by the increase in the number of cell phones as we move along the PPF.
– Figure 3.4 illustrates the calculation of the opportunity cost of a cell phone.
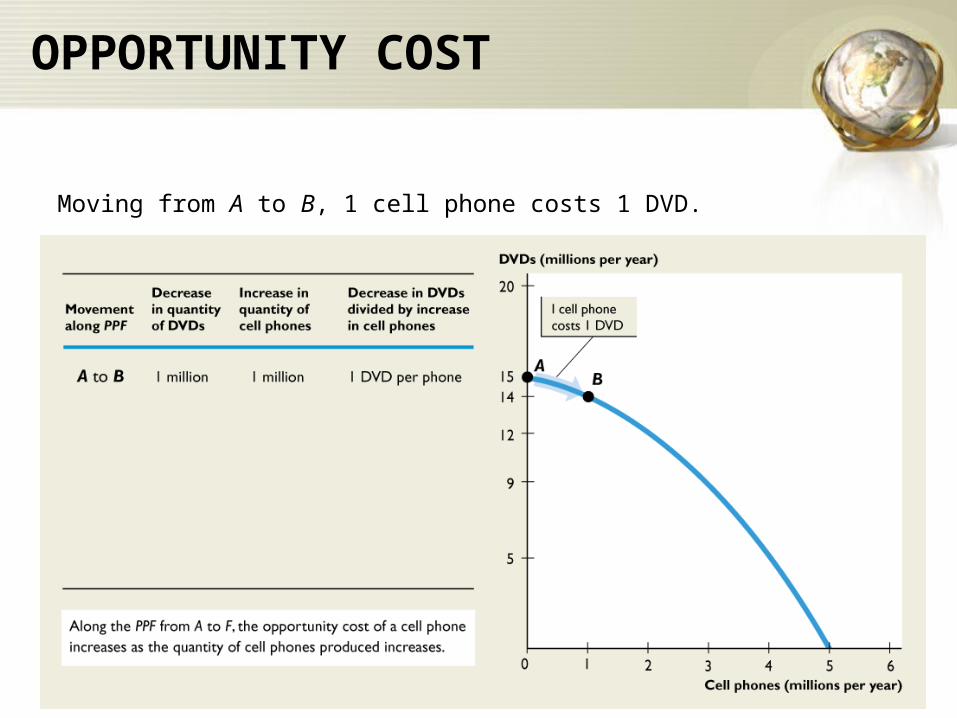
Moving from A to B, 1 cell phone costs 1 DVD.
OPPORTUNITY COST
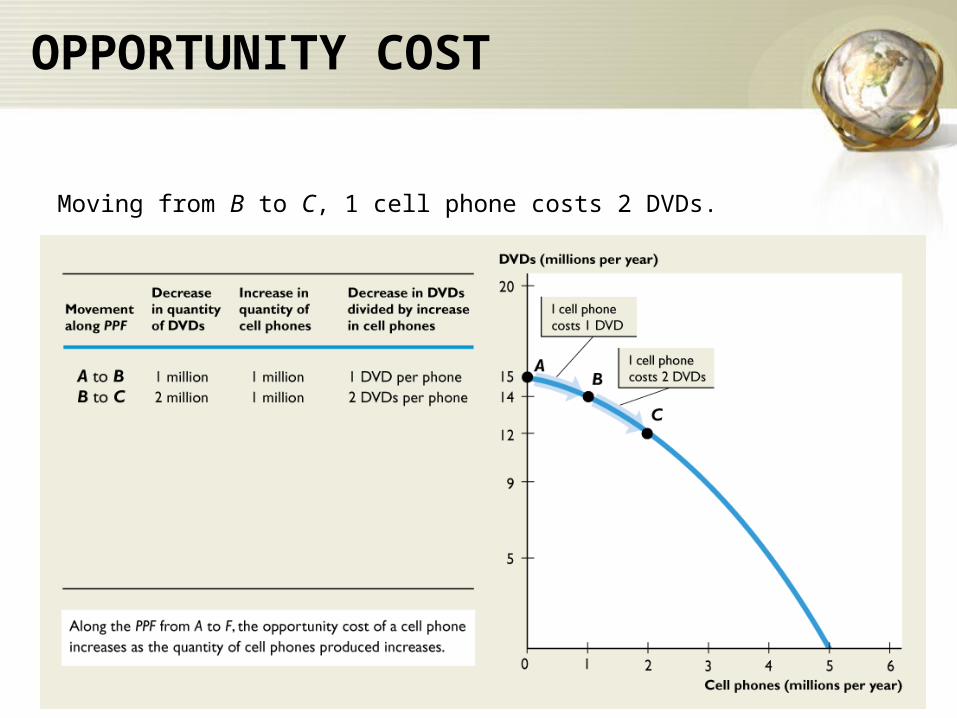
Moving from B to C, 1 cell phone costs 2 DVDs.
OPPORTUNITY COST
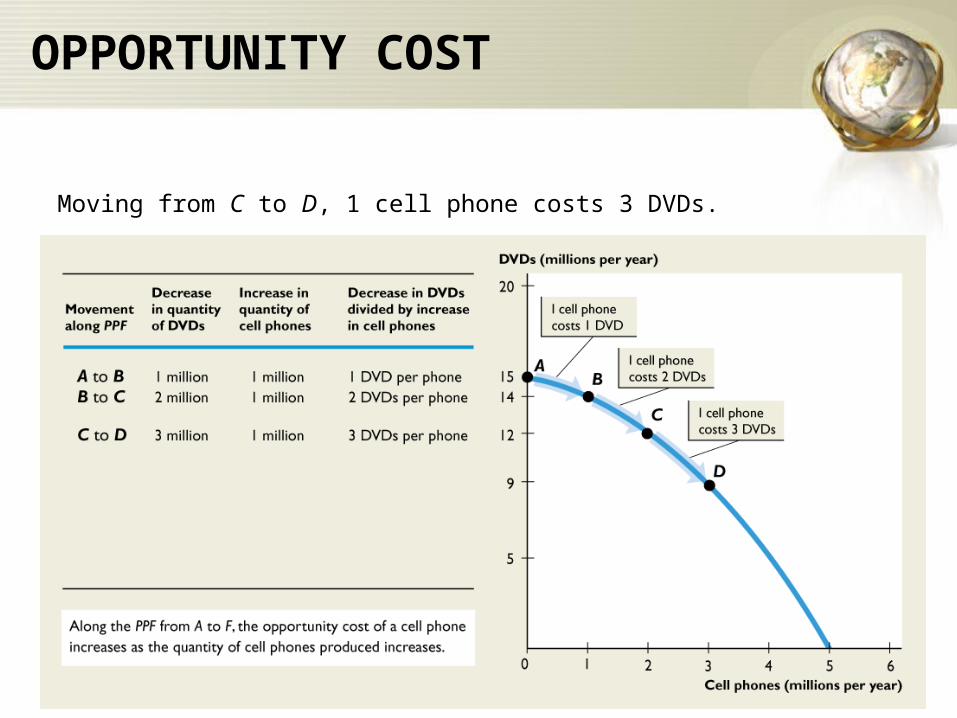
Moving from C to D, 1 cell phone costs 3 DVDs.
OPPORTUNITY COST
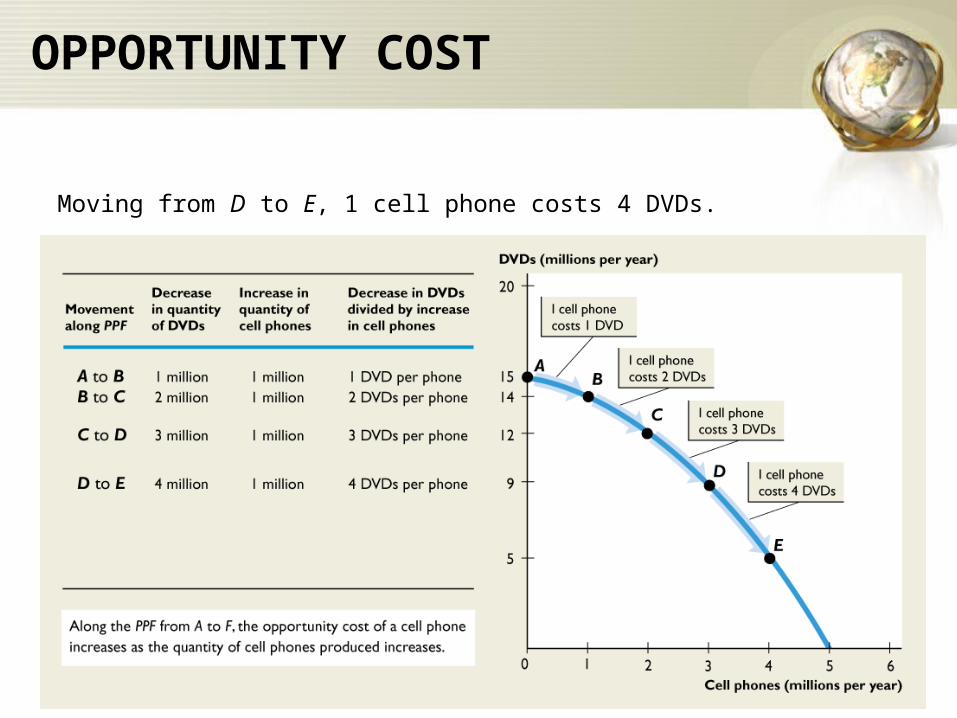
Moving from D to E, 1 cell phone costs 4 DVDs.
OPPORTUNITY COST

Moving from E to F, 1 cell phone costs 5 DVDs.
OPPORTUNITY COST

OPPORTUNITY COST (increasing)
• Slope of the PPF and Opportunity Cost– The magnitude of the slope of the PPF
measures opportunity cost.– The slope of the PPF in Figure 3.4 measures
the opportunity cost of a cell phone.– The PPF is bowed outward, as more water is
produced, the PPF becomes steeper and the opportunity cost of a cell phone increases.

OPPORTUNITY COST
• Opportunity Cost Is a Ratio– The opportunity cost of a cell phone is the
quantity of DVDs forgone divided by the increase in the quantity of cell phones.
– The opportunity cost of a DVD is the quantity of cell phones forgone divided by the increase in the quantity of DVDs.
– When the opportunity cost of a cell phone is x DVDs, the opportunity cost of a DVD is 1/x cell phones.

OPPORTUNITY COST
• Increasing Opportunity Costs Are Everywhere
– Just about every activity that you can think of is one with an increasing opportunity cost.
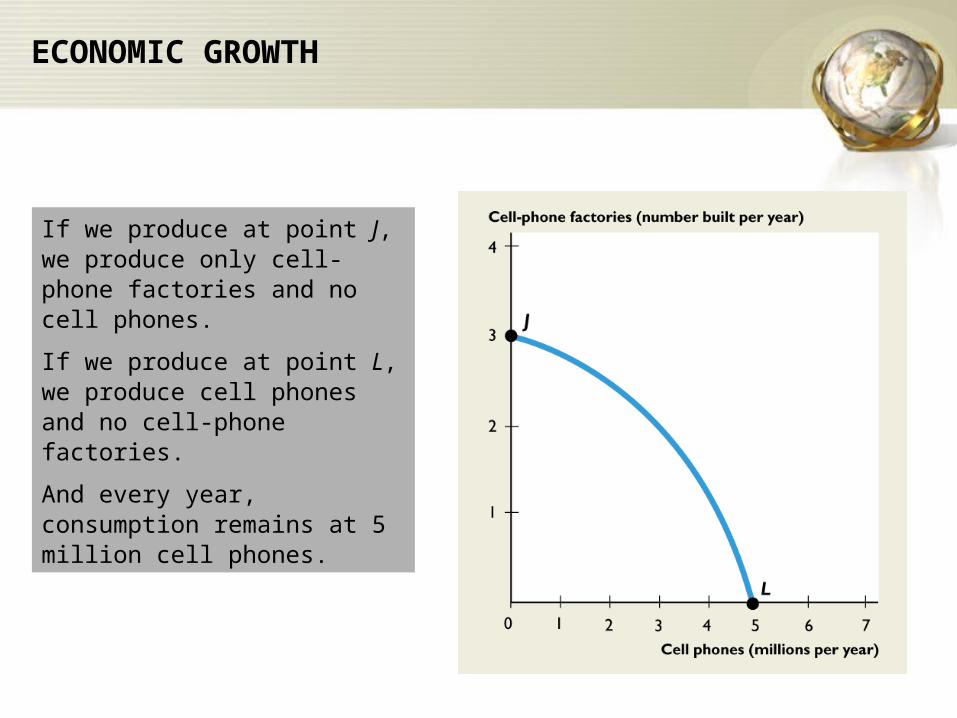
If we produce at point J, we produce only cell-phone factories and no cell phones.
If we produce at point L, we produce cell phones and no cell-phone factories.
And every year, consumption remains at 5 million cell phones.
ECONOMIC GROWTH
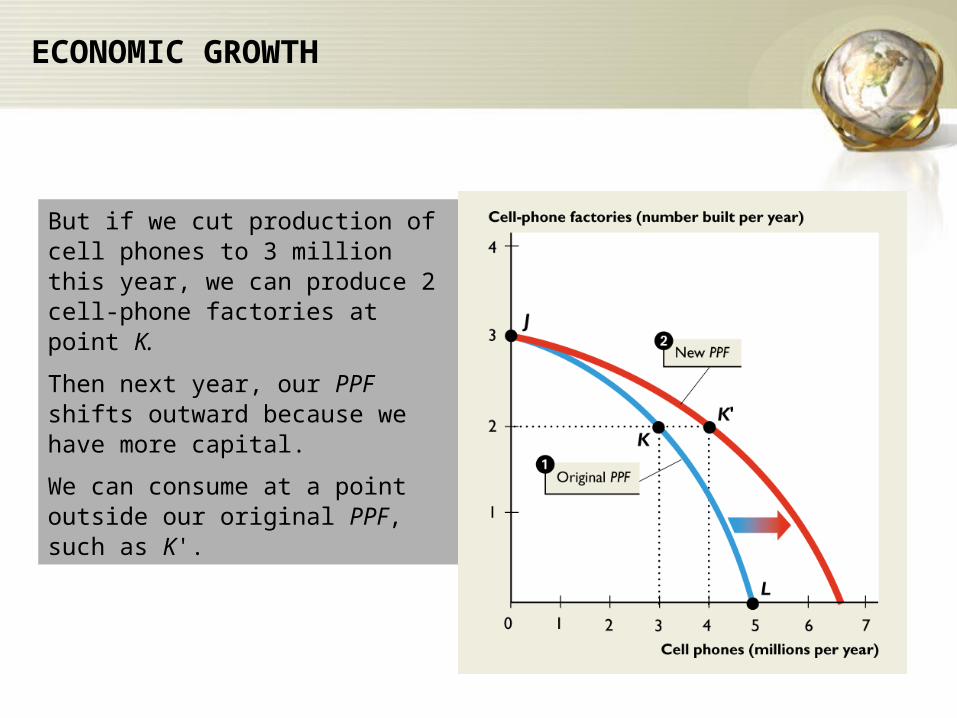
But if we cut production of cell phones to 3 million this year, we can produce 2 cell-phone factories at point K.
Then next year, our PPF shifts outward because we have more capital.
We can consume at a point outside our original PPF, such as K'.
ECONOMIC GROWTH
SPECIALIZATION AND TRADE
• Comparative Advantage– Comparative advantage is the ability of a person
to perform an activity or produce a good or service at a lower opportunity cost than someone else.
– Joe and Liz operate smoothie bars and produce smoothies and salads.
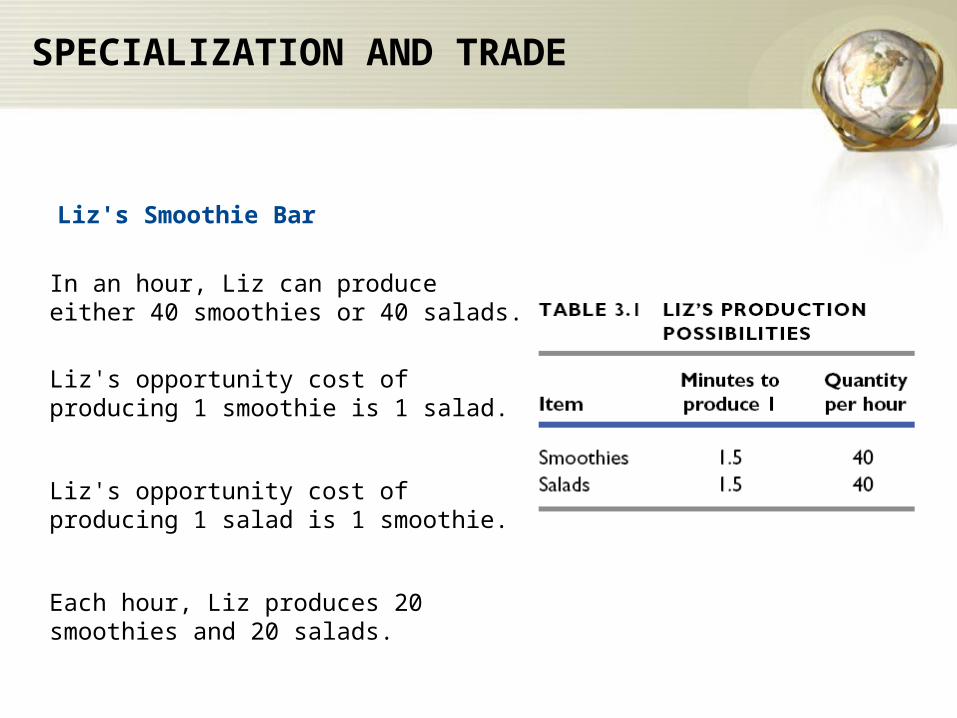
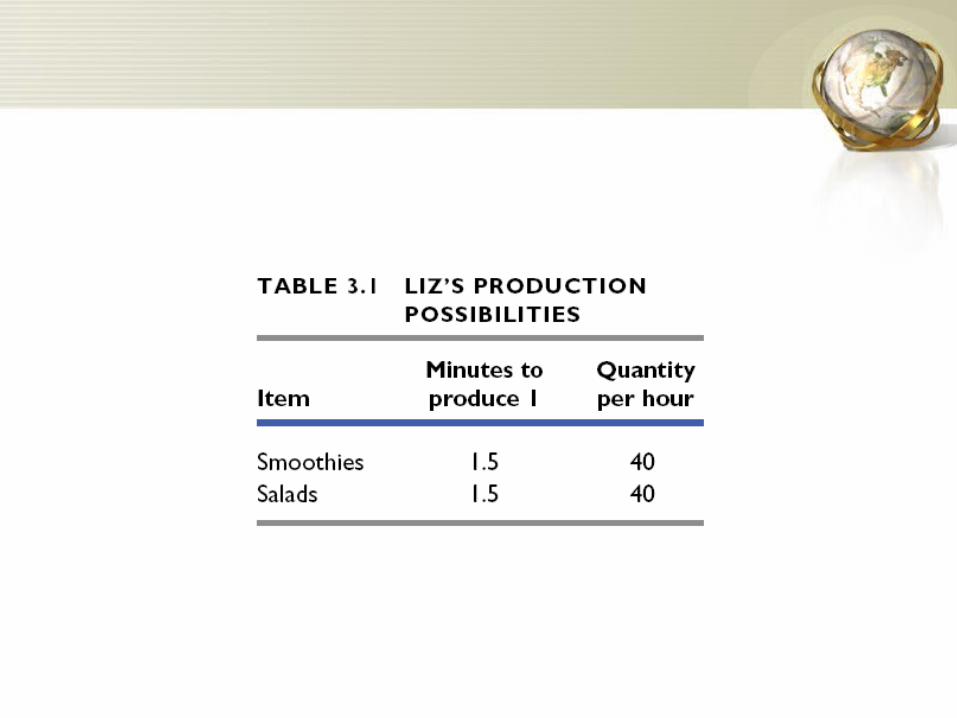
Liz's opportunity cost ofproducing 1 smoothie is 1 salad.
Liz's opportunity cost of producing 1 salad is 1 smoothie.
SPECIALIZATION AND TRADE
Liz's Smoothie Bar
In an hour, Liz can produce either 40 smoothies or 40 salads.
Each hour, Liz produces 20 smoothies and 20 salads.
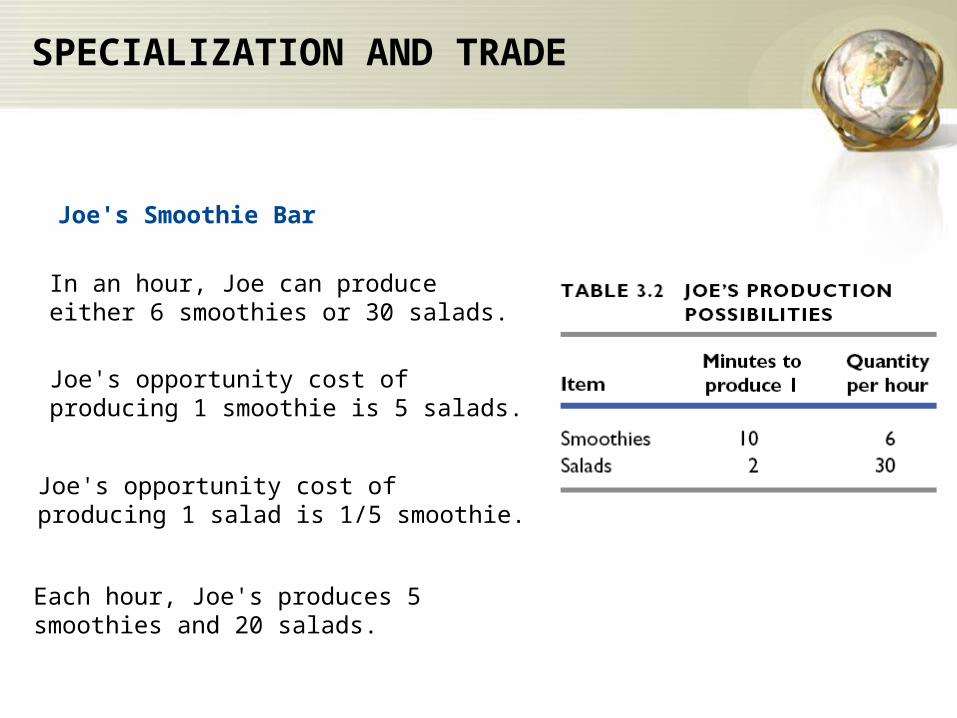
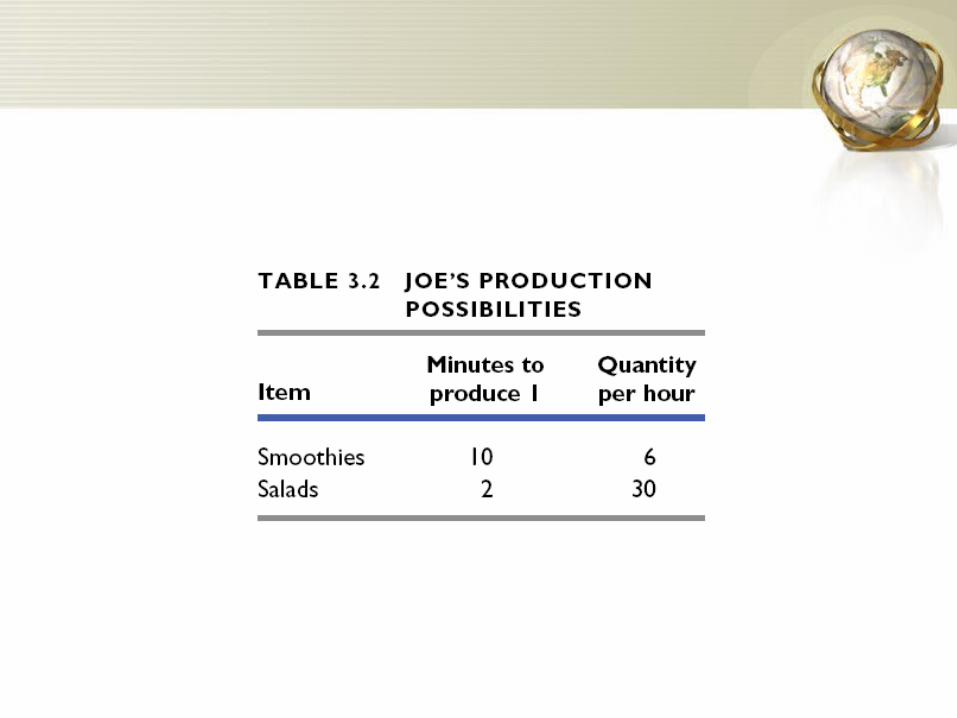
Joe's opportunity cost ofproducing 1 smoothie is 5 salads.
Joe's opportunity cost ofproducing 1 salad is 1/5 smoothie.
SPECIALIZATION AND TRADE
Joe's Smoothie Bar
In an hour, Joe can produce either 6 smoothies or 30 salads.
Each hour, Joe's produces 5 smoothies and 20 salads.

SPECIALIZATION AND TRADE
– Liz’s Absolute Advantage– Absolute advantage is a situation in which one
person is more productive than another person in several or even all activities.
– Liz is four times as productive as Joe—Liz can produce 20 smoothies and 20 salads an hour and Joe can produce only 5 smoothies and 5 salads an hour.

SPECIALIZATION AND TRADE
– Liz’s Comparative Advantage– Liz’s opportunity cost of a smoothie is 1 salad.– Joe’s opportunity cost of a smoothie is 5 salads.– Liz’s opportunity cost of a smoothie is less than
Joe’s, so Liz has a comparative advantage in producing smoothies.
SPECIALIZATION AND TRADE
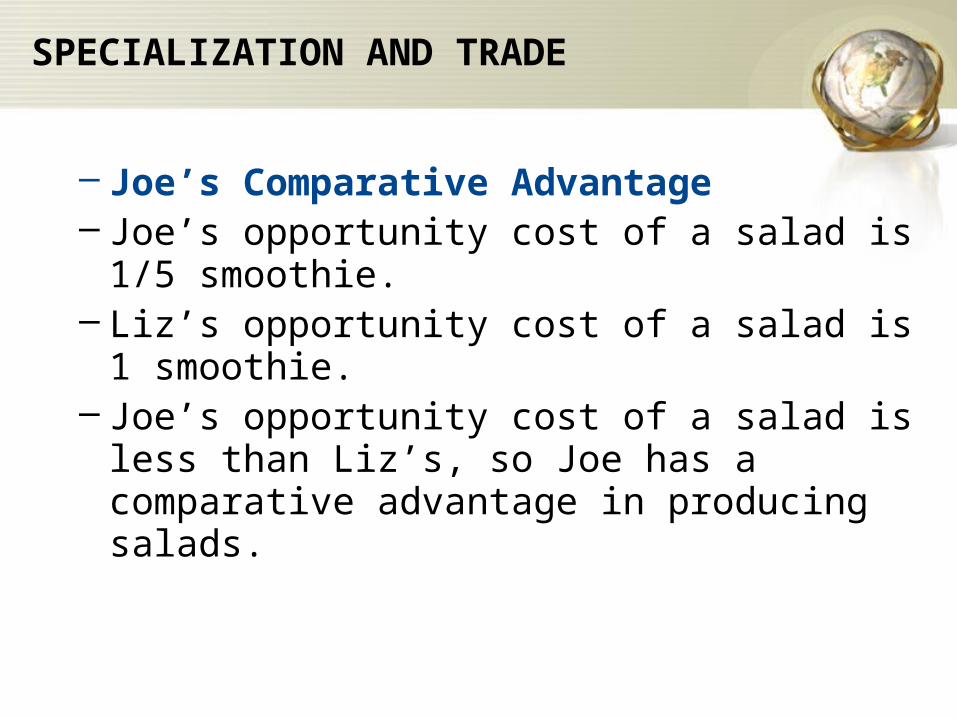
– Joe’s Comparative Advantage– Joe’s opportunity cost of a salad is 1/5 smoothie.– Liz’s opportunity cost of a salad is 1 smoothie.– Joe’s opportunity cost of a salad is less than
Liz’s, so Joe has a comparative advantage in producing salads.
SPECIALIZATION AND TRADE
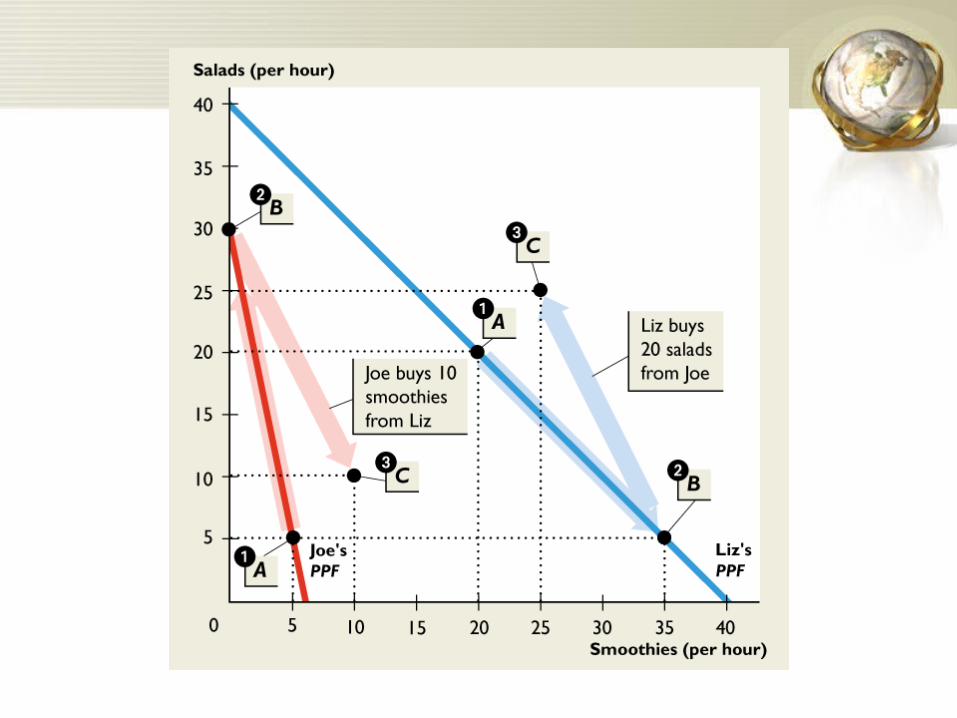
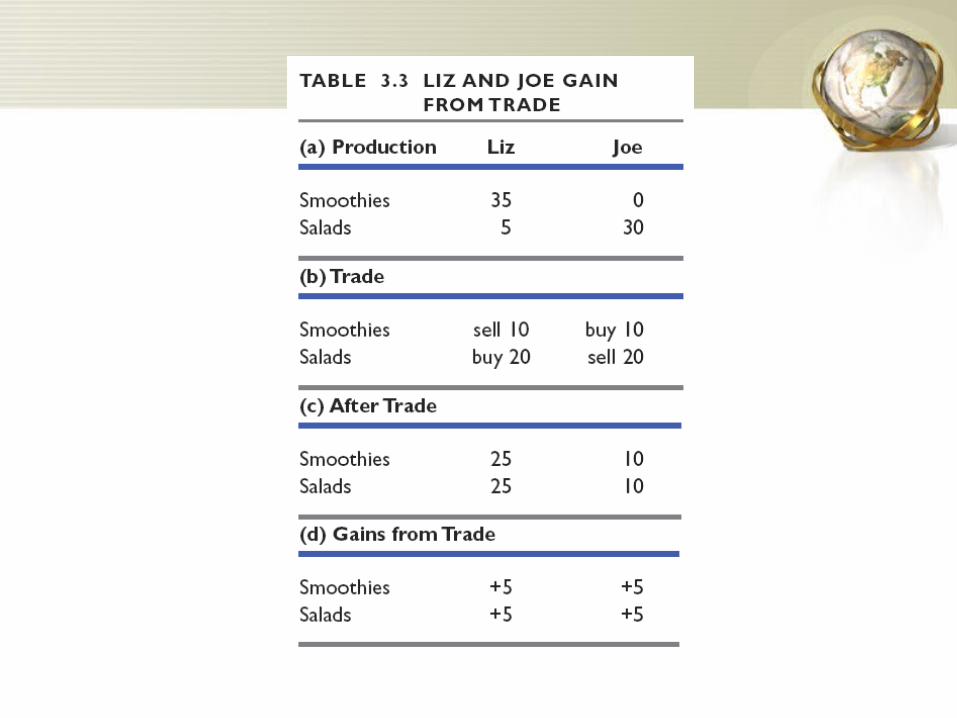
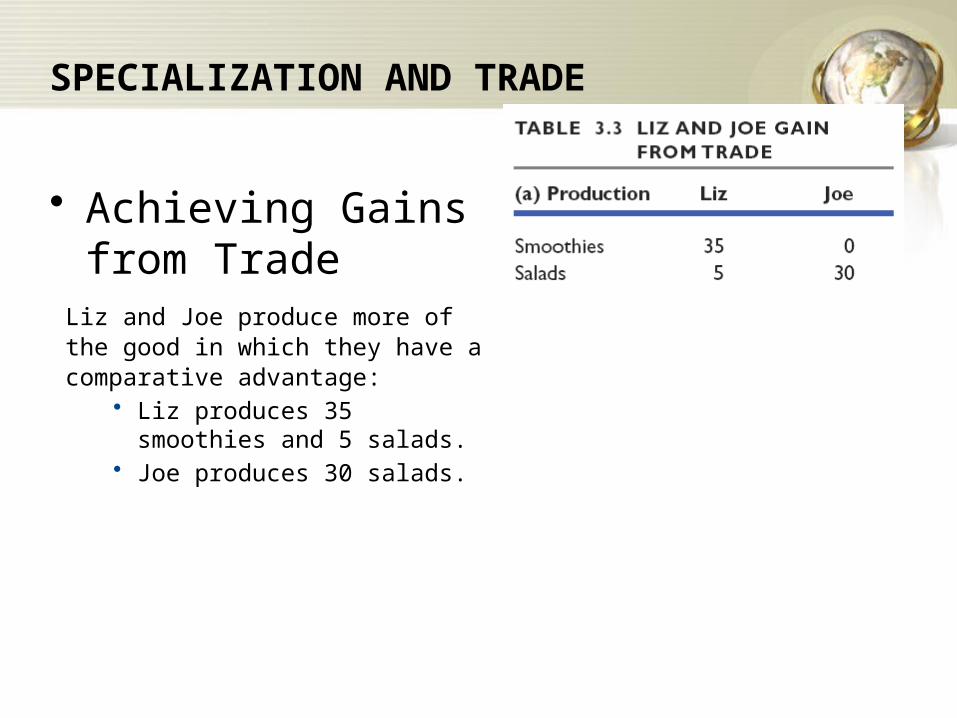
• Achieving Gains from Trade
Liz and Joe produce more ofthe good in which they have a comparative advantage:
• Liz produces 35 smoothies and 5 salads.
• Joe produces 30 salads.
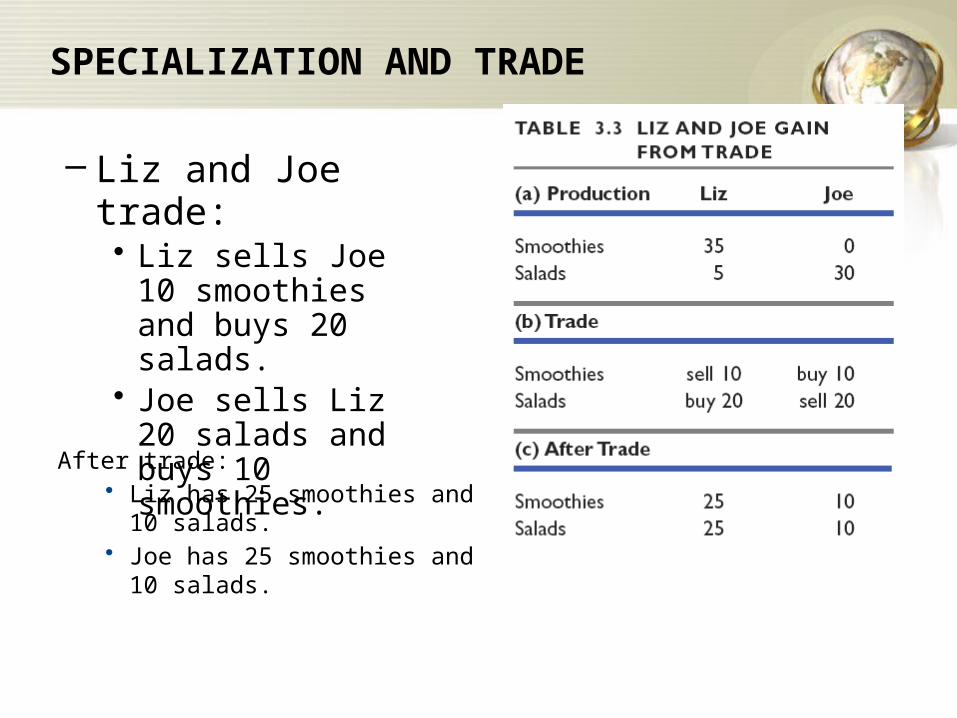
– Liz and Joe trade:• Liz sells Joe 10
smoothies and buys 20 salads.
• Joe sells Liz 20 salads and buys 10 smoothies.
After trade:• Liz has 25 smoothies and 10
salads.• Joe has 25 smoothies and 10
salads.
SPECIALIZATION AND TRADE
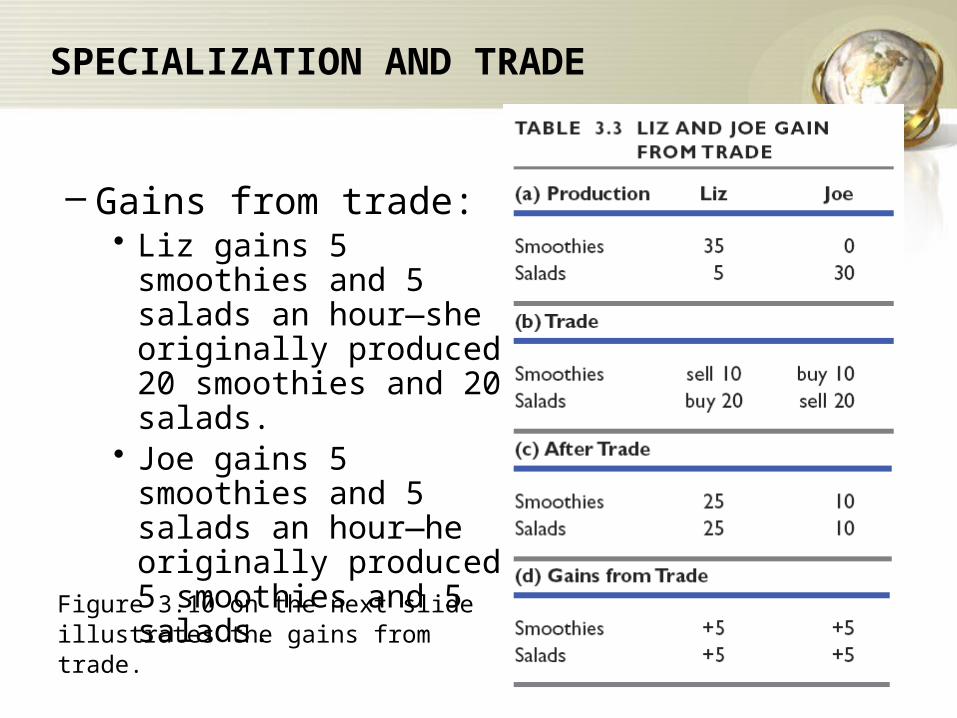
– Gains from trade:• Liz gains 5 smoothies
and 5 salads an hour—she originally produced 20 smoothies and 20 salads.
• Joe gains 5 smoothies and 5 salads an hour—he originally produced 5 smoothies and 5 salads.
Figure 3.10 on the next slide illustrates the gains from trade.
SPECIALIZATION AND TRADE

Gains From Trade (step by step)
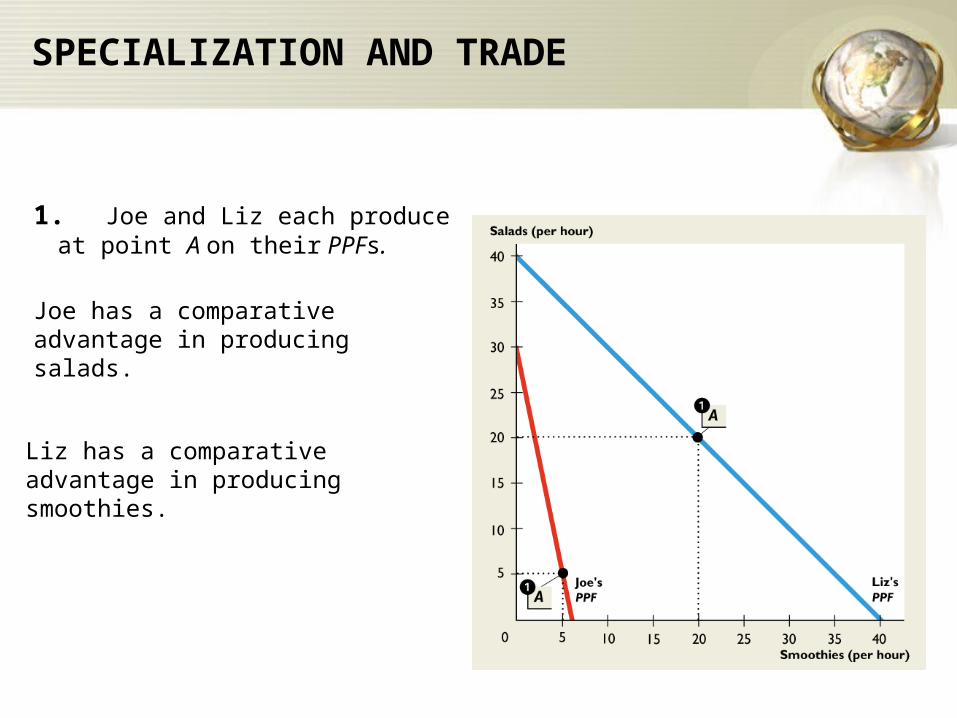
1.Joe and Liz each produce at point A on their PPFs.
Joe has a comparative advantage in producing salads.
SPECIALIZATION AND TRADE
Liz has a comparative advantage in producing smoothies.
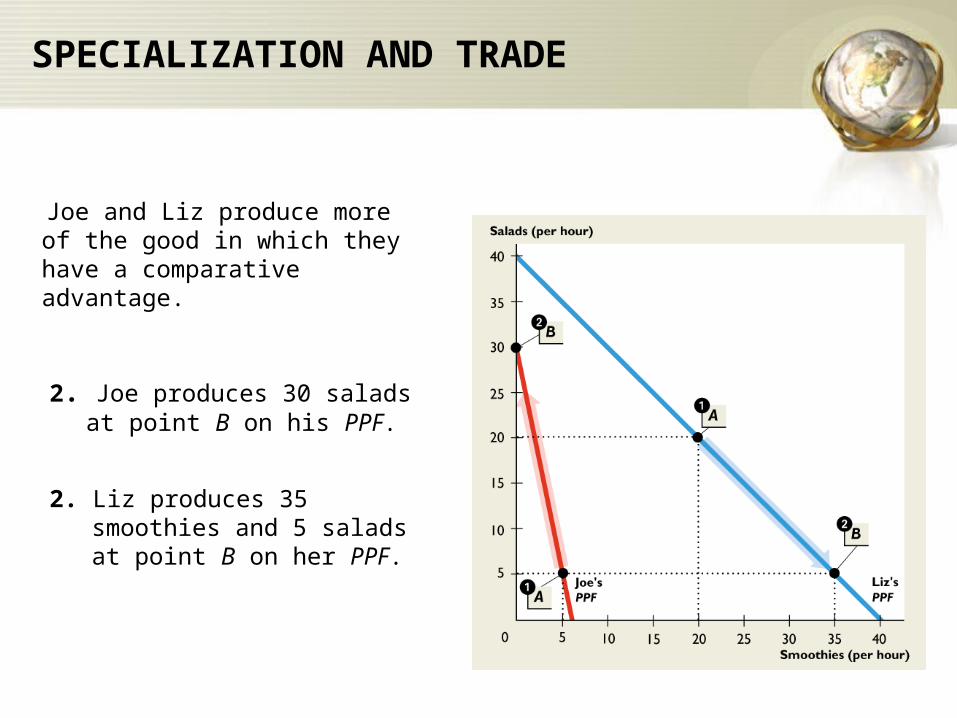
Joe and Liz produce more of the good in which they have a comparative advantage.
2. Liz produces 35 smoothies and 5 salads at point B on her PPF.
SPECIALIZATION AND TRADE
2. Joe produces 30 salads at point B on his PPF.

Joe and Liz trade salads and smoothies at a price of 2 salads per smoothie.
Liz sells 10 smoothies and buys 5 salads from Joe.
SPECIALIZATION AND TRADE
Joe sells 20 salads and buys 10 smoothies from Liz.
3. Both consume at point C, which is outside their PPFs.
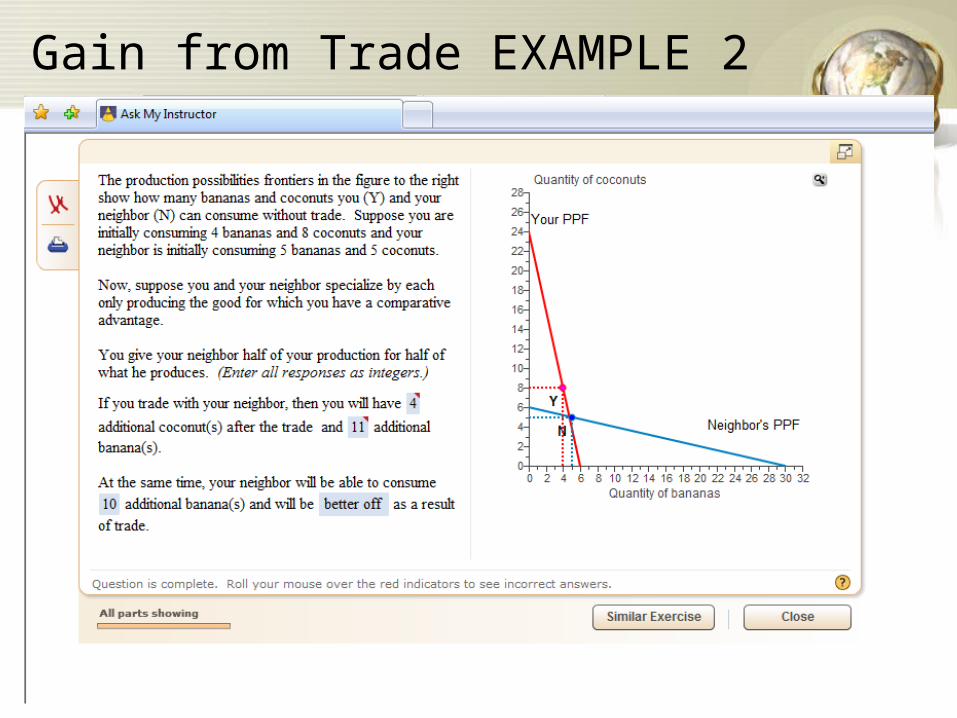
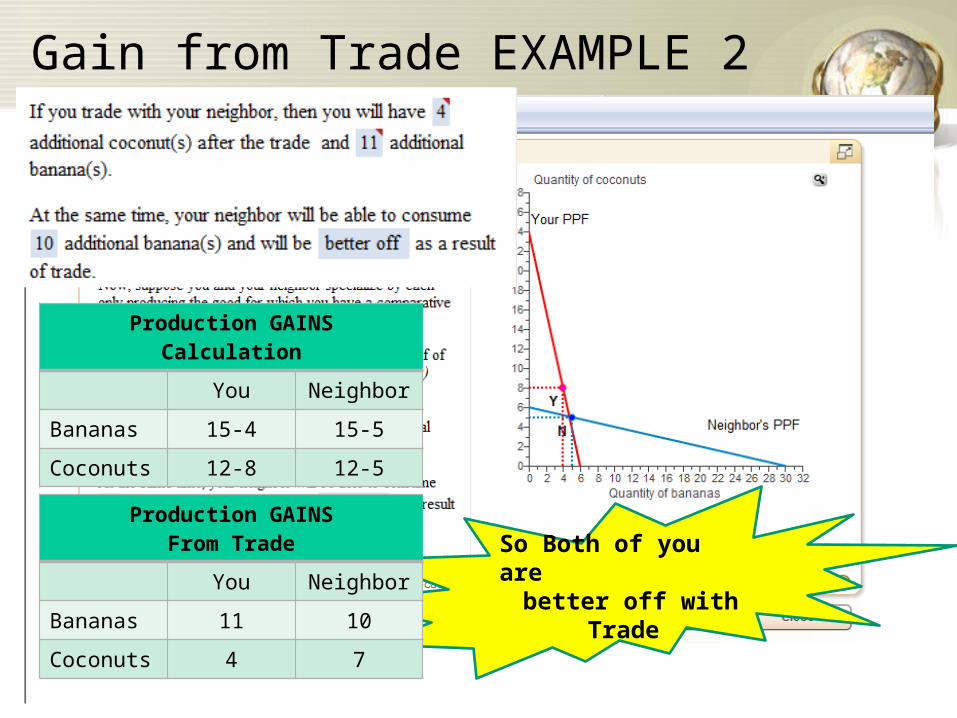
Gain from Trade EXAMPLE 2
Gain from Trade EXAMPLE 2
Production Before Specialization or Trade
You Neighbor
Bananas 4 5
Coconuts 8 5

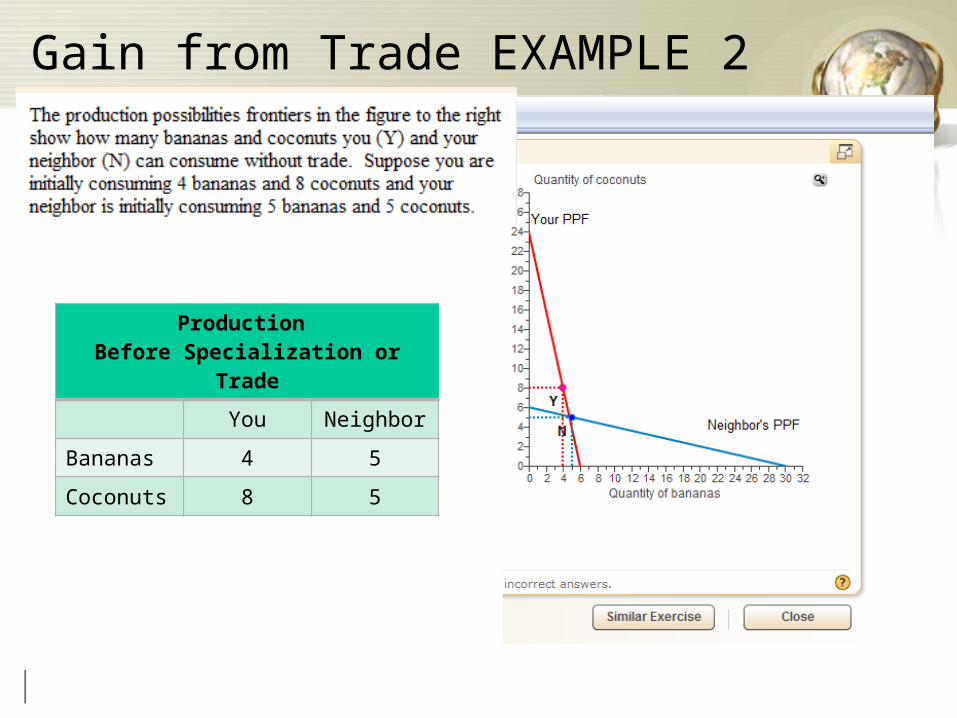
Gain from Trade EXAMPLE 2
MUST Calculate
Opportunity Cost to
determine Comparative Advantage

Gain from Trade EXAMPLE 2
Production Before Specialization or Trade
You Neighbor
Bananas 4 5
Coconuts 8 5
Opp Cost bananas = loss in coconuts / gain in bananasYou: OC B = 24/6 4Neighbor: OC B = 6/30 1/5
Opp Cost coconuts= loss in bananas / gain in coconutsYou: OC C = 6/24 1/4Neighbor: OC C = 30/6 5
Lowest Opportunity Cost Determines good used for Specialization

Gain from Trade EXAMPLE 2
Production with Specialization
You Neighbor
Bananas 0 30
Coconuts 24 0
Opp Cost bananas = loss in coconuts / gain in bananasYou: OC B = 24/6 4Neighbor: OC B = 6/30 1/5
Opp Cost coconuts= loss in bananas / gain in coconutsYou: OC C = 6/24 1/4Neighbor: OC C = 30/6 5
Lowest Opportunity Cost Determines good used for Specialization

Gain from Trade EXAMPLE 2
Production With Trade Agreement
You Neighbor
Bananas 15 15
Coconuts 12 12
Trade Agreement:½ production for ½ production
You Neighbor
Bananas 30/2 30/2
Coconuts 24/2 24/2
Gain from Trade EXAMPLE 2
So Both of you are better off with Trade
Production GAINSFrom Trade
You Neighbor
Bananas 11 10
Coconuts 4 7
Production GAINSCalculation
You Neighbor
Bananas 15-4 15-5
Coconuts 12-8 12-5
So, Trade is Good…
What about International Trade

International Trade
If You Want to Increase Economic GrowthYou Must:
• Create incentive mechanisms• Encourage savings• Encourage research development• Improve the quality of education• Encourage international trade
Free International Trade STIMULATES economic growth by EXTRACTING gains from specialization and trade
Today’s fastest growing economies are those with the fastest growing exports/imports
NAFTA and the EU are successful examples of governments taking steps to stimulate economic growth through trade

Price Level and Real GDP
Price Level• When U.S. price level rises and other things remain the same, prices in
other countries do not.
• Thus, U.S. goods become more expensive and Americans IMPORT more
Real GDP• Increase in RGDP = Increase in Income• Increase in Income = Increase in expenditures on goods and services
• 60% of goods and services are imported• Increase in RGDP = Increase in Imports
This relationship is shown by:
Marginal propensity to import = Change in Imports Change in RGDP
Trade in Goods
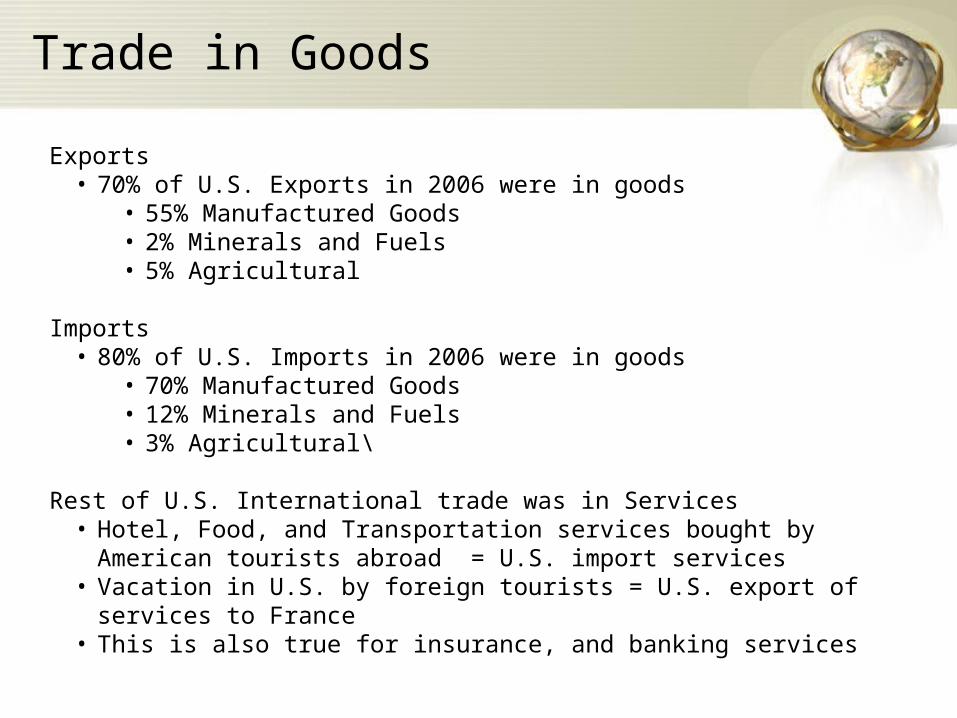
Exports• 70% of U.S. Exports in 2006 were in goods
• 55% Manufactured Goods• 2% Minerals and Fuels• 5% Agricultural
Imports• 80% of U.S. Imports in 2006 were in goods
• 70% Manufactured Goods• 12% Minerals and Fuels• 3% Agricultural\
Rest of U.S. International trade was in Services• Hotel, Food, and Transportation services bought by American tourists
abroad = U.S. import services• Vacation in U.S. by foreign tourists = U.S. export of services to France• This is also true for insurance, and banking services
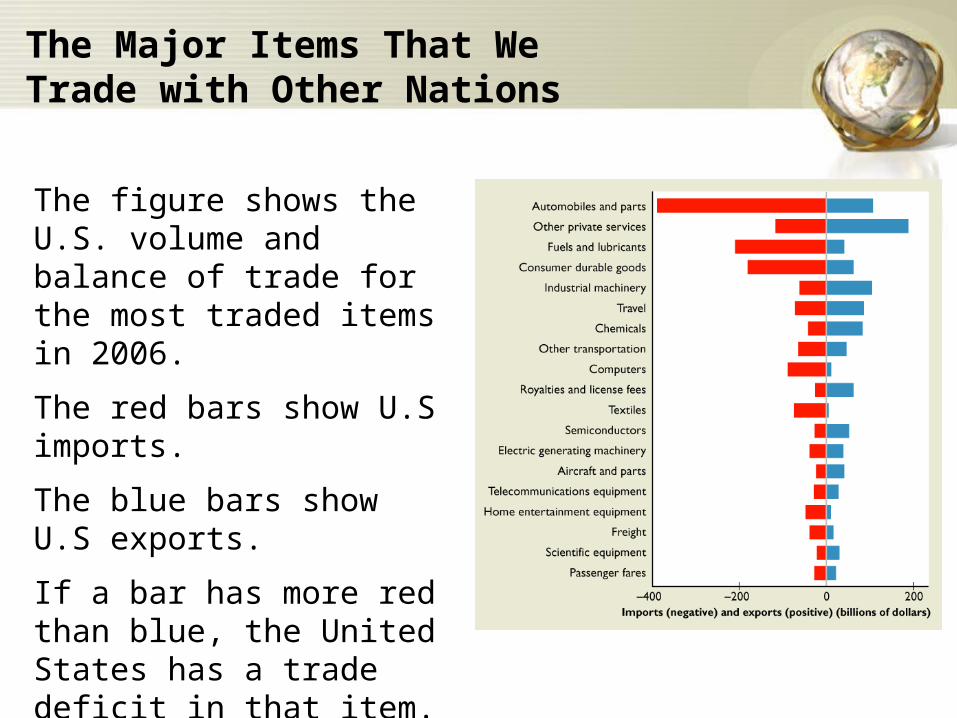
The Major Items That We Trade with Other Nations
The figure shows the U.S. volume and balance of trade for the most traded items in 2006.
The red bars show U.S imports.
The blue bars show U.S exports.
If a bar has more red than blue, the United States has a trade deficit in that item.
TRADE PATTERNS AND TRENDS
• The Outsourcing Trend–In 1960, the United States
• Exported 5 percent of total output.• Imported 4 percent of the goods and services bought.
–By 2007, the United States• Exported 12 percent of total output.• Imported 17 percent of the goods and services bought.
Some of the increase arises from OFFSHORE outsourcing—buying a good or service from a low-cost overseas supplier and NEARSHORE outsourcing.
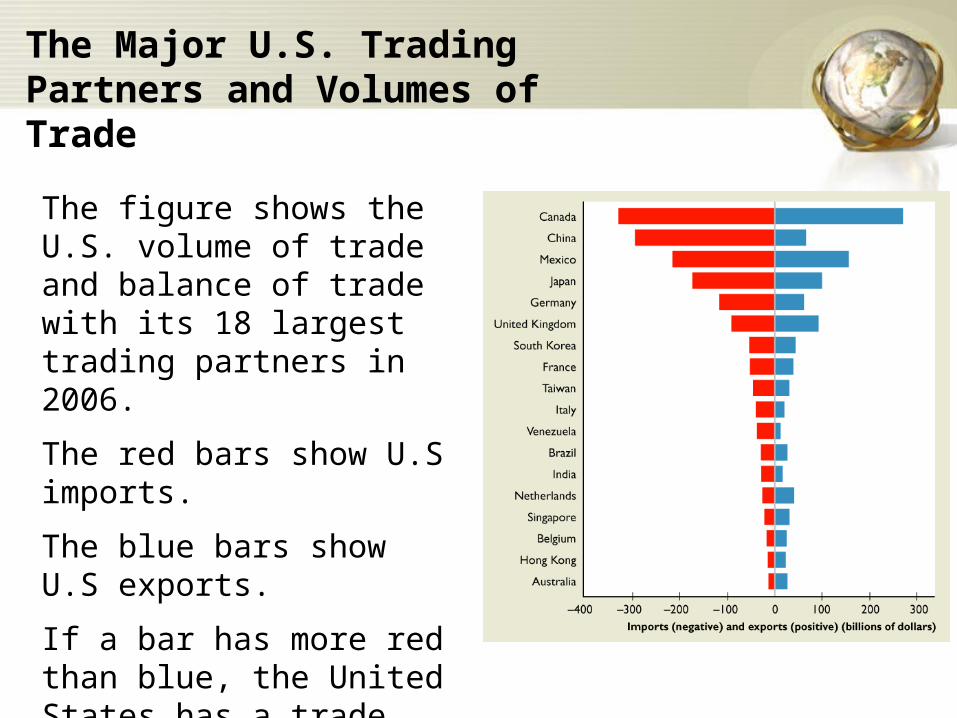
The Major U.S. Trading Partners and Volumes of Trade
The figure shows the U.S. volume of trade and balance of trade with its 18 largest trading partners in 2006.
The red bars show U.S imports.
The blue bars show U.S exports.
If a bar has more red than blue, the United States has a trade deficit with that country.

U.S. Trade Agreements
Member of WTO (world trade organization) an organization that seeks to promote FREE international trade
Trade Agreements = TreatiesPurpose:
• Promote greater trade• Economic cooperation• Promote political or social goals
Bilateral agreements (between two countries)• U.S. and Australia, Bahrain, Chile, Israel, Jordon, Morocco, Oman,
Singapore, Thailand
Multilateral agreements (between a number of countries)• NAFTA North American Free Trade Agreement• CAFTA Central American Free Trade Agreements• APEC Asia-Pacific Economic Cooperation• *FTAA Free Trade of the Americas (not yet active)

MULTILATERAL AGREEMENTS
NAFTA– 1994: United States, Canada, and Mexico – To make trade among them easier and freer.– Trade among these three countries has grown
rapidly since the enactment of NAFTACAFTA– United States, Costa Rica, the Dominican
Republic, El Salvador, Guatemala, Honduras, and Nicaragua.
– Both trade and political goals, the latter to promote freedom and democracy in Central America
MULTILATERAL AGREEMENTS
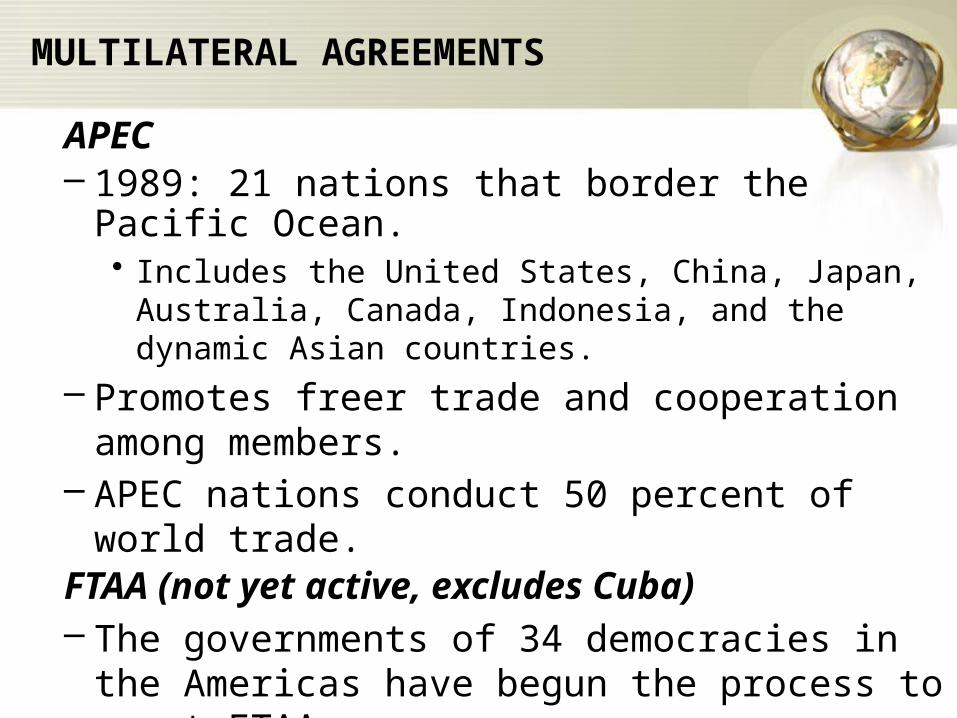
APEC– 1989: 21 nations that border the Pacific Ocean.
• Includes the United States, China, Japan, Australia, Canada, Indonesia, and the dynamic Asian countries.
– Promotes freer trade and cooperation among members.
– APEC nations conduct 50 percent of world trade.FTAA (not yet active, excludes Cuba)– The governments of 34 democracies in the
Americas have begun the process to enact FTAA– Objective is to achieve free international trade
among all countries in the Americas.

Balance of Trade
EXPORTS – IMPORTS = BALANCE OF TRADE
U.S. imports more than it exports = Trade Deficit
When a country has a trade deficit, it pays for the deficit by borrowing from other countries or by selling some of its assets.
When a country has a trade surplus, it lends to other countries or buys more foreign assets so that other countries can pay their trade deficits.
COMPARATIVE ADVANTAGE is the force that generates international trade
The U.S. has a comparative advantage in the production of AirplanesChina has a comparative advantage in the production of clothes

THE GAINS FROM TRADE
• Why the United States Exports Airplanes– The United States has a comparative advantage
in the production of airplanes
because
the opportunity cost of producing an airplane is lower in the United States than in most other countries.
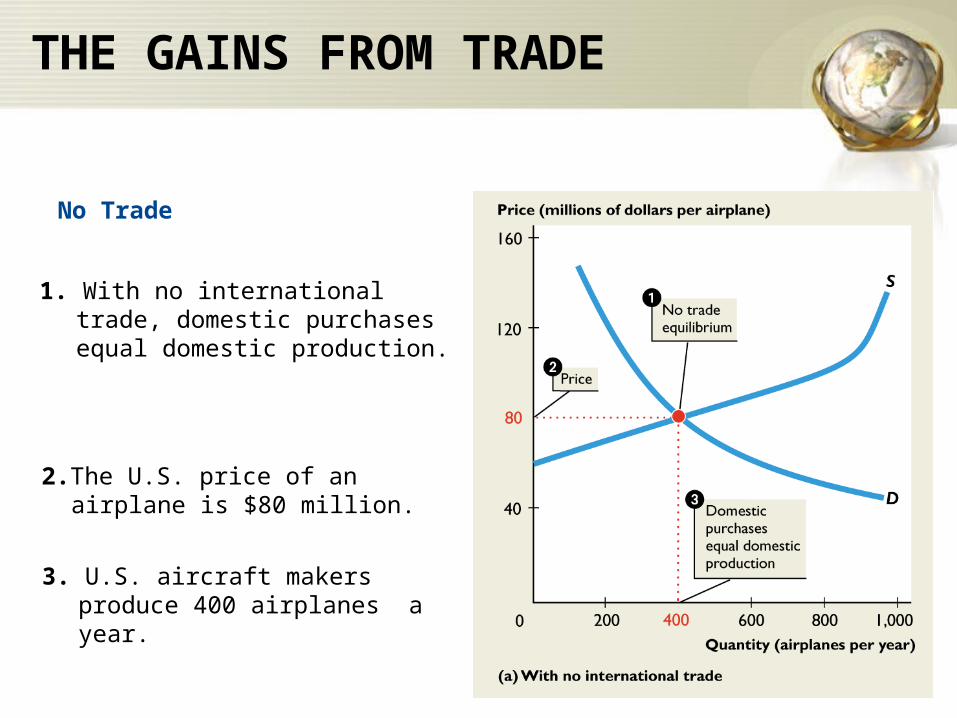
1. With no international trade, domestic purchases equal domestic production.
THE GAINS FROM TRADE
2.The U.S. price of an airplane is $80 million.
No Trade
3. U.S. aircraft makers produce 400 airplanes a year.
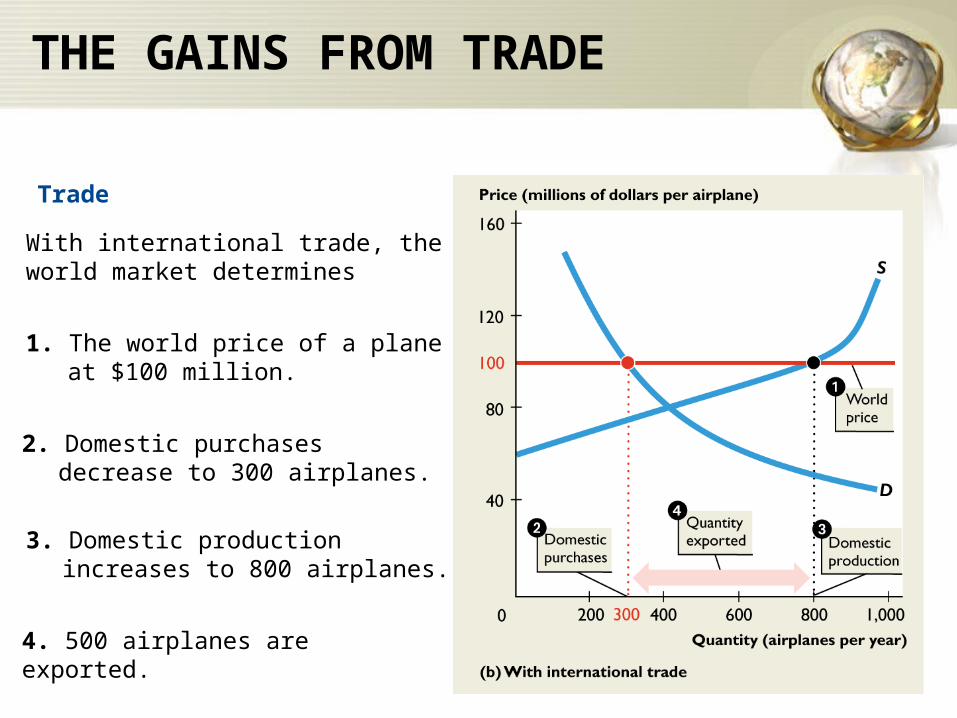
With international trade, the world market determines
THE GAINS FROM TRADE
2. Domestic purchases decrease to 300 airplanes.
3. Domestic production increases to 800 airplanes.
1. The world price of a plane at $100 million.
4. 500 airplanes are exported.
Trade

U.S. Trade Partners

THE GAINS FROM TRADE
Comparative Advantage
The U.S. aircraft makers have a comparative advantage in producing airplanes:
• The world price line tells us that the world opportunity cost of producing an airplane is $100 million.
• The U.S. supply curve shows that the U.S. opportunity cost of producing a airplane is less than $100 million for all airplanes up to the 800th one.

THE GAINS FROM TRADE
• Why the United States Imports T-shirts–More than half the clothing we buy is manufactured in other countries and imported into the United States.
Why?–The rest of the world (mainly Asia) has a comparative advantage in the production of clothes because the opportunity cost of producing a T-shirt in Asia is less than in the United States.

No Trade
THE GAINS FROM TRADE
1. With no international trade, domestic purchases equal domestic production.
2. The price of a T-shirt is $8.
3. U.S. T-shirt makers produce 20 million T-shirts a year.
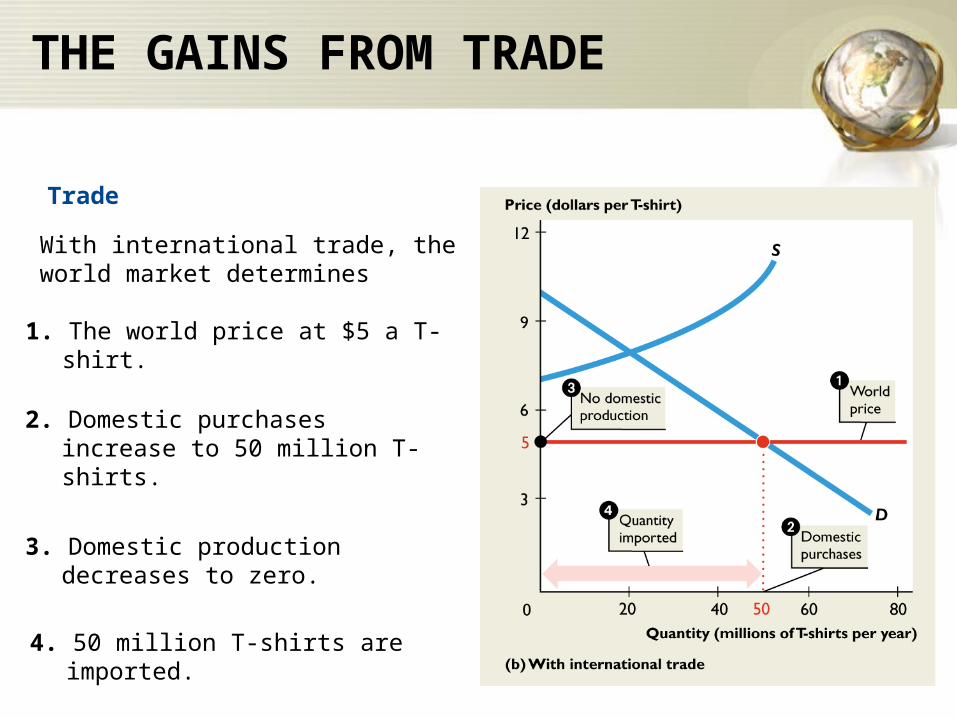
THE GAINS FROM TRADE
With international trade, the world market determines
1. The world price at $5 a T-shirt.
2. Domestic purchases increase to 50 million T-shirts.
3. Domestic production decreases to zero.
4. 50 million T-shirts are imported.
Trade


THE GAINS FROM TRADE
Comparative Advantage
Asian garment makers have a comparative advantage in producing T-shirts:
• The world price line tells us that the world opportunity cost of producing a T-shirt is $5.
• The U.S. supply curve shows that no U.S. garment maker has such a low opportunity cost, not even at smaller output.
Another Comparative Advantage
Example
18.2 THE GAINS FROM TRADE
• Gains from Trade and the PPF–We can use the PPF to show the gains from international trade.–Production Possibilities in the United States and China–Suppose that the United States produces only two goods: airplanes and T-shirts–Suppose that China produces these same goods.
18.2 THE GAINS FROM TRADE
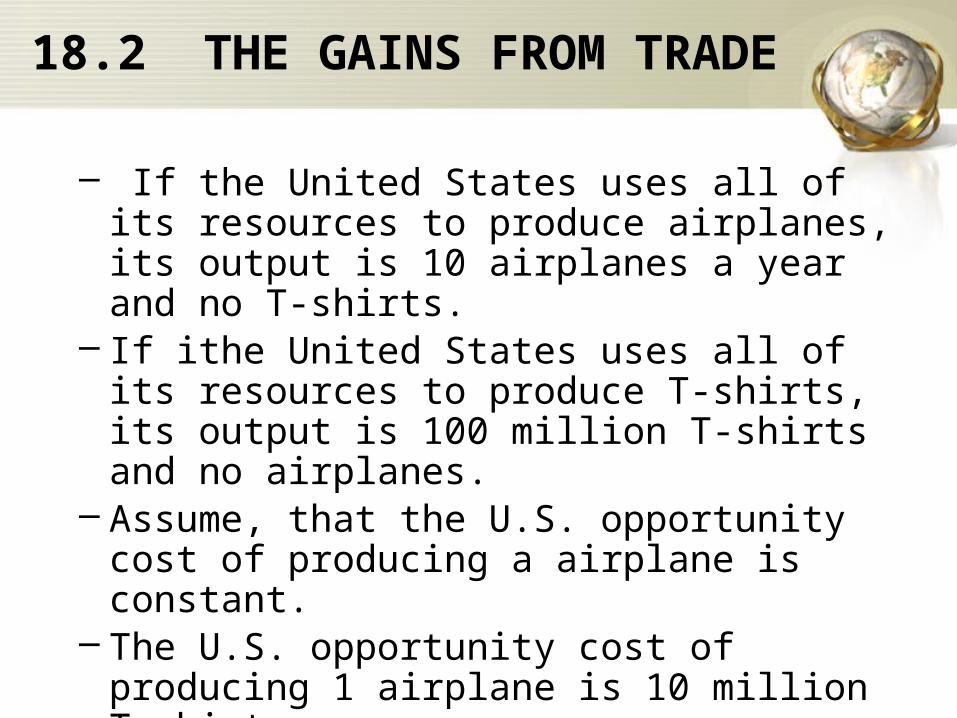
– If the United States uses all of its resources to produce airplanes, its output is 10 airplanes a year and no T-shirts.
– If ithe United States uses all of its resources to produce T-shirts, its output is 100 million T-shirts and no airplanes.
– Assume, that the U.S. opportunity cost of producing a airplane is constant.
– The U.S. opportunity cost of producing 1 airplane is 10 million T-shirts.

18.2 THE GAINS FROM TRADE
– If China uses all of its resources to make airplanes, China can produce 2 airplanes a year and no T-shirts.
– If China uses all of its resources to produce T-shirts, China can produce 100 million T-shirts and no airplanes.
– Assume, China’s opportunity cost of producing a airplane is constant.
– China’s opportunity cost of producing 1 airplane is 50 million T-shirts.

Figure 18.3(a) shows the U.S. PPF.
18.2 THE GAINS FROM TRADE
Along the U.S. PPF, the opportunity cost of producing an airplane is constant.
2. The opportunity cost of producing an airplane in the United States is 10 million T-shirts.
1. With no international trade, the United States produces at point A.

18.2 THE GAINS FROM TRADE
4. The opportunity cost of producing an airplane in China is 50 million T-shirts.
3. With no international trade, the China produces at point B.
Figure 18.3(b) shows China’s PPF.
18.2 THE GAINS FROM TRADE
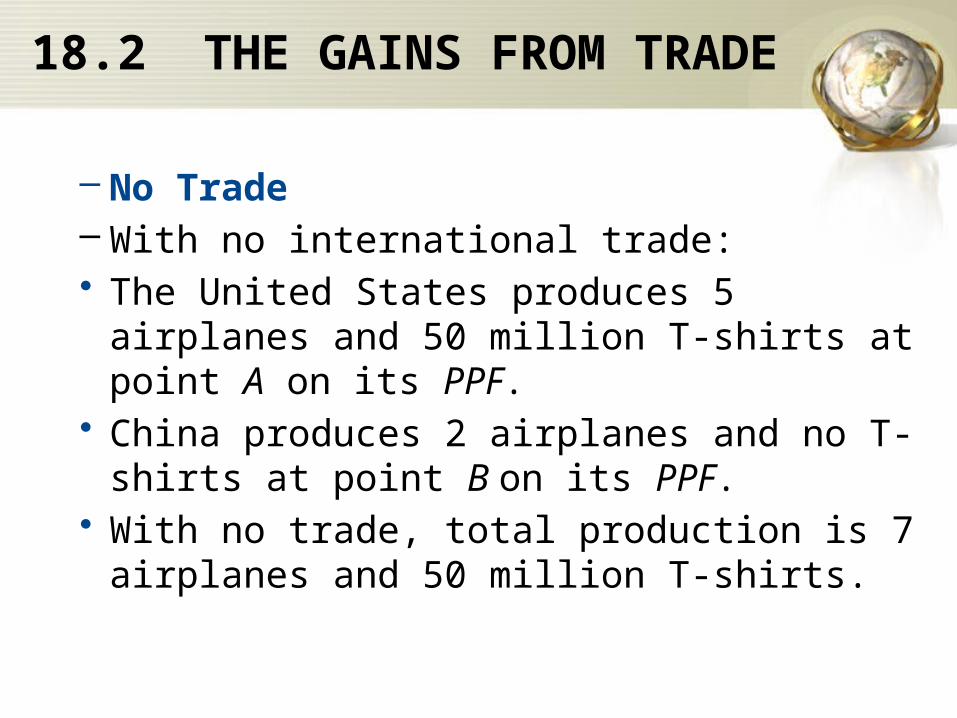
– No Trade– With no international trade:• The United States produces 5 airplanes and 50
million T-shirts at point A on its PPF.• China produces 2 airplanes and no T-shirts at
point B on its PPF.• With no trade, total production is 7 airplanes and
50 million T-shirts.

18.2 THE GAINS FROM TRADE
–Comparative Advantage–China has the comparative advantage in producingT-shirts.
• China’s opportunity cost of a T-shirt is 1/50,000,000 of a airplane.
• The U.S. opportunity cost of T-shirt is 1/10,000,000 of a airplane.
–China’s opportunity cost of a T-shirt is less than the U.S. opportunity cost of a T-shirt, so China has a comparative advantage in producing T-shirts.

18.2 THE GAINS FROM TRADE
–The United States has a comparative advantage in producing airplanes.
• The U.S. opportunity cost of producing a airplane is 10 million T-shirts.
• China’s opportunity cost of producing a airplane is 50 million T-shirts.
–The U.S. opportunity cost of a airplane is less than China’s opportunity cost of a airplane, so the United States has a comparative advantage in producing airplanes.

18.2 THE GAINS FROM TRADE
–The Gains Available from Trade–If the United States, which has a comparative advantage in producing airplanes, allocates all its resources to producing airplanes, it can produce 10 airplanes a year.–If China, which has a comparative advantage in producing T-shirts, allocates all its resources to producing T-shirts, China can produce 100 million T-shirts a year.

18.2 THE GAINS FROM TRADE
–With no trade, total production is 7 airplanes and 50 million T-shirts.–By specializing in production, total production is 10 airplanes and 100 million T-shirts.–Total production increases by 3 airplanes and 50 million T-shirts a year.–This increase in production is the gains available from trade. But to reap these gains the United States and China must trade.
18.2 THE GAINS FROM TRADE
–Achieving the Gains from Trade–The United States and China will reap the gains from international trade, if each country specializes in producing the good in which it has a comparative advantage and then the two countries trade with each other.

Figure 18.4 shows the gains from trade.
18.2 THE GAINS FROM TRADE
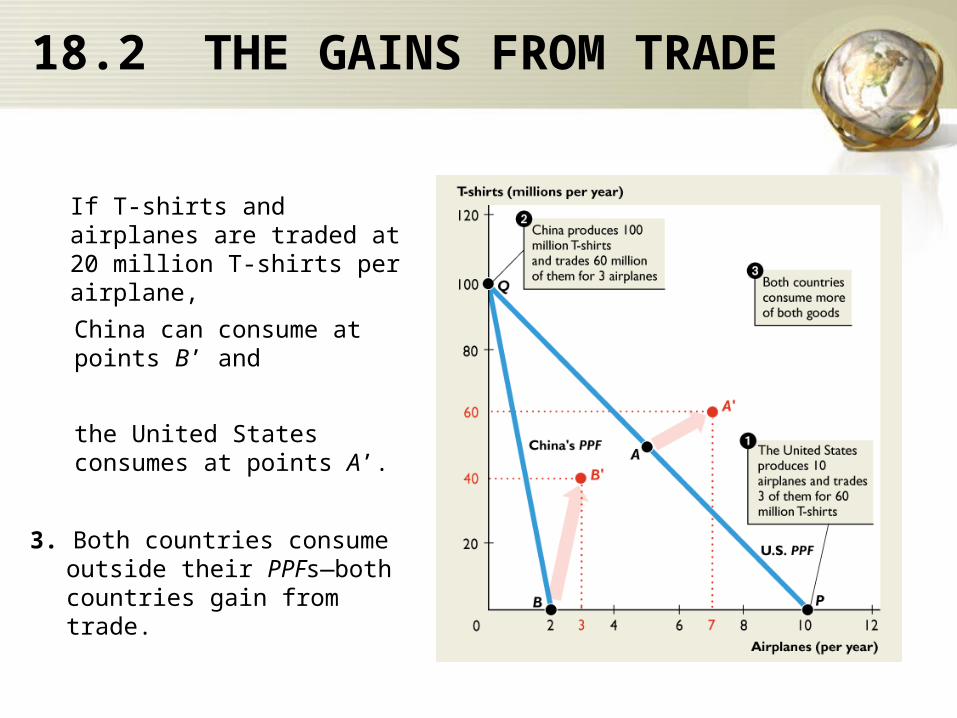
1. The United States specializes by producing 10 airplanes at point P on its PPF.
2.China specializes by producing 100 million T-shirts at point Q on its PPF.
18.2 THE GAINS FROM TRADE
If T-shirts and airplanes are traded at 20 million T-shirts per airplane,
3. Both countries consume outside their PPFs—both countries gain from trade.
China can consume at points B’ and
the United States consumes at points A’.

International Trade
So What is the Verdict
On International Trade

Winners and Losers
Economists generally agree that there are more winners than losers from globalization and that the gains vastly outweigh the losses.
But there are both winners and losers.
Americans on the average gain from offshoring, but some lose.
The losers are those who have invested in human capital to do a specific job that has now gone offshore.

U.S. (and European) textile worker or furniture maker is one of the big losers.
Jobs have disappeared and many people have struggled to find new jobs even when they’ve been willing to take a pay cut.
But one of the biggest losers is the African farmer.
Winners and LosersBlocked from global food markets by trade restrictions and subsidies in the United States and Europe, globalization is leaving much of Africa on the sidelines.
International Trade
International trade plays an extraordinarily large role in your life in three broad ways. It affects you as a
•Consumer•Producer•Voter
As a consumer, you benefit from the availability of low cost, high-quality goods and services that are produced in other countries.
Where was your computer made? Where were your shirt and your shoes made? Where is the coffee that you buy grown?
The answers are most likely Asia, Mexico, or South America.
International Trade
As a producer (or as a potential producer if you don’t yet have a job) you benefit from huge global markets for U.S. products.
Your job prospects would be much dimmer if the firm for which you work didn’t have global markets in which to sell its products.
People who work in the aircraft industry, for example, benefit from the huge global market for large passenger jets.
Airlines from Canada to China are buying Boeing 777 aircraft as fast as they can be pushed out of the production line.
International Trade
As a voter, you have a big stake in the politics of free trade versus protection.
As a buyer, your self-interest is hurt by tariffs and quotas on imported goods. Each time you buy a $20 sweater, you contribute $5 to the government in tariff revenue.
But as a worker, your self-interest might be hurt by offshoring and by freer access to U.S. markets for foreign producers.
So as you decide how to vote, you must figure out what trade policy serves your self-interest and what best serves the social interest.
TRADE RESTRICTIONS
Governments restrict trade to protect industries from foreign competition by using two main tools:
• Tariffs• Nontariff barriers
–A tariff is a tax on a good that is imposed by the importing country when an imported good crosses its international border.–A nontariff barrier is any action other than a tariff that restricts international trade. For example, a quota.
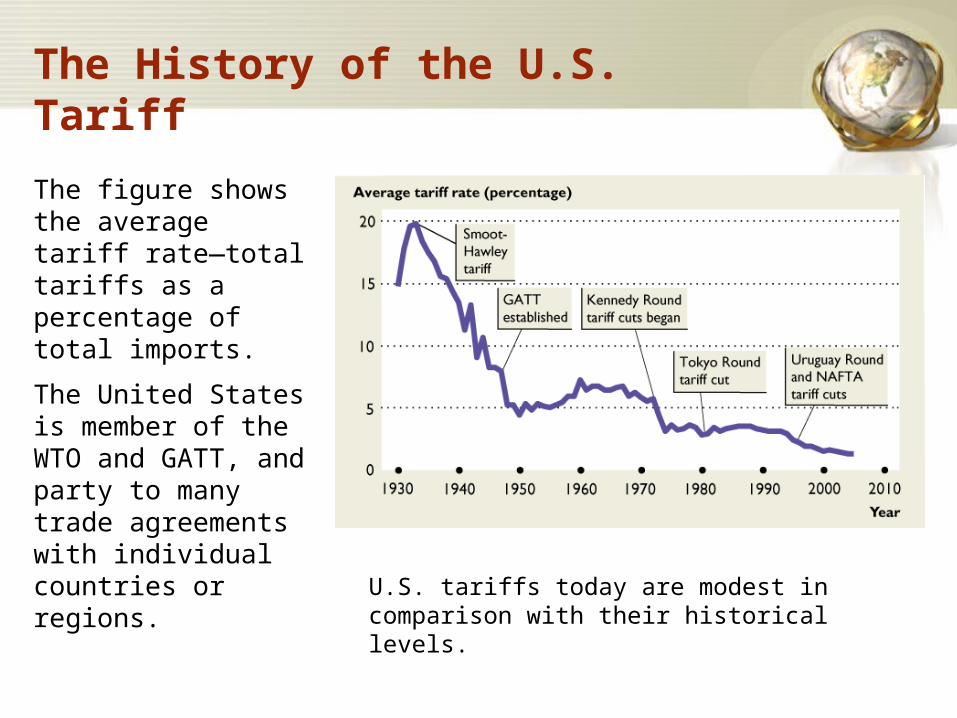
The History of the U.S. Tariff
U.S. tariffs today are modest in comparison with their historical levels.
The figure shows the average tariff rate—total tariffs as a percentage of total imports.
The United States is member of the WTO and GATT, and party to many trade agreements with individual countries or regions.
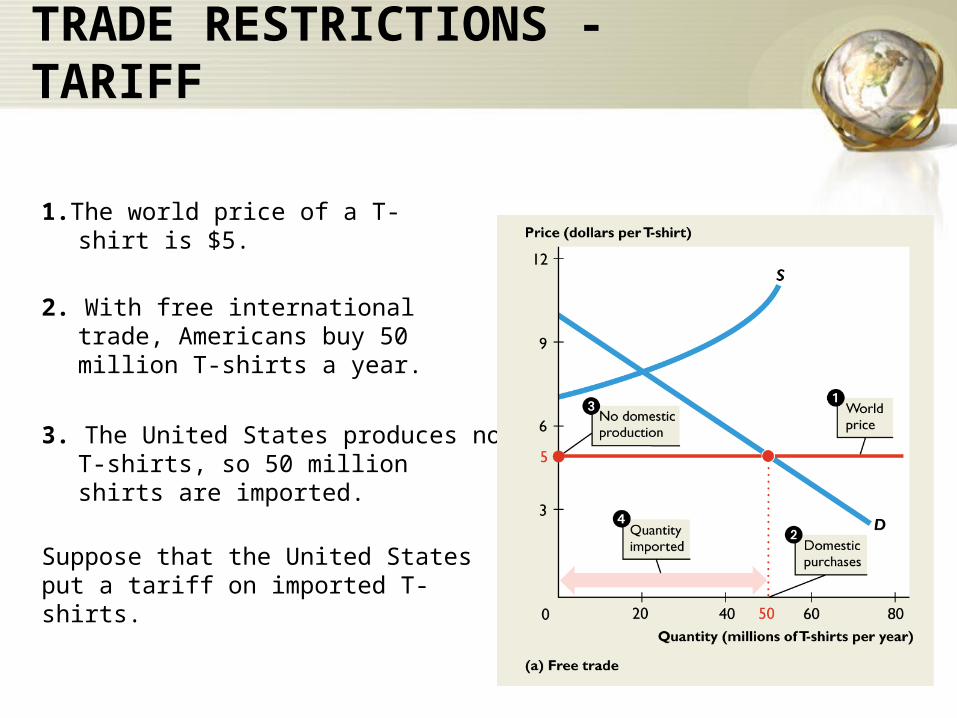
1.The world price of a T-shirt is $5.
TRADE RESTRICTIONS - TARIFF
2. With free international trade, Americans buy 50 million T-shirts a year.
Suppose that the United States put a tariff on imported T-shirts.
3. The United States produces no T-shirts, so 50 million shirts are imported.

So with a 50 percent tariff on T-shirts, the price in the United States rises from $5 to $7.50.
TRADE RESTRICTIONS-TARIFF
With a tariff,
1. The domestic price equals
2. The world price plus
3. The tariff.

TRADE RESTRICTIONS - TARIFF
4. Americans buy 25 million T-shirts a year.
5. U.S. garment makers produce 10 million T-shirts a year
6. Imports shrink to 15 million T-shirts a year and the government collects tariff revenue (purple area).

TRADE RESTRICTIONS - TARIFF
Rise in Price of a T-shirt–The price of a T-shirt rises by 50 percent from $5 to $7.50 a shirt.
Decrease in Purchases–The quantity bought decreases from 50 million to 25 million T-shirts a year.
Increase in Domestic Production–The higher price stimulates domestic production, which increases from zero to 10 million T-shirts a year.

TRADE RESTRICTIONS - TARIFF
Decrease in Imports– The quantity imported from 50 million to 15
million T-shirts a year—a decrease of 35 million T-shirts.
Tariff Revenue– The government collects tariff revenue of $2.50
per– T-shirt on the 15 million T-shirts imported, a tariff
revenue of $37.5 million a year.

TRADE RESTRICTIONS - TARIFF
U.S. Consumers Lose–The opportunity cost of T-shirt is $5.–But Americans pay $7.50 for a T-shirt—
$2.50 more than the opportunity cost of a T-shirt.–U.S. consumers are willing to buy 50 million T-shirts a year at the opportunity cost.–So the tariff deprives people of T-shirts that they are willing to buy at a price equal to its opportunity cost.

TRADE RESTRICTIONS - QUOTA
• Nontariff Barriers–Quota is a specified maximum amount of a good that may be imported in a given period of time.
How a Quota Works–With free trade, Americans pay $5 a T-shirt and import 50 million T-shirts a year.–Suppose the U.S. government sets a quota on imported T-shirts at 15 million a year.
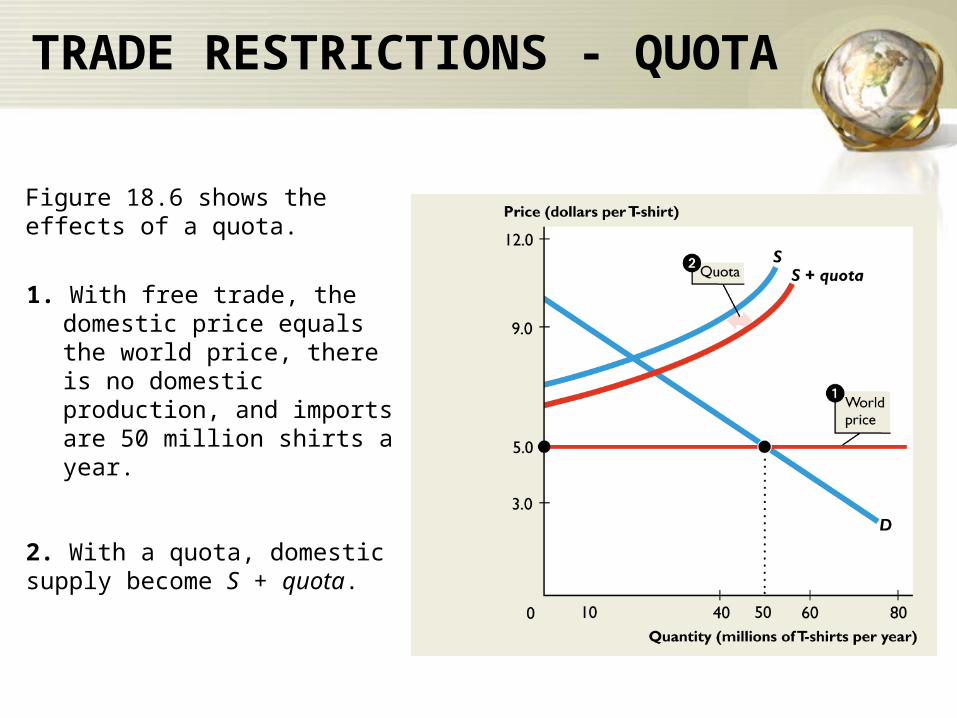
Figure 18.6 shows the effects of a quota.
TRADE RESTRICTIONS - QUOTA
1. With free trade, the domestic price equals the world price, there is no domestic production, and imports are 50 million shirts a year.
2. With a quota, domestic supply become S + quota.

TRADE RESTRICTIONS - QUOTA
5. With the higher price, U.S garment makers increase production to 10 million T-shirts a year.
4. Americans buy 25 million T-shirts a year.
3. The price Americans pay is determined in the U.S. market and it rises to $7.50 a T-shirt.
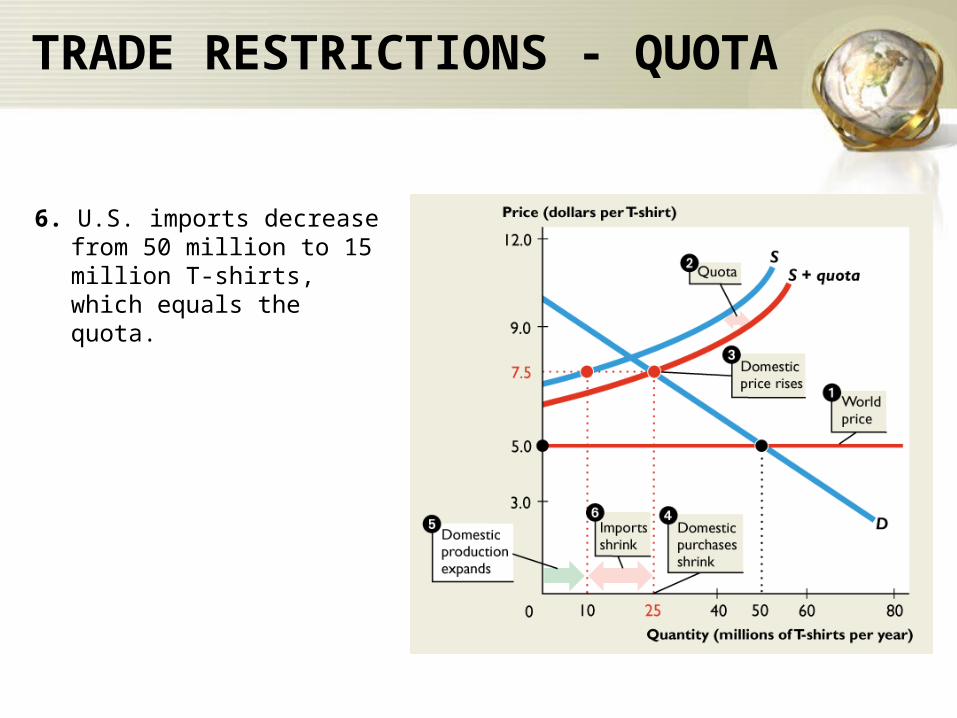
TRADE RESTRICTIONS - QUOTA
6. U.S. imports decrease from 50 million to 15 million T-shirts, which equals the quota.
TRADE RESTRICTIONS - OTHER
Health, Safety, and Other Nontariff Barriers–Thousands of detailed health, safety, and other regulations restrict international trade.–Some examples are
• Food imports into the United States must meet Food and Drug Administration’s standards.
• Europe bans imports of genetically modified foods such as U.S. soybean and Canadian granola.
• Australia bans imports of Californian grapes to protect its grapes from a virus in California.
THE CASE AGAINST PROTECTION
Three Traditional Arguments for Protection– The national security argument– The infant-industry argument– The dumping argument

THE CASE AGAINST PROTECTION
The National Security ArgumentFor:
• A country must protect industries that produce equipment and armaments and those on which the defense industries rely for their raw materials.
Against:• In a time of war, all industries contribute to national
defense.• To increase the output of a strategic industry, it is more
efficient to use a subsidy rather than a tariff or quota.
THE CASE AGAINST PROTECTION
The Infant-Industry ArgumentFor:
•It is necessary to protect a new industry to enable it to grow into a more mature industry that can compete in world markets.
Against:•Valid only if the benefits of learning-by-doing not only accrue to the owners and workers of the firms in the infant industry but also spill over to other industries and parts of the economy.

THE CASE AGAINST PROTECTION
The Dumping ArgumentFor:
•Dumping occurs when a foreign firm sells its exports at a lower price than its cost of production.•A firm that wants to become a global monopoly might try to eliminate its foreign competitors by dumping. Once it has a global monopoly, it will raise its price.
Against:•It is virtually impossible to detect dumping because it is hard to determine a firm’s cost. Faulty detection methods.•Natural global monopolies are hard to find, so alternative products from competitive markets are likely to be found.•The best way to deal with an actual natural global monopoly would be by regulation – as we do with domestic monopolies
THE CASE AGAINST PROTECTION
• Five New Arguments for ProtectionSaves Jobs
•The argument is that protection saves jobs because when we buy shoes from Brazil or shirts from Taiwan, U.S. workers lose their jobs.
Allows Us to Compete with Cheap Foreign Labor
•The argument is that with the removal of protective tariffs in U.S. trade with Mexico jobs rushing to Mexico would make a “giant sucking sound.”
THE CASE AGAINST PROTECTION
Brings Diversity and Stability• The argument is that protection brings a diversified
economy—an economy that fluctuates less than one that produces only a few goods and services.
Penalizes Lax Environmental Standards• The argument is that many poor countries, such as
Mexico, do not have the same environmental standards as the United States, so we cannot compete without tariffs.

THE CASE AGAINST PROTECTION
Protects National Culture• The argument that is commonly heard in Canada and
Europe is that free trade in books, magazines, movies, and television programs means U.S. domination and the end of local culture.
None of these five common arguments provides overwhelming support for protection.
THE CASE AGAINST PROTECTION
SO Why Is International Trade Restricted?–Two key reasons:
• Tariff revenue• Rent seeking
Tariff Revenue•In some developing countries, governments cannot use income taxes and sales taxes because financial record-keeping is poor.•In these countries, international trade transactions are well recorded, so governments use tariffs on imports to raise revenue.
Rent Seeking• Rent seeking is lobbying and other political activity
that seeks to capture the gains from trade.
THE CASE AGAINST PROTECTION
FREE TRADE• Free trade increases consumption possibilities on
the average, but not everyone shares in the gains.• Free trade brings benefits to some and costs to
others.• The uneven distribution of benefits and costs is the
principle source of impediment to freer international trade.

THE CASE AGAINST PROTECTION
Compensating Losers• In total, the gains from free international trade exceed the
losses, so why don’t the people who gain from free trade compensate the losers?
• To a degree, losers are compensated: When Congress approved the NAFTA deal with Canada and Mexico, it set up a $56 million fund to support and retrain workers who lost their jobs because of the free trade agreement.
• During the first six months of NAFTA, only 5,000 workers applied for benefits under the scheme.
• It is difficult to identity and compensate the losers from free international trade. But if we don’t make a better effort, protectionism will remain a popular and permanent feature of our national economic and political life.

Exchange Rates
THE EXCHANGE RATE
Foreign exchange market is the market in which the currency of one country is exchanged for the currency of another.
– The foreign exchange market that is made up of importers and exporters, banks, and specialist dealers who buy and sell currencies.
THE EXCHANGE RATE
Foreign exchange rate is the price at which one currency exchanges for another.
– For example, in October 2007, one U.S. dollar bought 70 euro cents. The exchange rate was 70 euro cents per U.S. dollar.
– This exchange rate can be expressed in terms of dollars (or cents) per euro. In October 2007, the exchange rate was $1.42 per euro.

THE EXCHANGE RATE
Currency appreciation is the rise in the value of one currency in terms of another currency.
– For example, when the dollar rose from 86 euro cents in 1999 to 1.18 euros in 2001, the dollar appreciated by 37 percent.
Currency depreciation is the fall in the value of one currency in terms of another currency.
– For example, when the dollar fell from 1.18 euros in 2001 to 0.70 euros in 2007, the dollar depreciated by 40 percent.
THE EXCHANGE RATE
– The value of the foreign exchange rate fluctuates.
– Sometimes the U.S. dollar depreciates and sometimes it appreciates. Why?
– The foreign exchange rate is a price and like all prices, and demand and supply in the foreign exchange market determine its value.

THE EXCHANGE RATE
• Demand in the Foreign Exchange Market– The quantity of dollars demanded in the
foreign exchange market is the amount that traders plan to buy during a given period at a given exchange rate.
– The quantity of dollars demanded depends on• The exchange rate• Interest rates in the United States and other
countries• The expected future exchange rate
THE EXCHANGE RATE
• The Law of Demand for Foreign Exchange – Other things remaining the same, the higher the
exchange rate, the smaller is the quantity of dollars demanded.
– The exchange rate influences the quantity of dollars demanded for two reasons:• Exports effect• Expected profit effect

THE EXCHANGE RATE
Exports Effect –The larger the value of U.S. exports, the larger is the quantity of dollars demanded on the foreign exchange market.–The lower the exchange rate, the cheaper are U.S.-made goods and services to people in the rest of the world, the more the United States exports, and the greater is the quantity of U.S. dollars demanded to pay for them.
THE EXCHANGE RATE
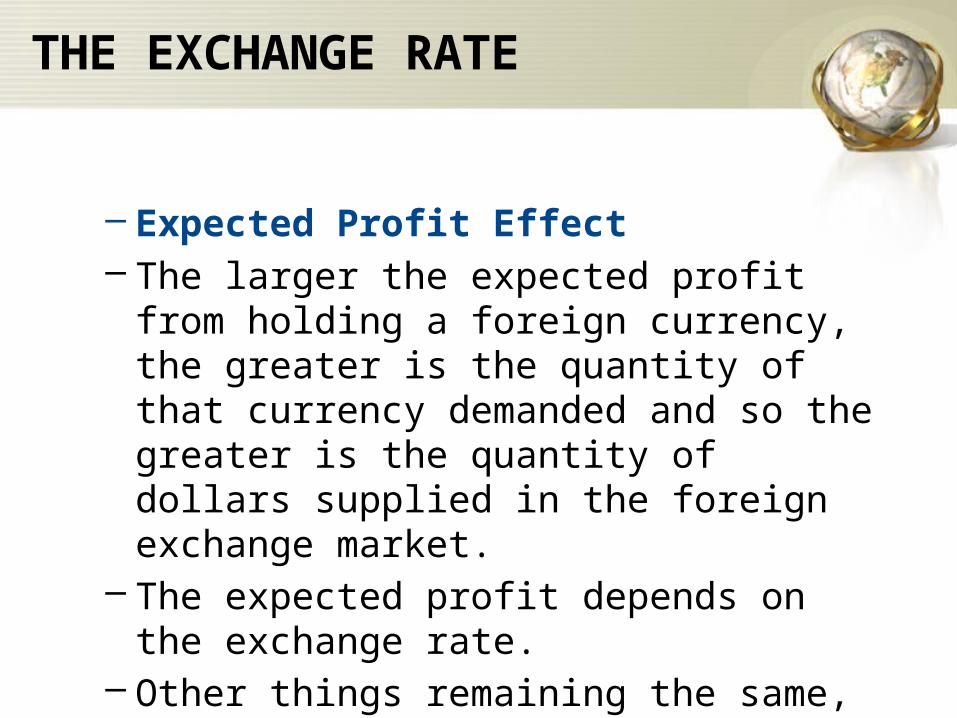
Expected Profit Effect –The larger the expected profit from holding dollars, the greater is the quantity of dollars demanded in the foreign exchange market.–But the expected profit depends on the exchange rate.–The lower the exchange rate, other things remaining the same, the larger is the expected profit from holding dollars and the greater is the quantity of dollars demanded.

Figure 19.1 shows the demand for dollars.
2. If the exchange rate falls, the quantity of dollars demanded increases along the demand curve for dollars.
1. If the exchange rate rises, the quantity of dollars demanded decreases along the demand curve for dollars.
THE EXCHANGE RATE

THE EXCHANGE RATE
• Changes in the Demand for Dollars – A change in any influence (other than the
exchange rate) on the quantity of U.S. dollars that people plan to buy in the foreign exchange market changes the demand for U.S. dollars and shifts the demand curve for dollars.
– These influences are• Interest rates in the United States and other
countries• Expected future exchange rate
THE EXCHANGE RATE
–Interest Rates in the United States and Other Countries
–U.S. interest rate differential is the U.S. interest rate minus the foreign interest rate.
–Other things remaining the same, the larger the U.S. interest rate differential, the greater is the demand for U.S. assets and the greater is the demand for dollars on the foreign exchange market.
THE EXCHANGE RATE
– The Expected Future Exchange Rate– Other things remaining the same, the higher the
expected future exchange rate, the greater is the demand for dollars.
– The higher the expected future exchange rate, the larger is the expected profit from holding dollars, so the larger is the quantity of dollars that people plan to buy on the foreign exchange market.
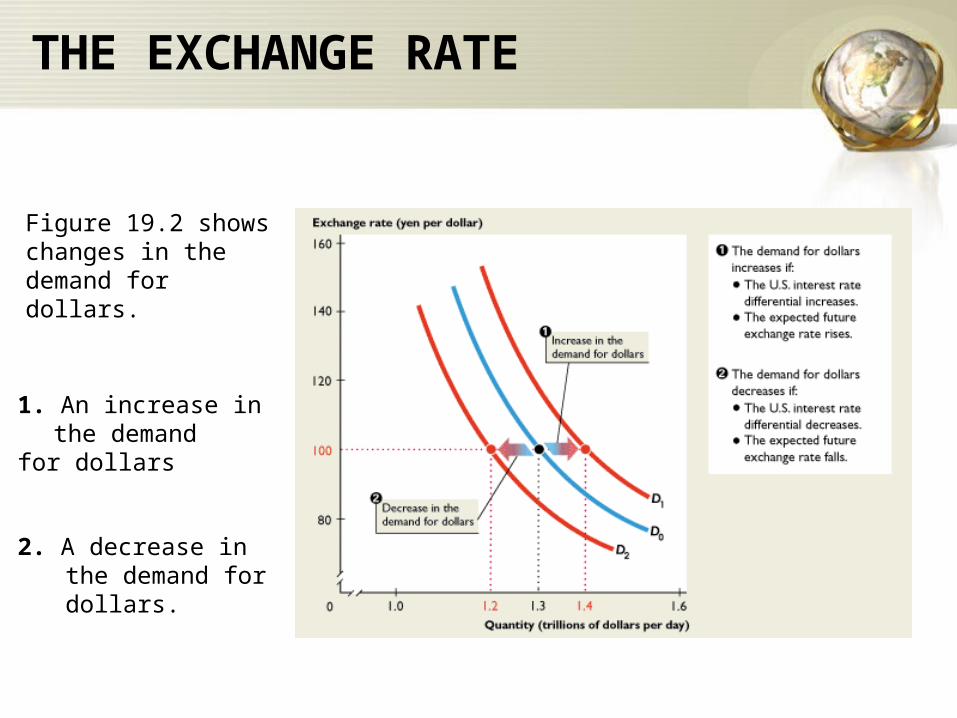
Figure 19.2 shows changes in the demand for dollars.
THE EXCHANGE RATE
1. An increase in the demand for dollars
2. A decrease in the demand for dollars.

THE EXCHANGE RATE
• Supply in the Foreign Exchange Market– The quantity of U.S dollars supplied in the
foreign exchange market is the amount that traders plan to sell during a given time period at a given exchange rate.
– The quantity of U.S. dollars supplied depends on many factors, but the main ones are• The exchange rate• Interest rates in the United States and other
countries• The expected future exchange rate

THE EXCHANGE RATE
• The Law of Supply of Foreign Exchange – Traders supply U.S. dollars in the foreign
exchange market when they buy other currencies.
– Other things remaining the same, the higher the exchange rate, the greater is the quantity of U.S. dollars supplied in the foreign exchange market.
– The exchange rate influences the quantity of dollars supplied for two reasons:• Imports effect• Expected profit effect
THE EXCHANGE RATE
– Imports Effect– The larger the value of U.S. imports, the
larger is the quantity of foreign currency demanded to pay for these imports.
– When people buy foreign currency, they supply dollars.
– Other things remaining the same, the higher the exchange rate, the cheaper are foreign-made goods and services to Americans. So the more the United States imports, the greater is the quantity of U.S. dollars supplied on the foreign exchange market.
THE EXCHANGE RATE
– Expected Profit Effect– The larger the expected profit from holding a
foreign currency, the greater is the quantity of that currency demanded and so the greater is the quantity of dollars supplied in the foreign exchange market.
– The expected profit depends on the exchange rate.
– Other things remaining the same, the higher the exchange rate, the larger is the expected profit from selling dollars and the greater is the quantity of dollars supplied in the foreign exchange market.

Figure 19.3 shows the supply of dollars.
2. If the exchange rate falls, the quantity of dollars supplied decreases along the supply curve for dollars.
1. If the exchange rate rises, the quantity of dollars supplied increases along the supply curve for dollars.
THE EXCHANGE RATE

THE EXCHANGE RATE
• Changes in the Supply of Dollars – A change in any influence (other than the
current exchange rate) on the quantity of U.S. dollars that people plan to sell in the foreign exchange market changes the supply of U.S. dollars and shifts the supply curve for dollars.
– These influences are• Interest rates in the United States and other
countries• Expected future exchange rate

THE EXCHANGE RATE
– Interest Rates in the United States and Other Countries
– The larger the U.S. interest rate differential, the smaller is the demand for foreign assets, so the smaller is the supply of U.S. dollars on the foreign exchange market.

THE EXCHANGE RATE
–The Expected Future Exchange Rate–Other things remaining the same, the higher the expected future exchange rate, the smaller is the expected profit from selling U.S. dollars today, so the smaller is the supply of dollars today.

Figure 19.4 shows changes in the supply of dollars.
THE EXCHANGE RATE
1. An increase in the supply of dollars.
2. A decrease in the supply of dollars.
THE EXCHANGE RATE
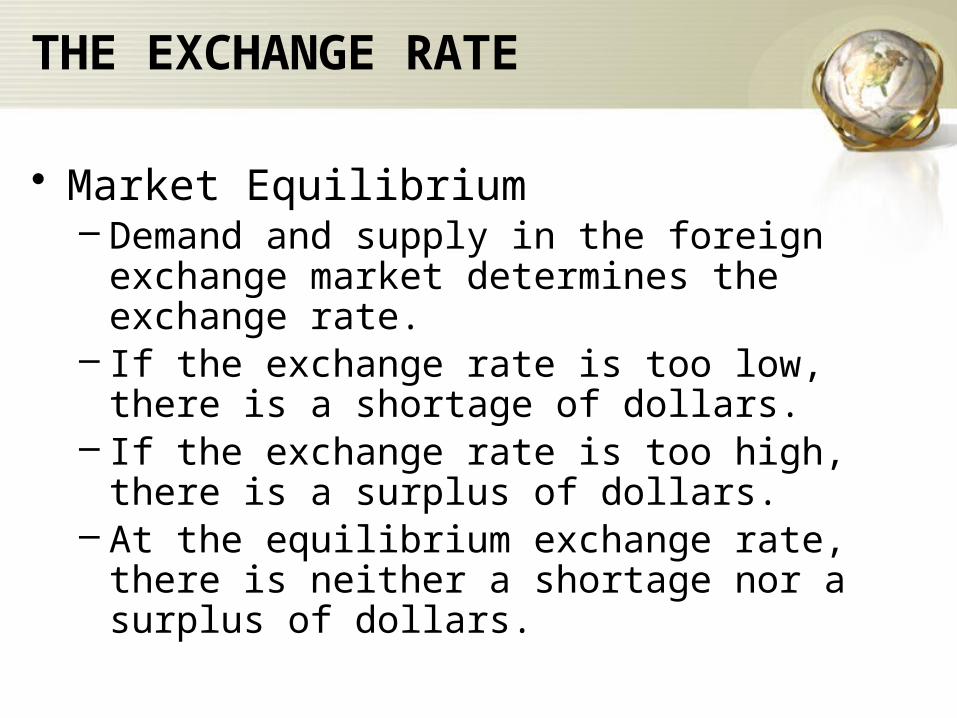
• Market Equilibrium– Demand and supply in the foreign exchange
market determines the exchange rate.– If the exchange rate is too low, there is a
shortage of dollars.– If the exchange rate is too high, there is a surplus
of dollars.– At the equilibrium exchange rate, there is neither
a shortage nor a surplus of dollars.
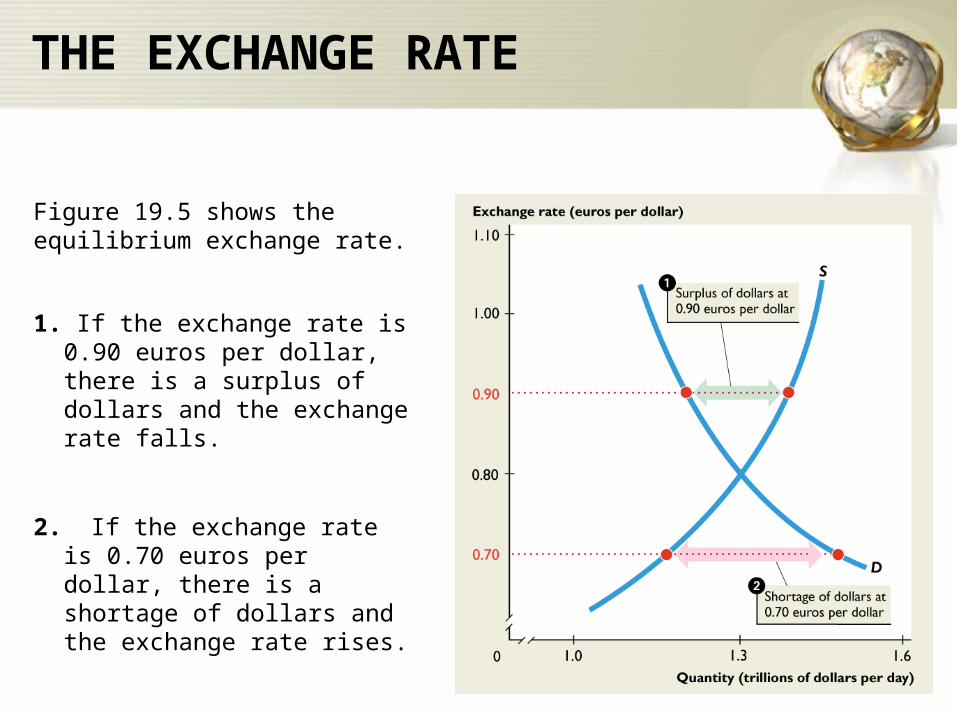
Figure 19.5 shows the equilibrium exchange rate.
1. If the exchange rate is 0.90 euros per dollar, there is a surplus of dollars and the exchange rate falls.
2. If the exchange rate is 0.70 euros per dollar, there is a shortage of dollars and the exchange rate rises.
THE EXCHANGE RATE
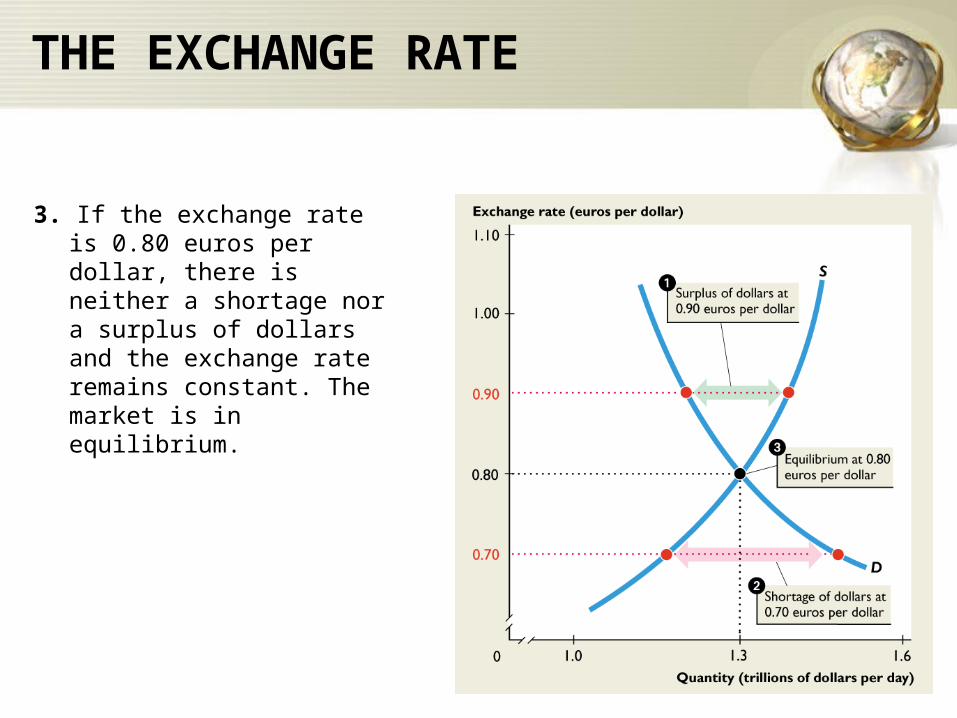
3. If the exchange rate is 0.80 euros per dollar, there is neither a shortage nor a surplus of dollars and the exchange rate remains constant. The market is in equilibrium.
THE EXCHANGE RATE

THE EXCHANGE RATE
• Changes in the Exchange Rate– The predictions about the effects of changes in
the demand for and supply of dollars are exactly the same as for any other market.
– An increase in the demand for dollars with no change in supply raises the exchange rate.
– A increase in the supply of dollars with no change in demand lowers the exchange rate.

THE EXCHANGE RATE
– An Appreciating Dollar: 1999–2001– Between 1999 and 2001, the dollar appreciated
against the euro. The exchange rate rose from 0.86 euros to 1.18 euros per dollar.
– A Depreciating Dollar: 2001–2007– Between 2001 and 2007, the dollar depreciated
against the euro. The exchange rate fell from 1.18 euros to 0.70 euros per dollar.

THE EXCHANGE RATE
Figure 19.6(a) shows why the dollar appreciated between 1999 and 2001.
1.Traders expected the dollar to appreciate— the demand for U.S. dollars increased and
the supply of U.S. dollars decreased.
2. The dollar appreciated.
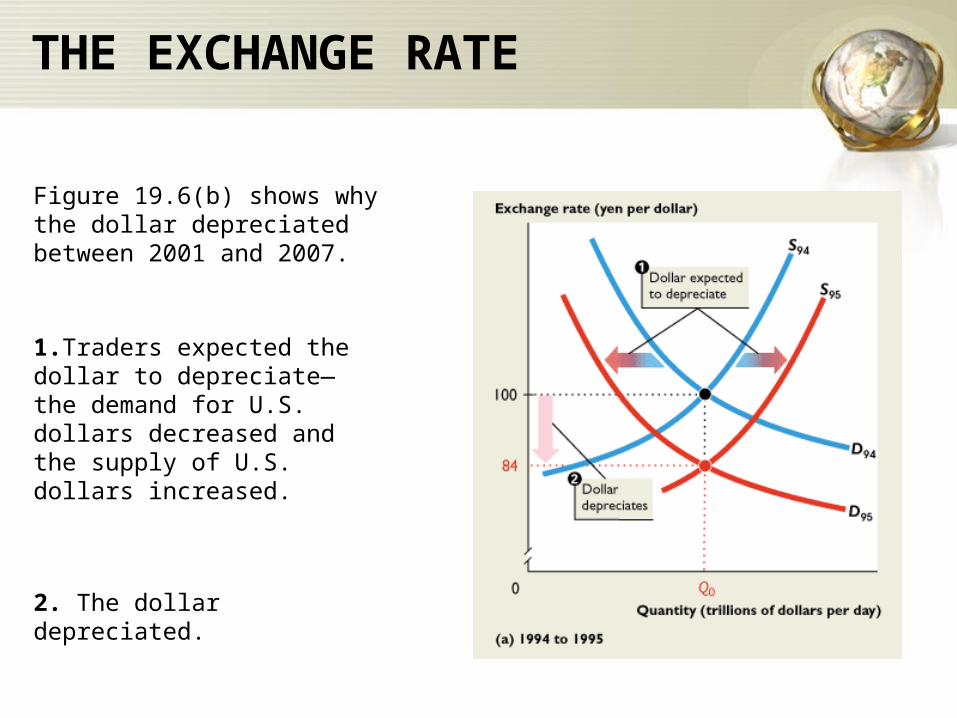
Figure 19.6(b) shows why the dollar depreciated between 2001 and 2007.
THE EXCHANGE RATE
1.Traders expected the dollar to depreciate— the demand for U.S. dollars decreased and
the supply of U.S. dollars increased.
2. The dollar depreciated.
THE EXCHANGE RATE
–Why the Exchange Rate Is Volatile–Sometimes the dollar appreciates and sometimes it depreciates, but the quantity of dollars traded each day barely changes.–Why?–The main reason is that demand and supply are not independent in the foreign exchange market.
THE EXCHANGE RATE
• Exchange Rate Expectations– Why do exchange rate expectations change?– There are two forces:
• Purchasing power parity• Interest rate parity
Purchasing power parity means equal value of money—a situation in which money buys the same amount of goods and services in different currencies.

THE EXCHANGE RATE
– Suppose that a Big Mac costs $4 (Canadian) in Toronto and $3 (U.S.) in New York.
– If the exchange rate is $1.33 Canadian per U.S. dollar, then the two monies have the same value—you can buy a Big Mac in Toronto or New York for either $4 (Canadian) or $3 (U.S.).
– But if a Big Mac in New York rises to $4 and the exchange rate remains at $1.33 Canadian per U.S. dollar, then money buys more in Canada than in the United States.
– Money does not have equal value.

THE EXCHANGE RATE
– The value of money is determined by the price level.
If prices in the United States rise faster than those of other countries, people will generally expect the foreign exchange value of the U.S. dollar to fall.
Demand for U.S. dollars will decrease, and supply of U.S. dollars will increase.
The U.S. dollar exchange rate will fall.
The U.S. dollar depreciates.

THE EXCHANGE RATE
–If prices in the United States rise more slowly than those of other countries, people will generally expect the foreign exchange value of the U.S. dollar to rise.–Demand for U.S. dollars will increase, and supply of U.S. dollars will decrease.–The U.S. dollar exchange rate will rise.–The U.S. dollar appreciates.
THE EXCHANGE RATE
Interest Rate Parity– Interest rate parity means equal interest
rates—a situation in which the interest rate in one currency equals the interest rate in another currency when exchange rate changes are taken into account.
–
THE EXCHANGE RATE
– Suppose a Canadian dollar deposit in a Toronto bank earns 5 percent a year and the U.S. dollar deposit in New York earns 3 percent a year.
– If people expect the Canadian dollar to depreciate by 2 percent in a year, then the expected fall in the value of the Canadian dollar must be subtracted to calculate the net return on the Canadian dollar deposit.
– The net return on the Canadian dollar deposit is 3 percent (5 percent minus 2 percent) a year. Interest rate parity holds.
THE EXCHANGE RATE
– Adjusted for risk, interest rate parity always holds.
– Traders in the foreign exchange market move their funds into the currencies that earn the highest return.
– This action of buying and selling currencies brings about interest rate parity.
THE EXCHANGE RATE
• Monetary Policy and the Exchange Rate– Monetary policy influence the U.S. interest
rate, so the Fed’s actions influence the U.S. dollar exchange rate.
– If the U.S. interest rate rises relative to those in other countries, the value of the U.S. dollar rises on the foreign exchange market.
– If foreign interest rate rises relative to U.S. interest rate, the value of the U.S. dollar falls on the foreign exchange market.
– So the exchange rate responds to monetary policy.
THE EXCHANGE RATE
• Pegging the Exchange Rate– But the Fed can intervene directly in the foreign
exchange market to influence the exchange rate.– The Fed can try to smooth out fluctuations in the
exchange rate by changing the supply of U.S. dollars.
– The Fed changes the supply of U.S. dollars on the foreign exchange market by buying or selling U.S. dollars.
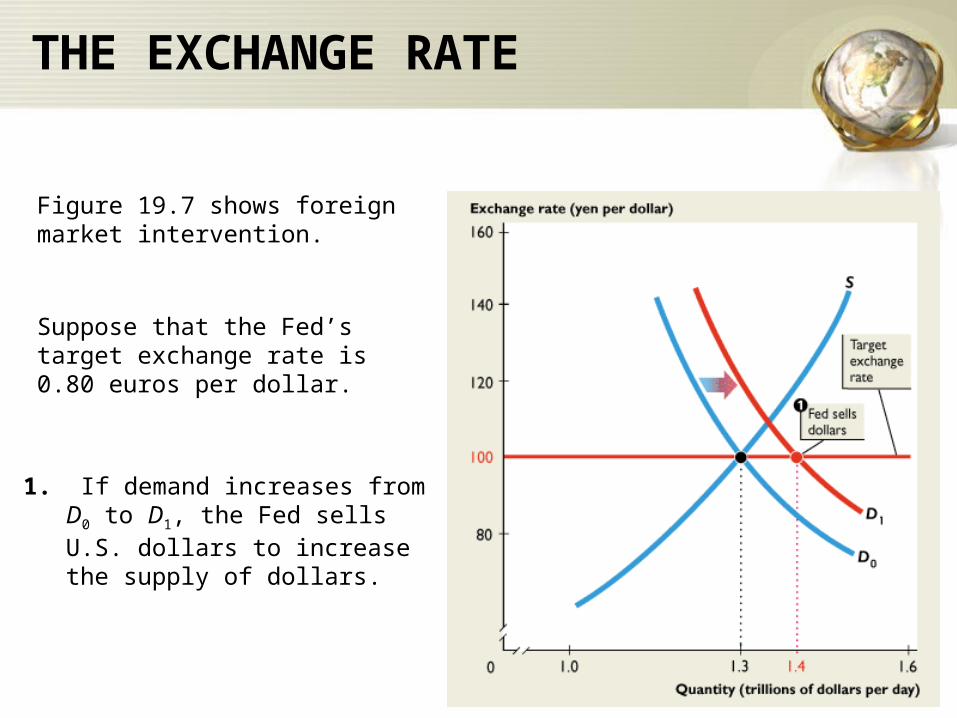
Figure 19.7 shows foreign market intervention.
1. If demand increases from D0 to D1, the Fed sells U.S. dollars to increase the supply of dollars.
THE EXCHANGE RATE
Suppose that the Fed’s target exchange rate is 0.80 euros per dollar.
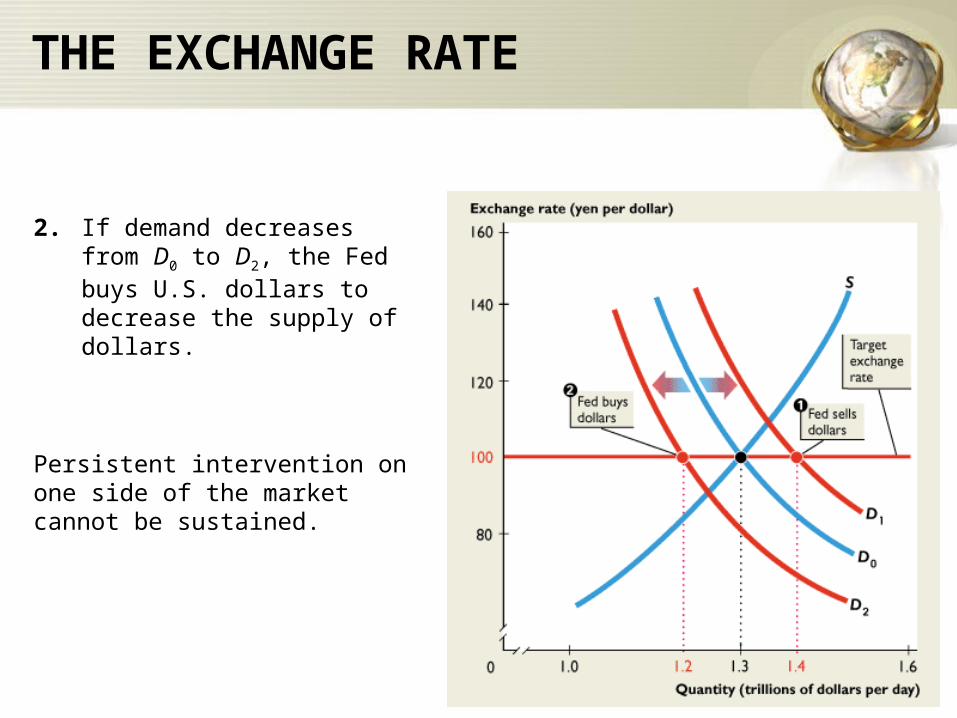
2. If demand decreases from D0 to D2, the Fed buys U.S. dollars to decrease the supply of dollars.
THE EXCHANGE RATE
Persistent intervention on one side of the market cannot be sustained.

THE EXCHANGE RATE
• People’s Bank of China in the Foreign Exchange Market
The People’s Bank of China has been piling up reserves of U.S. dollars since 2000.

Figure 19.8(b) shows the market for U.S. dollars in terms of the Chinese yuan.
THE EXCHANGE RATE
1. The equilibrium exchange rate is 5 yuan per U.S. dollar.
2. The People’s Bank has a target exchange rate of 7.50 yuan per U.S. dollar.
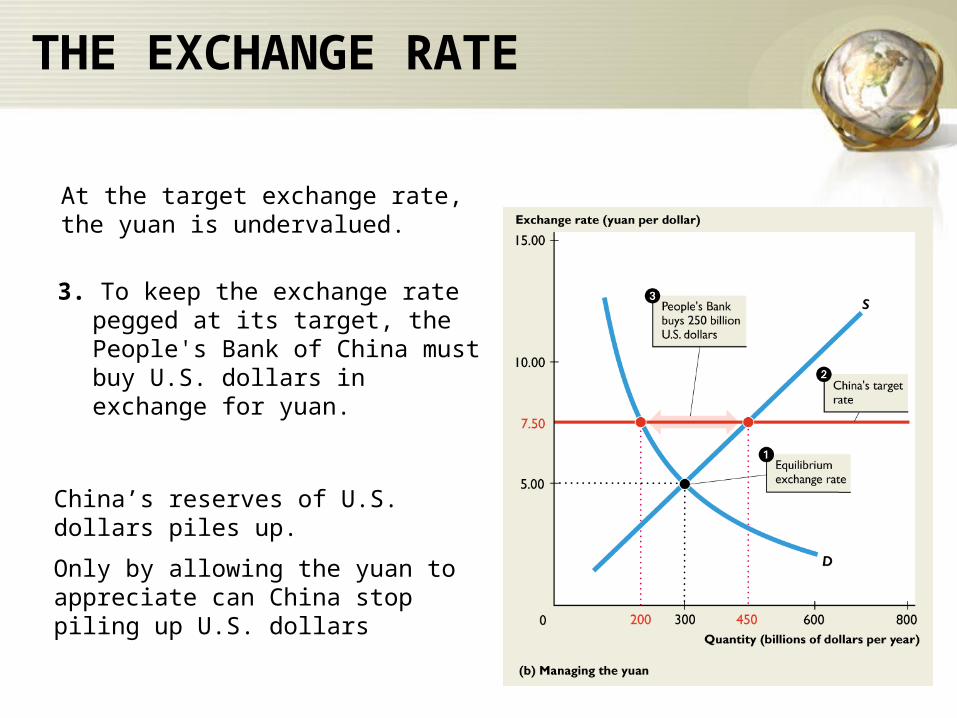
At the target exchange rate, the yuan is undervalued.
THE EXCHANGE RATE
3. To keep the exchange rate pegged at its target, the People's Bank of China must buy U.S. dollars in exchange for yuan.
China’s reserves of U.S. dollars piles up.
Only by allowing the yuan to appreciate can China stop piling up U.S. dollars
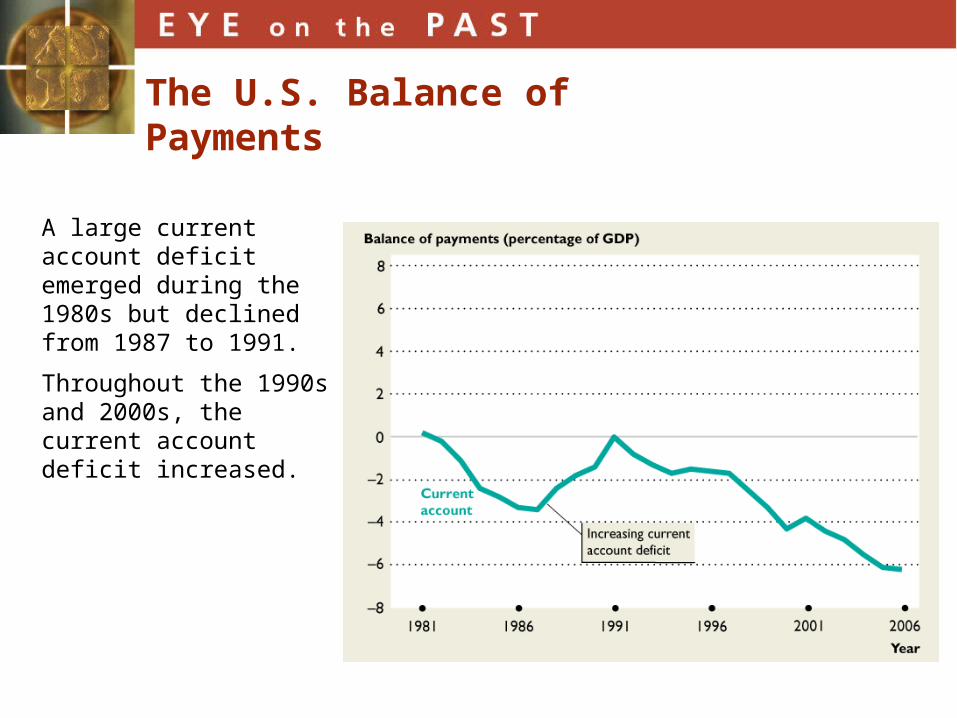
A large current account deficit emerged during the 1980s but declined from 1987 to 1991.
Throughout the 1990s and 2000s, the current account deficit increased.
The U.S. Balance of Payments
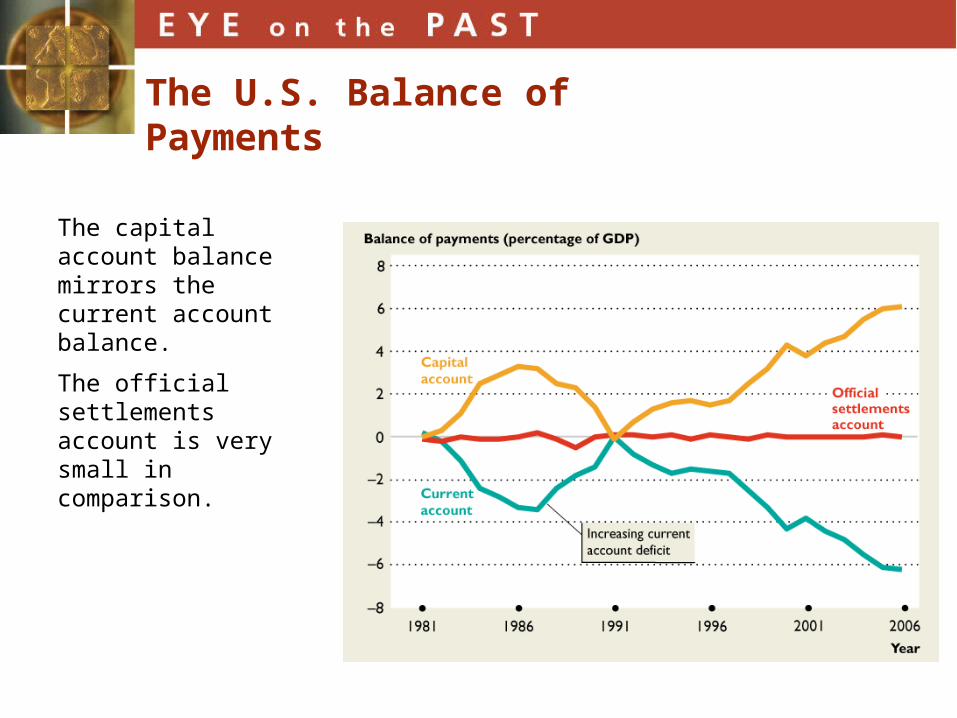
The capital account balance mirrors the current account balance.
The official settlements account is very small in comparison.
The U.S. Balance of Payments
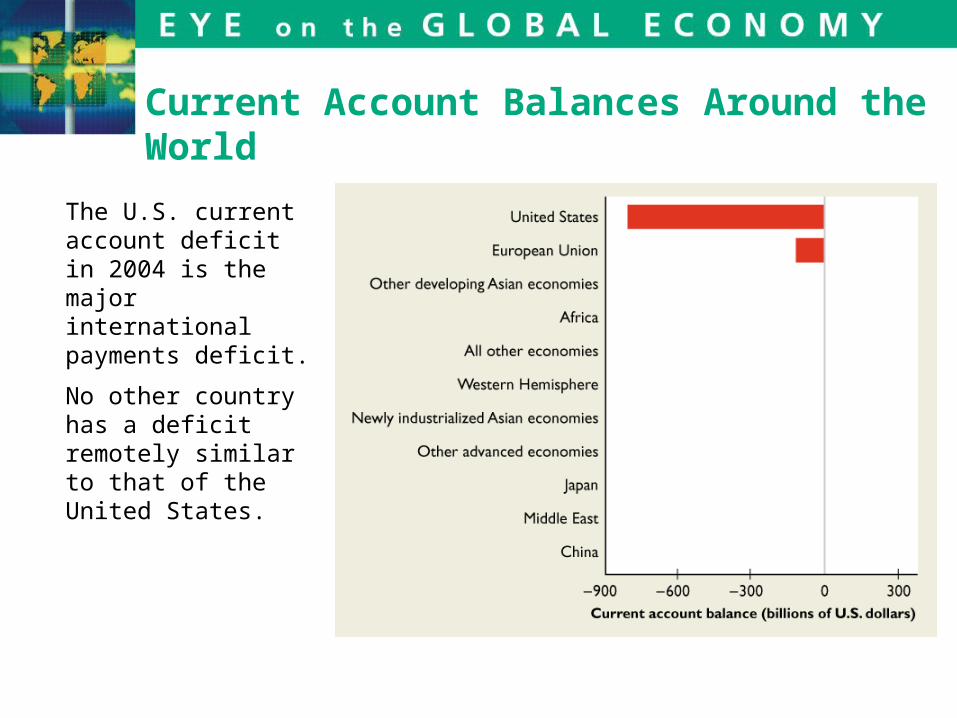
Current Account Balances Around the World
The U.S. current account deficit in 2004 is the major international payments deficit.
No other country has a deficit remotely similar to that of the United States.

Current Account Balances Around the World
For every current account deficit there must be a current account surplus.
The U.S. deficit is reflected in a large number of small surpluses spread around the world.
Notice China’s small surplus.

The Dollar and the Euro Since 1999
The figure shows the exchange rate of the U.S. dollar in terms of the euro.
From 1999 to 2001, the U.S. dollar appreciated against the euro.
From 2002 to 20078, the U.S. dollar depreciated against the euro.

The U.S. dollar’s depreciation was rapid during 2003, but it slowed during 2004 and for a few months it appreciated again.
But the dollar’s slide resumed in 2006 and by the end of 2007, it was hitting new lows against the euro almost daily.
The Dollar and the Euro Since 1999

Purchasing Power Parity
Purchasing power parity (PPP) holds in the long run, but in the short run, large deviations from PPP can occur.
In November 2007, the Danish krone was the most overvalued currency.
According to PPP, an overvalued currency, will depreciate in the future.
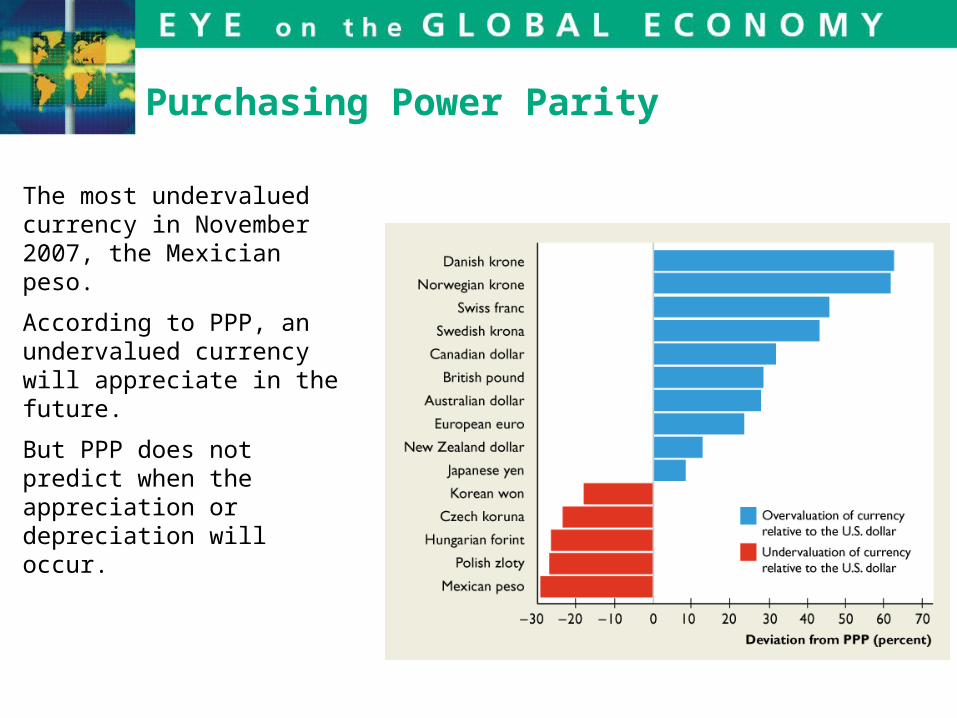
Purchasing Power Parity
The most undervalued currency in November 2007, the Mexician peso.
According to PPP, an undervalued currency will appreciate in the future.
But PPP does not predict when the appreciation or depreciation will occur.
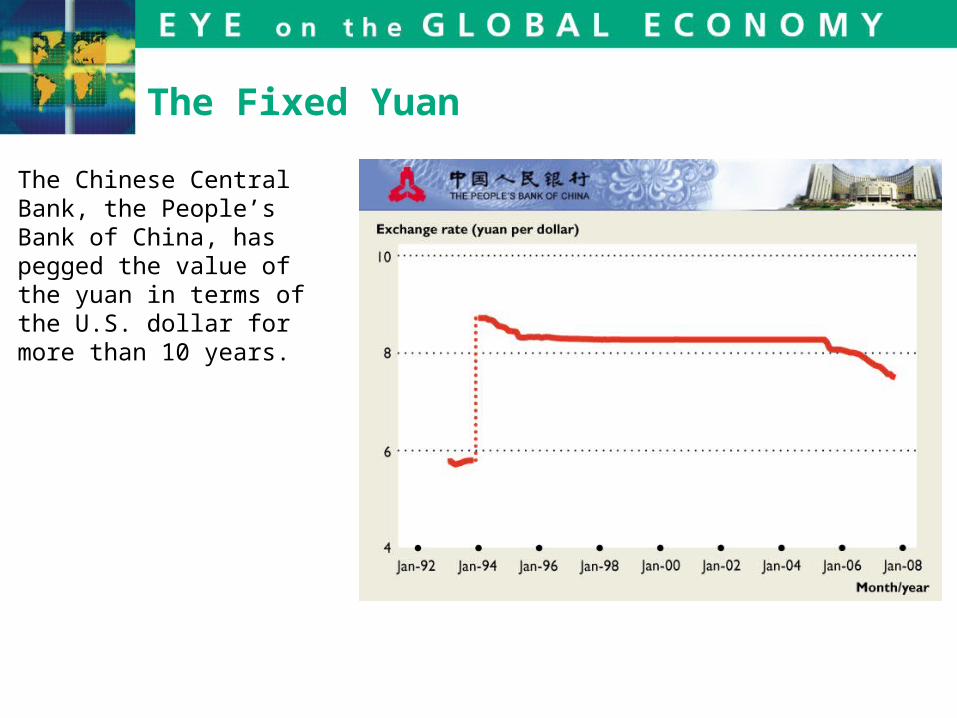
The Fixed Yuan
The Chinese Central Bank, the People’s Bank of China, has pegged the value of the yuan in terms of the U.S. dollar for more than 10 years.

The Fixed Yuan
The yuan was devalued in January 1994.
The yuan appreciated a bit in 1995, but it was then pegged at 8.28 yuan to the U.S. dollar for more than 10 years.
In July 2005, the yuan began a managed float.

If you plan to go to Europe for a vacation next summer, you will need some euros.
What is the best way to get euros?
One way is to just take your cash card (your debit card or credit card) and use an ATM in Europe.
You’ll get euros from the cash machine, and your bank account in the United States will get charged for the cash you obtain.
When you get euros, the number of euros you request is multiplied by the exchange rate to determine how many dollars to take from your bank account.
Your Foreign Exchange Transactions
You have just made a transaction in the foreign exchange market. You have exchanged dollars for euros.
The exchange rate that you paid was probably costly.
Your bank took a commission for helping you get euros. Some banks charge as much as 5 percent.
Check in advance. It might be better to buy euros from your bank before you leave on your trip.
Your Foreign Exchange Transactions

Another question has possibly occurred to you:
How many euros will your budget buy next summer?
Should you get the euros now at a price that is certain or would it be better to wait until closer to your travel date and take a chance on the value of the dollar then?
No one can answer this question.
But you can buy euros today for delivery at a later date and at a fixed price today. (This transaction is made in a market called the forward exchange market.)
Again, you’ll end up paying a big commission for the service.
Your Foreign Exchange Transactions

Crossing Standard Lines
WILL I EVER USE THIS AGAIN ?
Yes, even now!
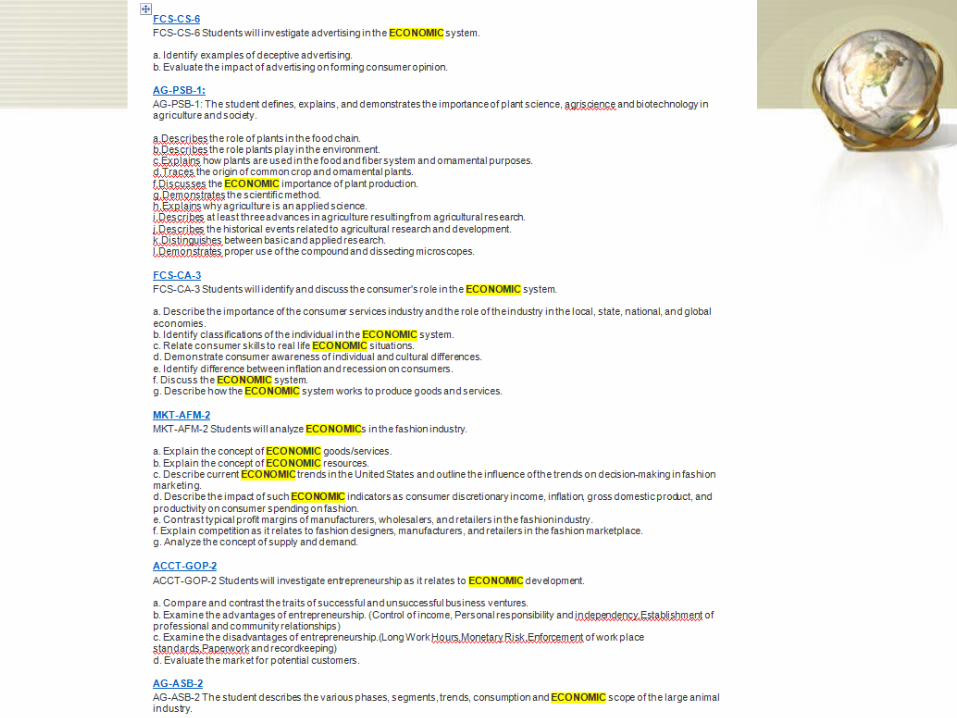

GA Performance StandardsMentioning’s of Economics• ACCT• GOP• AG AGRICULTURE• ASB• PSB Plant Science Biology• FS Forest science• NL Nursery and landscape• AML• BAS Basic agricultural
science and technology
• BCS BUSINESS AND COMPUTER SCIENCE
• BE Business essentials• BI Banking and Investing• EV• IRM INSURANCE and RISK
MANAGEMENT• EDU EDUCATION• CIE Contemporary issues in
education• • ENGR ENGINEERING AND
TECHNOLOGY• AAE Appropriate and
alternative energy technologies• EA• STEM• SSUSH US history• NLRL Native language reading literacy
• FCS FAMILY and CONSUMER SERVICES• CA Consumer Awareness• CS Consumer Services• AGL• CF• CLS• USF• HS HEALTHCARE SCIENCE• ABT• HIS Introduction to healthcare science• MKT MARKETING, SALES and SERVICE• AM• ASEM• FM INTRO TO FASHION MARKETING• MP MARKETING PRINCIPLES• SEM• AFM ADVANCED FASHION MARKETING• HTM• IT• PSP Professional sales and promotion• SEV• SNS SPANISH FOR NATIVE SPEAKERS• SSEF• SSWG WORLD GOVT• SSWH WORLD HISTORY• SSCG CIVIC GOVERNMENT
ENTOMOLOGY
SEN3. Students will investigate the impact of insects on the production of food and other products.
d. Analyze the economic impact that insects can have on livestock and pets (e.g., dog heartworm is transmitted by mosquitoes, and fleas are irritating pests).
SEN5. Students will evaluate methods for the management of insect populations for the benefit of humans.
a. Discuss the economic benefits of controlling insect population.
GOVERNMENT
SSCG20 The student will describe the tools used to carry out United States foreign policy (diplomacy, economic, military and, humanitarian aid, treaties, sanctions, and military intervention).
International, technology,, global village, human rights, United nations, civil and political rights, social and economic rights

MULTICULTURAL and WORLD LITERATURE
ELAMLRL3 The student deepens understanding of a work of multicultural literature by relating it to its historical and/or contemporary context, as well as to works from other cultures.
As a group students research the historical event, familiarizing themselves with the social, political, and economic contexts.