internaonalpastaorganisaon* - world pasta day 2017 ... pasta industry survey... · #&...
TRANSCRIPT

Interna'onal Pasta Organisa'on


U.E. 35.7%
Other Europe 16.3%
Africa 5.6%
North America 15.2%
Central and South America 21.0%
Middle East 4.1%
Asia 1.7% Australia
0.4%

25,3
16,0
12,2
11,5
9,2
8,8
8,5
8,4
8,3
8,2
8,1
8,0
8,0


Source: Global Trade Atlas, Global Trade Information Services, Inc.

Source: Global Trade Atlas, Global Trade Information Services, Inc.

Source: Global Trade Atlas, Global Trade Information Services, Inc.

Source: Global Trade Atlas, Global Trade Information Services, Inc.

IPO 2014 Survey on World Pasta IndustryThe World Pasta Industry in Figures 2011 - 2013
Source: IPO 2014 Annual Survey on World Pasta Industry1 -‐ Source: Import/Export figures by Global Trade Information Services, Inc.
Country2011 2012 2013
Number of Manufacturers (capacity greater than 1 tons/day)
-
Volume Value Volume Value Volume Value
(Tonnes) Million Euro (Tonnes) Million Euro (Tonnes) Million Euro
Production 54,778 - 54,778 - 54,778 -
Dry Pasta
-- Durum wheat semolina
-- Soft wheat flour
-- Egg pasta
Fresh pasta
Noodles/ Instant Pasta/ Ready Meals
Total Consumption (in tons) - - - - 63,479 -
Dry Pasta
-- Durum wheat semolina
-- Soft wheat flour
-- Egg pasta
Fresh pasta
Noodles/ Instant Pasta/ Ready Meals
Per capita consumption (in Kg)
Dry Pasta
-- Durum wheat semolina
-- Soft wheat flour
-- Egg pasta
Fresh pasta
Noodles/ Instant Pasta/ Ready MealsTotal Population (million hab.)
Export
Total 44,869 98.7 45,175 97.8 46,679 99.7
(2013-First three countries of destination)
Non EU Countries 2,139 5.1 2,249 4.7 2,811 5.7
Total
First three countries of destination
-- Switzerland 1,639 4.2 Switzerland 1,166 3.0 Switzerland 1,412 3.7
-- Croatia 128 0.2 Belarussia 428 0.3 Belarussia 901 0.6
-- Turkey 116 0.4 Russia 203 0.2 Russia 185 0.3
E.U. Member States 42,734 936 42,926 93.2 43,868 94.0
Total
-- Germany 26,193 59.6 Germany 25,210 57.2 Germany 28,093 61.8
-- Italy 6,104 9.4 Italy 6,144 9.2 Italy 4,733 7.2
-- Denmark 2,324 5.5 Denmark 2,216 5.3 Denmark 1,770 3.8
Import
Total 51,203 70.7 57,608 79.4 55,380 81.5
(2013-First three countries of destination)
Non EU Countries
Total 7,651 14.2 7,221 13.3 7,296 13.0
-- Switzerland 6,848 1.4 Switzerland 6,578 1.6 Switzerland 6,672 12.5
-- Turkey 570 0.4 Turkey 397 0.3 Turkey 442 0.3
-- China 134 0.1 Korea South 117 0.2 Korea South 119 0.2
E.U. Member States
Total 43,552 56.5 50.387 66.10 48,084 68.40
-- Italy 32,333 33.7 Italy 38.721 41 Italy 35980 39.5
-- Germany 9,044 16.9 Germany 9.300 20 Germany 9,887 23.5
-- Belgium 637 1.5 Netherlands 826 2 Hungary 751 2.2
Raw materials Durum Wheat Soft Wheat Durum
Wheat Soft Wheat Durum Wheat Soft Wheat
Wheat (tonnes)
Pasta production
Others (Biscuits, Breads, etc...)
Total
Eggs (tonnes)
Last data update
5.6
May-12 May-13 May-13
5.6 5.6
Austria 1
- -

IPO 2014 Survey on World Pasta IndustryThe World Pasta Industry in Figures 2011 - 2013
Source: IPO 2014 Annual Survey on World Pasta Industry1 -‐ Source: Import/Export figures by Global Trade Information Services, Inc.
Country
Number of Manufacturers (capacity greater than 1 tons/day)
Production
Dry Pasta
-- Durum wheat semolina
-- Soft wheat flour
-- Egg pasta
Fresh pasta
Noodles/ Instant Pasta/ Ready Meals
Total Consumption (in tons)
Dry Pasta
-- Durum wheat semolina
-- Soft wheat flour
-- Egg pasta
Fresh pasta
Noodles/ Instant Pasta/ Ready Meals
Per capita consumption (in Kg)
Dry Pasta
-- Durum wheat semolina
-- Soft wheat flour
-- Egg pasta
Fresh pasta
Noodles/ Instant Pasta/ Ready MealsTotal Population (million hab.)
Export
Total
(2013-First three countries of destination)
Non EU Countries
Total
First three countries of destination
--
--
--
E.U. Member States
Total
--
--
--
Import
Total
(2013-First three countries of destination)
Non EU Countries
Total
--
--
--
E.U. Member States
Total
--
--
--
Raw materials
Wheat (tonnes)
Pasta production
Others (Biscuits, Breads, etc...)
Total
Eggs (tonnes)
Last data update
2011 2012 2013
Volume Value Volume Value Volume Value
(Tonnes) Million Euro (Tonnes) Million Euro (Tonnes) Million Euro
- - - - 77,500 -
- - - - 23,167 -
137,429 226.7 149,972 243.3 136,306 213.6
5,298 11.7 5,391 10.6 4,240 8.4
Switzerland 2,532 7.3 Switzerland 2,269 5.8 Switzerland 2,135 5.4
Japan 787 1.2 Norway 643 1.3 Japan 749 1.1
Norway 587 1.1 Japan 671 1 Qatar 406 0.4
132,131 215.0 144,581 232.7 132,066 205.2
Netherlands 41,775 58.8 Netherlands 47,424 68.8 Netherlands 51,206 72.6
France 31,036 49.0 France 30,647 46.7 France 28,842 39.7
Germany 24,090 42.9 Germany 26,386 44.9United Kingdom 19,683 27.8
77,326 134.1 86,960 141.9 81,973 132.9
2,972 7.1 3,165 6.2 4,127 7.8
Turkey 896 0.5 Turkey 1,581 1.0 Turkey 2,335 1.6
Vietnam 569 1.9 Vietnam 302 1.9 Vietnam 812 2.8
China 559 0.7 Thailand 380 2.2 Thailand 449 2.2
74,354 127.0 83,795 135.7 77,846 125.1
Italy 32,399 46.5 Italy 34,731 49.6 Italy 42,974 55.4
France 22,511 33.8 France 22,809 35.2 France 18,096 28.9
Netherlands 7,670 16.5 Germany 12,936 19.5 Netherland 5,969 14.8
Durum Wheat Soft Wheat Durum
Wheat Soft Wheat Durum Wheat Soft Wheat
- - 5.4
May-12 May-13
Benelux 1
--

IPO 2014 Survey on World Pasta IndustryThe World Pasta Industry in Figures 2011 - 2013
Source: IPO 2014 Annual Survey on World Pasta Industry1 -‐ Source: Import/Export figures by Global Trade Information Services, Inc.
Country
Number of Manufacturers (capacity greater than 1 tons/day)
Production
Dry Pasta
-- Durum wheat semolina
-- Soft wheat flour
-- Egg pasta
Fresh pasta
Noodles/ Instant Pasta/ Ready Meals
Total Consumption (in tons)
Dry Pasta
-- Durum wheat semolina
-- Soft wheat flour
-- Egg pasta
Fresh pasta
Noodles/ Instant Pasta/ Ready Meals
Per capita consumption (in Kg)
Dry Pasta
-- Durum wheat semolina
-- Soft wheat flour
-- Egg pasta
Fresh pasta
Noodles/ Instant Pasta/ Ready MealsTotal Population (million hab.)
Export
Total
(2013-First three countries of destination)
Non EU Countries
Total
First three countries of destination
--
--
--
E.U. Member States
Total
--
--
--
Import
Total
(2013-First three countries of destination)
Non EU Countries
Total
--
--
--
E.U. Member States
Total
--
--
--
Raw materials
Wheat (tonnes)
Pasta production
Others (Biscuits, Breads, etc...)
Total
Eggs (tonnes)
Last data update
2011 2012 2013
Volume Value Volume Value Volume Value
(Tonnes) Million Euro (Tonnes) Million Euro (Tonnes) Million Euro
241,933 - 233,566 - 241,573
513,008 - 493,332 - 512,465
28,438 35.2 32,445 42.6 32,639 41.0
12,740 16.0 15,057 21.7 14,380 19.6
United Arab Emirates 1,313 1.5
United Arab Emirates 1,590 1.9
United Arab Emirates 1,649 1.9
Switzerland 1,136 1.3 Switzerland 1,117 3363.0 Maroc 1,230 1.6
Maroc 980 1.7 Maroc 1,114 1.3 Arabia Saudita 1,062 1.3
15,698 19.2 11,996 13.8 18,259 21.4
Belgium 7,634 7.6 Belgium 7,718 8.2 Belgium 7,237 7.8
Germany 2,529 3.9 Germany 2,326 3.9 Spain 2,823 1.8
Spain 1,148 1.5 Spain 1,952 1.7 Germany 2,502 4.3
303,230 269.0 296,038 275.7 307,419 279.3
9,510 10.7 11,223 12.5 12,283 14.1
France (retour) 3,745 3.6 France (retour) 5,536 4.9 France (retour) 5,448 4.3
China 2,554 2.6 China 2,027 2.3 China 2,659 3.7
Thailand 917 1.4 Thailand 945 1.6 Thailand 1,185 1.9
293,720 258.4 284,815 263.20 295,136 265.20
Italy 251,208 221.1 Italy 238,096 221.1 Italy 244,491 220.4
Spain 23,801 17.0 Spain 28,613 21.7 Spain 28,461 20.9
Belgium 13,227 13.2 Belgium 12,076 12.7 Belgium 15,338 15.6
Durum Wheat Soft Wheat Durum
Wheat Soft Wheat Durum Wheat Soft Wheat
367,791 355,071 367,244
367,791 355,071 367,244
8,241 7,815 8,127
8.1 7.7 8.1
May-13May-12 May-14
France
8 88

IPO 2014 Survey on World Pasta IndustryThe World Pasta Industry in Figures 2011 - 2013
Source: IPO 2014 Annual Survey on World Pasta Industry1 -‐ Source: Import/Export figures by Global Trade Information Services, Inc.
Country
Number of Manufacturers (capacity greater than 1 tons/day)
Production
Dry Pasta
-- Durum wheat semolina
-- Soft wheat flour
-- Egg pasta
Fresh pasta
Noodles/ Instant Pasta/ Ready Meals
Total Consumption (in tons)
Dry Pasta
-- Durum wheat semolina
-- Soft wheat flour
-- Egg pasta
Fresh pasta
Noodles/ Instant Pasta/ Ready Meals
Per capita consumption (in Kg)
Dry Pasta
-- Durum wheat semolina
-- Soft wheat flour
-- Egg pasta
Fresh pasta
Noodles/ Instant Pasta/ Ready MealsTotal Population (million hab.)
Export
Total
(2013-First three countries of destination)
Non EU Countries
Total
First three countries of destination
--
--
--
E.U. Member States
Total
--
--
--
Import
Total
(2013-First three countries of destination)
Non EU Countries
Total
--
--
--
E.U. Member States
Total
--
--
--
Raw materials
Wheat (tonnes)
Pasta production
Others (Biscuits, Breads, etc...)
Total
Eggs (tonnes)
Last data update
2011 2012 2013
Volume Value Volume Value Volume Value
(Tonnes) Million Euro (Tonnes) Million Euro (Tonnes) Million Euro
334,179 - 334,179 - 334,179 -
654,371 - 654,371 - 654,371 -
45,305 57.0 59,123 109.6 58,372 108.3
8,835 15.0 11,447 22.5 12,686 25.2
Russia 3,413 4.6 Switzerland 4,223 10.6 Switzerland 4,066 9.8
Switzerland 2,456 3.8 Russia 3,313 4.9 Russia 3,824 5.9
U.S.A. 1,484 3.2 U.S.A. 1,714 3.1 U.S.A. 1,899 3.4
36,470 42.0 47,676 87.1 45,686 83.1
Netherlands 6,381 5.3 Austria 9,738 21.9 Austria 9,783 21.2
France 5,755 6.4 Netherlands 7,382 10.5 Netherlands 9,181 12.7
Austria 4,973 6.7 France 6,903 10.6 France 6,174 9.0
361,300 291.0 423,242 459.2 424,992 479.4
13,000 11.0 23,160 40.7 25,094 38.2
Turkey 7,481 4.8 Switzerland 14,769 32.4 Switzerland 14,114 28.2
Switzerland 4,155 4.7 Turkey 6,119 4.3 Turkey 7,244 5.1
China 788 0.8 China 1,352 1.5 China 2,446 2.1
348,300 280.0 400,082 418.6 399,898 441.2
Italy 330,600 256.0 Italy 340,655 310.2 Italy 334,286 322.4
Belgium 6,240 6.8 Belgium 21,919 38.2 Austria 16,643 29.5
Netherlands 4,843 7.7 Austria 11,622 22.5 Belgium 14,902 26.7
Durum Wheat Soft Wheat Durum
Wheat Soft Wheat Durum Wheat Soft Wheat
500,000
500,000
46,000
8.0 8.0
Jul-14
8.0
May-12May-12
Germany 1
2020 20

IPO 2014 Survey on World Pasta IndustryThe World Pasta Industry in Figures 2011 - 2013
Source: IPO 2014 Annual Survey on World Pasta Industry1 -‐ Source: Import/Export figures by Global Trade Information Services, Inc.
Country
Number of Manufacturers (capacity greater than 1 tons/day)
Production
Dry Pasta
-- Durum wheat semolina
-- Soft wheat flour
-- Egg pasta
Fresh pasta
Noodles/ Instant Pasta/ Ready Meals
Total Consumption (in tons)
Dry Pasta
-- Durum wheat semolina
-- Soft wheat flour
-- Egg pasta
Fresh pasta
Noodles/ Instant Pasta/ Ready Meals
Per capita consumption (in Kg)
Dry Pasta
-- Durum wheat semolina
-- Soft wheat flour
-- Egg pasta
Fresh pasta
Noodles/ Instant Pasta/ Ready MealsTotal Population (million hab.)
Export
Total
(2013-First three countries of destination)
Non EU Countries
Total
First three countries of destination
--
--
--
E.U. Member States
Total
--
--
--
Import
Total
(2013-First three countries of destination)
Non EU Countries
Total
--
--
--
E.U. Member States
Total
--
--
--
Raw materials
Wheat (tonnes)
Pasta production
Others (Biscuits, Breads, etc...)
Total
Eggs (tonnes)
Last data update
2011 2012 2013
Volume Value Volume Value Volume Value
(Tonnes) Million Euro (Tonnes) Million Euro (Tonnes) Million Euro
145,000 - 165,000 - 170,000 -
115,000 - 120,000 - 127,000 -
40,897 30.1 53,467 43.4 54,579 44.6
397 0.3 8,074 7.7 17,462 14.2
Albania 6,924 4.3
Japan 3,344 2.2
U.S.A. 1,774 1.7
40,500 29.0 45,392 35.7 37,117 30.3
Italy 16,392 14.4
Bulgaria 3,877 30.5
United Kingdom 3,785 25.6
13,769 19.3 12,896 18.8 10,836 16.3
169 0.3 240 0.5 244 0.3
Turkey 112 0.1
China 81 0.1
Thailand 42 0.0
13,600 19.0 12,657 18.3 10,592 16.0
Italy 9,073 13.2
Germany 449 1.0
Bulgaria 430 0.4
Durum Wheat Soft Wheat Durum
Wheat Soft Wheat Durum Wheat Soft Wheat
218,000 248 255,000
218,000 248 255,000
65 62 60
May-13 May-14
10.6
May-12
11.510.5
Greece 1
444
IPO 2014 Survey on World Pasta IndustryThe World Pasta Industry in Figures 2011 - 2013
Source: IPO 2014 Annual Survey on World Pasta Industry1 -‐ Source: Import/Export figures by Global Trade Information Services, Inc.
Country
Number of Manufacturers (capacity greater than 1 tons/day)
Production
Dry Pasta
-- Durum wheat semolina
-- Soft wheat flour
-- Egg pasta
Fresh pasta
Noodles/ Instant Pasta/ Ready Meals
Total Consumption (in tons)
Dry Pasta
-- Durum wheat semolina
-- Soft wheat flour
-- Egg pasta
Fresh pasta
Noodles/ Instant Pasta/ Ready Meals
Per capita consumption (in Kg)
Dry Pasta
-- Durum wheat semolina
-- Soft wheat flour
-- Egg pasta
Fresh pasta
Noodles/ Instant Pasta/ Ready MealsTotal Population (million hab.)
Export
Total
(2013-First three countries of destination)
Non EU Countries
Total
First three countries of destination
--
--
--
E.U. Member States
Total
--
--
--
Import
Total
(2013-First three countries of destination)
Non EU Countries
Total
--
--
--
E.U. Member States
Total
--
--
--
Raw materials
Wheat (tonnes)
Pasta production
Others (Biscuits, Breads, etc...)
Total
Eggs (tonnes)
Last data update
2011 2012 2013
Volume Value Volume Value Volume Value
(Tonnes) Million Euro (Tonnes) Million Euro (Tonnes) Million Euro
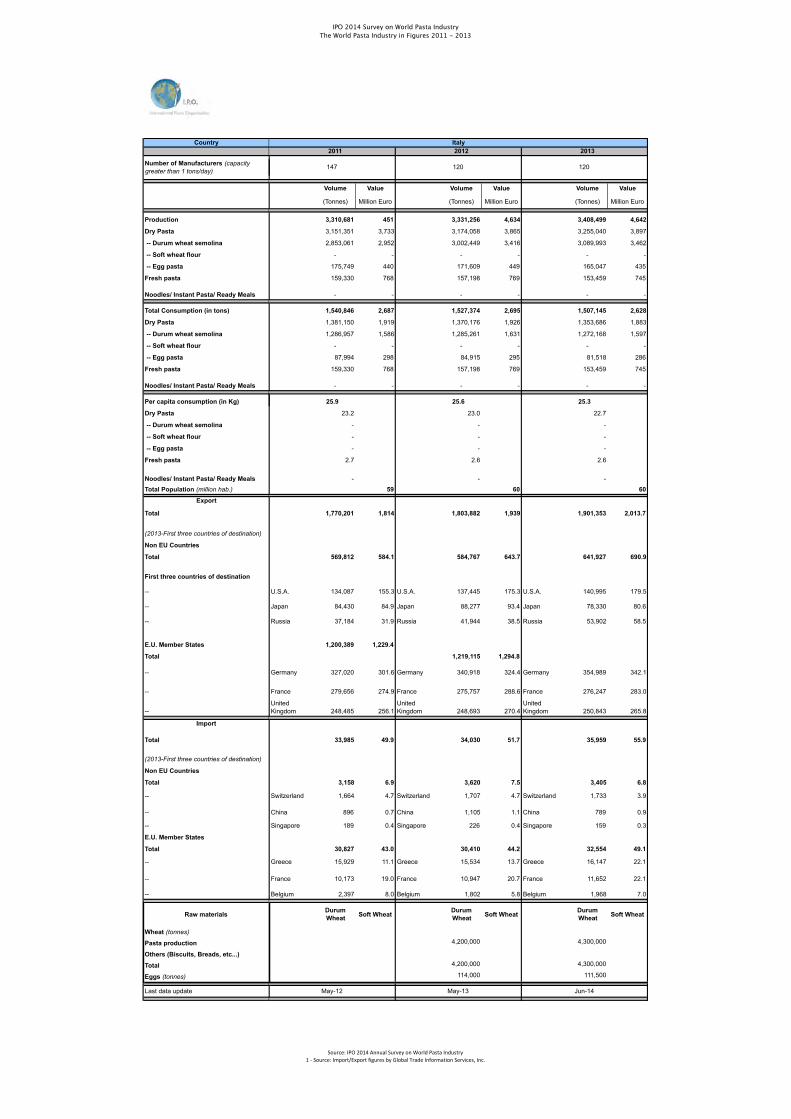
3,310,681 451 3,331,256 4,634 3,408,499 4,642
3,151,351 3,733 3,174,058 3,865 3,255,040 3,897
2,853,061 2,952 3,002,449 3,416 3,089,993 3,462
- - - - - -
175,749 440 171,609 449 165,047 435
159,330 768 157,198 769 153,459 745
- - - - - -
1,540,846 2,687 1,527,374 2,695 1,507,145 2,628
1,381,150 1,919 1,370,176 1,926 1,353,686 1,883
1,286,957 1,586 1,285,261 1,631 1,272,168 1,597
- - - - - -
87,994 298 84,915 295 81,518 286
159,330 768 157,198 769 153,459 745
- - - - - -
23.2 23.0 22.7
- - -
- - -
- - -
2.7 2.6 2.6
- - -
59 60 60
1,770,201 1,814 1,803,882 1,939 1,901,353 2,013.7
569,812 584.1 584,767 643.7 641,927 690.9
U.S.A. 134,087 155.3 U.S.A. 137,445 175.3 U.S.A. 140,995 179.5
Japan 84,430 84.9 Japan 88,277 93.4 Japan 78,330 80.6
Russia 37,184 31.9 Russia 41,944 38.5 Russia 53,902 58.5
1,200,389 1,229.4
1,219,115 1,294.8
Germany 327,020 301.6 Germany 340,918 324.4 Germany 354,989 342.1
France 279,656 274.9 France 275,757 288.6 France 276,247 283.0
United Kingdom 248,485 256.1
United Kingdom 248,693 270.4
United Kingdom 250,843 265.8
33,985 49.9 34,030 51.7 35,959 55.9
3,158 6.9 3,620 7.5 3,405 6.8
Switzerland 1,664 4.7 Switzerland 1,707 4.7 Switzerland 1,733 3.9
China 896 0.7 China 1,105 1.1 China 789 0.9
Singapore 189 0.4 Singapore 226 0.4 Singapore 159 0.3
30,827 43.0 30,410 44.2 32,554 49.1
Greece 15,929 11.1 Greece 15,534 13.7 Greece 16,147 22.1
France 10,173 19.0 France 10,947 20.7 France 11,652 22.1
Belgium 2,397 8.0 Belgium 1,802 5.8 Belgium 1,968 7.0
Durum Wheat Soft Wheat Durum
Wheat Soft Wheat Durum Wheat Soft Wheat
4,200,000 4,300,000
4,200,000 4,300,000
114,000 111,500
May-12 May-13 Jun-14
25.9 25.6 25.3
Italy
147 120120

IPO 2014 Survey on World Pasta IndustryThe World Pasta Industry in Figures 2011 - 2013
Source: IPO 2014 Annual Survey on World Pasta Industry1 -‐ Source: Import/Export figures by Global Trade Information Services, Inc.
Country
Number of Manufacturers (capacity greater than 1 tons/day)
Production
Dry Pasta
-- Durum wheat semolina
-- Soft wheat flour
-- Egg pasta
Fresh pasta
Noodles/ Instant Pasta/ Ready Meals
Total Consumption (in tons)
Dry Pasta
-- Durum wheat semolina
-- Soft wheat flour
-- Egg pasta
Fresh pasta
Noodles/ Instant Pasta/ Ready Meals
Per capita consumption (in Kg)
Dry Pasta
-- Durum wheat semolina
-- Soft wheat flour
-- Egg pasta
Fresh pasta
Noodles/ Instant Pasta/ Ready MealsTotal Population (million hab.)
Export
Total
(2013-First three countries of destination)
Non EU Countries
Total
First three countries of destination
--
--
--
E.U. Member States
Total
--
--
--
Import
Total
(2013-First three countries of destination)
Non EU Countries
Total
--
--
--
E.U. Member States
Total
--
--
--
Raw materials
Wheat (tonnes)
Pasta production
Others (Biscuits, Breads, etc...)
Total
Eggs (tonnes)
Last data update
2011 2012 2013
1
Volume Value Volume Value Volume Value
(Tonnes) Million Euro (Tonnes) Million Euro (Tonnes) Million Euro
23,335 - 23,335 - 23,335 -
- - 89,071 -
17,811 35.2 22,049 45.7 34,469 78.9
2,663 4.4 4,193 5.9 2,222 5.4
Norway 468 0.6 Norway 1,162 1.2 Norway 301 1.3Netherlands Antilles 336 0.6 Saudi Arabia 634 0.9 Hong Kong 217 0.7
Hon Kong 177 0.4Netherlands Antilles 300 0.5 Saudi Arabia 150 1.0
15,148 30.9 17,856 39.8 32,247 73.5
Germany 7,030 11.8 Germany 7,942 14.6 Germany 17,370 32.4
Belgium 2977 6.8 Belgium 3090 7.7 Belgium 5,713 13.8
United Kingdom 1291 3.5
United Kingdom 2242 6.1
United Kingdom 2,663 8.1
92,381 105.2 92,703 124.7 100,197 132.2
4,899 5.9 5,940 8.2 6,221 9.3
China 2,161 19.3 China 2,796 3 China 2,762 3.0
Turkey 1,683 1.0 Turkey 1,662 1.1 Turkey 1,582 1.1
Switzerland 422 1.5 Switzerland 360 1.3 Switzerland 441 1.8
87,482 99.3 86,763 116.5 93,976 122.9
Belgium 43,995 44.3 Belgium 46,028 57.4 Belgium 45,141 56.5
Italy 34,572 39.9 Italy 31,118 40.7 Italy 38,059 47.8
Germany 6,005 8.6 Germany 7,103 10.7 Germany 7,081 10.0
Durum Wheat Soft Wheat Durum
Wheat Soft Wheat Durum Wheat Soft Wheat
May-12 May-12 May-12
4.4 4.4 4.4
Netherlands 1
1 1

IPO 2014 Survey on World Pasta IndustryThe World Pasta Industry in Figures 2011 - 2013
Source: IPO 2014 Annual Survey on World Pasta Industry1 -‐ Source: Import/Export figures by Global Trade Information Services, Inc.
Country
Number of Manufacturers (capacity greater than 1 tons/day)
Production
Dry Pasta
-- Durum wheat semolina
-- Soft wheat flour
-- Egg pasta
Fresh pasta
Noodles/ Instant Pasta/ Ready Meals
Total Consumption (in tons)
Dry Pasta
-- Durum wheat semolina
-- Soft wheat flour
-- Egg pasta
Fresh pasta
Noodles/ Instant Pasta/ Ready Meals
Per capita consumption (in Kg)
Dry Pasta
-- Durum wheat semolina
-- Soft wheat flour
-- Egg pasta
Fresh pasta
Noodles/ Instant Pasta/ Ready MealsTotal Population (million hab.)
Export
Total
(2013-First three countries of destination)
Non EU Countries
Total
First three countries of destination
--
--
--
E.U. Member States
Total
--
--
--
Import
Total
(2013-First three countries of destination)
Non EU Countries
Total
--
--
--
E.U. Member States
Total
--
--
--
Raw materials
Wheat (tonnes)
Pasta production
Others (Biscuits, Breads, etc...)
Total
Eggs (tonnes)
Last data update
2011 2012 2013
Volume Value Volume Value Volume Value
(Tonnes) Million Euro (Tonnes) Million Euro (Tonnes) Million Euro
76,000 - 77,000 - 77,500 -
69,000 - 69,500 - 70,000 -
14,016 12.5 16,376 15.5 15,694 14.5
5,082 4.9 5,707 5.9 6,225 5.9
Angola 2,149 2 Angola 2,074 2.4 Angola 2,280 1.3Sao Tome & Principe 769 0.5
Sao Tome & Principe 997 0.7
Sao Tome & Principe 1,136 0.8
Guinea-Bissau 728 0.5 Guinea-Bissau 635 0.4 Capo Verde 802 0.6
8,934 7.6 10,669 9.7 9,469 8.6
Spain 7,960 6.4 Spain 9,203 7.4 Spain 7,714 6.2
France 591 0.7 France 777 1.3 France 723 1.1
Luxemburgo 283 0.4 Luxemburgo 362 4.5 Luxemburgo 444 0.6
19,760 36.2 22,669 37.1 21,916 32.2
310 0.4 302 0.4 325 0.4
China 218 0.2 China 201 0.2 China 182 0.1
Thailandia 23 0.09 Indonesia 35 0.06 Indonesia 48 0
Japan 35 0.09 Thailandia 25 0.04 Japan 28 0
19,450 35.8 22,367 36.7 21,591 31.8
Spain 8,253 12.8 Spain 9,948 16.2 Italy 8,907 9.8
Italy 6,591 11.1 Italy 7,903 11.7 Spain 8,025 13.2
France 4,078 10.5 France 3,883 7.5 France 3,628 6.6
Durum Wheat Soft Wheat Durum
Wheat Soft Wheat Durum Wheat Soft Wheat
10,500
May-12 May-13 May-14
6.6 6.76.6
Portugal 1
111
IPO 2014 Survey on World Pasta IndustryThe World Pasta Industry in Figures 2011 - 2013
Source: IPO 2014 Annual Survey on World Pasta Industry1 -‐ Source: Import/Export figures by Global Trade Information Services, Inc.
Country
Number of Manufacturers (capacity greater than 1 tons/day)
Production
Dry Pasta
-- Durum wheat semolina
-- Soft wheat flour
-- Egg pasta
Fresh pasta
Noodles/ Instant Pasta/ Ready Meals
Total Consumption (in tons)
Dry Pasta
-- Durum wheat semolina
-- Soft wheat flour
-- Egg pasta
Fresh pasta
Noodles/ Instant Pasta/ Ready Meals
Per capita consumption (in Kg)
Dry Pasta
-- Durum wheat semolina
-- Soft wheat flour
-- Egg pasta
Fresh pasta
Noodles/ Instant Pasta/ Ready MealsTotal Population (million hab.)
Export
Total
(2013-First three countries of destination)
Non EU Countries
Total
First three countries of destination
--
--
--
E.U. Member States
Total
--
--
--
Import
Total
(2013-First three countries of destination)
Non EU Countries
Total
--
--
--
E.U. Member States
Total
--
--
--
Raw materials
Wheat (tonnes)
Pasta production
Others (Biscuits, Breads, etc...)
Total
Eggs (tonnes)
Last data update
2011 2012 2013
Volume Value Volume Value Volume Value
(Tonnes) Million Euro (Tonnes) Million Euro (Tonnes) Million Euro
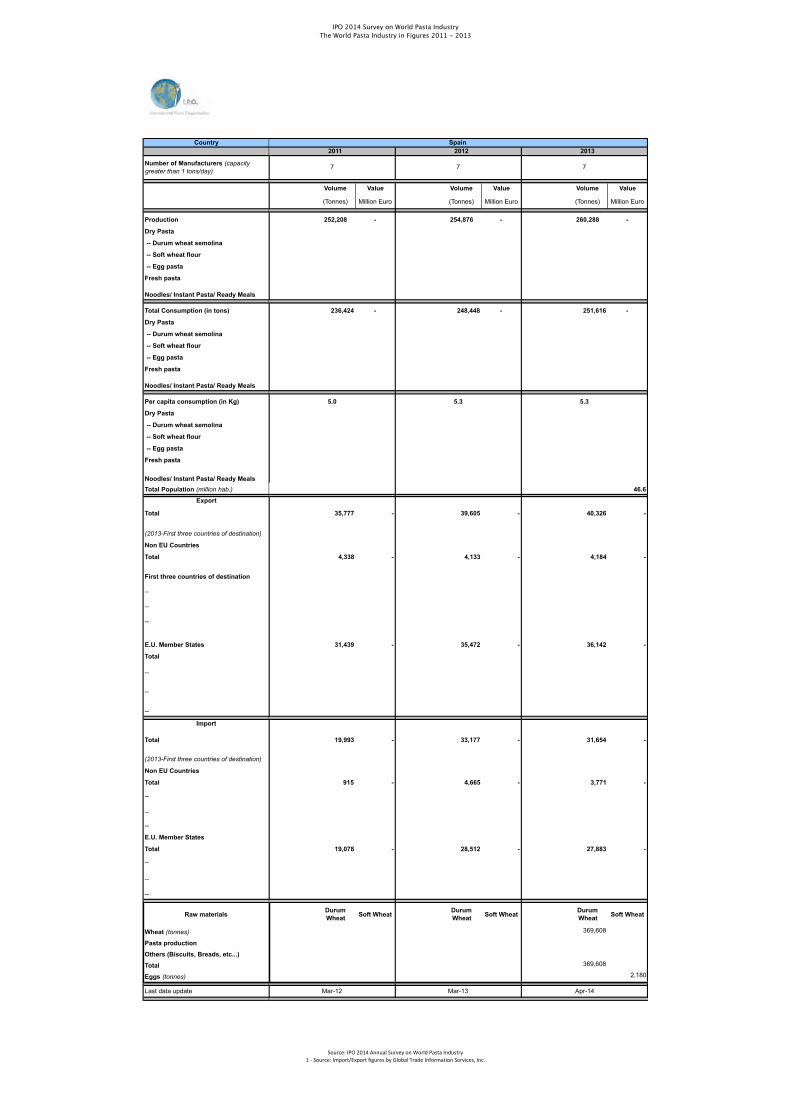
252,208 - 254,876 - 260,288 -
236,424 - 248,448 - 251,616 -
46.6
35,777 - 39,605 - 40,326 -
4,338 - 4,133 - 4,184 -
31,439 - 35,472 - 36,142 -
19,993 - 33,177 - 31,654 -
915 - 4,665 - 3,771 -
19,078 - 28,512 - 27,883 -
Durum Wheat Soft Wheat Durum
Wheat Soft Wheat Durum Wheat Soft Wheat
369,608
369,608
2,180
Apr-14
5.3
Mar-13
5.3
Spain
7 7 7
Mar-12
5.0

IPO 2014 Survey on World Pasta IndustryThe World Pasta Industry in Figures 2011 - 2013
Source: IPO 2014 Annual Survey on World Pasta Industry1 -‐ Source: Import/Export figures by Global Trade Information Services, Inc.
Country
Number of Manufacturers (capacity greater than 1 tons/day)
Production
Dry Pasta
-- Durum wheat semolina
-- Soft wheat flour
-- Egg pasta
Fresh pasta
Noodles/ Instant Pasta/ Ready Meals
Total Consumption (in tons)
Dry Pasta
-- Durum wheat semolina
-- Soft wheat flour
-- Egg pasta
Fresh pasta
Noodles/ Instant Pasta/ Ready Meals
Per capita consumption (in Kg)
Dry Pasta
-- Durum wheat semolina
-- Soft wheat flour
-- Egg pasta
Fresh pasta
Noodles/ Instant Pasta/ Ready MealsTotal Population (million hab.)
Export
Total
(2013-First three countries of destination)
Non EU Countries
Total
First three countries of destination
--
--
--
E.U. Member States
Total
--
--
--
Import
Total
(2013-First three countries of destination)
Non EU Countries
Total
--
--
--
E.U. Member States
Total
--
--
--
Raw materials
Wheat (tonnes)
Pasta production
Others (Biscuits, Breads, etc...)
Total
Eggs (tonnes)
Last data update
2011 2012 2013
Volume Value Volume Value Volume Value
(Tonnes) Million Euro (Tonnes) Million Euro (Tonnes) Million Euro
35,000 - 35,000 - 35,000 -
135,000 - 135,000 - 135,000 -
7,754 18.2 7,966 18.8 10,911 19.0
1,391 2.2 1103 1.8 708 1.5
South Korea 646 0.5 South Korea 461 0.5 South Korea 276 0.3
Japan 198 0.2 Malaysia 162 0.2United Arab Emirates 151 0.3
Thailandia 103 0.1United Arab Emirates 123 0.3 Lebanon 82 0
6,363 16.0 6,863 17.1 10,203 17.5
Ireland 4,990 12.9 Ireland 5,573 13.9 Ireland 8,062 12.5
Denmark 362 1.0 Denmark 311 0.9 France 458 1.6
France 233 0.7 Belgium 188 0.4 Denmark 255 0.8
188,518 210.9 176,789 213.6 169,989 218.3
3,095 3.5 6,209 8.6 6,819 12.7
Turkey 1,807 1.1 Turkey 4224 2.6 Turkey 2,470 1.6
Thailandia 268 0.6 Vietnam 366 2.4 China 1,402 2.3
China 176 0.4 Thailandia 321 0.8 Vietnam 532 3.7
185,423 207.5 170,580 205 163,170 205.6
Italy 149,241 159.5 Italy 134,990 150.5 Italy 128,888 150.2
Belgium 12,725 15.0 Belgium 12,833 16.6 Belgium 11,940 15.5
Germany 7,061 7.4 France 5,635 11.4 France 3,607 8.0
Durum Wheat Soft Wheat Durum
Wheat Soft Wheat Durum Wheat Soft Wheat
2.5 2.52.5
Apr-10 Apr-10
United Kingdom 1
May-14
88 8

IPO 2014 Survey on World Pasta IndustryThe World Pasta Industry in Figures 2011 - 2013
Source: IPO 2014 Annual Survey on World Pasta Industry1 -‐ Source: Import/Export figures by Global Trade Information Services, Inc.
Country
Number of Manufacturers (capacity greater than 1 tons/day)
Production
Dry Pasta
-- Durum wheat semolina
-- Soft wheat flour
-- Egg pasta
Fresh pasta
Noodles/ Instant Pasta/ Ready Meals
Total Consumption (in tons)
Dry Pasta
-- Durum wheat semolina
-- Soft wheat flour
-- Egg pasta
Fresh pasta
Noodles/ Instant Pasta/ Ready Meals
Per capita consumption (in Kg)
Dry Pasta
-- Durum wheat semolina
-- Soft wheat flour
-- Egg pasta
Fresh pasta
Noodles/ Instant Pasta/ Ready MealsTotal Population (million hab.)
Export
Total
(2013-First three countries of destination)
Non EU Countries
Total
First three countries of destination
--
--
--
E.U. Member States
Total
--
--
--
Import
Total
(2013-First three countries of destination)
Non EU Countries
Total
--
--
--
E.U. Member States
Total
--
--
--
Raw materials
Wheat (tonnes)
Pasta production
Others (Biscuits, Breads, etc...)
Total
Eggs (tonnes)
Last data update
2011 2012 2013
2 2 2
Volume Value Volume Value Volume Value
(Tonnes) Million Euro (Tonnes) Million Euro (Tonnes) Million Euro
70,000 - 70,000 - 70,000 -
60,000 - 60,000 - 60,000 -
41,642 26 34,317 22.6 36,036 24.0
590 0.4 390 0.6 498 0.7
Croatia 326 0.2 Russia 338 0.5 Russia 441 0.6
Russia 262 0.2 Ukraine 35 0.05 Ukraine 39 0.1
Moldavia 2 0.001 Kyrgyzstan 17 0 Norway 18 0.0
41,052 25.7 33,927 22.0 35,540 23.3
Slovakia 17,721 11.4 Poland 17,169 10.9 Poland 18,282 11.6
Poland 16,971 10.6 Slovakia 11,737 8.2 Slovakia 11,797 8.4
Hungaria 3,385 1.9 Hungaria 2,817 1.6 Hungaria 3,144 1.6
30,300 28.4 31,562 31.3 29,800 32.4
262 0.3 446 0.4 1,061 0.9
Vietnam 144 0.2 Turkey 169 0.1 China 585 0.4
Turkey 52 0.04 Vietnam 129 0.1 Vietnam 93 0.1
China 40 0.05 China 92 0 Turkey 64 0.0
30,038 28.20 31,116 3.00 28,739 31.5
Italy 12,408 11.9 Italy 12,539 12.7 Italy 13,644 14.2
Poland 7,245 3.7 France 5,013 6.6 Germany 4,447 4.4
France 4,976 6.3 Germany 3,909 3.9 France 4,064 6.3
Durum Wheat Soft Wheat Durum
Wheat Soft Wheat Durum Wheat Soft Wheat
6.0 6.0 6.0
May-12 May-13
Czech Republic 1
Apr-14
IPO 2014 Survey on World Pasta IndustryThe World Pasta Industry in Figures 2011 - 2013
Source: IPO 2014 Annual Survey on World Pasta Industry1 -‐ Source: Import/Export figures by Global Trade Information Services, Inc.
Country
Number of Manufacturers (capacity greater than 1 tons/day)
Production
Dry Pasta
-- Durum wheat semolina
-- Soft wheat flour
-- Egg pasta
Fresh pasta
Noodles/ Instant Pasta/ Ready Meals
Total Consumption (in tons)
Dry Pasta
-- Durum wheat semolina
-- Soft wheat flour
-- Egg pasta
Fresh pasta
Noodles/ Instant Pasta/ Ready Meals
Per capita consumption (in Kg)
Dry Pasta
-- Durum wheat semolina
-- Soft wheat flour
-- Egg pasta
Fresh pasta
Noodles/ Instant Pasta/ Ready MealsTotal Population (million hab.)
Export
Total
(2013-First three countries of destination)
Non EU Countries
Total
First three countries of destination
--
--
--
E.U. Member States
Total
--
--
--
Import
Total
(2013-First three countries of destination)
Non EU Countries
Total
--
--
--
E.U. Member States
Total
--
--
--
Raw materials
Wheat (tonnes)
Pasta production
Others (Biscuits, Breads, etc...)
Total
Eggs (tonnes)
Last data update
2011 1 2012 1 2013
30 30 30
Volume Value Volume Value Volume Value
(Tonnes) Million Euro (Tonnes) Million Euro (Tonnes) Million Euro
160,000 - 160,000 - 160,000 -
- - - - 202,940 -
38.5
17,695 19.7 31,051 32.5 27,353 33.8
3,165 3.2 5,162 4.8 7,794 6.8
U.S.A. 713 0.8 Ukraine 1,757 1.3 Ukraine 3,791 2.6
Ukraine 570 0.6 U.S.A. 757 1 U.S.A. 757 0.8
Kazakistan 460 0.4 Kazakistan 613 0.6 Kazakistan 657 0.7
14,531 16.5 25,889 27.7 19,559 27.0Czech Republic 6,572 4.2
Czech Republic - 4.5
Czech Republic 3,206 2.1
United Kingdom 2,118 3.7
United Kingdom - 4.5
United Kingdom 2,945 5.3
Germany 1,222 2.0 Slovakia - 2.7 Slovakia 2,345 1.8
47,864 49.3 64,346 70.3 70,293 68.2
524 0.7 6,362 8.3 1,961 2.8
Thailandia 228 0.4 Vietnam 4,454 5.4 Vietnam 420 0.5
Vietnam 223 0.3 Ukraine 1,230 1.7 Ukraine 796 1.0
China 67 0.06 Thailand 287 0.50 Thailand 287 0.1
47,339 48.6 57,984 62.0 68,332 65.4
Italy 19,003 18.2 Italy - 19.7 Italy 22,233 23.6Czech Republic 16,924 10.7 Germany - 14.6 Germany 9,130 13.8
Germany 6,409 11.4Czech Republic - 11.3
Czech Republic 17,847 12.1
Durum Wheat Soft Wheat Durum
Wheat Soft Wheat Durum Wheat Soft Wheat
4.9 4.9 5.2
Poland
Jul-14Sep-12 Jun-13

IPO 2014 Survey on World Pasta IndustryThe World Pasta Industry in Figures 2011 - 2013
Source: IPO 2014 Annual Survey on World Pasta Industry1 -‐ Source: Import/Export figures by Global Trade Information Services, Inc.
Country
Number of Manufacturers (capacity greater than 1 tons/day)
Production
Dry Pasta
-- Durum wheat semolina
-- Soft wheat flour
-- Egg pasta
Fresh pasta
Noodles/ Instant Pasta/ Ready Meals
Total Consumption (in tons)
Dry Pasta
-- Durum wheat semolina
-- Soft wheat flour
-- Egg pasta
Fresh pasta
Noodles/ Instant Pasta/ Ready Meals
Per capita consumption (in Kg)
Dry Pasta
-- Durum wheat semolina
-- Soft wheat flour
-- Egg pasta
Fresh pasta
Noodles/ Instant Pasta/ Ready MealsTotal Population (million hab.)
Export
Total
(2013-First three countries of destination)
Non EU Countries
Total
First three countries of destination
--
--
--
E.U. Member States
Total
--
--
--
Import
Total
(2013-First three countries of destination)
Non EU Countries
Total
--
--
--
E.U. Member States
Total
--
--
--
Raw materials
Wheat (tonnes)
Pasta production
Others (Biscuits, Breads, etc...)
Total
Eggs (tonnes)
Last data update
2011 2012 1 2013
Volume Value Volume Value Volume Value
(Tonnes) Million Euro (Tonnes) Million Euro (Tonnes) Million Euro
6,261 6,915 6,261 6,915 6,045 7.7
10,672 - 10,672 - 10,947 -
4,982 5.3 6,726 6.8 4,697 5.1
586 0.7 1,127 1.2
Bosnia and Herzegovina 322 0.4 Hungaria 455 0.5
Bosnia and Herzegovina 307 0.4
Russia 74 0.1Bosnia and Herzegovina 282 0.3 Jordan 105 0.1
Macedonia 70 0.007 Jordan 120 0.100 Macedonia 74 0.1
4,396 4.6 5,599 5.6
Croatia 2,954 1.5 Croatia 3,976 3.8 Croatia 2,328 1.8
Hungary 248 0.2 Italy 1,194 1.4 Italy 1,191 1.4
France 10 0.4 Hungary 290 0.2 Hungary 233 0.2
7,386 8.4 7,647 8.9 9,599 10.8
106 0.2 41 0.0
China 8 0.01 China 30 0.0 China 273 0.1Bosnia-erzegovina 2 - Thailand 8 0.0
Bosnia and Herzegovina 19 0.0
Thailand 1 - - - Thailand 14 0.0
7,280 8.2 7,606 8.9
Italy 6,407 6.7 Italy 6,608 7.0 Italy 7,612 7.5
Austria 318 0.5 Austria 255 0.5 Germany 437 0.9
Germany 237 0.4 Germany 251 0.5 Austria 416 0.7
Durum Wheat Soft Wheat Durum
Wheat Soft Wheat Durum Wheat Soft Wheat
6.7
Slovenia
May-12 May-12
9 10
Feb-15
6.46.7
9

IPO 2014 Survey on World Pasta IndustryThe World Pasta Industry in Figures 2011 - 2013
Source: IPO 2014 Annual Survey on World Pasta Industry1 -‐ Source: Import/Export figures by Global Trade Information Services, Inc.
Country
Number of Manufacturers (capacity greater than 1 tons/day)
Production
Dry Pasta
-- Durum wheat semolina
-- Soft wheat flour
-- Egg pasta
Fresh pasta
Noodles/ Instant Pasta/ Ready Meals
Total Consumption (in tons)
Dry Pasta
-- Durum wheat semolina
-- Soft wheat flour
-- Egg pasta
Fresh pasta
Noodles/ Instant Pasta/ Ready Meals
Per capita consumption (in Kg)
Dry Pasta
-- Durum wheat semolina
-- Soft wheat flour
-- Egg pasta
Fresh pasta
Noodles/ Instant Pasta/ Ready MealsTotal Population (million hab.)
Export
Total
(2013-First three countries of destination)
Non EU Countries
Total
First three countries of destination
--
--
--
E.U. Member States
Total
--
--
--
Import
Total
(2013-First three countries of destination)
Non EU Countries
Total
--
--
--
E.U. Member States
Total
--
--
--
Raw materials
Wheat (tonnes)
Pasta production
Others (Biscuits, Breads, etc...)
Total
Eggs (tonnes)
Last data update
2011 2012 2013
Volume Value Volume Value Volume Value
(Tonnes) Million Euro (Tonnes) Million Euro (Tonnes) Million Euro
13,000 - 13,000 - 13,000 -
30,216 - 30,216 - 32,086 -
1,790 2.0 2,035 2.3 2,022 2.4
1,412 1.6 1,555 1.7
Bosnia-Erzegovina 929 0.9
Bosnia-Erzegovina 946 0.9
Bosnia-Erzegovina 1,173 1.0
Macedonia 135 0.2 Macedonia 208 0.2 Serbia 116 0.2
Montenegro 49 0.100 Serbia 121 0.2 Macedonia 108 0.1
575.0 0.6 623 0.7 467 0.7United Kingdom 307 0.2 Slovenia 282 0.5 Slovenia 370 0.6
Slovenia 196 0.4United Kingdom 273 0.2
United Kingdom 80 0.0
Ungary 60 0.1Czech Republic 28 0.0 Sweden 10 0.0
19,006 17.6 18,680 17.4 21,108 20.0
206 0.1 416 0.3 575 0.4
Serbia 112 0.1 Serbia 318 0.2 Serbia 439 0.2Bosnia-Erzegovina 83 0.0
Bosnia-Erzegovina 86 0.1
Bosnia-Erzegovina 109 0.0
China 9 0.0 China 8 0.0 Kosovo 15 0.0
18,800 17.5 18,264 17.1 20,533 19.6
Italy 16,109 15.2 Italy 15,037 14.4 Italy 16,044 15.3
Slovenia 1,796 1.4 Slovenia 2,261 1.7 Slovenia 2,371 1.7Czech Republic 341 0.3 Hungary 418 0.4 Germany 582 0.8
Durum Wheat Soft Wheat Durum
Wheat Soft Wheat Durum Wheat Soft Wheat
7.8 7.8 7.5
--
May-12 May-12
Croatia 1
-
May-12

IPO 2014 Survey on World Pasta IndustryThe World Pasta Industry in Figures 2011 - 2013
Source: IPO 2014 Annual Survey on World Pasta Industry1 -‐ Source: Import/Export figures by Global Trade Information Services, Inc.
Country
Number of Manufacturers (capacity greater than 1 tons/day)
Production
Dry Pasta
-- Durum wheat semolina
-- Soft wheat flour
-- Egg pasta
Fresh pasta
Noodles/ Instant Pasta/ Ready Meals
Total Consumption (in tons)
Dry Pasta
-- Durum wheat semolina
-- Soft wheat flour
-- Egg pasta
Fresh pasta
Noodles/ Instant Pasta/ Ready Meals
Per capita consumption (in Kg)
Dry Pasta
-- Durum wheat semolina
-- Soft wheat flour
-- Egg pasta
Fresh pasta
Noodles/ Instant Pasta/ Ready MealsTotal Population (million hab.)
Export
Total
(2013-First three countries of destination)
Non EU Countries
Total
First three countries of destination
--
--
--
E.U. Member States
Total
--
--
--
Import
Total
(2013-First three countries of destination)
Non EU Countries
Total
--
--
--
E.U. Member States
Total
--
--
--
Raw materials
Wheat (tonnes)
Pasta production
Others (Biscuits, Breads, etc...)
Total
Eggs (tonnes)
Last data update
2011 2012 2013
Volume Value Volume Value Volume Value
(Tonnes) Million Euro (Tonnes) Million Euro (Tonnes) Million Euro
1,083,000 - 1,083,000 - 1,083,000 -
1,128,188 - 1,128,188 - 1,151,359 -
4,388 4.0 5,819 5.2 4,490 5.2
4,388 4.0 5799 5.2 4488 5.2
Ukraine 1,643 1.8 Ukraine 2,648 3.0 Ukraine 3,008 3.3
Tajikistan 1,233 1.1 Tajikistan 1,581 0.6 Azerbaijan 303 0.6
Mongolia 530 0.300 Moldova 354 0.3 Mongolia 254 0.3
- - 20 0.0 2 0.0
- - Lithuania 19 0.0 Netherlands 1 0.0
- - Latvia 1 0.0 Germany 1 0.0
- - - - - -
49,576 48.9 49,576 48.9 72,849 73.2
5,683 5.0 5,683 5.0 9,894 8.0
China 3525 2.3 China 3525 2.3 China 6256 4.3
Vietnam 576 0.5 Vietnam 576 0.5 Ukraine 1529 1.9
Ukraine 511 0.6 Ukraine 511 0.6 Vietnam 822 0.5
43,893 43.9 43,893 43.9 62,955 65.3
Italy 38,749 36.7 Italy 38,749 36.7 Italy 56,654 55.3
Germany 3,727 5.7 Germany 3,727 5.7 Germany 3,718 6.0
Lithuania 460 0.3 Lithuania 460 0.3 Lithuania 915 0.9
Durum Wheat Soft Wheat Durum
Wheat Soft Wheat Durum Wheat Soft Wheat
7.8 7.8 8.0
-
May-12May-12
- -
May-12
Russia 1

IPO 2014 Survey on World Pasta IndustryThe World Pasta Industry in Figures 2011 - 2013
Source: IPO 2014 Annual Survey on World Pasta Industry1 -‐ Source: Import/Export figures by Global Trade Information Services, Inc.
Country
Number of Manufacturers (capacity greater than 1 tons/day)
Production
Dry Pasta
-- Durum wheat semolina
-- Soft wheat flour
-- Egg pasta
Fresh pasta
Noodles/ Instant Pasta/ Ready Meals
Total Consumption (in tons)
Dry Pasta
-- Durum wheat semolina
-- Soft wheat flour
-- Egg pasta
Fresh pasta
Noodles/ Instant Pasta/ Ready Meals
Per capita consumption (in Kg)
Dry Pasta
-- Durum wheat semolina
-- Soft wheat flour
-- Egg pasta
Fresh pasta
Noodles/ Instant Pasta/ Ready MealsTotal Population (million hab.)
Export
Total
(2013-First three countries of destination)
Non EU Countries
Total
First three countries of destination
--
--
--
E.U. Member States
Total
--
--
--
Import
Total
(2013-First three countries of destination)
Non EU Countries
Total
--
--
--
E.U. Member States
Total
--
--
--
Raw materials
Wheat (tonnes)
Pasta production
Others (Biscuits, Breads, etc...)
Total
Eggs (tonnes)
Last data update
2011 2012 2013
Volume Value Volume Value Volume Value
(Tonnes) Million Euro (Tonnes) Million Euro (Tonnes) Million Euro
20,200 - 20,200 - 20,200 -
- - - - 67,637 -
6,004 9.6 6,212 10.7 6,775 14.9
4,602 5.3 4828 6.3 4,933 8.8
Norway 4,374 4.8 Norway 4,597 5.6 Norway 4,225 5.6
Taiwan 44 0.1 United States 49 0.2 Russia 192 1.0
China 37 0.100 China 37 0.100 U.S.A. 157 0.8
1,402 4.3 1384 4.4 1,842 6.2
Finland 586 1.5 Finland 67 1.8 Finland 834 2.2
Denmark 414 1.2 Denmark 308 1.0 Denmark 322 1.1
United Kingdom 119 0.8
United Kingdom 142 0.8
United Kingdom 203 1.0
51,370 63.3 53,347 67.7 54,212 72.6
2,046 2.5 2,046 2.4 2,648 3.9
China 989 1.0 China 790 0.8 China 949 1.1
Thailand 505 0.9 Thailand 480 0.9 Thailand 611 1.2
Turkey 336 0.2 Turkey 474 0.3 Turkey 562 0.4
51,370 63.4 51,431 65.3 51,564 68.7
Italy 42,659 43.9 Italy 44,378 49.5 Italy 44,349 50.3
Denmark 2,463 7.2 Denmark 1,536 4.0 Germany 1,561 4.1
Germany 1,384 3.1 France 1,134 23.8 Denmark 1,267 3.3
Durum Wheat Soft Wheat Durum
Wheat Soft Wheat Durum Wheat Soft Wheat
9.0 9.0 7.0
May-12 May-12
---
May-12
Sweden 1

IPO 2014 Survey on World Pasta IndustryThe World Pasta Industry in Figures 2011 - 2013
Source: IPO 2014 Annual Survey on World Pasta Industry1 -‐ Source: Import/Export figures by Global Trade Information Services, Inc.
Country
Number of Manufacturers (capacity greater than 1 tons/day)
Production
Dry Pasta
-- Durum wheat semolina
-- Soft wheat flour
-- Egg pasta
Fresh pasta
Noodles/ Instant Pasta/ Ready Meals
Total Consumption (in tons)
Dry Pasta
-- Durum wheat semolina
-- Soft wheat flour
-- Egg pasta
Fresh pasta
Noodles/ Instant Pasta/ Ready Meals
Per capita consumption (in Kg)
Dry Pasta
-- Durum wheat semolina
-- Soft wheat flour
-- Egg pasta
Fresh pasta
Noodles/ Instant Pasta/ Ready MealsTotal Population (million hab.)
Export
Total
(2013-First three countries of destination)
Non EU Countries
Total
First three countries of destination
--
--
--
E.U. Member States
Total
--
--
--
Import
Total
(2013-First three countries of destination)
Non EU Countries
Total
--
--
--
E.U. Member States
Total
--
--
--
Raw materials
Wheat (tonnes)
Pasta production
Others (Biscuits, Breads, etc...)
Total
Eggs (tonnes)
Last data update
2011 2012 2013 1
Volume Value Volume Value Volume Value
(Tonnes) Million Euro (Tonnes) Million Euro (Tonnes) Million Euro
46,470 - 43,140 - 43,140 -
73,600 - 73,130 - 73,130 -
6,970 9.75 4,140 4.8 24,167 49.6
17,000 - 11,000 - 76 0.2
- - - - Israel 31 0.0
- - - - Belorus 21 0.0
- - - - U.S.A. 8 0.0
6,953 9.73 4,129 9.73 24,091 49.5
Germany 4,190 - Germany 2,410 - Germany 14,113 28.2
Austria 1,163 - Austria 920 - Austria 6,667 15.6
Nederland 449 - Nederland 410 - Nederland 1,916 3.9
32,540 4.0 33,400 4.1 41,002 75.6
1,130 - 1,240 - 1,738 4.3
China 551 - China 655 - China 639 1.2
Thailand 475 - Thailand 493 - Thailand 633 1.5
Turkey 30 - Turkey - - Vietnam 231 1.1
31,410 3.86 32,160 - 39,264 71.30
Italy 27,773 - Italy 28,530 - Italy 31,055 51.7
Germany 2,480 - Germany 2,636 - Germany 3,927 8.1
Austria 377 - Austria 120 - Belgium 2,449 6.9
Durum Wheat Soft Wheat Durum
Wheat Soft Wheat Durum Wheat Soft Wheat
9.3 9.2 9.2
May-13May-12May-12
77 7
Switzerland

IPO 2014 Survey on World Pasta IndustryThe World Pasta Industry in Figures 2011 - 2013
Source: IPO 2014 Annual Survey on World Pasta Industry1 -‐ Source: Import/Export figures by Global Trade Information Services, Inc.
Country
Number of Manufacturers (capacity greater than 1 tons/day)
Production
Dry Pasta
-- Durum wheat semolina
-- Soft wheat flour
-- Egg pasta
Fresh pasta
Noodles/ Instant Pasta/ Ready Meals
Total Consumption (in tons)
Dry Pasta
-- Durum wheat semolina
-- Soft wheat flour
-- Egg pasta
Fresh pasta
Noodles/ Instant Pasta/ Ready Meals
Per capita consumption (in Kg)
Dry Pasta
-- Durum wheat semolina
-- Soft wheat flour
-- Egg pasta
Fresh pasta
Noodles/ Instant Pasta/ Ready MealsTotal Population (million hab.)
Export
Total
(2013-First three countries of destination)
Non EU Countries
Total
First three countries of destination
--
--
--
E.U. Member States
Total
--
--
--
Import
Total
(2013-First three countries of destination)
Non EU Countries
Total
--
--
--
E.U. Member States
Total
--
--
--
Raw materials
Wheat (tonnes)
Pasta production
Others (Biscuits, Breads, etc...)
Total
Eggs (tonnes)
Last data update
2011 2012 2013
Volume Value Volume Value Volume Value
(Tonnes) Million Euro (Tonnes) Million Euro (Tonnes) Million Euro
- - 66,000 - 66,000 -
74,000 - 72,991 - 63,986 -
112 0.2 4,431 6.0 5,091 8.7
86 0.1 675 0.9 732 0.8
Ukraine 64 0.1 Ukraine 525 0.6 Ukraine 627 0.7
Croatia 6 0.0 USA 76 0.2 Canada 35 0.1
USA 5 0.0 Canada 54 0.1 USA 27 0.1
26 4.3 3,756 5.0 4,359 7.9
Romania 19 0.0 Romania 1,789 1.6 Romania 2,086 1.8
Slovakia 3 0.0 Slovakia 815 1.0 France 1,096 4.6
Poland 2 0.0 France 434 1.5 Slovakia 684 0.1
13,273 7.5 12,908 10.9 13,939 12.6
349 0.0 33 0 15 0.0
Vietnam 295 0.0 China 15 0 Vietnam 8 0.0
Switzerland 15 0.0 Vietnam 9 0.0 Turkey 5 0.0
Turkey 14 0.0 Brazil 5 0.0 Liechtenstein 2 0.0
12,924 7.4 12,875 10.9 13,924 12.6
Italy 7,273 5.0 Italy 6,923 5.9 Italy 6,519 5.6
Czech Republic 2,927 1.4Czech Republic 2,741 1.5
Czech Republic 3,281 1.9
Germany 823 0.4 France 899 1.3 France 1,082 1.5
Durum Wheat Soft Wheat Durum
Wheat Soft Wheat Durum Wheat Soft Wheat
7.5 7.4 6.4
May-10
-
May-10Sep-12
--
Hungary 1

IPO 2014 Survey on World Pasta IndustryThe World Pasta Industry in Figures 2011 - 2013
Source: IPO 2014 Annual Survey on World Pasta Industry1 -‐ Source: Import/Export figures by Global Trade Information Services, Inc.
Country
Number of Manufacturers (capacity greater than 1 tons/day)
Production
Dry Pasta
-- Durum wheat semolina
-- Soft wheat flour
-- Egg pasta
Fresh pasta
Noodles/ Instant Pasta/ Ready Meals
Total Consumption (in tons)
Dry Pasta
-- Durum wheat semolina
-- Soft wheat flour
-- Egg pasta
Fresh pasta
Noodles/ Instant Pasta/ Ready Meals
Per capita consumption (in Kg)
Dry Pasta
-- Durum wheat semolina
-- Soft wheat flour
-- Egg pasta
Fresh pasta
Noodles/ Instant Pasta/ Ready MealsTotal Population (million hab.)
Export
Total
(2013-First three countries of destination)
Non EU Countries
Total
First three countries of destination
--
--
--
E.U. Member States
Total
--
--
--
Import
Total
(2013-First three countries of destination)
Non EU Countries
Total
--
--
--
E.U. Member States
Total
--
--
--
Raw materials
Wheat (tonnes)
Pasta production
Others (Biscuits, Breads, etc...)
Total
Eggs (tonnes)
Last data update
2011 2012 2013
Volume Value Volume Value Volume Value
(Tonnes) Million Euro (Tonnes) Million Euro (Tonnes) Million Euro
52,600 52,600 52,600
57,747 59,787 68,531
19.96 19.96 19.96
4,489 3.8 6,095 5.5 8,402 8.3
2,271 1.8 3,634 3.3 4,582 4.8
U.S.A. 892 0.8 U.S.A. 1,773 1.9 U.S.A. 2,648 0.1
Moldova 557 0.5 Moldova 523 0.4 Moldova 630 0.5
Mozambique 179 0.1 Australia 221 0.2 Australia 474 0.5
2,218 2.0 2,461 2.2 3,820 3.5
Bulgaria 843 0.6 Bulgaria 917 0.7 Bulgaria 1,165 1.0
Hungary 308 0.3 Italy 396 0.4 Italy 496 0.5
Italy 265 0.3Czecg Republic 210 0.2
Czecg Republic 356 0.3
9,636 10.8 13,283 14.4 24,333 17.0
919 1.0 1,046 1.2 1,794 1.7
Turkey 93 0.0 Ukraine 893 1.1 Ukraine 951 1.2
Ukraine 83 0.0 Turkey 91 0.1 Turkey 640 0.4
China 54 0.0 China 50 0.0 China 110 0.0
8,717 9.8 12,237 13.2 22,539 15.3
Italy 4,301 5.2 Italy 4,923 6.0 Hungary 11,942 3.1
Greece 2,262 2.1 Greece 3,427 3.0 Italy 5,407 6.8
Germany 712 0.7 Germany 1,183 1.3 Germany 1,549 1.9
Durum Wheat Soft Wheat Durum
Wheat Soft Wheat Durum Wheat Soft Wheat
Romania
- -
2.9 3.0
Oct-12 Oct-13
3.5
Oct-14
-

IPO 2014 Survey on World Pasta IndustryThe World Pasta Industry in Figures 2011 - 2013
Source: IPO 2014 Annual Survey on World Pasta Industry1 -‐ Source: Import/Export figures by Global Trade Information Services, Inc.
Country
Number of Manufacturers (capacity greater than 1 tons/day)
Production
Dry Pasta
-- Durum wheat semolina
-- Soft wheat flour
-- Egg pasta
Fresh pasta
Noodles/ Instant Pasta/ Ready Meals
Total Consumption (in tons)
Dry Pasta
-- Durum wheat semolina
-- Soft wheat flour
-- Egg pasta
Fresh pasta
Noodles/ Instant Pasta/ Ready Meals
Per capita consumption (in Kg)
Dry Pasta
-- Durum wheat semolina
-- Soft wheat flour
-- Egg pasta
Fresh pasta
Noodles/ Instant Pasta/ Ready MealsTotal Population (million hab.)
Export
Total
(2013-First three countries of destination)
Non EU Countries
Total
First three countries of destination
--
--
--
E.U. Member States
Total
--
--
--
Import
Total
(2013-First three countries of destination)
Non EU Countries
Total
--
--
--
E.U. Member States
Total
--
--
--
Raw materials
Wheat (tonnes)
Pasta production
Others (Biscuits, Breads, etc...)
Total
Eggs (tonnes)
Last data update
2011 2012 2013
Volume Value Volume Value Volume Value
(Tonnes) Million Euro (Tonnes) Million Euro (Tonnes) Million Euro
283,400 293,000 303,100
166,500 169,600 172,800
10.4 10.6 10.8
117,000 123,400 130,300
115,000 120,000 125,000
2,000 3,400 5,300
200 250 300
Durum Wheat Soft Wheat Durum
Wheat Soft Wheat Durum Wheat Soft Wheat
425 440 455
575 1,000 660 1,100 745 1,200
1,000 1,000 1,100 1,100 1,200 1,200
Tunisia
16.0 16.0
Oct-12 Oct-12 Jul-14
- - -
16.0

IPO 2014 Survey on World Pasta IndustryThe World Pasta Industry in Figures 2011 - 2013
Source: IPO 2014 Annual Survey on World Pasta Industry1 -‐ Source: Import/Export figures by Global Trade Information Services, Inc.
Country
Number of Manufacturers (capacity greater than 1 tons/day)
Production
Dry Pasta
-- Durum wheat semolina
-- Soft wheat flour
-- Egg pasta
Fresh pasta
Noodles/ Instant Pasta/ Ready Meals
Total Consumption (in tons)
Dry Pasta
-- Durum wheat semolina
-- Soft wheat flour
-- Egg pasta
Fresh pasta
Noodles/ Instant Pasta/ Ready Meals
Per capita consumption (in Kg)
Dry Pasta
-- Durum wheat semolina
-- Soft wheat flour
-- Egg pasta
Fresh pasta
Noodles/ Instant Pasta/ Ready MealsTotal Population (million hab.)
Export
Total
(2013-First three countries of destination)
Non EU Countries
Total
First three countries of destination
--
--
--
E.U. Member States
Total
--
--
--
Import
Total
(2013-First three countries of destination)
Non EU Countries
Total
--
--
--
E.U. Member States
Total
--
--
--
Raw materials
Wheat (tonnes)
Pasta production
Others (Biscuits, Breads, etc...)
Total
Eggs (tonnes)
Last data update
2011 2012 2013
Volume Value Volume Value Volume Value
(Tonnes) Million Euro (Tonnes) Million Euro (Tonnes) Million Euro
560,000 346 560,000 346 560,000 346
360,000 - 360,000 - 360,000 -
54,000 28.0 37,565 26.9 85,448 56.3
53,977 28 37,500 25.7 85,302 56.2
Afghanistan 12,861 7.8 Afghanistan 17,963 11.9 Afghanistan 24,133 15.5
Iraq 5,195 3.2 Iraq 4,982 3.8 Iraq 13,745 9.0
Turkmenistan 3,401 2.0 Turkmenistan 3,972 2.6 Turkmenistan 7,062 4.6
23 0.0 65 1.1 146 0.1
Germany 23 0.0 Germany 22 0.0 Bulgaria 58 0.0
- - Italy 22 0.0 Romania 32 0.0
- - Poland 19 1.1 Germany 28 0.0
666 0.2 730 0.3 77 0
590 0.2 711 0.3 32 0
Turkey 386 0.1United Arab Emirates 339 0.1 Turkey 23 0
United Arab Emirates 176 0.1 Turkey 291 0.1 Singapore 9 0.0
Singapore 25 0.0 Thailandia 19 0.0 - -
76 0.0 19 0.0 45 0.0
Italy 45 0.0 Italy 19 0.0 Italy 45 0.0
Poland 31 0.0 - - - -
- - - - - -
Durum Wheat Soft Wheat Durum
Wheat Soft Wheat Durum Wheat Soft Wheat
Iran 1
-
8.5 8.5 8.5
--
Oct-12Oct-12 Oct-12

IPO 2014 Survey on World Pasta IndustryThe World Pasta Industry in Figures 2011 - 2013
Source: IPO 2014 Annual Survey on World Pasta Industry1 -‐ Source: Import/Export figures by Global Trade Information Services, Inc.
Country
Number of Manufacturers (capacity greater than 1 tons/day)
Production
Dry Pasta
-- Durum wheat semolina
-- Soft wheat flour
-- Egg pasta
Fresh pasta
Noodles/ Instant Pasta/ Ready Meals
Total Consumption (in tons)
Dry Pasta
-- Durum wheat semolina
-- Soft wheat flour
-- Egg pasta
Fresh pasta
Noodles/ Instant Pasta/ Ready Meals
Per capita consumption (in Kg)
Dry Pasta
-- Durum wheat semolina
-- Soft wheat flour
-- Egg pasta
Fresh pasta
Noodles/ Instant Pasta/ Ready MealsTotal Population (million hab.)
Export
Total
(2013-First three countries of destination)
Non EU Countries
Total
First three countries of destination
--
--
--
E.U. Member States
Total
--
--
--
Import
Total
(2013-First three countries of destination)
Non EU Countries
Total
--
--
--
E.U. Member States
Total
--
--
--
Raw materials
Wheat (tonnes)
Pasta production
Others (Biscuits, Breads, etc...)
Total
Eggs (tonnes)
Last data update
2011 2012 2013
Volume Value Volume Value Volume Value
(Tonnes) Million Euro (Tonnes) Million Euro (Tonnes) Million Euro
851,830 365.0 1,000,000 400.0 1,202,440 495.0
851,830 - - -
448,309 - 492,977 - 516,107 -
447,500 - 492,142 -
- - - -
- - - -
36 - 35 -
550 - 550 -
260 - 250 -
6.5 6.6
405,983 198.0 509,723 385 690,118 530
386,741 190.0 416,439 228.8 669,845 515
Angola Angola
Benin Benin
Irak Irak
19,242 13.0 23,783 20 20,273 16
Germany Germany
Spain Spain
United Kingdom
United Kingdom
, ,
2,462 4.4 2,700 - 3,385 -
742 1
ChinaUnited Arab Emirates
1,720 3.4
Italy
Germany
Durum Wheat Soft Wheat Durum
Wheat Soft Wheat Durum Wheat Soft Wheat
Turkey
22 22
Oct-13 Apr-14
6.6 6.8
May-12
22
6.5

IPO 2014 Survey on World Pasta IndustryThe World Pasta Industry in Figures 2011 - 2013
Source: IPO 2014 Annual Survey on World Pasta Industry1 -‐ Source: Import/Export figures by Global Trade Information Services, Inc.
Country
Number of Manufacturers (capacity greater than 1 tons/day)
Production
Dry Pasta
-- Durum wheat semolina
-- Soft wheat flour
-- Egg pasta
Fresh pasta
Noodles/ Instant Pasta/ Ready Meals
Total Consumption (in tons)
Dry Pasta
-- Durum wheat semolina
-- Soft wheat flour
-- Egg pasta
Fresh pasta
Noodles/ Instant Pasta/ Ready Meals
Per capita consumption (in Kg)
Dry Pasta
-- Durum wheat semolina
-- Soft wheat flour
-- Egg pasta
Fresh pasta
Noodles/ Instant Pasta/ Ready MealsTotal Population (million hab.)
Export
Total
(2013-First three countries of destination)
Non EU Countries
Total
First three countries of destination
--
--
--
E.U. Member States
Total
--
--
--
Import
Total
(2013-First three countries of destination)
Non EU Countries
Total
--
--
--
E.U. Member States
Total
--
--
--
Raw materials
Wheat (tonnes)
Pasta production
Others (Biscuits, Breads, etc...)
Total
Eggs (tonnes)
Last data update
2011 2012 2013
28 28 28
Volume Value Volume Value Volume Value
(Tonnes) Million Euro (Tonnes) Million Euro (Tonnes) Million Euro
322,089 608.6 327,293 622.2 353,895 -
304,301 537.5 308,499 547.0 333,573 -
178,427 321.2 192,654 346.8 208,313 -
113,434 181.5 103,430 165.5 111,837 -
12,440 34.8 12,415 34.8 13,424 -
12,162 48.7 13,130 52.5 14,197 -
5,625 22.5 5,663 22.7 6,123 -
318,900 602.6 324,052 616.0 343,657
301,288 532.2 305,445 541.6 323,924
176,660 317.9 190,747 343.3 202,287
112,311 179.7 102,406 163.8 108,602
12,317 34.5 12,292 34.4 13,036
12,042 48.2 13,000 52.0 13,786
5,570 22.3 5,607 22.4 5,946
7.4 7.5 7.8
4.4 4.7 4.9
2.8 2.5 2.6
0.3 0.3 0.3
0.3 0.3 0.3
0.1 0.1 0.1
47,395 27.6 19,232 12.4 10,230 10.4
47,383 27.6 19,224 12.4
Chile 27,448 16.5 Angola 13,714 7.2 Angola 5,128 2.4
Angola 17,646 8.3 Chile 3,198 1.9 Chile 1,679 2.5
Paraguay 915 1.0 Paraguay 728 1.0 Paraguay 1,043 1.9
12 0.0 8.0 0.0United Kingdom 5 0.0
United Kingdom 6.0 0.0 Spain 215.0 0.3
Spain 4 0.0 Spain 2.0 0.0 France 66.0 0.1
Italy 3 0.0 - - Italy 13.0 0.0
1,745 1.8 1,273 1.7
725 0.6 368 0.4
China 237 0.1 Uruguay 194 0.3 Uruguay 153 0.2
Korea South 198 0.1 China 110 0.1 Brazil 87 0.2
Uruguay 179 0.2 Korea South 40 0.0 China 87 0.1
1,020 1.2 905 1.3
Italy 998 1.2 Italy 896 1.3 Italy 787 1.0
France 23 0.0 Romania 9 0.0 Romania 54 0.0
- - - -
Durum Wheat Soft Wheat Durum
Wheat Soft Wheat Durum Wheat Soft Wheat
190,747 102,406
293,153
190,747 395,559
12,292
Argentina
Sep-14Jul-13
40.5
Oct-12
7.9 7.9 8.3
41.340.9

IPO 2014 Survey on World Pasta IndustryThe World Pasta Industry in Figures 2011 - 2013
Source: IPO 2014 Annual Survey on World Pasta Industry1 -‐ Source: Import/Export figures by Global Trade Information Services, Inc.
Country
Number of Manufacturers (capacity greater than 1 tons/day)
Production
Dry Pasta
-- Durum wheat semolina
-- Soft wheat flour
-- Egg pasta
Fresh pasta
Noodles/ Instant Pasta/ Ready Meals
Total Consumption (in tons)
Dry Pasta
-- Durum wheat semolina
-- Soft wheat flour
-- Egg pasta
Fresh pasta
Noodles/ Instant Pasta/ Ready Meals
Per capita consumption (in Kg)
Dry Pasta
-- Durum wheat semolina
-- Soft wheat flour
-- Egg pasta
Fresh pasta
Noodles/ Instant Pasta/ Ready MealsTotal Population (million hab.)
Export
Total
(2013-First three countries of destination)
Non EU Countries
Total
First three countries of destination
--
--
--
E.U. Member States
Total
--
--
--
Import
Total
(2013-First three countries of destination)
Non EU Countries
Total
--
--
--
E.U. Member States
Total
--
--
--
Raw materials
Wheat (tonnes)
Pasta production
Others (Biscuits, Breads, etc...)
Total
Eggs (tonnes)
Last data update
2011 2012 2013 1
Volume Value Volume Value Volume Value
(Tonnes) Million Euro (Tonnes) Million Euro (Tonnes) Million Euro
1,195,483 2,381.1 1,191,847 2,423.3 1,204,900 2,224.5
960,894 1,443.4 953,597 1,451.0 966,700 1,351.8
48,045 72.2 47,680 72.6 48,335
912,849 1,371.3 905,918 1,378.5 918,365
- - - -
51,109 209.9 50,465 213.6 51,500 193.4
183,480 727.7 187,785 758.8 186,700 679.3
1,195,483 2381.1 1,191,847 2423.3 1,204,900 2,224.5
960,894 1,443.4 953,597 1,451.0 966,700 1,351.8
48,045 72.2 47,680 72.5 48,335
912,849 1,371.3 905,918 1,378.5 918,365
- - - -
51,109 209.9 50,465 213.6 51,500 193.4
183,480 727.7 187,785 758.7 186,700 679.3
5.0 5.0 4.8
0.3 0.3
4.8 4.7
- -
0.3 0.3 0.3
1.0 1.0 0.9
192,376 193,947 201,032
8,025 9.9 11,343 11.5 19,308 15.2
7,885 9.6 10,989 10.8 19,024 14.6
Venezuela Venezuela 7,779 5.2 Venezuela 16,088 10.2
Chile Chile 779 1.3 Paraguay 720 1.0
Paraguay Paraguay 742 1.0 U.S.A. 490 1.4
140 0.3 354 0.7 284 0.6
Portugal Portugal 307 0.6 Portugal 264 0.6
Hungary Hungary 23 0.0United Kingdom 20 0.0
Ucraina Ucraina 9 0.0
23,085 25.8 25,902 30.0 27,044 27.9
5,737 6.7 7,246 8.5 6,257 5.7
Uruguay Uruguay 2,630 1.9 Uruguay 2,617 2.0
Chile Chile 1,785 3.3 Chile 1,035 1.3
Mexico Mexico 747 0.5 Mexico 961 0.7
17,348 19.1 18,656 21.6 20,787 22.2
Italy Italy 18,581 21.3 Italy 20,333 21.6
France France 83 0.1 Spain 238 0.3
Monaco Monaco 34 0.1 France 158 0.2
Durum Wheat Soft Wheat Durum
WheatSoft
WheatDurum Wheat Soft Wheat
60,056 59,600
1,494,353 1,489,808
9,055,591 8,950,592
10,549,944 10,500,000
40,000 40,000
May-13 Apr-14
140 140
Brazil
6.2 6.0
May-13
150
6.2

IPO 2014 Survey on World Pasta IndustryThe World Pasta Industry in Figures 2011 - 2013
Source: IPO 2014 Annual Survey on World Pasta Industry1 -‐ Source: Import/Export figures by Global Trade Information Services, Inc.
Country
Number of Manufacturers (capacity greater than 1 tons/day)
Production
Dry Pasta
-- Durum wheat semolina
-- Soft wheat flour
-- Egg pasta
Fresh pasta
Noodles/ Instant Pasta/ Ready Meals
Total Consumption (in tons)
Dry Pasta
-- Durum wheat semolina
-- Soft wheat flour
-- Egg pasta
Fresh pasta
Noodles/ Instant Pasta/ Ready Meals
Per capita consumption (in Kg)
Dry Pasta
-- Durum wheat semolina
-- Soft wheat flour
-- Egg pasta
Fresh pasta
Noodles/ Instant Pasta/ Ready MealsTotal Population (million hab.)
Export
Total
(2013-First three countries of destination)
Non EU Countries
Total
First three countries of destination
--
--
--
E.U. Member States
Total
--
--
--
Import
Total
(2013-First three countries of destination)
Non EU Countries
Total
--
--
--
E.U. Member States
Total
--
--
--
Raw materials
Wheat (tonnes)
Pasta production
Others (Biscuits, Breads, etc...)
Total
Eggs (tonnes)
Last data update
2011 2012 1 2013 1
Volume Value Volume Value Volume Value
(Tonnes) Million Euro (Tonnes) Million Euro (Tonnes) Million Euro
126,080 189.0 128,480 203.0 128,480 219.0
125,080 188.0 127,480 201.0 127,480 218.0
96,080 144.0 98,480 155.0 98,480 167.0
20,000 30.0 20,000 32.0 20,000 35.0
9,000 14.0 9,000 14.0 9,000 16.0
1,000 2.0 1,000 2.0 1,000 2.0
145,440 218 146,352 236 146,968 256.0
143,000 215.0 143,180 231.0 143,500 250.0
114,000 171.0 114,000 184.0 114,500 199.0
20,000 30.0 20,000 32.0 19,500 34.0
9,000 14.0 9,180 15.0 9,500 17.0
1,000 2.0 1,586 3.0 1,734 3.0
1,440 2.0 1,586 3.0
8.3 8.2 8.2
6.6 6.6 6.5
1.2 1.2 1.1
0.5 0.5 0.5
0.1 0.1 0.1
0.1 0.1 0.1
17.2 17.4 17.6
- - 9,640 9.0 10,971 9.0
9,640 9.0 10,971 9.0
Peru 3,653 1.7 Peru 4,213 2.5
Brazil 2,001 3.3 Brazil 1,497 1.7
Haiti 1,052 0.6 Haiti 1,765 1.6
- - - -
112,953 24.9 144,201 25.8
104,523 20.2 133,742 21.7
Peru 81,573 12.5 Peru 114,042 14.5
Argentina 11,188 3.5 Argentina 7,118 2.6
Uruguay 5,275 1.3 Uruguay 5,373 1.6
8,430 4.7 10,459 4.1
Italy 8,084 4.7 Italy 7,793 3.5
Spain 900 0.4United Kingdom 875 0.0
Durum Wheat Soft Wheat Durum
Wheat Soft Wheat Durum Wheat Soft Wheat
135,000 140,000 140,000
1,400,000 1,500,000 1,500,000
135,000 1,400,000 140,000 1,500,000 140,000 1,500,000
1,080 1,080 1,080
May-12 May-13 Oct-14
3 3 3
8.4 8.4 8.4
CHILE

IPO 2014 Survey on World Pasta IndustryThe World Pasta Industry in Figures 2011 - 2013
Source: IPO 2014 Annual Survey on World Pasta Industry1 -‐ Source: Import/Export figures by Global Trade Information Services, Inc.
Country
Number of Manufacturers (capacity greater than 1 tons/day)
Production
Dry Pasta
-- Durum wheat semolina
-- Soft wheat flour
-- Egg pasta
Fresh pasta
Noodles/ Instant Pasta/ Ready Meals
Total Consumption (in tons)
Dry Pasta
-- Durum wheat semolina
-- Soft wheat flour
-- Egg pasta
Fresh pasta
Noodles/ Instant Pasta/ Ready Meals
Per capita consumption (in Kg)
Dry Pasta
-- Durum wheat semolina
-- Soft wheat flour
-- Egg pasta
Fresh pasta
Noodles/ Instant Pasta/ Ready MealsTotal Population (million hab.)
Export
Total
(2013-First three countries of destination)
Non EU Countries
Total
First three countries of destination
--
--
--
E.U. Member States
Total
--
--
--
Import
Total
(2013-First three countries of destination)
Non EU Countries
Total
--
--
--
E.U. Member States
Total
--
--
--
Raw materials
Wheat (tonnes)
Pasta production
Others (Biscuits, Breads, etc...)
Total
Eggs (tonnes)
Last data update
2011 2012 2013 1
Volume Value Volume Value Volume Value
(Tonnes) Million Euro (Tonnes) Million Euro (Tonnes) Million Euro
118,647 230.9 118,647 230.9 118,647 230.9
123,676 230.9 123,676 230.9 123,676 230.9
46.0 46.0 46.0
48 0.1 17 0.0 44 0.0
48 0.1 17 0.0 44 0.0
Netherlands Antilles 24 0.1
Netherlands Antilles 14 0.0
Netherlands Antilles 25 0.0
Ecuador 3 0.0 Ecuador 2 0.0 U.S.A. 10 0.0
Peru 20 0.0 Ecuador 8 0.0
- -
5,077 9.4 7,415 15.1 7,546 8.0
4,023 6.3 4,895 8.2 4,702 4.1
Mexico 2,854 3.8 Mexico 3,520 4.7 Mexico 3,517 2.8
Chile 295 0.9 Peru 455 1.6 U.S.A. 295 0.6
U.S.A. 99 0.5 Thailandia 202 0.7 Peru 245 0.2
1,055 3.1 2,520 7.0 2,844 3.9
Italy 1,015 2.9 Italy 2,163 5.9 Italy 1,781 2.9
Romania - - Spain 228 0.4 Turkey 746 0.6
France 31 0.1 France 77 0.4 Poland 197 0.2
Durum Wheat Soft Wheat Durum
Wheat Soft Wheat
May-12 May-13
17
2.6 2.6 2.6
COLOMBIA

IPO 2014 Survey on World Pasta IndustryThe World Pasta Industry in Figures 2011 - 2013
Source: IPO 2014 Annual Survey on World Pasta Industry1 -‐ Source: Import/Export figures by Global Trade Information Services, Inc.
Country
Number of Manufacturers (capacity greater than 1 tons/day)
Production
Dry Pasta
-- Durum wheat semolina
-- Soft wheat flour
-- Egg pasta
Fresh pasta
Noodles/ Instant Pasta/ Ready Meals
Total Consumption (in tons)
Dry Pasta
-- Durum wheat semolina
-- Soft wheat flour
-- Egg pasta
Fresh pasta
Noodles/ Instant Pasta/ Ready Meals
Per capita consumption (in Kg)
Dry Pasta
-- Durum wheat semolina
-- Soft wheat flour
-- Egg pasta
Fresh pasta
Noodles/ Instant Pasta/ Ready MealsTotal Population (million hab.)
Export
Total
(2013-First three countries of destination)
Non EU Countries
Total
First three countries of destination
--
--
--
E.U. Member States
Total
--
--
--
Import
Total
(2013-First three countries of destination)
Non EU Countries
Total
--
--
--
E.U. Member States
Total
--
--
--
Raw materials
Wheat (tonnes)
Pasta production
Others (Biscuits, Breads, etc...)
Total
Eggs (tonnes)
Last data update
2011 2012 2013
Volume Value Volume Value Volume Value
(Tonnes) Million Euro (Tonnes) Million Euro (Tonnes) Million Euro
22,980 - 23,550 - 23,490 -
21,100 21,600 21,500
16,600 15,300 16,300
4,500 6,300 5,200
1,880 1,950 1,990
17,990
4.6 4.7 4.7
8,900 - 9,100 - 9,300 -
8,900 - 9,100 - 9,300 -
2,800 - 3,300 - 3,800 -
Durum Wheat Soft Wheat Durum
Wheat Soft Wheat Durum Wheat Soft Wheat
May-12 May-13 Sep-14
2 2 2
3.7 3.8 3.8
COSTA RICA

IPO 2014 Survey on World Pasta IndustryThe World Pasta Industry in Figures 2011 - 2013
Source: IPO 2014 Annual Survey on World Pasta Industry1 -‐ Source: Import/Export figures by Global Trade Information Services, Inc.
Country
Number of Manufacturers (capacity greater than 1 tons/day)
Production
Dry Pasta
-- Durum wheat semolina
-- Soft wheat flour
-- Egg pasta
Fresh pasta
Noodles/ Instant Pasta/ Ready Meals
Total Consumption (in tons)
Dry Pasta
-- Durum wheat semolina
-- Soft wheat flour
-- Egg pasta
Fresh pasta
Noodles/ Instant Pasta/ Ready Meals
Per capita consumption (in Kg)
Dry Pasta
-- Durum wheat semolina
-- Soft wheat flour
-- Egg pasta
Fresh pasta
Noodles/ Instant Pasta/ Ready MealsTotal Population (million hab.)
Export
Total
(2013-First three countries of destination)
Non EU Countries
Total
First three countries of destination
--
--
--
E.U. Member States
Total
--
--
--
Import
Total
(2013-First three countries of destination)
Non EU Countries
Total
--
--
--
E.U. Member States
Total
--
--
--
Raw materials
Wheat (tonnes)
Pasta production
Others (Biscuits, Breads, etc...)
Total
Eggs (tonnes)
Last data update
2011 2012 2013 1
Volume Value Volume Value Volume Value
(Tonnes) Million Euro (Tonnes) Million Euro (Tonnes) Million Euro
56,000 40.0 56,000 40.0 56,000 40.0
54,800 54,800 54,800
360 0.4 441 0.5 1,781 1.8
334 0.4 403 0.5 1,732 1.7
U.S.A. 269 0.3 U.S.A. 311 0.4 Venezuela 1,245 1.2
Costa Rica 60 0.1 Costa Rica 79 0.1 U.S.A. 330 0.4
Colombia 3 0.0 Chile 7 0.0 Costa Rica 78 0.1
26 0.0 38 0.0 49 0.1
Spain 26 0.0 Spain 37 0.0 Spain 49 0.1
Germany 1 0.0
5,602 4.9 6,264 6.2 5,829 6.1
5,031 4.0 5,386 4.8 5,033 4.6
Peru 4,736 3.6 Peru 5,162 4.4 Peru 4,779 4.3
Chile 221 0.3 Chile 110 0.2 Chile 178 0.2
U.S.A. 49 0.1 U.S.A. 61 0.1 U.S.A. 39 0.1
571 0.9 878 1.4 796 1.5
Italy 519 0.8 Italy 843 1.3 Italy 755 1.4
Spain 52 0.1 Spain 35 0.1 Spain 41 0.1
Durum Wheat Soft Wheat Durum
Wheat Soft Wheat Durum Wheat Soft Wheat
15,000 15,000
40,000 40,000
55,000 55,000
1,000 1,000
3.9 3.9
May-11 May-11 May-11
15 - -
3.9
ECUADOR 1

IPO 2014 Survey on World Pasta IndustryThe World Pasta Industry in Figures 2011 - 2013
Source: IPO 2014 Annual Survey on World Pasta Industry1 -‐ Source: Import/Export figures by Global Trade Information Services, Inc.
Country
Number of Manufacturers (capacity greater than 1 tons/day)
Production
Dry Pasta
-- Durum wheat semolina
-- Soft wheat flour
-- Egg pasta
Fresh pasta
Noodles/ Instant Pasta/ Ready Meals
Total Consumption (in tons)
Dry Pasta
-- Durum wheat semolina
-- Soft wheat flour
-- Egg pasta
Fresh pasta
Noodles/ Instant Pasta/ Ready Meals
Per capita consumption (in Kg)
Dry Pasta
-- Durum wheat semolina
-- Soft wheat flour
-- Egg pasta
Fresh pasta
Noodles/ Instant Pasta/ Ready MealsTotal Population (million hab.)
Export
Total
(2013-First three countries of destination)
Non EU Countries
Total
First three countries of destination
--
--
--
E.U. Member States
Total
--
--
--
Import
Total
(2013-First three countries of destination)
Non EU Countries
Total
--
--
--
E.U. Member States
Total
--
--
--
Raw materials
Wheat (tonnes)
Pasta production
Others (Biscuits, Breads, etc...)
Total
Eggs (tonnes)
Last data update
2011 2012 2013 1
Volume Value Volume Value Volume Value
(Tonnes) Million Euro (Tonnes) Million Euro (Tonnes) Million Euro
44,162 29.2 44,266 32.0 44,266 32.0
41,212 26.6 41,111 29.2 41,111 29.2
2,950 2.6 3,155 2.8 3,155 2.8
44,467 54.9 44,627 55.3 44,627 55.3
41,567 49.9 41,551 50.2 41,551 50.2
2,900 5.0 3,075 5.1 3,075 5.1
2.8 2.8 2.8
0.2 0.2 0.2
14.7 15.0 15.0
44,627 55.3 23,078 16.8
44,492 55.1 23,078 16.8
Guatemala 26,646 33.7 Honduras 11,523 8.3
Honduras 8,961 10.5 El Salvador 6,526 4.3
Salvador 6,188 7.7 Nicaragua 1,976 1.3
10,189 8.3
9,896 8.0
Mexico 5,945 4.2
Costa Rica 2,193 2.2
El Salvador 996 0.7
293 0.3
Italy 293 0.3
Durum Wheat Soft Wheat Durum
Wheat Soft Wheat Durum Wheat Soft Wheat
3.0 3.0 3.0
Oct-13 Sep-14Oct-13
- - -
GUATEMALA

IPO 2014 Survey on World Pasta IndustryThe World Pasta Industry in Figures 2011 - 2013
Source: IPO 2014 Annual Survey on World Pasta Industry1 -‐ Source: Import/Export figures by Global Trade Information Services, Inc.
Country
Number of Manufacturers (capacity greater than 1 tons/day)
Production
Dry Pasta
-- Durum wheat semolina
-- Soft wheat flour
-- Egg pasta
Fresh pasta
Noodles/ Instant Pasta/ Ready Meals
Total Consumption (in tons)
Dry Pasta
-- Durum wheat semolina
-- Soft wheat flour
-- Egg pasta
Fresh pasta
Noodles/ Instant Pasta/ Ready Meals
Per capita consumption (in Kg)
Dry Pasta
-- Durum wheat semolina
-- Soft wheat flour
-- Egg pasta
Fresh pasta
Noodles/ Instant Pasta/ Ready MealsTotal Population (million hab.)
Export
Total
(2013-First three countries of destination)
Non EU Countries
Total
First three countries of destination
--
--
--
E.U. Member States
Total
--
--
--
Import
Total
(2013-First three countries of destination)
Non EU Countries
Total
--
--
--
E.U. Member States
Total
--
--
--
Raw materials
Wheat (tonnes)
Pasta production
Others (Biscuits, Breads, etc...)
Total
Eggs (tonnes)
Last data update
2011 2012 2013 1
Volume Value Volume Value Volume Value
(Tonnes) Million Euro (Tonnes) Million Euro (Tonnes) Million Euro
334,000 - 347,000 - 337,000 -
- - - - 279,876 -
107,656 75,136 54.8 68,406 57.5
107,615 75,079 54.7 68,261 57.4
U.S.A. 93,363 U.S.A. 59,954 43.7 U.S.A. 55,426 47.6
Guatemal 4,738 Guatemala 6,669 4.7 Guatemala 4,351 3.1
Tobaco 2,306 Puerto Rico 2,341 1.8 Puerto Rico 2,083 1.6
41 57 0.1 145 0.1
Spain 38 Spian 36 0.0 Spian 138 0.1
Germany 3 Netherlands 21 0.0 Netherlands 5 0.0
75,937 10.8 10,004 19.6 11,282 22.2
59,596 12.5 5,912 13.1 7,312 16.3
U.S.A. 44,615 11.0 U.S.A. 4,983 11.2 U.S.A. 6,421 14.4
China 6,743 0.6 China 574 0.8 China 540 0.8
Japan 1,840 0.2 Canada 87 0.5 Canada 118 0.6
16,341 5.4 4,092 6.6 3,970 5.9
Italy 14,166 4.4 italy 3,359 5.6 italy 3,352 5.1
Spain 1,220 0.6 France 422 0.5 France 361 0.4
France 881 0.4 Spain 286 0.4 Spain 213 0.3
Durum Wheat Soft Wheat Durum
Wheat Soft Wheat Durum Wheat Soft Wheat
80%
20%
2.7 3.0 2.3
Oct-12 Oct-12 Sep-14
- -
MEXICO
-

IPO 2014 Survey on World Pasta IndustryThe World Pasta Industry in Figures 2011 - 2013
Source: IPO 2014 Annual Survey on World Pasta Industry1 -‐ Source: Import/Export figures by Global Trade Information Services, Inc.
Country
Number of Manufacturers (capacity greater than 1 tons/day)
Production
Dry Pasta
-- Durum wheat semolina
-- Soft wheat flour
-- Egg pasta
Fresh pasta
Noodles/ Instant Pasta/ Ready Meals
Total Consumption (in tons)
Dry Pasta
-- Durum wheat semolina
-- Soft wheat flour
-- Egg pasta
Fresh pasta
Noodles/ Instant Pasta/ Ready Meals
Per capita consumption (in Kg)
Dry Pasta
-- Durum wheat semolina
-- Soft wheat flour
-- Egg pasta
Fresh pasta
Noodles/ Instant Pasta/ Ready MealsTotal Population (million hab.)
Export
Total
(2013-First three countries of destination)
Non EU Countries
Total
First three countries of destination
--
--
--
E.U. Member States
Total
--
--
--
Import
Total
(2013-First three countries of destination)
Non EU Countries
Total
--
--
--
E.U. Member States
Total
--
--
--
Raw materials
Wheat (tonnes)
Pasta production
Others (Biscuits, Breads, etc...)
Total
Eggs (tonnes)
Last data update
2011 2012 2013
Volume Value Volume Value Volume Value
(Tonnes) Million Euro (Tonnes) Million Euro (Tonnes) Million Euro
297,162 169.0 285,598 285.6 278,890 389.0
285,598 285.6 278,890 389.0
57,120 57.0 58,567 82.0
228,478 228.5 220,323 307.0
243,000 136.0 242,990 367.0 244,600 370.0
242,990 367.0 244,600 370.0
48,598 73.0 51,366 78.0
194,392 294.0 193,234 292.0
1.6 1.8
6.5 6.4
29.0 30.0 30.0
55,904 34.7 12,000 39,435 26.8
55,866 34.7 12,000 39,412 23.8
Chile 28,838 19.4 Haiti 11,700 7.3 Chile 18,467 11.0
Haiti 15,344 8.0 Chile 9,800 7.2 Haiti 8,982 4.0
Ecuador 4,724 3.5 Ecuador 5,000 4.3 Ecuador 3,877 3.0
38 0.1 1,000 0.2 23 3.0
Spain 28 0.0 Spain 200 0.2 Spain 22 3.0
Netherlands 8 0.0 Switzerland 0 0.0
Italy 0 0.0
1,742 1.8 - - 5,144 -
726 0.5 - - 4,636 -
China 193 0.1 Chile 4,192
U.S.A. 58 0.1 China 254
Argentina 23 0.0 U.S.A. 91
1,017 1.3 - - 508 -
Italy 998 1.3 Italy 499
Switzeland 2 0.0 Spain 9
Spain 17 0.0
Durum Wheat Soft Wheat Durum
Wheat Soft Wheat Durum Wheat Soft Wheat
104,268 1,327,028 115,199 1,580,442 149,791 1,645,417
8.4 8.1 8.2
May-12
13 13 13
May-13 Jun-14
PERU

IPO 2014 Survey on World Pasta IndustryThe World Pasta Industry in Figures 2011 - 2013
Source: IPO 2014 Annual Survey on World Pasta Industry1 -‐ Source: Import/Export figures by Global Trade Information Services, Inc.
Country
Number of Manufacturers (capacity greater than 1 tons/day)
Production
Dry Pasta
-- Durum wheat semolina
-- Soft wheat flour
-- Egg pasta
Fresh pasta
Noodles/ Instant Pasta/ Ready Meals
Total Consumption (in tons)
Dry Pasta
-- Durum wheat semolina
-- Soft wheat flour
-- Egg pasta
Fresh pasta
Noodles/ Instant Pasta/ Ready Meals
Per capita consumption (in Kg)
Dry Pasta
-- Durum wheat semolina
-- Soft wheat flour
-- Egg pasta
Fresh pasta
Noodles/ Instant Pasta/ Ready MealsTotal Population (million hab.)
Export
Total
(2013-First three countries of destination)
Non EU Countries
Total
First three countries of destination
--
--
--
E.U. Member States
Total
--
--
--
Import
Total
(2013-First three countries of destination)
Non EU Countries
Total
--
--
--
E.U. Member States
Total
--
--
--
Raw materials
Wheat (tonnes)
Pasta production
Others (Biscuits, Breads, etc...)
Total
Eggs (tonnes)
Last data update
2011 2012 2013
Volume Value Volume Value Volume Value
(Tonnes) Million Euro (Tonnes) Million Euro (Tonnes) Million Euro
- - - - - -
- - - - - -
3,591 2.6 6,108 4.7 4,668 3.9
3,578 2.6 6,108 4.7 4,668 3.9
Brazil 1,733 1.2 Brazil 2,650 1.9 Brazil 2,573 2.0
Chile 1,311 0.9 Chile 1,536 1.1 Chile 1,651 1.4
Venezuela 215 0.2 Venezuela 1,435 1.2 Argentina 152 0.2
13 0.0 - - - -
Spain 13 0.0
1,451 1.7 1,423 2.2 1,405 2.1
827 1.0 651 1.5 612 1.2
Argentina 557 0.8 Argentina 551 1.0 Argentina 470 0.9
Mexico 210 0.1 China 52 0.1 China 47 0.1
China 44 0.0 Mexico 20 0.0 Thailand 32 0.1
625 0.7 772 1.0 793 0.1
Italy 625 0.7 Italy 772 1.0 Italy 793 0.1
Durum Wheat Soft Wheat Durum
Wheat Soft Wheat Durum Wheat Soft Wheat
7.5 7.5 7.5
- -
Oct-12 Oct-12 Oct-12
URUGUAY 1
-

IPO 2014 Survey on World Pasta IndustryThe World Pasta Industry in Figures 2011 - 2013
Source: IPO 2014 Annual Survey on World Pasta Industry1 -‐ Source: Import/Export figures by Global Trade Information Services, Inc.
Country
Number of Manufacturers (capacity greater than 1 tons/day)
Production
Dry Pasta
-- Durum wheat semolina
-- Soft wheat flour
-- Egg pasta
Fresh pasta
Noodles/ Instant Pasta/ Ready Meals
Total Consumption (in tons)
Dry Pasta
-- Durum wheat semolina
-- Soft wheat flour
-- Egg pasta
Fresh pasta
Noodles/ Instant Pasta/ Ready Meals
Per capita consumption (in Kg)
Dry Pasta
-- Durum wheat semolina
-- Soft wheat flour
-- Egg pasta
Fresh pasta
Noodles/ Instant Pasta/ Ready MealsTotal Population (million hab.)
Export
Total
(2013-First three countries of destination)
Non EU Countries
Total
First three countries of destination
--
--
--
E.U. Member States
Total
--
--
--
Import
Total
(2013-First three countries of destination)
Non EU Countries
Total
--
--
--
E.U. Member States
Total
--
--
--
Raw materials
Wheat (tonnes)
Pasta production
Others (Biscuits, Breads, etc...)
Total
Eggs (tonnes)
Last data update
2011 2012 2013 1
Volume Value Volume Value Volume Value
(Tonnes) Million Euro (Tonnes) Million Euro (Tonnes) Million Euro
2,000,000 - 2,000,000 - 2,000,000 -
2,700,000 - 2,700,000 - 2,700,000 -
127,789 139.4 133,049 167.5 138,211 164.6
126,993 138.3 131,960 166.1 136,839 162.5
Canada 87,292 91.5 Canada 90,757 110.5 Canada 93,986 105.6
Japan 23,145 21.6 Japan 24,020 26.3 Japan 22,680 22.7
Mexico 5,695 10.4 Mexico 5,454 10.7 Mexico 7,058 13.8
796 1.1 1,089 1.4 1,372 2.1
United Kingdom 347 0.5United kingdom 416 0.6 Belgium 529 0.5
Belgium 232 0.2 Belgium 390 0.4United kingdom 475 1.0
Netherlands 107 0.3 Netherlands 102 0.2 Italy 222 0.3
337,852 422.3 360,337 490.5 358,851 486.3
197,525 264.2 207,856 301.1 208,354 299.6
Mexico 57,225 34.2 Mexico 59,470 39.5 Canada 54,487 116.4
Canada 49,495 113.7 Canada 51,157 122.5 Mexico 53,763 42.8
China 36,411 34.8 China 37,361 43.7 China 36,397 44.1
140,327 158.1 152,481 189.5 150,497 186.7
Italy 134,895 150.8 Italy 145,633 180.7 Italy 142,046 175.0
Germany 1,416 2.9 Greece 1,533 1.4 Romania 2,921 3.4
Greece 1,247 1.2 Germany 1,517 2.7 Germany 1,774 3.2
Durum Wheat Soft Wheat Durum Wheat Soft Wheat Durum Wheat Soft Wheat
2,970,000 57300000 2,970,000 57300000 2,970,000 57300000
2,970,000 57,300,000 2,970,000 57,300,000 2,970,000 57,300,000
4,800,000 4,800,000 4,800,000
8.8 8.8 8.8
Jun-10 Jun-10 Jun-10
168
U.S.A. 1
- 168

IPO 2014 Survey on World Pasta IndustryThe World Pasta Industry in Figures 2011 - 2013
Source: IPO 2014 Annual Survey on World Pasta Industry1 -‐ Source: Import/Export figures by Global Trade Information Services, Inc.
Country
Number of Manufacturers (capacity greater than 1 tons/day)
Production
Dry Pasta
-- Durum wheat semolina
-- Soft wheat flour
-- Egg pasta
Fresh pasta
Noodles/ Instant Pasta/ Ready Meals
Total Consumption (in tons)
Dry Pasta
-- Durum wheat semolina
-- Soft wheat flour
-- Egg pasta
Fresh pasta
Noodles/ Instant Pasta/ Ready Meals
Per capita consumption (in Kg)
Dry Pasta
-- Durum wheat semolina
-- Soft wheat flour
-- Egg pasta
Fresh pasta
Noodles/ Instant Pasta/ Ready MealsTotal Population (million hab.)
Export
Total
(2013-First three countries of destination)
Non EU Countries
Total
First three countries of destination
--
--
--
E.U. Member States
Total
--
--
--
Import
Total
(2013-First three countries of destination)
Non EU Countries
Total
--
--
--
E.U. Member States
Total
--
--
--
Raw materials
Wheat (tonnes)
Pasta production
Others (Biscuits, Breads, etc...)
Total
Eggs (tonnes)
Last data update
2011 2012 2013
Volume Value Volume Value Volume Value
(Tonnes) Million Euro (Tonnes) Million Euro (Tonnes) Million Euro
341,554 310.0 372,515 535.0 329,540 936.0
364,017 - 399,507 - 366,625 1,300.0
- - - - - -
22,463 22.6 26,992 30.4 37,085 42.5
Turkey - - Turkey 3,727 3.7 Turkey 10,268 10.4
Italy 12,114 11.5 Italy 2,278 2.6 Italy 9,726 10.9
Spain 29 0.0 Spain 108 0.1 Spain 56 0.1
12,143 11.6 6,113 6.5 20,050 21.5
Brazil 2,798 2.4 Brazil 7,195 6.8 Brazil 12,226 12.3
Rep. Dominicana 6,542 7.9
Rep. Dominicana 11,020 13.8
Rep. Dominicana 6,020 7.4
China 711 0.4 China 761 0.5 China 576 0.8
Durum Wheat Soft Wheat Durum
Wheat Soft Wheat Durum Wheat Soft Wheat
370,000 390,000 348,000
370,000 390,000 348,000
12.3 13.4 12.2
Sep-13 Oct-14Jun-12
12 12 12
VENEZUELA

Interna'onal Pasta Organisa'on Secretariat General c/o Associazione delle Industrie del Dolce e della Pasta Italiane Viale del Poggio Fiorito 61 00144 Roma Tel. +39 06 8091071 Fax +39 06 8073186 [email protected] www.internaIonalpasta.org