internal quality control in clinical laboratories hematology(2)
TRANSCRIPT
11/2/2015 Nazar Ahmed Mohamed Abd-
Alla(Sangoor) 1

c
11/2/2015 Nazar Ahmed Mohamed Abd-
Alla(Sangoor) 2

Internal Quality control
in Hematoogy
Laboratoreis
11/2/2015 Nazar Ahmed Mohamed Abd-
Alla(Sangoor) 3
NAZAR AHMED MOHAMED ABD-ALLA
BSC - OMDURMAN AHLIA
HIGH DOPLOMA DGREE - ELZAEM EL-AZHARY
FORMER HEAD OF HEMATOLOGY & BLOOD BANK
MINISTRY OF HEALTH – LABORATORY ADMINISTRATION
KHARTOUM STATE
MARKETING MANAGER-LAB EQP –DIVISION
ALGAM COMPANY FOR DRUGS & CHEMICAL LTD

Topics
11/2/2015 Nazar Ahmed Mohamed Abd-
Alla(Sangoor) 4
Quality definition.
Quality Activity.
Type of error in clinical Hematology laboratory.
Specimens and Requests .
Method selection, and Reagents storage condition .
instruments and equipment calibration.
SOPs.
Use of calibrators and control material .

Topics
11/2/2015 Nazar Ahmed Mohamed Abd-
Alla(Sangoor) 5
Implementation of quality programs
Interpretation of internal quality results.
Corrective action.
Turn around time.
Documentation.

Whats Quality
quality is defined as the totality of features and characteristics
of a product or service that bear on its ability to satisfy stated
or implied needs.
Medical laboratories must provide a high quality service by
producing accurate, precise, relevant and comprehensive data
that can be applied to the medical management of patients.
tests requested must be appropriate to the medical problem,
must be analytically correctly performed and their results
interpreted correctly.
11/2/2015 Nazar Ahmed Mohamed Abd-
Alla(Sangoor) 6

Quality assurance: Part of quality management focused on
providing confidence that quality requirements will be
fulfilled . witch contain many activity.
Quality control: Part of quality management focused on fulfilling
quality requirements.
Quality management system: Management system to direct and
control an organization with regard to quality.
11/2/2015 Nazar Ahmed Mohamed Abd-
Alla(Sangoor) 7

Appropriateness of tests can only be obtained by a dialogue
between the clinician and the medical lab-specialist.
Correct analytical results are based on:
(i) quality management within the laboratory.
(ii) the quality of industrially prepared reagents (kits) and
instruments .
(iii) quality management of the pre-analytical phase outside
the laboratory along with analytical & post-analytical phase.
A bad system, a wrong sampling or a kit with poor
performance can never produce a reliable result, even in a
laboratory with the best quality management system.
11/2/2015 Nazar Ahmed Mohamed Abd-
Alla(Sangoor) 8

principles aspects of making
reliable analytical measurements:
1. Analytical measurements should be made to satisfy an
agreed requirement.
2. Analytical measurements should be made using methods
and equipment that have been tested to ensure they are fit
for purpose.
3. Staff making analytical measurements should be both
qualified and competent to undertake the task.
11/2/2015 Nazar Ahmed Mohamed Abd-
Alla(Sangoor) 9

principles aspects of making
reliable analytical measurements:
4. There should be a regular independent assessment of the
technical performance of a laboratory.
5. Analytical measurements made in one location should be
consistent with those elsewhere.
6. Organizations making analytical measurements should
have well defined quality control and quality assurance
procedures.
11/2/2015 Nazar Ahmed Mohamed Abd-
Alla(Sangoor) 10

Quality Assurance
Quality assurance is a comprehensive and systematic process
that strives to ensure reliable patient results.
This process includes: Every level of laboratory operation.
*Phlebotomy services.
*competency testing.
*error analysis.
*standard protocols.
*quality control.
*turnaround time .
11/2/2015 Nazar Ahmed Mohamed Abd-
Alla(Sangoor) 11

objective of quality assurance
1. Lab result must be timely reliable and valid to be used
correctly.
2. Focus on laboratory staff training and competency.
3. Give grantee of the reliability of the test result
11/2/2015 Nazar Ahmed Mohamed Abd-
Alla(Sangoor) 12

Quality assurance requirements 1. Performance of internal quality control (IQC).
This is based on the repeat testing of a control sample in each
assay run and then comparison of the assay result with its
expected result.
It is performed in real time and is used to pass or fail a series of
results.
2. Performance of external quality assessment (EQA)
this based on a sample that is sent to a group of laboratories.
The relative position of the laboratory in relation to the others is
calculated retrospectively.
In combination, IQC and EQA can monitor both precision and
accuracy.
11/2/2015
Nazar Ahmed Mohamed Abd-Alla(Sangoor) 13

*QA activities encompass all of the non-analytic activities,
those activities that are not part of the clinical testing
process.
*The laboratory organizes it activities to provide the best
possible health care to the patient.
Nazar Ahmed Mohamed Abd-Alla(Sangoor)
QA activities
11/2/2015 14

* A. management and monitoring personnel, B. using quality materials (reagents instruments, supplies, etc.), C. using established procedures and established statistics (a procedure manual), D. specimen collection, identification, transport, accession, and handling prior to testing, E. reporting results, F. fee charges for tests performed, G. using corrective actions to obtain desired results, H. monitoring patient satisfaction.
Nazar Ahmed Mohamed Abd-Alla(Sangoor)
Examples of QA Activities
11/2/2015 15

*The Clinical laboratory is concerned about quality and
accuracy of the tests that are reported to primary care
givers.
*The laboratory monitors where these errors can appear
that will affect the accuracy of test results.
Nazar Ahmed Mohamed Abd-Alla(Sangoor) 11/2/2015 16

NON-CONFORMING RESULTS
In laboratory practice many non-conforming results may
appear.
These results are divided in two major categories:
• Errors: Non-conforming results with “statistical meaning”.
This category includes all the “wrong” laboratory measures
due to non-human action.
• Mistakes: Non-conforming results with “no statistical
meaning”. This category contains all the human errors e.g.
mixing up samples.
Another classification of errors and mistakes is based on the
time and the stage they appeared in laboratory practice.
11/2/2015 Nazar Ahmed Mohamed Abd-
Alla(Sangoor) 17

*These errors can occur prior to the test analysis and if they manifest, they are called preanalytical errors or variables.
*If the error occurs during the testing process, then it become an analytical error.
*If the error appears after the test is performed and reported, then it is known as a post-analytical error.
*The preanalytical error occurs before the test is performed. This error source can occur at the beginning of test ordering and filling out the requisition.
Nazar Ahmed Mohamed Abd-Alla(Sangoor)
Type Of Error
11/2/2015 18

*type of error based on the time
*Pre-Analytical Error:(specimen collection and transport)
01- duplicate or missing requisitions
02- tests omitted from the requisition 03- incorrect ordering of tests 04- patient identification error 05- incorrect blood collection 06- specimen transport error 07- specimen handling/processing in the lab *Analytical errors: (specimen processing in the lab)
occur during the testing process.
01- deteriorated or wrong reagents 02- any instrument malfunction 03- laboratorial error 04- incorrect recording of test results
Nazar Ahmed Mohamed Abd-Alla(Sangoor) 11/2/2015 19
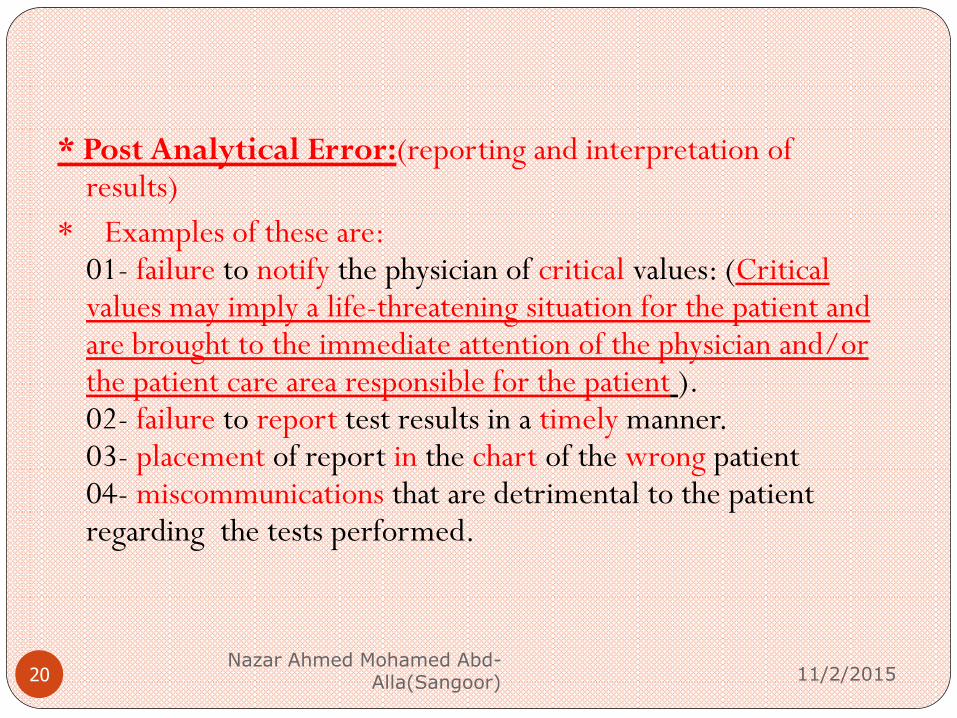
* Post Analytical Error:(reporting and interpretation of results)
* Examples of these are: 01- failure to notify the physician of critical values: (Critical values may imply a life-threatening situation for the patient and are brought to the immediate attention of the physician and/or the patient care area responsible for the patient ). 02- failure to report test results in a timely manner. 03- placement of report in the chart of the wrong patient 04- miscommunications that are detrimental to the patient regarding the tests performed.
Nazar Ahmed Mohamed Abd-Alla(Sangoor) 11/2/2015 20

Pre-Analytical Error
Specimens and Requests
11/2/2015 Nazar Ahmed Mohamed Abd-
Alla(Sangoor) 21
1- Request forms:
Request forms should include:
Organization name and full address and telephone ,fax number & E.mail.
Referring doctor name and telephone number.
Patient details.(age,sex,race,resedance)
Specimen details .(type,preservatie,time of collection)
Clinical Remarks .(spleenomegaly,hepatomegly,fever,join pain)
Treatment history (any type of medication e.g asprine,sulfanomide;ect).
Tests ordering.(CBC,Urine general,lipid profile ………….. Ect)
Signture of cliniciant order the test.

2- Primary sample collection:
• 1- Patient Preparation:
*Avoiding stress and exercise witch increase
Cell concentration, coagulation factors(v111),tissue
plasminogen activator(T-PA) with increase fibrinolytic
activity).
*Avoid prolonged use of tourniquet. and patient
position (lying or standing to avoid
haemoconcentration) also position of the arm witch
cause fluctuation of about 5-10% in the blood count .
11/2/2015 Nazar Ahmed Mohamed Abd-Alla(Sangoor)
22

2-Containers selection and type of anticoagulant:
e.g the most suitable one for haematology is K₂EDTA in concentration of 1.2-2.2mg/ml witch cause less cellular
change(recommended by ICSH).
K₃EDTA also can used but it cause significant shrinking of the
red call with decrease of about 1-2%in the MCV.
11/2/2015
Nazar Ahmed Mohamed Abd-Alla(Sangoor)
23

11/2/2015 Nazar Ahmed Mohamed Abd-
Alla(Sangoor) 24
*other Example is the amount of sodium citrate when the amount of citrate is high and the amount of blood is low the excess sodium citrate consume ca²+ present in the reagent.
& this prolong the PT&APTT. the opposite case lead to microclot as a matter this Couse shortness of APTT
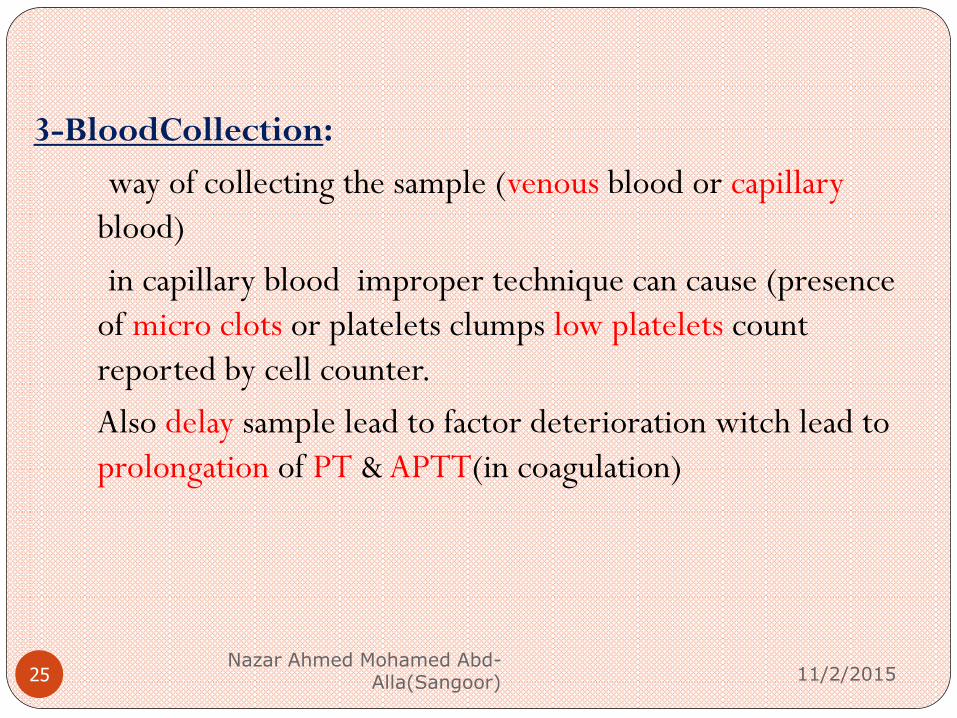
3-BloodCollection:
way of collecting the sample (venous blood or capillary
blood)
in capillary blood improper technique can cause (presence
of micro clots or platelets clumps low platelets count
reported by cell counter.
Also delay sample lead to factor deterioration witch lead to
prolongation of PT & APTT(in coagulation)
11/2/2015 Nazar Ahmed Mohamed Abd-
Alla(Sangoor) 25

11/2/2015 Nazar Ahmed Mohamed Abd-
Alla(Sangoor) 26
•*Avoid dilution and or contamination from flushing solution while drawing the blood from indwelling line or catheter.
•*(Contamination with heparin couse prolongation of APTT (in coagulation)) * When intravenous solution is being administrate in patient arm the blood drawing should be from the opposite arm

The recommended order of draw is:
• Blood culture tube
• Coagulation tube
• Serum tube with or without clot activator, and with or without
gel separator
• Heparin tube, with or without gel separator
• EDTA tube
11/2/2015
Nazar Ahmed Mohamed Abd-Alla(Sangoor)
27

6-Specimen storage and Transportation:
*for sample transport : (tray should have protective cover ,
suitable environment require preventing deterioration of the
sample , person carrying the sample should be follow the
universal safety regulation.
11/2/2015 Nazar Ahmed Mohamed Abd-
Alla(Sangoor) 28

11/2/2015 Nazar Ahmed Mohamed Abd-
Alla(Sangoor) 29
: mislabeling of sample is very serious labeling of the sample-4error witch can result as:( collecting from wrong patient , subsequent specimen mix –up , transcription error)
Plasma Preparation:-5 spaciely in case of coagulation the preparation of the plasma is very critical.
•The accepted goal of centrifugation of coagulation specimens is to produce platelet-poor plasma with a platelet count < 10×10⁹ /L< 10×10³/L1.
•* This may be accomplished by centrifuging specimens at 1500 g for 15 minutes or longer at room temperature.

Specimens and Requests
11/2/2015 Nazar Ahmed Mohamed Abd-
Alla(Sangoor) 30
3- Samples acceptance criteria:
Complete request form.
Patient identification.
Suitable container selected.
Sufficient amount of blood collected.
Sample labeled properly.
Sample prepared properly.
Sample separated and store properly.

Specimens and Requests
11/2/2015 Nazar Ahmed Mohamed Abd-
Alla(Sangoor) 31
4- Samples Rejection Criteria:
Incomplete request form.
Rung Patient identification.
Unsuitable container selected.
Unlabelled or incorrectly labeled sample.
Haemolysed sample.
Sample changes due to :
concentration changes
compostion changes.
bacterail changes.
and enzymatic changes.

Analytical errors
METHOD VALIDATION
11/2/2015 Nazar Ahmed Mohamed Abd-Alla(Sangoor) 32
Validation refers to establishing documented evidence that a process or
system, when operating within established parameters, can perform
effectively and reproducibly to produce a result meeting its
predetermined specifications and quality attributes.
“Method validation” is a term used for the suite of procedures to which
an analytical method is subjected.
to provide objective evidence that the method, if used in the manner
specified, will produce results that conform to the statement of the
method validation parameters.

ISO Definition
1. The process of establishing the performance characteristics
and limitations of a method and the identification of the
influences which may change these characteristics and to
what extent.
* Which analytes can it determine in which matrices in the
presence of which interferences? Within these conditions
what levels of precision and accuracy can be achieved?
2. The process of verifying that a method is fit for purpose,
i.e. for use for solving a particular analytical problem.
11/2/2015 Nazar Ahmed Mohamed Abd-
Alla(Sangoor) 33

Continue: Method validation
Method validation involves the evaluation of the fitness of
analytical methods for their purpose.
The process of proving that an analytical method is
acceptable for its intended purpose.
the concept of fitness for purpose, a method is validated for
a particular use under particular circumstances. If those
circumstances vary, then the method would need to be re-
validated at least for the differences.
11/2/2015 Nazar Ahmed Mohamed Abd-
Alla(Sangoor) 34

METHOD VALIDATION
11/2/2015 Nazar Ahmed Mohamed Abd-Alla(Sangoor) 35
Error assessment is what method validation is about.
However, before getting to the assessment of errors, you
have to first select the method to be validated.
Method selection is a different process that needs to be
understood in relation to the validation process that will
follow.

Importance of Method Validation Practices
11/2/2015 Nazar Ahmed Mohamed Abd-Alla(Sangoor) 36
Laboratory regulations require that method performance for any new method be "verified" prior to reporting patient test results.
Precision and accuracy are specifically identified, along with analytical sensitivity, analytical specificity, reportable range, reference values, and any other applicable characteristic.
Types of Errors to be assessed by
method validation
11/2/2015 Nazar Ahmed Mohamed Abd-Alla(Sangoor) 37
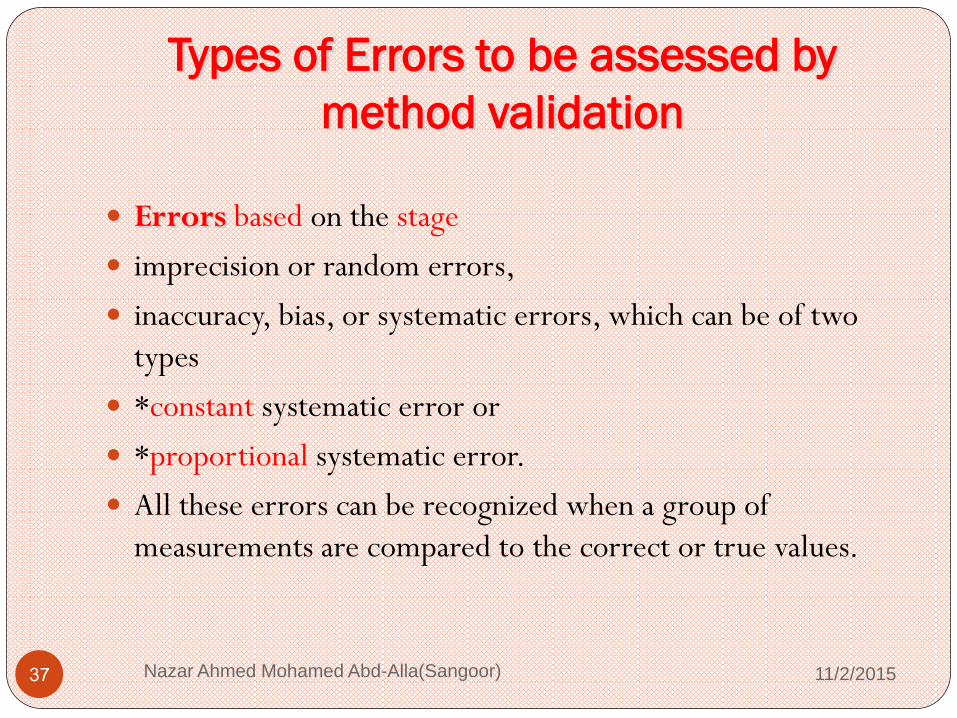
Errors based on the stage
imprecision or random errors,
inaccuracy, bias, or systematic errors, which can be of two
types
*constant systematic error or
*proportional systematic error.
All these errors can be recognized when a group of
measurements are compared to the correct or true values.

Verification
Verification refers to the ability to make sure that the test
method you are using conforms to manufacturer
specifications.
Much of the work of method validation is done by
international organizations that publish standard methods. The
reason such methods appear to be written in a kind of legalese
is that there must be no doubt as to what the method is and
how it should be implemented.
* When accuracy and precision data are published from
interlaboratory trials, there is some confidence that the
method has undergone extreme scrutiny and testing.
11/2/2015 Nazar Ahmed Mohamed Abd-
Alla(Sangoor) 38

Verification
A laboratory that uses a method for the first time should spend
some time in going through the analysis with standard materials
so that when used with field samples, the method will yield
satisfactory results.
This is verification and must be done to an appropriate level
before any method is used. By its nature, (verification comes
under the heading of Single Laboratory Validation).
11/2/2015 Nazar Ahmed Mohamed Abd-
Alla(Sangoor) 39

Method performance parameters assessed
in a method validation study
Identity: Measurement correctly applies to the stated measurand.
Selectivity Specificity: Determination of the extent of the effects
of interfering substances and the ability of the method to measure
the measurand; analysis in different matrices covered by the scope
of the validation.
Limit of detection: Minimum value of the measurand at which the
presence of the analyte can be determined with a given probability
of a false negative, and in the absence of the analyte, at a given
probability of a false positive.
[Limit of determination] Minimum value that can be obtained
with a specified measurement uncertainty
11/2/2015 Nazar Ahmed Mohamed Abd-
Alla(Sangoor) 40

Method performance parameters assessed
in a method validation study
Calibration [linearity] Model parameters [sensitivity] :Adequacy
of the calibration model; parameters with uncertainties.
Calibration range [linear range] Range of values of the
measurand in which the validation holds
Bias and recovery [accuracy] :Demonstration of the absence of
significant systematic error after corrections have been made for
bias and/or recovery
11/2/2015 Nazar Ahmed Mohamed Abd-
Alla(Sangoor) 41

Method performance parameters assessed
in a method validation study
Robustness or ruggedness: Ability of method to remain
unaffected by small variations in method parameters (some
authors make the distinction bebetween the property
robustness and a ruggedness test in which deliberate changes
are made in a method to assess the robustness)
11/2/2015 Nazar Ahmed Mohamed Abd-
Alla(Sangoor) 42

Method Selection
11/2/2015 Nazar Ahmed Mohamed Abd-
Alla(Sangoor) 43
1. General Characteristics:
Made in ,Expire date, Package Content, Accessories, Package size ,Stability after open, and Reagent storage considerations.
2. Application Characteristics:
Specimen type, Sample volume, Turnaround Time, Stability of reaction product, Cost-per-test, Filter used, and Safety considerations
3. Methodology Characteristics:
Type of Reaction, Reaction Principle, Measurement reaction, Temperature, and Time period of measurement.

Experiments for estimating analytical errors
11/2/2015 Nazar Ahmed Mohamed Abd-Alla(Sangoor) 44

METHOD COMPARISSION FOR HBG
ESTIMATION BETWEEN TOW DIFFERENT
INSTRUMENT
11/2/2015 Nazar Ahmed Mohamed Abd-
Alla(Sangoor) 45
0
2
4
6
8
10
12
14
16
18
0 2 4 6 8 10 12 14 16 18 20
HBG
HBG

METHOD COMPARISSION FOR HBG ESTIMATION
BETWEEN TOW DIFFERENT INSTRUMENT
11/2/2015 Nazar Ahmed Mohamed Abd-
Alla(Sangoor) 46
0
2
4
6
8
10
12
14
16
18
20
1 2 3 4 5 6 7 8 9 10 11 12 13 14 15 16 17 18 19 20 21 22 23 24 25
medonic HBG
mindrays HBG

METHOD COMPARISSION FOR HBG ESTIMATION
BETWEEN TOW DIFFERENT INSTRUMENT
11/2/2015 Nazar Ahmed Mohamed Abd-
Alla(Sangoor) 47
0
2
4
6
8
10
12
14
16
18
20
1 2 3 4 5 6 7 8 9 10 11 12 13 14 15 16 17 18 19 20 21 22 23 24 25
medonic HBG
mindrays HBG

Micropipettes Calibration
11/2/2015 Nazar Ahmed Mohamed Abd-
Alla(Sangoor) 48
Gravimetric method (Distilled water weighing method) (Recommended method)
Work Requirement:
1. Calibration tools
2. Double distilled water.
3. New compatible tip
4. Analytical electronic balance(3-5 digits)
5. Temperature controlled atmosphere
6. Small plastic beaker.
Checking Micropipettes Calibration
11/2/2015 Nazar Ahmed Mohamed Abd-
Alla(Sangoor) 49
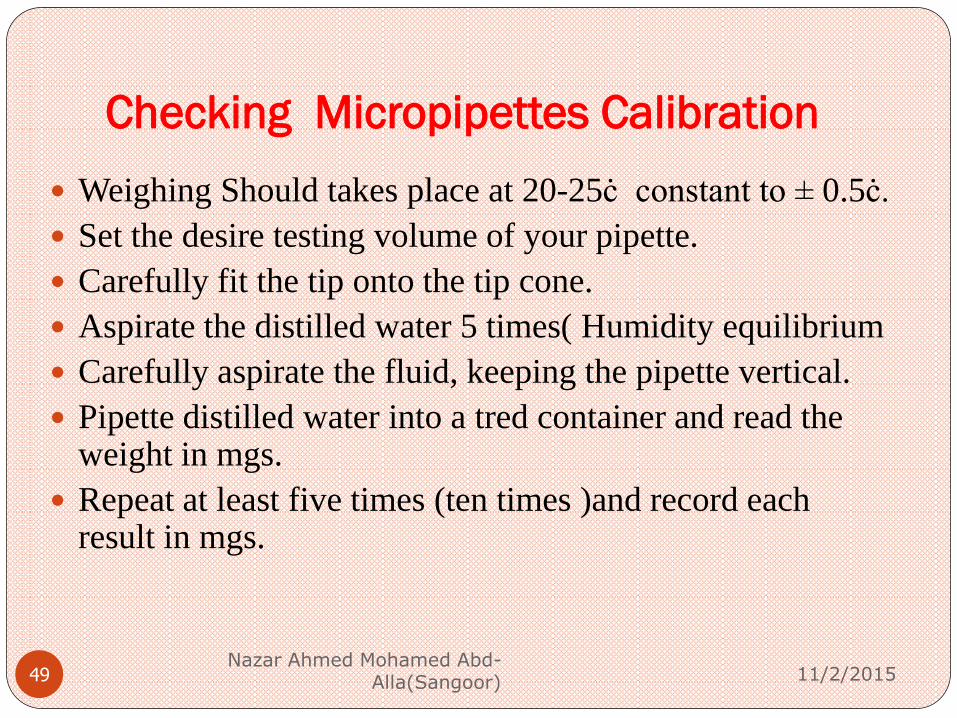
Weighing Should takes place at 20-25ċ constant to ± 0.5ċ.
Set the desire testing volume of your pipette.
Carefully fit the tip onto the tip cone.
Aspirate the distilled water 5 times( Humidity equilibrium
Carefully aspirate the fluid, keeping the pipette vertical.
Pipette distilled water into a tred container and read the weight in mgs.
Repeat at least five times (ten times )and record each result in mgs.

Checking Micropipettes Calibration
11/2/2015 Nazar Ahmed Mohamed Abd-
Alla(Sangoor) 50
Convert the recoded weight to volume (V1) either
by divide the weight of the water by its density ( at
20ċ : 0.9982 ) or by multiply the weight by the Z
correction factor (= 1.002899 µl/mg at 20Ċ ).
Calculate the mean volume (V1)
Calculate the standard d deviation SD.
Calculate the Coefficient of Variation.
Calculate the Inaccuracy and Imprecision .
Calculate the F max value.

11/2/2015 Nazar Ahmed Mohamed Abd-
Alla(Sangoor) 51

Standard Operating Procedures
11/2/2015 Nazar Ahmed Mohamed Abd-
Alla(Sangoor) 52
SOPs are written , up to date instructions and information
which cover in details how to perform individual tests to
insure the correct use , availability , reliability , timeliness,
and reporting of blood tests and correct interpretation of the
test result

*Quality control (QC) encompasses quality assurance as it focuses on analytical activities that are associated with the testing process. QC consists of: A. running control samples with patient samples, B. using established statistical methods to determine reliability of test procedures and test results, C. monitoring instrument and laboratorial performance.
Nazar Ahmed Mohamed Abd-Alla(Sangoor)
Quality control
11/2/2015 53

Quantitative QC Materials
11/2/2015 Nazar Ahmed Mohamed Abd-
Alla(Sangoor) 54
Calibrator: a solution which has a known amount of analyte weighed in or has a value determined by repetitive testing using a reference or definitive test method
Control: material or preparation used to monitor the stability of the test system within predetermined limits

Sources for Control Materials
11/2/2015 Nazar Ahmed Mohamed Abd-
Alla(Sangoor) 55
Commercial product.
Diagnostic samples (qualitative QC).
“Homemade” or “In-house”.
Obtained from:
Another laboratory .
EQA provider.

11/2/2015 Nazar Ahmed Mohamed Abd-
Alla(Sangoor) 56
Parallel Testing.-Validation of new controls
*Whenever possible, new lots of control material must be assayed in parallel alongside the current in use lot. *This is to enable the calculation of laboratory QC ranges and to demonstrate that the QC material is performing as expected.

11/2/2015 Nazar Ahmed Mohamed Abd-
Alla(Sangoor) 57
Controls for Quantitative Assays:
a. In order to validate new controls, the new lot of controls will be run in parallel with the old lot of controls 2-3 times a day for 5-10 days, to give a minimum of 20 values to enable the calculation of laboratory specific QC ranges. The mean and QC ranges for the new lot of controls will be reviewed and signed off by the laboratory supervisor or director before being put into use.

11/2/2015 Nazar Ahmed Mohamed Abd-
Alla(Sangoor) 58
b. For hematology the new lot of controls should be
run in parallel with the old lot of controls to give a
minimum of 10 values over a period 5 days if possible.
The mean and ranges for the new lot of controls will
be reviewed and signed off by the laboratory
supervisor or director before being put into use.

11/2/2015 Nazar Ahmed Mohamed Abd-
Alla(Sangoor) 59
Controls for Qualitative Assays: . 2
Each new lot of QC for qualitative assays must be run and give an expected response. The lot of controls will
be reviewed and signed off by the laboratory
supervisor or director before being put into use.

11/2/2015 Nazar Ahmed Mohamed Abd-
Alla(Sangoor) 60
Types of Control Materials
Assayed mean calculated by the manufacturer must verify in the laboratory
Unassayed less expensive must perform data analysis
“Homemade” or “In-house” pooled sera collected in the laboratory characterized preserved in small quantities for daily use


Levey-Jennings Chart
11/2/2015 Nazar Ahmed Mohamed Abd-
Alla(Sangoor) 62q211q`
o A graphical method for displaying control results and
evaluating whether a procedure is in-control or out-of-control
o Control values are plotted versus time
o Lines are drawn from point to point to accent any trends,
shifts, or random excursions
Levey-Jennings Chart
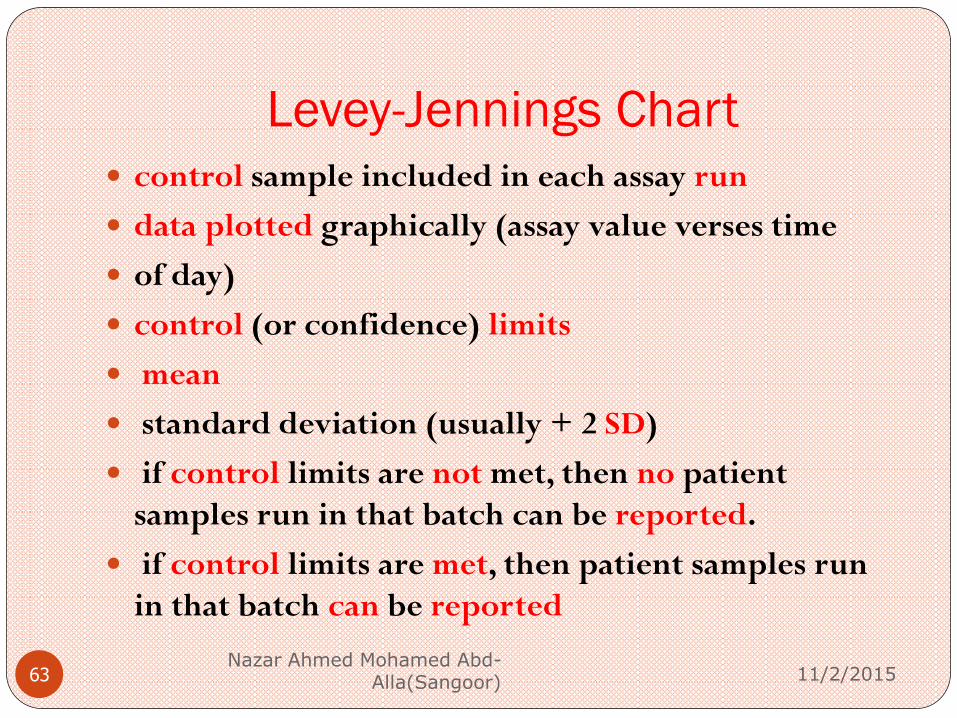
control sample included in each assay run
data plotted graphically (assay value verses time
of day)
control (or confidence) limits
mean
standard deviation (usually + 2 SD)
if control limits are not met, then no patient
samples run in that batch can be reported.
if control limits are met, then patient samples run
in that batch can be reported
11/2/2015 Nazar Ahmed Mohamed Abd-
Alla(Sangoor) 63

QC changes detectable with Levey-
Jennings plots
Drift: control value moves progressively in one
direction from the mean for at least 3 days e.g
deterioration of reagent or control
Dispersion :increase in random errors e.g
inconsistency in technique
Shift: sudden problem develops e.g instrument
malfunction or technique change
11/2/2015 Nazar Ahmed Mohamed Abd-
Alla(Sangoor) 64

Findings Over Time
11/2/2015 Nazar Ahmed Mohamed Abd-
Alla(Sangoor) 65
Ideally should have control values clustered about the mean
(+/-2 SD) with little variation in the upward or downward
direction
Imprecision = large amount of scatter about the mean.
Usually caused by errors in technique
Inaccuracy = may see as a trend or a shift, usually caused by
change in the testing process
Random error = no pattern. Usually poor technique,
malfunctioning equipment

Levey-Jennings Chart - Record and Evaluate the Control Values
11/2/2015 Nazar Ahmed Mohamed Abd-
Alla(Sangoor) 66
80
85
90
95
100
105
110
115
1 2 3 4 5 6 7 8 9 10 11 12 13 14 15 16 17 18 19 20 21 22 23 24
Mean
Day
+1SD
+2SD
+3SD
-1SD
-2SD
-3SD

What are the "Westgard rules”
11/2/2015 Nazar Ahmed Mohamed Abd-
Alla(Sangoor) 67
They are different combination of rules depending on the number
of control being used, the total allowable error, and your work
environment.
rules That are used as conjunction with each other to provide a
high level of errors detection, while reducing the incidence of
false rejection.

Typical rules combination
11/2/2015 Nazar Ahmed Mohamed Abd-
Alla(Sangoor) 68
For control run in multiples of 2 “ typical chemistry”
13s / 22s / R4s / 41s / 10 x
For control run in multiples of 3“ typical
haematology,coagulation, and immunoassays”.
13s / 2 of 32s / R4s / 31s / 12 x

Westgard Rules
(Generally used where 2 levels of control
material are analyzed per run)
11/2/2015 Nazar Ahmed Mohamed Abd-
Alla(Sangoor) 69
12S rule
13S rule
22S rule
R4S rule
41S rule
10X rule

Westgard – 12S Rule
11/2/2015 Nazar Ahmed Mohamed Abd-
Alla(Sangoor) 70
“warning rule”
One of two control results falls outside
±2SD
Alerts tech to possible problems
Not cause for rejecting a run
Must then evaluate the 13S rule

12S Rule = A warning to trigger careful inspection of
the control data
11/2/2015 Nazar Ahmed Mohamed Abd-
Alla(Sangoor) 71
1 2 3 4 5 6 7 8 9 10 11 12 13 14 15 16 17 18 19 20 21 22 23 24
Mean
Day
+1SD
+2SD
+3SD
-1SD
-2SD
-3SD
12S rule
violation

Westgard – 13S Rule
11/2/2015 Nazar Ahmed Mohamed Abd-
Alla(Sangoor) 72
If either of the two control results
falls outside of ±3SD, rule is
violated
Run must be rejected
If 13S not violated, check 22S

13S Rule = Reject the run when a single control
measurement exceeds the +3SD or -3SD control limit
11/2/2015 Nazar Ahmed Mohamed Abd-
Alla(Sangoor) 73
1 2 3 4 5 6 7 8 9 10 11 12 13 14 15 16 17 18 19 20 21 22 23 24
Mean
Day
+1SD
+2SD
+3SD
-1SD
-2SD
-3SD
13S rule
violation

Westgard – 22S Rule
11/2/2015 Nazar Ahmed Mohamed Abd-
Alla(Sangoor) 74
2 consecutive control values for the same level fall outside
of ±2SD in the same direction, or
Both controls in the same run exceed ±2SD
Patient results cannot be reported
Requires corrective action

22S Rule = Reject the run when 2 consecutive control
measurements exceed the same
+2SD or -2SD control limit
11/2/2015 Nazar Ahmed Mohamed Abd-
Alla(Sangoor) 75
1 2 3 4 5 6 7 8 9 10 11 12 13 14 15 16 17 18 19 20 21 22 23 24
Mean
Day
+1SD
+2SD
+3SD
-1SD
-2SD
-3SD
22S rule
violation

Westgard – R4S Rule
11/2/2015 Nazar Ahmed Mohamed Abd-
Alla(Sangoor) 76
One control exceeds the mean by –2SD, and the other
control exceeds the mean by +2SD
The range between the two results will therefore exceed 4
SD
Random error has occurred, test run must be rejected

R4S Rule = Reject the run when 1 control
measurement exceed the +2SD and the other exceeds
the -2SD control limit
11/2/2015 Nazar Ahmed Mohamed Abd-
Alla(Sangoor) 77
1 2 3 4 5 6 7 8 9 10 11 12 13 14 15 16 17 18 19 20 21 22 23 24
Mean
Day
+1SD
+2SD
+3SD
-1SD
-2SD
-3SD
R4S rule
violation

Westgard – 41S Rule
11/2/2015 Nazar Ahmed Mohamed Abd-
Alla(Sangoor) 78
o Requires control data from previous runs
o Four consecutive QC results for one level of control are
outside ±1SD, or
o Both levels of control have consecutive results that are outside
±1SD
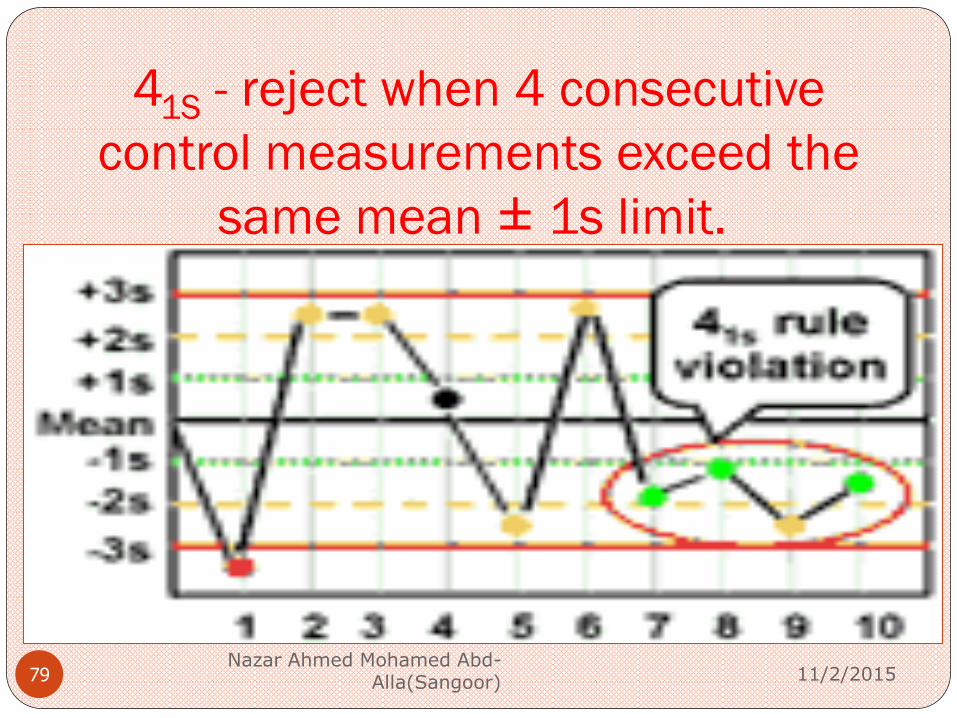
41S - reject when 4 consecutive
control measurements exceed the
same mean ± 1s limit.
11/2/2015 Nazar Ahmed Mohamed Abd-
Alla(Sangoor) 79

Westgard – 10X Rule
11/2/2015 Nazar Ahmed Mohamed Abd-
Alla(Sangoor) 80
Requires control data from previous runs
Ten consecutive QC results for one level of control are on
one side of the mean, or
Both levels of control have five consecutive results that are on
the same side of the mean
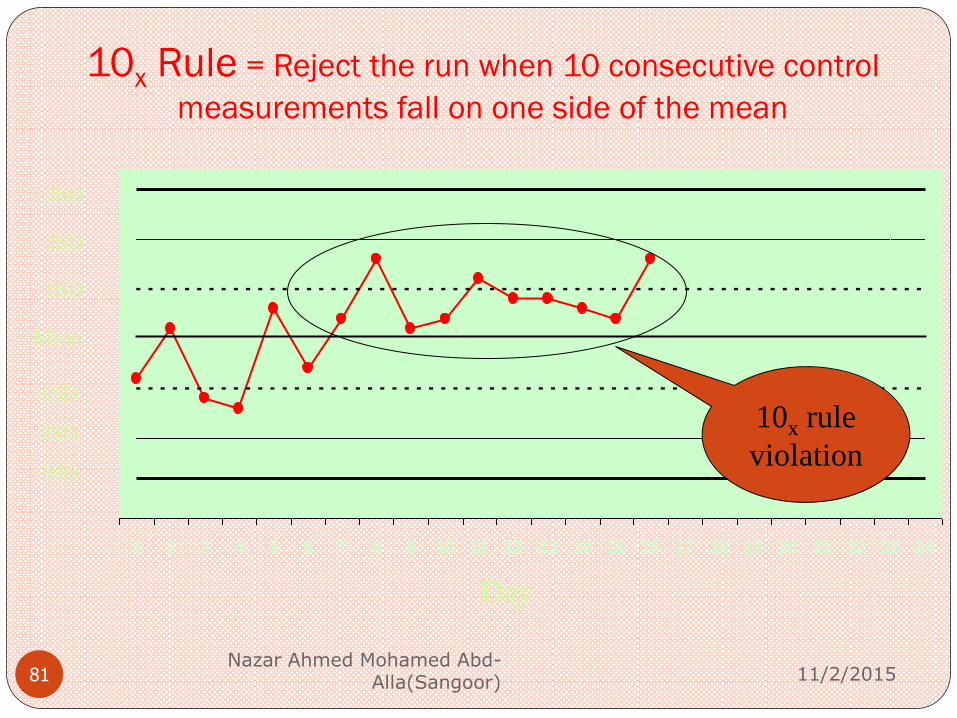
10x Rule = Reject the run when 10 consecutive control
measurements fall on one side of the mean
11/2/2015 Nazar Ahmed Mohamed Abd-
Alla(Sangoor) 81
1 2 3 4 5 6 7 8 9 10 11 12 13 14 15 16 17 18 19 20 21 22 23 24
Mean
Day
+1SD
+2SD
+3SD
-1SD
-2SD
-3SD
10x rule
violation

Moving Averages (Bull’s method)
large laboratories (built into blood analysers) assumes the
population sampled each day remains constant
therefore the calculated indices (MCV, MCH and MCHC)
remain stable
determine mean indice values for each batch of 20 patients,
plot on control chart
any change: instrument or technical fault
11/2/2015 Nazar Ahmed Mohamed Abd-
Alla(Sangoor) 82

Moving Averages (Bull’s method)
For the interpretation of Bull’s charts two rules have been
proposed
13%. Bull’s moving average exceeds the limit ± 3%.
32% . The mean value of three successive Bulls’ moving
averages exceeds the limit ± 2%.
11/2/2015 Nazar Ahmed Mohamed Abd-
Alla(Sangoor) 83

Moving Averages
MCV = Hct
RCC
MCH = Hb
RCC
MCHC = Hb
Hct
Changes in the moving
averages graphs indicate
where the problem
might be in the system.
eg. If the light source
for Hb is becoming
weak, then the
calculated MCH and
MCHC values will fall
11/2/2015 Nazar Ahmed Mohamed Abd-
Alla(Sangoor) 84

Moving averages
CAUSE MCV MCH MCHC
LowHb no change low low
High Hb no chang high high
Low RCC high high no change
High RCC low low no change
Low Hct low no change high
High Hct high no change low
11/2/2015 Nazar Ahmed Mohamed Abd-
Alla(Sangoor) 85

Duplicate tests on patient samples
tests precision
will not detect incorrect calibration
(accuracy)
smaller laboratories
METHOD
test 10 samples
repeat the tests
calculate the difference between pairs of results
and derive a standard deviation
SD should always be < 2SD
11/2/2015 Nazar Ahmed Mohamed Abd-
Alla(Sangoor) 86

Check tests on patient samples
monitors day-to-day precision (small lab)
detects deterioration within apparatus and
reagents
METHOD
» select 3-5 normals in the afternoon, record and
average values (WCC, RCC, Hb). Store at 4oC.
» re-assay same samples next morning
» tests should agree within 2SD
Must ensure there has been no change in samples
11/2/2015 Nazar Ahmed Mohamed Abd-
Alla(Sangoor) 87

Delta check method
Delta check is the difference between the current value of one person and
the previous one.
Delta check = Current value – Previous value
Delta check% = (Current value – Previous value) 100/Current
value .
Delta check detect random errors using previous values of
individual patient.
11/2/2015 Nazar Ahmed Mohamed Abd-
Alla(Sangoor) 88
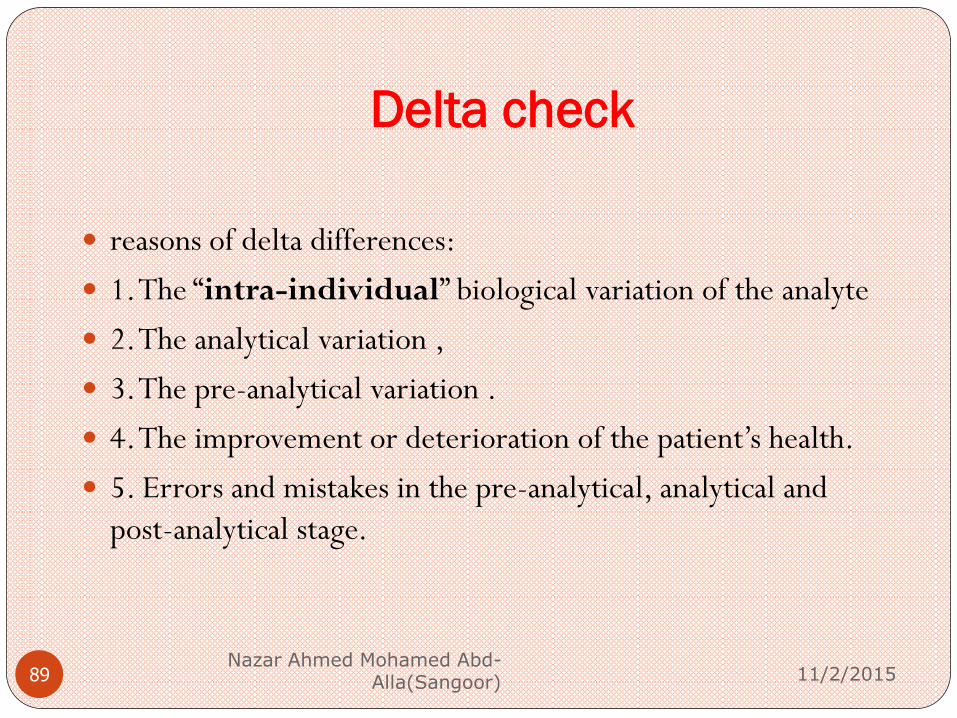
Delta check
reasons of delta differences:
1. The “intra-individual” biological variation of the analyte
2. The analytical variation ,
3. The pre-analytical variation .
4. The improvement or deterioration of the patient’s health.
5. Errors and mistakes in the pre-analytical, analytical and
post-analytical stage.
11/2/2015 Nazar Ahmed Mohamed Abd-
Alla(Sangoor) 89

Corrective action
11/2/2015 Nazar Ahmed Mohamed
Abd-Alla(Sangoor) 90
Errors assessment and management:
Change Old Habits - Recognize Problems.
Bad habit Repeat the control .
Inspect the control charts or rules violated to determine type of error.
Relate the type of error to potential causes.
Consider factors in common on multitest systems
Relate causes to recent changes
Verify the solution and document the remedy

POST ANALYTICAL 1- Written of the report in satnder format :
2- Delta check :the blood count parameters should not differ from
recent test in the previous 2-3 weeks by more than a certain amount.
assuming that the patient clinical condition has not altered
significantly.
-For HBG & RBC 10%.
-For WBC 20-25%.
-For Platelets 50%.
3-Alert the clinician the critical values:
HBG ˂ 6 , Platelets ˂ 1000cell/cumm ,INR ˃ 2 ,APTT ratio ˃ 2
Peripheral blood picture: presence of malaria & or blast cells
11/2/2015 Nazar Ahmed Mohamed Abd-
Alla(Sangoor) 91

4- Turn around Times (TATs):
11/2/2015 Nazar Ahmed Mohamed Abd-
Alla(Sangoor) 92
Laboratory test turnaround times (TATs) In contrast to laboratorians, the majority of clinicians defined a TAT start time as test ordering, and a TAT ending time as result reporting.
Timely reporting of patient tests can increase efficiency of care and improve customer satisfaction.
In study done 2008 found that postanalytical phase accounted
for 64-88% of total tumround time, the pre-analytical phase
for 7-17%, and the analytical phase for 2-29%.

11/2/2015 Nazar Ahmed Mohamed Abd-
Alla(Sangoor) 93

Sample post analytical
Sample retention:
If needs to repeat the examination.
In case of requested other infestigatione.
Sample diposale: the sample dispose according to
specification.
11/2/2015 Nazar Ahmed Mohamed Abd-
Alla(Sangoor) 94
Documentations

Definitions
11/2/2015 Nazar Ahmed Mohamed Abd-
Alla(Sangoor) 96
*Forms: Blank form design to special work to be fill by data at time of use.
*Records: worksheets, forms, charts, labels, Used to capture information, activities, or results when performing a procedure
*Documents: written policies, process descriptions, procedures, and forms Used to communicate information
May be paper or electronic

Documents and Records • Document control policy
– Creation, review, and modifying documents and records and forms
• Procedures, processes, and policies
– Format,
– Approval process
– Flowcharts
• Records retention and disposition
– How long to retain records
– How to dispose of records
11/2/2015 Nazar Ahmed Mohamed Abd-
Alla(Sangoor) 97

External quality control (EQC)
External quality control or external assessment scheme
(EQAS) or proficiency testing program (PT):
refer to the process of controlling the accuracy of an analytical
method by interlaboratory comparisons.
11/2/2015 Nazar Ahmed Mohamed Abd-
Alla(Sangoor) 98

BASIC IDEA OF EQAS
1. The EQAS coordinator prepares and sends to the
participants of the scheme one or two samples from the same
pool.
2. The samples are assayed by the laboratories using the same
equipment and reagents as they do in routine for the patients’
determinations.
3. The EQAS coordinator gathers all the results and it groups
them (peer groups) according the laboratories analytical
methods, analyzers or any other criteria.
11/2/2015 Nazar Ahmed Mohamed Abd-
Alla(Sangoor) 99

BASIC IDEA OF EQAS
4. The EQAS coordinator calculates the target value
(consensus mean) and its total variation (expressed as
standard deviation) of the laboratories results.
5. If any of the laboratories has values outside of the control
limits (target value ± allowable variation) then this laboratory
is considered “out of control”.
6. The “out of control” laboratories have to correct their
analytical procedures.
11/2/2015 Nazar Ahmed Mohamed Abd-
Alla(Sangoor) 100

EQAS has its own charts and statistics.
One of the most important statistics is the “Standard
Deviation Index” (SDI).
SDI shows the distance of the laboratory results from the
consensus mean. It quantifies the inaccuracy of the analytical
method.
It is similar to Z-score (equation ) and it is calculated by the
formula:
SDI = laboratory result -Mean value of peer group
Strandard deviation of peer group
11/2/2015 Nazar Ahmed Mohamed Abd-
Alla(Sangoor) 101

Four rules are usually employed for SDI evaluation
1- 2/51SDI. Two from five successive control limits exceed
1 SDI. It is a warning rule.
2- X1.5 SDI . The mean value of five SDI values exceeds the
limits ±1.5 SDI. It reveals a lasting systematic error.
3-13SDI. One value exceeds the limits ±3 SDI.
4- R4SDI. The range (R) between the lower and higher SDI
values is over ±4 SDI.
11/2/2015 Nazar Ahmed Mohamed Abd-
Alla(Sangoor) 102

Precision Index and Coefficient of Variation
Ratio (CVR) External quality assessment schemes quite often use two
different statistics for the measurement of precision, the
Precision Index (PI) and the Coefficient of Variation Ratio
(CVR).
PI = Standard deviation of laboratory
Strandard deviation of peer group
The control limits of PI are < 2.
CVR = CV of laboratory /month
CV of peer group/ month
The combined SDI/CVR chart has the ability to evaluate the
total analyte’s performance(precision and accuracy).
11/2/2015
Nazar Ahmed Mohamed Abd-Alla(Sangoor) 103

ANY QUESTION?

SUMMARY
11/2/2015 Nazar Ahmed Mohamed Abd-
Alla(Sangoor) 105
Pateint preparation, and good specimen collection,
preparation , handling, and storage of specimen.
Clinical Laboratory instruments daily, weekly, and monthly
maintenance and calibration done regular.
Micropipettes recalibration takes place monthly .
Good clinical method selected, and Reagents storage
condition verified by monitoring of refrigerators
temperature.

SUMMARY
11/2/2015 Nazar Ahmed Mohamed Abd-
Alla(Sangoor) 106
SOPs written, approved ,and followed carefully, then Sops critical point check list used daily.
MORE than one levels of control sera at least should used in all batches with patient samples.
Results of control sera register in quality book and blotted in levey Jennings chart.
Westgard rules used as guidance for acceptability or rejection of patient results applied.
Errors assessment and management takes place, and corrective action documented.
Turn a round time to all investigation verify monthly.
Documentation (to all lab activities)

11/2/2015 Nazar Ahmed Mohamed Abd-
Alla(Sangoor) 107