internal gravity waves in the thermosphere during low and
TRANSCRIPT

Internal gravity waves in the thermosphere during lowand high solar activity: Simulation study
Erdal Yiğit1,2 and Alexander S. Medvedev3
Received 17 November 2009; revised 15 March 2010; accepted 6 April 2010; published 4 August 2010.
[1] Propagation of internal gravity waves (GWs) from the lower atmosphere into theupper thermosphere, and their dynamical and thermal effects have been studied under lowand high solar activity approximated by the F10.7 parameter. It has been done by usinga nonlinear spectral parameterization in systematic offline calculations with typical wind andtemperature distributions from the HWM and MSISE‐90 models, and with interactivesimulations using the University College London Coupled Middle Atmosphere‐Thermosphere‐2 (CMAT2) general circulation model (GCM) under solstice conditions.The estimates have been performed for relatively slow harmonics with horizontal phasevelocities less than 100 m s−1, which are not affected by reflection and/or ducting.GW drag and wave‐induced heating/cooling are shown to be smaller below ∼170 km at highsolar activity, and larger above. The maxima of GW momentum deposition occur muchhigher in the upper thermosphere, but their peaks are half as strong, 120 vs 240 m s−1 day−1
in the winter hemisphere when the insolation is large. Instead of strong net cooling in theupper thermosphere, GWs produce a weak heating at high solar activity created by fastharmonics less affected by dissipation. Molecular viscosity increases with solar activity atfixed pressure levels, but seen in Cartesian altitude grids it can either increase or decrease inthe lower thermosphere, depending on the height. Therefore, in pressure coordinates, inwhich most GCMs operate, the influence of larger temperatures can be viewed as acompetition between the enhanced dissipation and vertical expansion of the atmosphere.
Citation: Yiğit, E., and A. S. Medvedev (2010), Internal gravity waves in the thermosphere during low and high solar activity:Simulation study, J. Geophys. Res., 115, A00G02, doi:10.1029/2009JA015106.
1. Introduction
[2] Gravity waves (GWs) generated in the lower atmo-sphere represent an important source of energy and momen-tum in themesosphere and lower thermosphere (MLT). Higherin the thermosphere and ionosphere (TI), GWs are almostcontinuously present. They often manifest themselves astraveling ionospheric disturbances (TIDs), which are excitedby auroral sources at high‐latitudes, have fast horizontalvelocities and large horizontal scales, and can propagate thou-sands of kilometers equatorward [Francis, 1975; Richmond,1978]. Meanwhile, there is growing observational evidencethat GWs of tropospheric origin are capable of penetratinginto and perturbing the upper thermosphere significantly[Oliver et al., 1997; Djuth et al., 2004; Livneh et al., 2007;
Klausner et al., 2009]. Some observational studies haverelated GW signatures in the TI to meteorological events inthe lower atmosphere [Hocke and Tsuda, 2001; Bishop et al.,2006]. Thermospheric variability associated with the geo-magnetic and solar activities alter the propagation of internalGWs. As a result, a strong relationship between the GWactivity in the F2 layer and the geomagnetic and solar con-ditions has been found [Klausner et al., 2009]. This paperaddresses the issue of how variations of the solar radiationflux, approximated by the variation of the F10.7 parameter,affect GWs propagating from the lower atmosphere to theupper thermosphere, and what response these waves producein the thermosphere above the turbopause.[3] Unlike in the middle atmosphere, propagation of GWs
in the TI is strongly influenced by dissipation. The latter ismainly due to molecular viscosity and heat conduction, but“ion friction” caused by the interaction of the ionized atmo-sphere with the neutral flow is also a significant source ofwave dissipation. Changes in the solar radiation absorptiondo not affect the dynamics of wave propagation directly.Instead, they modify the thermospheric temperature andwinds, and thus, alter the density, static stability, dissipation,and refractive properties associated with the Doppler shift bythe mean wind. Propagation of GWs in the dissipative ther-mosphere as well as their possible effects in the TI have been
1Center for Space Environment Modeling, Department of Atmosphere,Oceanic and Space Sciences, University of Michigan, Ann Arbor, Michigan,USA.
2Atmospheric Physics Laboratory, Department of Physics andAstronomy, University College London, London, UK.
3Max Planck Institute for Solar System Research, Katlenburg‐Lindau,Germany.
Copyright 2010 by the American Geophysical Union.0148‐0227/10/2009JA015106
JOURNAL OF GEOPHYSICAL RESEARCH, VOL. 115, A00G02, doi:10.1029/2009JA015106, 2010
A00G02 1 of 16

studied theoretically and numerically. However, insights intothe links between the changes in the thermosphere driven bythe solar radiation and GW responses remain very limited.[4] Characteristics of GW propagation in hot versus cold
thermospheres was studied to some extent in the work byHickey [1986, 1987]. Vadas and Fritts [2006], Vadas [2007],and Fritts and Vadas [2008] used a ray tracing model basedon the full viscous dispersion relation [Vadas and Fritts,2005] to calculate the propagation of individual harmonicsand a coherent spectrum of GWs excited in the troposphereby deep convective sources. In their sensitivity study at highsolar activity with several model profiles of temperature andmolecular viscosity, they found: (1) reduced atmospheric sta-bility and dissipation enhance wave propagation; (2) reflectionincreases for harmonics with shorter horizontal scales, andcompetes with the enhanced propagation. These findings arein good agreement with conclusions of earlier studies [Francis,1973; Richmond, 1978; Cole and Hickey, 1981], and areapplicable to increased thermospheric temperatures duringactive solar and/or daytime conditions.[5] In this paper, we make a step further from sensitivity
estimates for individual harmonics to assessing gross effectsof low and high solar activity on GW spectra, and of thedynamical and thermal response of the mean circulation inthe TI produced by the vertically propagating waves. This isdone within the framework of fully interactive simulationswith the Coupled Middle Atmosphere‐Thermosphere‐2(CMAT2) model employing our recently developed spectralnonlinear GW scheme suitable for thermosphere generalcirculation models (GCMs) [Yiğit et al., 2008]. This param-eterization tracks the vertical propagation of multiple GWharmonics from their source regions in the lower atmosphereto the top of the model domain in the upper thermosphere. Itaccounts for the refraction of waves by the mean wind andtemperature, nonlinear self‐interactions, dissipation due tomolecular and eddy viscosity and thermal conduction, ionfriction, and breaking. It has been shown that accounting forwave dissipation properly in a GW parameterization gen-erates a considerable body forcing in the simulated TI. Inparticular, dynamical effects of GWs emanating from thetroposphere are not only non‐negligible above the turbo-pause, but are comparable to those of ion drag up to at least180–200 km [Yiğit et al., 2009]. Thermal effects of dis-sipating GWs result mainly in an effective cooling (up to100 to 180 K day−1 around 200 km) associated with theconvergence of the induced downward heat fluxes [Yiğit andMedvedev, 2009]. Accounting for GWs in the CMAT2 GCMhas helped to bring simulated wind and temperature fieldsin the TI closer to the Horizontal Wind Model (HWM) andMSISE‐90 empirical models. This study follows the generalframework of our recent simulations, but focuses on the con-sequences of low and high insolation for GW propagationand dissipation in the thermosphere.[6] The structure of this paper is as follows: The spectral
nonlinear GW scheme is outlined briefly in section 2. Typicalvariations of the background atmospheric parameters asfunctions of the solar activity are discussed in section 3.Results of the offline calculations for several profiles fromHWM andMSISE‐90 empirical models at low and high solaractivity conditions are described in sections 4 and 5 for theatmosphere without and with wind shear, respectively. Ashort description of the CMAT2 GCM is given in section 6.
Results of GCM simulations are presented in section 7.Finally, a brief summary and conclusions are given insection 8.
2. Gravity Wave Scheme
[7] Gravity wave parameterizations calculate averageeffects of unresolved (subgrid‐scale) waves on the resolved(mean) fields in GCMs. Wave propagation is described interms the vertical flux of the horizontal momentum asso-ciated with a harmonic j, rFj, where Fj = u0w0
j is themomentum flux per unit mass, r is the density, u′ and w′ arethe horizontal and vertical components of wind perturbations,and the overline denotes an appropriate averaging over sub-grid scales. Fj varies with height according to [Yiğit et al.,2008]
FjðzÞ ¼ Fjðz0Þ�ðz0Þ��1ðzÞ�jðzÞ: ð1Þ
In the above equation, z0 is the reference (or source) level,and tj is the transmissivity function. For conservative prop-agation tj = 1, no divergence of the flux rFj takes place, andno average effect is produced by the harmonic on the meanflow. In case of dissipative propagation, tj can be repre-sented as
�jðzÞ ¼ exp �Z z
z0
� jmol þ � j
ion þ � jeddy þ � j
newt þ � jnon
h idz0
� �; ð2Þ
where the flux attenuation functions b j are attributed todifferent dissipation mechanisms. Vertical damping ratesdue to molecular viscosity and thermal conduction (assumingthat the Prandtl number is equal to unity) bmol
j , and due to ionfriction bion
j have forms [Yiğit et al., 2008, and referencestherein]
� jmol ¼
2�molN 3
khjcj � uj4 ; ð3Þ
� jion ¼
2�niN
khjcj � uj2 ; ð4Þ
where N is the buoyancy frequency; kh and cj are the hori-zontal wavelength and phase speed of the harmonic j,respectively; u(z) is the mean horizontal wind; nmol is thekinematic molecular viscosity; nni is the neutral‐ion collisionfrequency. Dissipation due to the background atmosphericeddy viscosity, beddy, is described by the equation similar to(3) with nmol replaced with the eddy diffusion coefficient,Deddy, and the expression for the radiative damping in theform of the Newtonian cooling, bnewt is analogous to that forthe ion friction (4) with the Newtonian cooling coefficientanewt, instead of nni. bnon describes the dissipation of theharmonic j caused by nonlinear interactions with otherwaves in the spectrum. This dissipation is the result ofinstabilities on scales shorter than the vertical wavelength ofthe harmonic. If the spectrum consists of a single harmonic,the wave interacts nonlinearly with itself referred to as“self‐interaction”, and the corresponding bnon describes thewell‐known Hodges‐Lindzen breaking due to convective
YIĞIT AND MEDVEDEV: SOLAR ACTIVITY INFLUENCE ON GRAVITY WAVES A00G02A00G02
2 of 16

instability. For a spectrum with multiple waves, bnon takesthe form [Medvedev and Klaassen, 1995, 2000]
�non ¼ffiffiffiffiffiffi2�
pN
�jexp � jcj � uj2
2�2j
!; ð5Þ
where the variance sj2 is created by velocity fluctuations
due to harmonics with shorter vertical scales, i.e., sj2 =
Smi>mju
02i , m being the vertical wave number.
[8] Once the wave flux F is specified at the source level z0,equation (1) can be integrated upwards for all harmonics.The acceleration/deceleration (“GW drag”) imposed by dis-sipating GWs on the mean wind is given by the divergenceof the wave momentum flux divided by the mean densitytaken with the opposite sign:
a ¼Xj
aj � �Xj
��1ð�FjÞz; ð6Þ
where aj is the contribution of an individual harmonic. Heatingand cooling produced by GWs can be calculated from[Medvedev and Klaassen, 2003; Yiğit and Medvedev, 2009]
�GW ¼Xj
ðcj � uÞajcp|fflfflfflfflfflffl{zfflfflfflfflfflffl}Ej
þ H
2�R
@
@z½�ðcj � uÞaj�|fflfflfflfflfflfflfflfflfflfflfflfflfflfflffl{zfflfflfflfflfflfflfflfflfflfflfflfflfflfflffl}Qj
8>>><>>>:
9>>>=>>>;: ð7Þ
In (7), cp is the specific heat at constant pressure, H is thedensity scale height, R is the universal gas constant. The firstterm in the brackets on the right‐hand side of (7) representsthe irreversible heating due to the mechanical energy con-version, Ej, and the second one is the convergence of theinduced heat flux, Qj. As with many GW parameterizations,our scheme assumes vertically propagating harmonics understeady wave approximation. This effectively implies thatsubgrid‐scale waves do not leave grid columns while prop-agating to the top of the model. For that, we limit our con-sideration by relatively slow GWs with horizontal phasespeeds less than 100 m s−1. Harmonics with c < 60 m s−1 areimportant in the MLT, while faster waves with 60 < c < 80to 100 m s−1 provide significant forcing in the TI [Vadas andLiu, 2009; Yiğit et al., 2009]. Typical horizontal wavelengths,lh, of GWs observed in the thermosphere are usually in therange of ∼100 to 500 km. Waves with lh ∼ 100 to 300 kmoften produce best results (that is, agreement between simu-lations and observations) when GW schemes are used inmiddle atmosphere GCMs. Therefore, we employ kh =2p/300 km throughout the calculations to be presentedhere. This setup excludes many of high‐frequency and short‐scale harmonics generated by convective sources. Suchlarger‐scale GWs escape reflection in the TI associated withthe decreasing stability (lower N) [Fritts and Vadas, 2008].
3. Background Atmospheric Properties at Highand Low Solar Activities
[9] It is seen from (3)–(5) that the modulation of the meanatmospheric state induced by variable solar radiation absorp-tion enter the GW scheme via N, temperature dependence ofnmol(T), and of other dissipation coefficients. Changes in the
temperature alter the mean wind u, and thus, affect the dis-persion relation and the vertical damping rate b, as well.Following from (6) and (7), the changes in the density pro-files, r(z), modify the dynamical and thermal feedback ofGWs on the mean flow.[10] Typical temperature profiles from MSISE‐90 model
for June F10.7 = 80 × 10−22 W m−2 Hz−1 and F10.7 = 180 ×10−22 W m−2 Hz−1 are plotted for 60°N in Figure 1a.Hereafter, we shall refer to these values of F10.7 as low andhigh solar activities, respectively. The neutral temperaturebelow 120 km is practically not affected by the solar fluxvariations. Above, the temperature at high solar activity,Thigh, reaches 1400 K in the exosphere exceeding the oneduring the low activity, Tlow, by more than 550 K, and byabout 500 K at the F2 layer heights. Note that the upwardexpansion of the thermosphere at higher temperatures leadsto higher pressures at fixed altitudes. From the ideal gasequation, r = p/RT, the density is the ratio of both increasingpressure p and T, and, generally, can either rise or drop whenthe solar activity grows depending on a particular p and T. Asa result, the molecular kinematic viscosity calculated afterBanks and Kockarts [1973],
�mol ¼ 3:563� 10�7T 0:69=� ½m2 s�1�; ð8Þ
is determined by the particular vertical profiles of r(z) andT(z), and can grow less or more rapidly with height duringhigh solar activity in the TI. Figure 1b demonstrates thatnmolhigh(z) < nmol
low(z) above ≈175 km, and the opposite takesplace between ≈125 and 175 km. The neutral‐ion collisionfrequency, nni, shows some variations with height with slightlylarger nni
high in the upper thermosphere (Figure 1c). The buoy-ancy frequency (Figure 1d) monotonically decreases above150 km when the temperature rises. The neutral gas densityfalls exponentially with height having larger values at highsolar activity (Figure 1e). The zonal wind demonstrates areversal in theMLT and fast thermospheric speeds (Figure 1f).Upper thermospheric easterlies at high solar activity areslower than those at low activity.[11] Most GCMs employ pressure levels as vertical coor-
dinates rather than a geometrical height. Therefore, we plottedthe relative variations of background parameters at 60°S, 0°and 60°N, (Xhigh − Xlow)/Xlow, as functions of pressure. Itis immediately seen from Figure 2 that the relative changeshave very weak latitudinal dependence, except for nni. Thelatter is the function of the ion density ni [Klostermeyer,1972],
�ni ¼ 7:22� 10�17T0:37ni; ð9Þ
and, thus, is controlled by the Earth’s magnetic field dis-placed with respect to the geographical poles. Under theassumption of charge neutrality, the ion densities are evalu-ated using electron density data from the CHIU ionospheremodel [Chiu, 1975]. The temperature rises by ≈40% whenthe solar flux is high (Figure 2a), and the density, r = p/RT,falls almost proportionally on the fixed pressure levels. Themolecular viscosity (Figure 2b) increases monotonically byup to 100% near the model top. From (8), nmol ∼ T1+0.69 whenthe pressure is fixed, and nmol(p) rises when temperaturegrows. Note that the latter case is opposite to what occurs inthe Cartesian vertical coordinates in the upper thermosphere
YIĞIT AND MEDVEDEV: SOLAR ACTIVITY INFLUENCE ON GRAVITY WAVES A00G02A00G02
3 of 16

(Figure 1b). Both results can be reconciled if one recallsthat the same pressure level corresponds to higher geomet-rical altitude when the temperatures are higher. The values ofneutral‐ion collision frequency (Figure 2c) are generallylarger (up to 140% in the upper thermosphere), depend on thelatitude, and somewhat decrease near the F2 layer heights inthe winter hemisphere during stronger solar activity. The
buoyancy frequency gradually decreases with height by about40% in the exosphere (Figure 2d).
4. Column Model Calculations in theWindless Atmosphere
[12] Having outlined typical changes of temperature, atmo-spheric stability and dissipation during low and high solar
Figure 1. Vertical profiles of (a) background temperature from MSISE‐90, (b) molecular viscosity,(c) neutral‐ion collision frequency, (d) Brunt‐Väisälä frequency squared, (e) neutral density, and (f) zonalwind from HWM on 22 June at 60°N as functions of geometrical altitude. Solid and dotted lines are for lowand high solar activities, respectively.
YIĞIT AND MEDVEDEV: SOLAR ACTIVITY INFLUENCE ON GRAVITY WAVES A00G02A00G02
4 of 16

activity, we now investigate their net influences on GWs. Inthis section, we analyze the vertical propagation of multipleharmonic spectra with off‐line calculations for representativebackground profiles described in section 3. An appropriate
distribution of GW momentum fluxes, Fj, must be specifiedat a source level, z0, in the lower atmosphere as a function ofhorizontal phase speeds, cj, where positive and negative cjcorrespond to eastward andwestward propagating harmonics,
Figure 2. Relative variations of (a) neutral density (thin) and temperature (thick), (b) molecular viscosity,(c) neutral‐ion collision frequency, and (d) buoyancy frequency with solar activity at three representativelatitudes: 0° (solid), 60°S (dashed), and 60°N (dotted). Geometrical heights for solar minimum and maxi-mum are shown on the left and right, respectively.
YIĞIT AND MEDVEDEV: SOLAR ACTIVITY INFLUENCE ON GRAVITY WAVES A00G02A00G02
5 of 16

respectively. The mathematical representation of such spec-trum is given by Yiğit et al. [2008]:
u0wj0ðz0Þ ¼ sgnðcj � u0Þu0w0
max exp½�ðcj � csÞ2=c2w�; ð10Þ
where u0w0max is the maximum momentum flux; u0 = u(z0)
is the mean wind at the source level; cs is the spectral shift;and cw is the half‐width of the Gaussian distribution. In thispaper, we will be using a symmetric spectrum, i.e., cs and u0are zero. Thus, eastward/westward propagating harmonicswith the same ∣c∣ carry equal amounts of eastward/westwardmomentum.[13] In the simplest possible case, the reflection and critical
level filtering are eliminated by assuming a windless atmo-sphere, i.e., u = 0. With this setup, non‐zero GW drag canbe produced if the spectrum is not symmetric with respectto c = 0, that is, if the momentum deposition by individualharmonics is not exactly canceled by that of counterpartwaves traveling in the opposite direction. Thus, we employthe same spectrum as presented in the work by Yiğit andMedvedev [2009], but consider only eastward propagatingharmonics, cj > 0, as used in the work by Yiğit et al. [2008,section 6]. We assume 20 GW harmonics distributed loga-rithmically in the phase speed spectrum [Medvedev andKlaassen, 2000] with phase velocities from 2 to 80 m s−1,i.e., cmax = 80 m s−1, u0w0
max = 0.00014 m2 s−2, and cw =35 m s−1 as shown in Figure 3.[14] The combined effect of static stability, density, and
dissipation at two MSISE‐90 temperature profiles corre-sponding to the low and high F10.7 is illustrated in Figure 4.The vertical damping rates associated with molecular diffu-
sion and thermal conduction, bmol; ion friction, bion; andnonlinear interactions between the waves, bnon, are shownfor two harmonics with phase velocities c = 80 m s−1 and c =54 m s−1. Figure 4 is plotted in log‐pressure coordinates, butthe geometrical height is given on the left and right handsides for low and high solar activities, respectively. It is seenthat, in the absence of the mean wind, the phase velocityrepresents a scaling factor for bmol and bion with faster wavesexperiencing weaker damping. For bnon, the behavior is morecomplex as the dissipation depends not on the phase velocityitself, but on the amplitudes and phase velocities of otherharmonics in the spectrum. Below 110–120 km, dissipationdue to ion friction, although small, exceeds the dissipationby molecular diffusion. Above, bmol dominates bion. In theMLT, where amplitudes of GWs are large, the nonlineardiffusion is the major damping mechanism. Inspection ofFigure 4a shows that bmol is always stronger (by tens ofpercent) during high solar activity when viewed in pressurecoordinates. This result agrees well with that of Hickey[1986]. In Cartesian altitude coordinates, it actually becomesweaker above ∼180 km when the thermosphere becomeshotter. The temperature dependence of bion is more complex,but, generally, the latter is stronger below 150–170 km, andweaker above at high solar activity. The total effect of bmol,bion, and bnon on the momentum flux associated with GWharmonics is shown in Figure 4d: waves tend to dissipatelower (i.e., at higher pressures) when the thermospherictemperature increases. Note that faster harmonics, which areless attenuated by the enhanced dissipation below ∼180 km,can probably penetrate above this height. There, they aresubject to weaker dissipation when F10.7 is higher, and thus,experience more favorable propagation conditions, as was
Figure 3. GWsource spectrum used in calculations for thewindless atmosphere (equation (10)). Both axesare logarithmically scaled. The magnitude of momentum flux for each wave harmonic is shown with smalltriangles. Spectral parameters are cw = 35 m s−1, u0w0
max = 0.00014 m2 s−2, M/2 = 20, and cmax = 80 m s−1.
YIĞIT AND MEDVEDEV: SOLAR ACTIVITY INFLUENCE ON GRAVITY WAVES A00G02A00G02
6 of 16

discussed in the works of Vadas and Fritts [2006] and Frittsand Vadas [2008].[15] GW drag and wave‐induced heating/cooling of the
mean flow produced by the entire spectrum reflect the
changes in the vertical propagation discussed above. Sincethe main wave damping for the given spectrum occursbelow 180 km, GW drag is about 50 m s−1 day−1 weakerwhen the dissipation is enhanced during high solar activity
Figure 4. GW vertical damping rates calculated at 60°N for harmonics c = 54 (grey) and 80 m s−1
(black) due to (a) molecular viscosity, (b) ion friction, and (c) nonlinear diffusion. (d) The GW horizontalmomentum fluxes are shown. Solid and dotted lines are for the solar minimum and maximum, respec-tively. The results are plotted on fixed pressure levels, but the corresponding geometrical heights areshown on the left and right vertical axis for low and high solar activity.
YIĞIT AND MEDVEDEV: SOLAR ACTIVITY INFLUENCE ON GRAVITY WAVES A00G02A00G02
7 of 16

(Figure 5a), and the root‐mean squared (RMS) wind per-turbations are smaller (Figure 5b). The maximum of wave‐induced cooling at ∼125 km is by ∼−15 K day−1 larger whenthe background temperature rises (Figure 5c). This occursbecause of more rapid vertical decay (see the second term,
Qj, in the curly brackets in (7)). The downward flux ofpotential temperature induced by GWs, w00, a proxy forfluxes of other tracers [Walterscheid, 1981; Medvedev andKlaassen, 2003], decreases by more than 20 m s−1 K ataround 120 km. This may serve as an indication that the
Figure 5. Column model simulations at 60°N for the windless atmosphere: (a) GW drag, (b) RMS windfluctuations, (c) total GW‐induced heating/cooling, and (d) downward fluxes of potential temperature.Solid and dotted lines are for low and high solar activity, respectively.
YIĞIT AND MEDVEDEV: SOLAR ACTIVITY INFLUENCE ON GRAVITY WAVES A00G02A00G02
8 of 16
downward penetration of passive tracers through the tur-bopause into the MLT is inhibited during high solar activity.
5. Column Model Calculations in the AtmosphereWith a Wind Shear
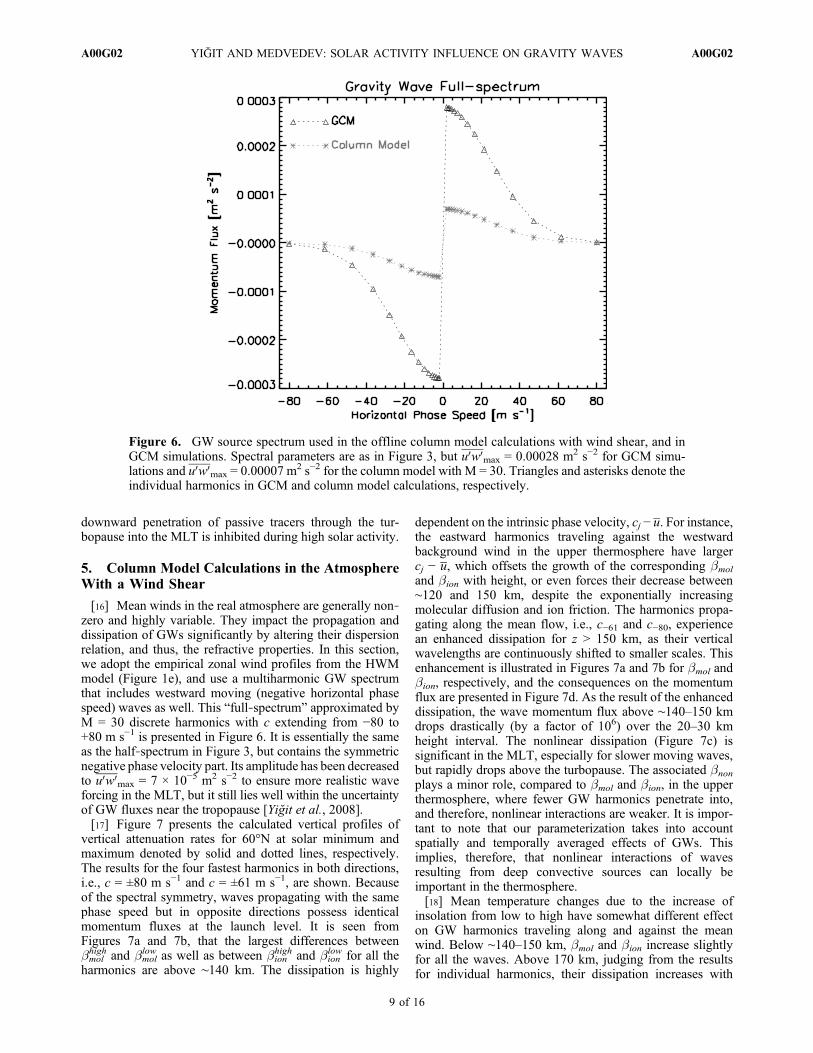
[16] Mean winds in the real atmosphere are generally non‐zero and highly variable. They impact the propagation anddissipation of GWs significantly by altering their dispersionrelation, and thus, the refractive properties. In this section,we adopt the empirical zonal wind profiles from the HWMmodel (Figure 1e), and use a multiharmonic GW spectrumthat includes westward moving (negative horizontal phasespeed) waves as well. This “full‐spectrum” approximated byM = 30 discrete harmonics with c extending from −80 to+80 m s−1 is presented in Figure 6. It is essentially the sameas the half‐spectrum in Figure 3, but contains the symmetricnegative phase velocity part. Its amplitude has been decreasedto u0w0
max = 7 × 10⁻⁵ m2 s−2 to ensure more realistic waveforcing in the MLT, but it still lies well within the uncertaintyof GW fluxes near the tropopause [Yiğit et al., 2008].[17] Figure 7 presents the calculated vertical profiles of
vertical attenuation rates for 60°N at solar minimum andmaximum denoted by solid and dotted lines, respectively.The results for the four fastest harmonics in both directions,i.e., c = ±80 m s−1 and c = ±61 m s−1, are shown. Becauseof the spectral symmetry, waves propagating with the samephase speed but in opposite directions possess identicalmomentum fluxes at the launch level. It is seen fromFigures 7a and 7b, that the largest differences betweenbmolhigh and bmol
low as well as between bionhigh and bion
low for all theharmonics are above ∼140 km. The dissipation is highly
dependent on the intrinsic phase velocity, cj − u. For instance,the eastward harmonics traveling against the westwardbackground wind in the upper thermosphere have largercj − u, which offsets the growth of the corresponding bmoland bion with height, or even forces their decrease between∼120 and 150 km, despite the exponentially increasingmolecular diffusion and ion friction. The harmonics propa-gating along the mean flow, i.e., c−61 and c−80, experiencean enhanced dissipation for z > 150 km, as their verticalwavelengths are continuously shifted to smaller scales. Thisenhancement is illustrated in Figures 7a and 7b for bmol andbion, respectively, and the consequences on the momentumflux are presented in Figure 7d. As the result of the enhanceddissipation, the wave momentum flux above ∼140–150 kmdrops drastically (by a factor of 106) over the 20–30 kmheight interval. The nonlinear dissipation (Figure 7c) issignificant in the MLT, especially for slower moving waves,but rapidly drops above the turbopause. The associated bnonplays a minor role, compared to bmol and bion, in the upperthermosphere, where fewer GW harmonics penetrate into,and therefore, nonlinear interactions are weaker. It is impor-tant to note that our parameterization takes into accountspatially and temporally averaged effects of GWs. Thisimplies, therefore, that nonlinear interactions of wavesresulting from deep convective sources can locally beimportant in the thermosphere.[18] Mean temperature changes due to the increase of
insolation from low to high have somewhat different effecton GW harmonics traveling along and against the meanwind. Below ∼140–150 km, bmol and bion increase slightlyfor all the waves. Above 170 km, judging from the resultsfor individual harmonics, their dissipation increases with
Figure 6. GW source spectrum used in the offline column model calculations with wind shear, and inGCM simulations. Spectral parameters are as in Figure 3, but u0w0
max = 0.00028 m2 s−2 for GCM simu-lations and u0w0
max = 0.00007 m2 s−2 for the column model with M = 30. Triangles and asterisks denote theindividual harmonics in GCM and column model calculations, respectively.
YIĞIT AND MEDVEDEV: SOLAR ACTIVITY INFLUENCE ON GRAVITY WAVES A00G02A00G02
9 of 16

altitude for the waves traveling against the mean wind, andincreases when the directions of wave propagation and ofthe mean wind coincide (Figures 7a and 7b). Clearly, thechanges in the intrinsic phase speed of a given harmonic thatresult from the changes of the wind profiles at different solar
activity levels are responsible for this behavior. Above∼150 km, the easterlies are weaker at solar maximum dueto the increased ion drag (Figure 1e). This implies relativelysmaller cj − u for westward harmonics, and weaker dampingby the molecular diffusion and ion friction. Although varia-
Figure 7. (a–d) GW parameters calculated at 60°N for two fastest GW harmonics propagating in theeastward and westward directions, c = ±80 and c = ±61 m s−1. Solid and dotted lines are for solar min-imum and maximum, respectively. The long‐dashed vertical (orange) line in Figure 7d indicates the valueu0wj
0 = 10−2 m2 s−2. The dot‐dashed horizontal (orange) line denotes 105 km (the turbopause).
YIĞIT AND MEDVEDEV: SOLAR ACTIVITY INFLUENCE ON GRAVITY WAVES A00G02A00G02
10 of 16

tion of the buoyancy frequency associated with temperaturechanges is large in the upper thermosphere (Figure 1d), itapparently controls the solar‐induced modulation of thevertical GW decay to a lesser extent than that caused bythe alteration of the mean wind.[19] Figure 8 summarizes the net effects of the scale‐
dependent propagation and dissipation in the TI resulting
from the entire spectrum. Comparison with Figure 1c showsthat the deposited GW momentum is directed predominantlyagainst the mean flow, but locally it can accelerate the meanwind in the thermosphere above ∼140 km at solar minimum,and above ∼150 km at solar maximum. The solar‐inducedvariation of GW forcing is significant at these altitudes:−400 m s−1 day−1 at low‐, and −250 m s−1 day−1 at high
Figure 8. Column model simulations at 60°N including the wind shear: (a) GW drag, (b) RMS windfluctuations, (c) total GW heating/cooling, and (d) downward fluxes of the potential temperature. Solidand dotted lines denote solar minimum and maximum values, respectively.
YIĞIT AND MEDVEDEV: SOLAR ACTIVITY INFLUENCE ON GRAVITY WAVES A00G02A00G02
11 of 16

solar activities (Figure 8a). In the thermosphere, the GW dragis produced by the surviving fast cj < 0 and cj > 0 harmonics,carrying momentum fluxes of opposite signs. As the easter-lies weaken in the upper thermosphere during high solaractivity, the vertical damping rates decrease/increase withaltitude for eastward/westward harmonics, and the westwardGW drag above ∼150 km becomes smaller. The RMS windfluctuations created by the spectrum generally follow thebehavior of the GW drag (Figure 8b). Their local peakscoincide with the local maxima of the drag. As with the GWforcing, the RMS wind is somewhat smaller above the tur-bopause at high solar activity. The wave‐induced heating/cooling rates in Figure 8c show two vertical dipoles ofcooling/heating, one in the mesosphere (the associated valuesvary from approximately −50 to 50 K day−1 between ∼85 and90 km), and one in the thermosphere between ∼130 and145 km with magnitudes from −200 to 50 K day−1. Theselocal peaks are related to the maxima of the RMS wind var-iations and of the momentum deposition. The lower peaksare created by an enhanced nonlinear dissipation of sloweastward moving GW harmonics just above the mean windreversal. They are not affected by the solar activity, butthe magnitude of the upper ones are reduced to −150 and20 K day−1 during solar maximum. The downward flux ofpotential temperature, a proxy for the GW‐induced flux ofother passive tracers, has a maximum around 140–150 km.It decreases from −70 to −40 m s−1 K when the solaractivity is high.[20] An example considered in this section demonstrates
that changes in GW propagation and dissipation associatedwith varying insolation fluxes are caused primarily bychanges in the thermospheric mean wind. Variations of thebuoyancy frequency and dissipation rates considered insection 4, play apparently a secondary role. Vertical dampingby molecular viscosity and ion drag is highly sensitive to theintrinsic phase speed and direction of GW propagation, andcan substantially offset the direct influence of the varyingtemperature. However, the overall effect on GWs of the windaltered by the solar activity is similar to the direct effect oftemperature changes. Below ∼150 km, vertical damping ofGW harmonics intensifies, they dissipate lower, deposit lessmomentum and heat to the mean flow, induce weakerdownward heat fluxes when solar activity increases. Above,the propagation becomes more favorable.[21] Detailed studies with the column model give an
insight into the mechanism by which changes in the solaractivity affect the GW propagation and dissipation. How-ever, such studies cannot cover all possible wind and tem-perature distributions, and cannot account for the wavefeedback on the mean circulation. In the following sections,we first outline the GCM to be used, and then investigatethese effects in a more complex and realistic environmentby performing interactive GCM simulations at low and highsolar activity levels.
6. GCM Description
[22] The CMAT2 GCM used in this study has beendescribed in detail in the work by Yiğit et al. [2009]. Thedomain of this finite difference model covers altitudes fromthe lower stratosphere (100 hPa, or ∼15 km) to the upperthermosphere (typically 1.43 × 10⁻⁸ hPa, or ∼250–600 km),
and has 63 vertical levels (equidistant in log‐pressurecoordinates with 1/3 scale height discretization). The latitude‐longitude resolution employed in the simulations is 2° × 18°.[23] The model includes parameterizations of the absorp-
tion of solar radiation by ozone in the Chappuis, Huggins,and Hartley bands; by O2 in the Schumann‐Runge bands,and of heating due to the exothermic neutral chemistry.Thermospheric heating, photodissociation, and photoioniza-tion are calculated for the absorption of solar X‐rays, extremeultraviolet (EUV), and UV radiation between 1.8–184 nm.Radiative cooling parameterizations include the 5.3 mmNO emission, 63 m fine structure atomic oxygen, local ther-modynamic equilibrium (LTE) and non‐LTE 15.6 mm CO2,and 9.6 mm O3 radiative emissions.[24] The model incorporates appropriate representations of
electric fields, auroral particle precipitation at high‐latitudes,Joule heating, and ion drag. The morphology of the iono-spheric electron density, ne, is prescribed from the Parame-terized Ionospheric Model (PIM) [Daniell et al., 1995].Therefore, any direct dynamical feedback from the thermo-sphere to ne is excluded. In the numerical experiments to bepresented, we use prescribed climatological distributions ofchemical species and of the Earth’s magnetic field.[25] CMAT2 lacks a troposphere and, as described in the
work by Yiğit et al. [2009], is forced at the lower boundaryby the NCEP reanalysis data and tidal oscillations from theGlobal Scale Wave Model‐02 [Hagan and Forbes, 2003].[26] The primary impact of the solar flux variations,
represented by the F10.7 parameter in the model, is on themagnitude of the neutral gas heating in the thermosphere,because the solar radiation in the Schumann‐Runge con-tinuum region, which is predominantly absorbed by O2 inthe thermosphere as well as in EUV strongly depend on theF10.7‐cm flux. Furthermore, enhanced solar activity leads toan overall increase of ionization rates, and thus, to an increaseof ion densities, which in turn, leads to larger neutral‐ioncollision frequencies, nni. Also, the ion densities affect themorphology of ion drag and neutral gas heating rate associ-ated with Joule dissipation, as they are proportional to nniand to the differential motion between neutrals and ions:−nni(u − vi) and −nni(u − vi)
2, respectively.
7. Results of GCM Simulations
[27] The GCM results to be presented in this section arefor the low‐ (EXP1, F10.7 = 80 × 10−22 W m−2 Hz−1) andhigh (EXP2, F10.7 = 180 × 10−22 W m−2 Hz−1) solar activityruns. The CMAT2 simulations have been performed fromMarch equinox to July 6 assuming constant low geomagneticactivity (Kp = 2+) throughout all simulations. This was doneto eliminate any model variability associated with the effectsof the convection electric fields of magnetospheric origin.The same type of GW source spectrum as presented inFigure 6 with horizontally and temporally uniformmagnitudeof the fluxes (u0w0
max = 2.8 × 10⁻⁴ m2 s−2) have been used atthe lower boundary. The shape and strength of this modelspectrum are in a very good agreement with the balloonmeasurements [Hertzog et al., 2008, Figure 6].[28] Four‐hour model outputs have been averaged over the
last three weeks of simulations to represent mean fieldscentered around the solstice. The resultingmean zonal neutraltemperature and wind are plotted in Figure 9. It is seen that
YIĞIT AND MEDVEDEV: SOLAR ACTIVITY INFLUENCE ON GRAVITY WAVES A00G02A00G02
12 of 16

they are not affected by the solar activity in the middleatmosphere. Note that both runs reproduce quite well theposition and magnitude of the summer mesopause, which ispredominantly shaped by the GW momentum deposition.Enhanced photoionization processes and heating in the TIduring high solar activity cause its expansion above theturbopause. Although the calculations have been performedon the log‐scale pressure levels, the results are presented inthe Cartesian height coordinates. The altitudes shown in thepanels have been computed using the global mean tempera-ture for each case, and illustrate the degree of the atmosphericvertical expansion. The strongest difference occurs over thesummer pole, where the simulated peak values are 1000 Kand 1600 K in EXP1 and EXP2, respectively. The high‐latitude winter hemisphere temperature maximum is about200 K hotter under stronger insolation conditions.
[29] The simulated mean zonal winds appear very similarin both runs when viewed in log‐pressure coordinates. Theyare equally affected by the temperature distribution, and byviscous dissipation and ion drag. The easterly jet in thesummer hemisphere of the TI is associated with the south-ward thermally induced meridional Hadley circulation.Westerlies (super‐rotation) in the low and midlatitudes ofboth hemispheres are maintained by eddies, mainly by solartides. The easterly jet in high latitudes of the winter hemi-sphere is caused by the clockwise transport cell forced bythe enhanced Joule heating and auroral particle precipitation.Note that these easterlies are in a good agreement with theempirical HWM model, and could only be reproduced byGCMs when a GW parameterization has been included [Yiğitet al., 2009].When converted to Cartesian heights (Figures 9cand 9d), the wind in the thermosphere is seen to be weaker
Figure 9. Simulated GCM mean zonal fields. Temperature (in K) at (a) low‐ and (b) high solar activityand zonal wind (in m s−1) at (c) low‐ and (d) high solar activity. Grey shading in Figures 9a and 9b indicatesregions with temperatures larger than 1000 K. In Figures 9c and 9d, the light grey shading highlights east-ward winds.
YIĞIT AND MEDVEDEV: SOLAR ACTIVITY INFLUENCE ON GRAVITY WAVES A00G02A00G02
13 of 16

during high solar activity. For instance, the midlatitudeeasterly jet at 200 km is ∼20 m s−1 weaker in EXP2 thanin EXP1, and the maximum of westerlies in the winterhemisphere of the same magnitude (∼30 m s−1) is shiftedfrom 150 to 200 km.[30] Distributions of the mean zonal torque by GWs are
shown in Figures 10a and 10b. It is immediately seen thatthe main dynamical effects of GWs both in the middle andthe upper atmosphere are to decelerate the mean zonal windin an average sense. During the low solar activity, the GWdrag is twice as strong in the high‐latitude winter hemisphereand in the midlatitude summer one, and has approximatelysame magnitudes over the summer pole. The former resultshows a good agreement with the findings of numericalstudies conducted in the work by Vadas and Fritts [2006],who showed that the body force created from a localizedconvective plume has an amplitude twice as large during solar
minimum as compared to solar maximum. The peaks inour simulations occur at different heights: around 200 and280 km during small and large F10.7 periods, respectively.GWmomentum deposition is generally weaker below certainheight during strong solar activity, which was also capturedin our offline calculations. For instance, GW drag is weakerbelow ∼220 km at 70°S and 80°N during solar maximum,but exceeds the one for the solar minimum above this height.At 60°N, the wave‐induced torque during solar maximum isgreater only above 240 km, where all GWs from the sourcespectrum are almost entirely dissipated.[31] The GW drag pattern looks somewhat differently
when viewed in pressure coordinates (not shown here). Then,it gets shifted downward to higher pressures (lower log‐pressure heights) at high solar activity, and the magnitudesof the drag become weaker. This behavior is consistentwith the notion that the molecular dissipation monotonically
Figure 10. Mean zonal GW drag (in m s−1 day−1) at (a) low‐ and (b) high solar activity. GW‐inducedtotal heating/cooling (in K day−1) at (c) low‐ and (d) high solar activity. Grey‐shaded areas are the regionsof the eastward GW drag (Figures 10a and 10b), and of the net (positive) heating (Figures 10c and 10d).
YIĞIT AND MEDVEDEV: SOLAR ACTIVITY INFLUENCE ON GRAVITY WAVES A00G02A00G02
14 of 16

increases in pressure coordinates when temperature rises(section 3). Hence, harmonics experience stronger damping,dissipate at lower amplitudes, and produce weaker drag.Therefore, vertical propagation of GWs, distributions of theiramplitudes and the produced momentum deposition in theCartesian height can be viewed as a result of the competitionbetween the increased dissipation (in pressure coordinates)due to higher temperatures, and the vertical expansion of theatmosphere.[32] More dramatic changes at large F10.7 are seen in the TI
for the net GW heating/cooling, Sj(Ej + Qj) in Figures 10cand 10d. While the thermal effect of GWs above ∼180 kmis dominated by strong cooling in the EXP1, a weak netheating is produced in the upper portion of the model domainin the run for high solar activity. This heating is formed byfast harmonics that continue their upward propagation undera weaker (in the Cartesian point of view) dissipation. Onecan expect even stronger heating in the exosphere if fasterharmonics are present in the source spectrum. Clearly, thethermal effect in the upper thermosphere is highly sensitiveto the amount of fluxes associated with fast harmonics. Moremeasurements of these fluxes above the turbopause arerequired to constrain the heating/cooling effects of internalGWs in the exosphere.
8. Summary and Conclusions
[33] We addressed in this paper the question of how var-iations of solar activity influence the propagation of gravitywaves (GWs) from the lower atmosphere into the TI, andhow dynamical and thermal effects of these waves changebetween periods of low and high insolation. This was doneusing a spectral GW parameterization that consistentlyaccounts for dissipation in the thermosphere, nonlinear self‐interactions, and refraction by the mean wind and tempera-ture. We analyzed the propagation in one‐dimensional modelemploying empirical wind and temperature profiles from theHWM and MSISE‐90 models, and then performed fullyinteractive simulations with the University College LondonCoupled Middle Atmosphere‐Thermosphere‐2 (CMAT2)GCM. The solar activity level was approximated by theF10.7 parameter: F10.7 = 80 × 10−22 for the low‐, and F10.7 =180 × 10−22 W m−2 Hz−1 for the high insolation flux.[34] WKB and the steady wave approximations, which
our GW scheme is based upon, limit vertical wavelengths ofharmonics by 2p × density scale height. The parameteriza-tion also assumes that sub‐grid scale waves do not leave thegrid columns while propagating to the top of the model.Therefore, we consider only GWs with horizontal phasevelocities less than ≈100 m s−1. Harmonics with c < 60 m s−1
are important in the middle atmosphere, whereas fasterwaves with 60 < c < 100 m s−1 provide significant forcingin the TI [Vadas and Fritts, 2006; Yiğit et al., 2009]. Typicalhorizontal wavelengths of internal GWs observed in the ther-mosphere usually range between 100 and 500 km. Harmonicswith wavelengths 100 to 300 km are known to produce thebest agreement between simulations and observations whenGW parameterizations are used in middle atmosphere GCMs.We have assumed lh = 300 km in our calculations. This setupexcludes many high‐frequency and short‐scale harmonicsgenerated by convective sources. The waves we consider inthis paper escape reflection in the TI [Fritts and Vadas, 2008].
Varying solar radiation flux does not affect the dynamics ofGWs directly, but alter the propagation via temperaturedependencies of dissipation parameters, static stability, andthe background wind. Molecular diffusion and thermal con-duction can be weaker or stronger below ∼170 km when thesolar activity is high. Above, they grow with height in ahotter TI, generally, slower. Static stability decreases in theupper thermosphere when atmospheric temperatures rise. Itshifts local vertical wavelengths of GW harmonics to largervalues, thus weakening their vertical damping and favoringwave propagation during periods of high solar activity.Altering mean wind also strongly influences the dispersionrelation and the vertical attenuation.[35] In the series of calculations for typical wind and tem-
perature profiles from empirical HWM and MSISE‐90models we found that, below ∼150 km, vertical damping ofGWs intensifies when F10.7 increases, harmonics tend todissipate slightly lower, produce somewhat weaker drag, anddeposit less heat. Variations of the buoyancy frequency anddissipation rates play, apparently, a secondary role comparedto the changes in the refraction associated with mean windchanges. However, the overall effect of the zonal wind alteredby the solar activity is similar to the direct effect of temper-ature changes. Downward GW‐induced fluxes of the poten-tial temperature across the turbopause, a proxy for fluxesof other conservative tracers, appear to be weaker duringperiods of high solar activity. In the upper thermosphere,propagation of surviving GW harmonics becomes morefavorable, and waves tend to propagate higher in a hotterthermosphere, as was also noticed in the works by Hickey[1986] and Vadas and Fritts [2006].[36] Simulations with the CMAT2 GCM have demon-
strated that the main dynamical effect of GWs is to deceleratethe mean zonal wind in an average sense in the middle andupper atmosphere. The maxima of GW momentum deposi-tion in high latitudes occur much higher under strong solaractivity conditions, whereas its magnitude is, generally,smaller below 170–180 km. Thus, the drag in the upperthermosphere is two times weaker in the winter hemisphere,and is about the same in the summer one. More significantchanges at large F10.7 take place in the TI for the GW‐inducednet heating/cooling. At the low solar activity, the net effectof GWs in the upper thermosphere is strong cooling. Whenthe insolation is high, dissipating waves produce a weakheating in the upper portion of the model domain. It is createdby fast harmonics that continue their upward propagationfavored by weaker dissipation. The effects in the upper TI areextremely sensitive to the amount of horizontal momentumfluxes carried by fast GWs. More measurements of thesefluxes at or above the turbopause are required to constrain theeffects of vertically propagating GWs near the exosphere inGCMs.[37] Propagation and dissipation of GWs in the thermo-
sphere reveal itself somewhat differently in Cartesian altitudeand pressure coordinates, in which most GCMs operate.While molecular diffusion, a major dissipative factor in theTI, grows slower with height in the upper thermosphereduring periods of high solar activity, it increases faster at allfixed pressure levels. As a result, the maxima of GW dragoccur at higher pressures (lower log‐pressure altitudes).Therefore, vertical propagation of GWs, and the created pat-terns of the mean zonal drag can be viewed as a competition
YIĞIT AND MEDVEDEV: SOLAR ACTIVITY INFLUENCE ON GRAVITY WAVES A00G02A00G02
15 of 16

between the enhanced dissipation (in pressure coordinates)under stronger insolation, and the vertical expansion of theatmosphere (in the Cartesian point of view) due to highertemperatures.
[38] Acknowledgments. This work was partially supported byAFOSR grant FA9550‐07‐1‐0434 and by German Science Foundationgrant HA3261/4,5.[39] Bob Lysak thanks Michael Hickey and Sharon Vadas for their
assistance in evaluating this paper.
ReferencesBanks, P. M., and G. Kockarts (1973), Aeronomy: Part B, 355 pp., Elsevier,New York.
Bishop, R. L., N. Aponte, G. D. Earle, M. Sulzer, M. F. Larsen, andG. S. Peng (2006), Arecibo observations of ionospheric perturbationsassociated with the passage of Tropical Storm Odette, J. Geophys.Res., 111, A11320, doi:10.1029/2006JA011668.
Chiu, Y. T. (1975), An improved phenomenological model of ionosphericdensity, J. Atmos. Terr. Phys., 37, 1563–1570.
Cole, K. D., and M. P. Hickey (1981), Energy transfer by gravity wavedissipation, Adv. Space Res., 1, 65–74.
Daniell, R. E., Jr., L. D. Brown, D. N. Anderson, M. W. Fox, P. H. Doherty,D. T. Decker, J. J. Sojka, and R. W. Schunk (1995), Parameterized iono-spheric model: A global ionospheric parameterization based on first prin-ciples models, Radio Sci., 30, 1499–1510.
Djuth, F. T., M. P. Sulzer, S. A. Gonzáles, J. D. Mathews, J. H. Elder, andR. L. Walterscheid (2004), A continuum of gravity waves in the Arecibothermosphere?, Geophys. Res. Lett., 31, L16801, doi:10.1029/2003GL019376.
Francis, S. H. (1973), Acoustic‐gravity modes and large‐scale travelingionospheric disturbances of a realistic, dissipative atmosphere, J. Geophys.Res., 78, 2278–2301.
Francis, S. H. (1975), Global propagation of atmospheric gravity waves: Areview, J. Atmos. Terr. Phys., 37, 1011–1054.
Fritts, D. C., and S. L. Vadas (2008), Gravity wave penetration into thethermosphere: Sensitivity to solar variations and mean winds, Ann.Geophys., 26, 3841–3861.
Hagan, M. E., and J. M. Forbes (2003), Migrating and nonmigrating semi-diurnal tides in the middle and upper atmosphere excited by troposphericlatent heat release, J. Geophys. Res., 108(A2), 1062, doi:10.1029/2002JA009466.
Hertzog, A., G. Boccara, R. A. Vincent, F. Vial, and P. Cocqurez (2008),Estimation of gravity wave momentum flux and phase speeds fromquasi‐Lagrangian stratospheric balloon flights. Part II: Results fromVorcore campaign in Antarctica, J. Atmos. Sci., 65, 3056–3070.
Hickey, M. P. (1986), The propagation and dissipation of internal grav-ity waves in the thermosphere, Ph.D. dissertation, La Trobe Univ.,Melbourne, Vic., Australia.
Hickey, M. P. (1987), A theoretical comparison of internal gravity wavepropagation and dissipation in high and low temperature thermospheres:Implications for orbiting spacecraft, paper presented at 25th AerospaceSciences Meeting, Am. Inst. of Aeronaut. and Astronaut., Reno, Nev.
Hocke, K., and T. Tsuda (2001), Gravity waves and ionospheric irregularitiesover tropical convection zones observed by GPS/MET radio occultations,Geophys. Res. Lett., 28, 2815–2818.
Klausner, V., P. R. Fagundes, Y. Sahai, C. M. Wrasse, V. G. Pillat, andF. Becker‐Guedes (2009), Observations of GW/TID oscillations in theF2 layer at low latitude during high and low solar activity, geomagneticquiet and disturbed periods, J. Geophys. Res., 114, A02313,doi:10.1029/2008JA013448.
Klostermeyer, J. (1972), Influence of viscosity, thermal conduction, and iondrag on the propagation of atmospheric gravity waves in the thermo-sphere, Z. Geophys., 38, 881–890.
Livneh, D. J., I. Seker, F. T. Djuth, and J. D. Mathews (2007), Continuousquasiperiodic thermospheric waves over Arecibo, J. Geophys. Res., 112,A07313, doi:10.1029/2006JA012225.
Medvedev, A. S., and G. P. Klaassen (1995), Vertical evolution ofgravity wave spectra and the parameterization of associated wave drag,J. Geophys. Res., 100, 25,841–25,853.
Medvedev, A. S., and G. P. Klaassen (2000), Parameterization of gravitywave momentum deposition based on nonlinear wave interactions:Basic formulation and sensitivity tests, J. Atmos. Sol. Terr. Phys., 62,1015–1033.
Medvedev, A. S., and G. P. Klaassen (2003), Thermal effects of saturatinggravity waves in the atmosphere, J. Geophys. Res., 108(D2), 4040,doi:10.1029/2002JD002504.
Oliver, W. L., Y. Otsuka, M. Sato, T. Takami, and S. Fukao (1997), A cli-matology of F region gravity wave propagation over the middle andupper atmosphere radar, J. Geophys. Res., 102, 14,499–14,512.
Richmond, A. D. (1978), Gravity wave generation, propagation, and dissi-pation in the thermosphere, J. Geophys. Res., 83, 4131–4145.
Vadas, S. L. (2007), Horizontal and vertical propagation of gravity wavesin the thermosphere from lower atmospheric and thermospheric sources,J. Geophys. Res., 112, A06305, doi:10.1029/2006JA011845.
Vadas, S. L., and D. C. Fritts (2005), Thermospheric responses to gravitywaves: Influences of increasing viscosity and thermal diffusivity,J. Geophys. Res., 110, D15103, doi:10.1029/2004JD005574.
Vadas, S. L., and D. C. Fritts (2006), Influence of solar variability on gravitywave structure and dissipation in the thermosphere from tropospheric con-vection, J. Geophys. Res., 111, A10S12, doi:10.1029/2005JA011510.
Vadas, S. L., and H. Liu (2009), Generation of large‐scale gravity wavesand neutral winds in the thermosphere from the dissipation of convec-tively generated gravity waves, J. Geophys. Res., 114, A10310,doi:10.1029/2009JA014108.
Walterscheid, R. L. (1981), Dynamical cooling induced by dissipatinginternal gravity waves, Geophys. Res. Lett., 8, 1235–1238.
Yiğit, E., and A. S. Medvedev (2009), Heating and cooling of the thermo-sphere by internal gravity waves, Geophys. Res. Lett., 36, L14807,doi:10.1029/2009GL038507.
Yiğit, E., A. D. Aylward, and A. S. Medvedev (2008), Parameterization ofthe effects of vertically propagating gravity waves for thermosphere gen-eral circulation models: Sensitivity study, J. Geophys. Res., 113, D19106,doi:10.1029/2008JD010135.
Yiğit, E., A. S. Medvedev, A. D. Aylward, P. Hartogh, and M. J. Harris(2009), Modeling the effects of gravity wave momentum deposition onthe general circulation above the turbopause, J. Geophys. Res., 114,D07101, doi:10.1029/2008JD011132.
A. S. Medvedev, Max Planck Institute for Solar System Research, Max‐Planck‐Str. 2, D‐37191 Katlenburg‐Lindau, Germany. ([email protected])E. Yiğit, Center for Space Environment Modeling, Department of
Atmosphere, Oceanic and Space Sciences, University of Michigan, 1429Space Research Bldg., 2455 Hayward St., Ann Arbor, MI 48109‐2143,USA. ([email protected])
YIĞIT AND MEDVEDEV: SOLAR ACTIVITY INFLUENCE ON GRAVITY WAVES A00G02A00G02
16 of 16