internal defects of continuous casting slabs caused by
TRANSCRIPT
1. Introduction
The flow of molten steel in the continuous casting moldis of great interest because of its influence on many impor-tant phenomena related to product quality, including entrap-ment of inclusions and bubbles on the solidified shell,which causes internal defects in cast slabs and various de-fects in final products.
The continuous casting process with the vertical-bendingtype machine has far fewer internal defect problems thanthe same process with the curved type caster. However,even with the vertical-bending caster, defects are still aproblem in high quality steel products, such as sheets fordeep drawing use.
It may be assumed that large bubbles tend not to pene-trate into the deep region of the molten steel strand becausethey have a large buoyancy force. However, bubbles in the1–3 mm size range are sometimes found in cast slabs.
Fundamental work on the entrapment of particles on thesolidified shell has shown that the so-called “washing ef-fect,” which occurs in high speed casting, can reduce thenumber of particles entrapped on the shell.1–3) Theoreticalmodels not to take macro steel flow into account, have alsobeen published,4) and a new research has demonstrated thatthe thermal conductivity of particles is important for en-trapment probability.5,6)
Al2O3 particles are usually observed on the surface ofbubbles in cast steel, where they seem to coagulate. Thissuggests that the presence of bubbles accelerates coagula-tion and thus encourages the formation of larger Al2O3
clusters.However, in any case, the mechanism of internal defects
has not yet been sufficiently clarified. At present, it canonly be said with certainty that internal defects are causedby bubbles and inclusions entrapped on the shell.7)
In order to clarify the mechanism of internal defectscaused by bubbles and inclusions, the authors carried out afundamental examination of the entrapment of inclusionsand bubbles on the solidified shell of molten steel duringcontinuous casting using water model experiments and anumerical fluid flow simulation. Particular attention wasgiven to the unbalanced time-dependent flow in the moldand attachment of inclusions to bubbles.
The FC mold,8) which consists of two magnetic coils,generates homogeneous magnetic field on the large area.The upper field is for stabilising the top free surface and thelower one seems to be effective for suppressing the down-ward steel. So, the effect of a static magnetic field on thetime-dependent flow was also estimated by numerical simu-lation.
2. Internal Defects
Some internal defects in steel products are caused by en-trapped bubbles and inclusions, which originate as far up-stream as the continuous casting process. For example, blis-ter defects are caused by bubbles and surrounding Al2O3
particles. Figure 1 shows an example of internal defects ina cold rolled sheet. The depth from the slab surface is esti-mated to be about 10–20 mm. Based on observation of cast
ISIJ International, Vol. 43 (2003), No. 10, pp. 1548–1555
© 2003 ISIJ 1548
Internal Defects of Continuous Casting Slabs Caused by Asymmetric Unbalanced Steel Flow in Mold
Yuji MIKI and Shuji TAKEUCHI
Steel Research Labs., JFE Steel Corp., Kawasaki-dori, Mizushima, Kurashiki-shi, Okayama 712-8511 Japan.
(Received on January 8, 2003; accepted in final form on April 25, 2003 )
The molten steel flow in the continuous casting mold and entrapment of inclusions and bubbles on theinner surface of the solidified shell are examined to clarify the origin of internal defects in steel products.Defects on steel sheets are caused by inclusions and bubbles entrapped on the solidified shell during cast-ing. It was found that bubbles are able to penetrate deeply due to an unbalanced time-dependent flow. Thisphenomenon can be explained by the Large Eddy Simulation model, which is capable of simulating thetime-dependent flow.
The number of inclusions increases as the bubble diameter and the distance of the position of entrap-ment from the top free surface increase. This indicates that bubbles collect inclusions while traveling in themolten steel in the continuous caster. A simple mathematical model is presented to explain how the inclu-sions are collected by bubbles.
The calculation results also reveal that the static magnetic field generated by the FC Mold reduces time-dependent flow changes and thereby prevents internal defects caused by bubbles and inclusions.
KEY WORDS: continuous casting; molten steel; casting mold; entrapment; bubble; inclusion; solidifiedshell; internal defect; magnetic field.

slabs, the diameter range of entrapped bubbles is usually0.5–3.0 mm. Hydrogen atoms concentrate on these bubblesduring annealing, causing the bubbles to expand. In addi-tion, Al2O3 clusters attached to bubbles are generally muchlarger than independent Al2O3 clusters because Al2O3 parti-cles tend to coagulate on bubbles, as suggested by Shibataet al.9)
On the other hand, it may also be proposed that if onlybubbles existed in a slab, without associated inclusions,these bubbles alone would not cause internal defects be-cause rolling can adequately close up simple gaseousporosities.
3. Experimental Method
3.1. Water Model Experiment
A water model experimental apparatus of the same sizeas an actual casting mold is shown in Fig. 2. The strandthickness and width were 220 mm and 1 500 mm, respec-tively. The strand height was designed to be 3 m to reducethe influence of the bottom. The flow velocity at the centerof thickness at the 1/4 width position (M1) and the flow ve-locity near the short edge at a point 1 m below the surface(M2) were measured with a propeller-type velocity meter.
The margin of error of the propeller velocity meter was0.01 m/s. Approximately 4 000 data were sampled over aperiod of 800 s at intervals of 0.2 s.
3.2. Calculation Method
The molten steel flow was calculated using a commercialcode called Fluent.10) A Large Eddy Simulation (LES)11)
with a Smagorinsky sub-grid-scale model was employed tocalculate the time-dependent flow. In an unsteady state sim-ulation, only large eddies to which momentum and masswere transported were calculated by the LES, and small ed-
dies to which energy was dispersed were solved using thek–e model.
Turbulence viscosity is expressed by Eqs. (1) and (2).
m t�rL2S| S̄ | ................................(1)
LS�min(kd, CSV 1/3) ........................(2)
Here, r : steel density (�7 000 kg/m3), LS: mixing length,S : strain rate tensor, k : constant (�0.42), d : distance fromnearest wall, CS: Smagorinsky constant (�0.1), V : volumeof cell.
Since the jet flow velocity is large, the influence of ther-mal convection was disregarded. The model was divided
ISIJ International, Vol. 43 (2003), No. 10
1549 © 2003 ISIJ
Fig. 1. Example of blister defect on cold rolled coil.
Fig. 2. Schematic diagram of water model equipment and mea-surement points.

into 140 000 meshes for a 1/2 symmetrical model. The in-fluence of gas bubbles on the steel flow was considered ac-cording to the Dispersed Phase Model (DPM).12) In this ex-periment, 1 000 bubbles per time-step were released fromthe top of the nozzle. The bubble diameter distribution wasassumed to be N in Eq. (3) based on measured results re-ported in the literature.13)
N�AD�5 .................................(3)
Here, N : number of bubbles, A: constant, and D: diame-ter of bubbles.
It is assumed that inclusions and gas bubbles whichreached the free surface of the molten steel were separatedby flotation. The maximum time-step was 0.0125 s.
To simulate the flow under a static magnetic field, themagnetic induction method14) shown in Eq. (4) was em-ployed.
............(4)
Where, B is the sum of the magnetic field imposed by theelectromagnet, B0, and the magnetic field induced by thesteel flow, b. The symbols m and s are the magnetic perme-ability and the electrical conductivity of steel, respectively.
The velocity derived from the water model can be com-pared to the results of the numerical simulation or actualmold flow since all cases are the same in size and kinematicviscosity of fluid.
3.3. Investigation of Bubbles in Slab
The bubble distribution in cast slabs was investigated bythe X-ray transmission method at a cross section perpendic-ular to the casting direction. The number of Al2O3 particlesadhering to the surface of a bubble was counted by SEMobservation.
4. Results
4.1. Water Model Experiments
Observation of the water model revealed the existence ofan asymmetric unbalanced time-dependent flow, as shownin Fig. 3. This means that the steel flow rate from one spoutis not always the same as that from the other. These phe-nomena seem to be due to instability of the flow.15)
Figure 4 shows the measured flow velocity of points M1and M2. Both the velocity at M1 and at M2 fluctuated. A
∂∂
⋅ ⋅B
tU B B B U� � � � � �( ) ( )
1 2
µσ
ISIJ International, Vol. 43 (2003), No. 10
© 2003 ISIJ 1550
Fig. 3. Observation of bubble distribution in mold (throughput:6.0 t/min, gas flow rate: 10 L/min).
Fig. 4. Measured flow velocity at position M1 and M2 (through-put: 6.0 t/min, gas flow rate, 10 L/min).
Fig. 5. Results of FFT analysis (throughput: 6.0 t/min, gas flowrate: 10 L/min).

Fast Fourier Transform (FFT) analysis was applied to esti-mate the frequency of the fluctuation of the flow velocity.Figure 5 shows examples of the analysis results. There is aclear peak around 15 s, and the period of the peak is shorterwith larger molten steel throughputs, as shown in Fig. 6.On the other hand, there were no clear peaks without gasblowing, as shown in Fig. 7.
4.2. Calculation Results
Figure 8 shows the calculated results of the velocity vec-tor and trajectories of 1 mm diameter bubbles. Fig. 8(a) isthe time-averaged flow velocity, and Figs. 8(b) and 8(c)show the time-dependent unbalanced flow. Here, Fig. 8(c)
ISIJ International, Vol. 43 (2003), No. 10
1551 © 2003 ISIJ
Fig. 8. Velocity vector and 1 mm bubble trajectories of time-dependent unbalanced flow calculated by LES model.(through put 6.0 t/min, gas flow rate 10 L/min).
Fig. 6. Result of FFT analysis (throughput 4.5 t/min, gas flowrate: 10 L/min). Fig. 7. Flow velocity and FFT result without gas blowing from
nozzle. (through put 6.0 t/min, gas flow rate 10 L/min).

shows the flow at 15 s after Fig. 8(b). Figure 8(d) shows theresult calculated by the k–e model. In Fig. 8(c), eddies nearthe nozzle can be realized, which might cause engulfmentof the mold flux.
Based on the velocity vector of the molten steel and tra-jectories of bubbles with a 1 mm diameter, trajectories witha time-averaged flow cannot explain the penetration of bub-bles into the deep region of the molten steel, which was ob-served in the water model. That is, in a time-average steelflow, bubbles do not overcome the force of buoyancy andtherefore cannot penetrate into the deep region. Rather, thebubbles easily rise to the surface, where they dissipate intothe atmosphere. In contrast to this, in the unsteady time-de-pendent flow simulation results, some bubbles penetrated toa depth of more than 1.5 m below the surface. The trajecto-ries calculated by the k–e model shown in Fig. 8(d) areslightly different from those of the time-averaged flowshown in Fig. 8(a), but all the bubbles rose to the top sur-face, even with the k–e model.
An example of the flow velocity calculated for points M1and M2 is shown in Fig. 9. The mean, maximum, and mini-mum values are almost identical with the measured valuesshown in Fig. 4. The FFT of the calculated velocity wasalso compared with the measured results, and a similar fluc-tuation period of 15 s was obtained.
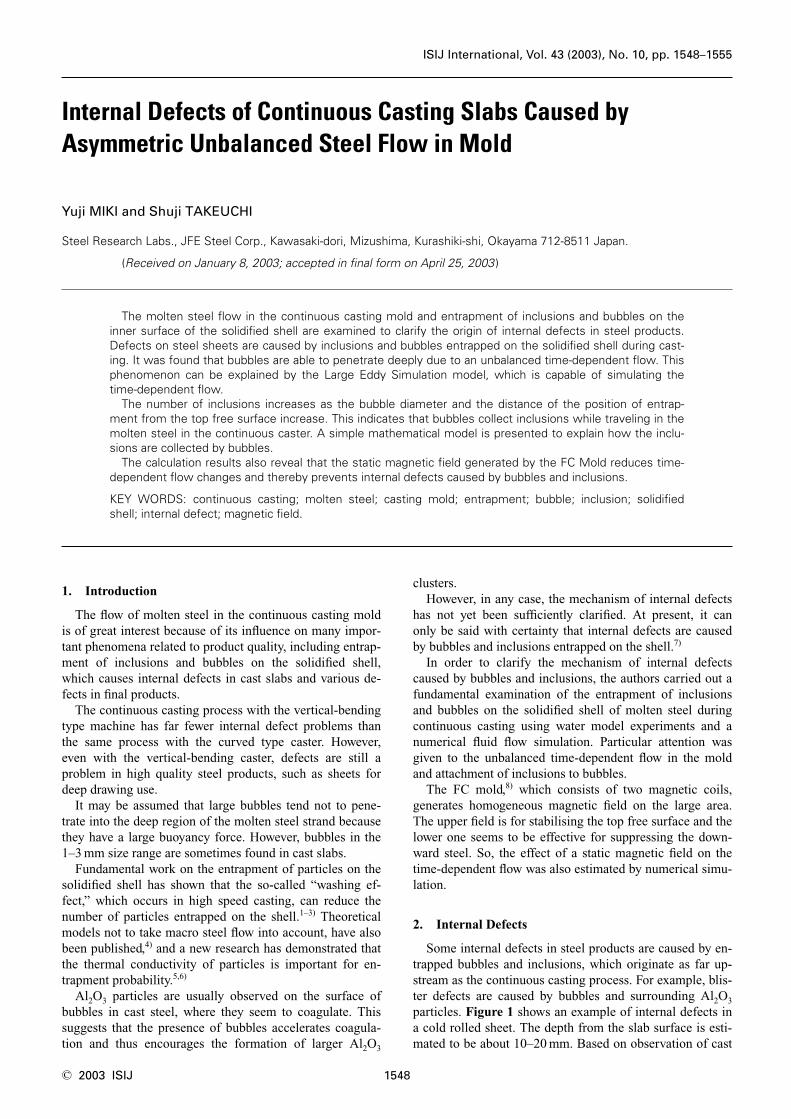
Figure 10 shows the velocity vector calculated on the as-sumption that a DC magnetic field of 0.3 T is imposed.Figure 11 shows the calculated and flow velocity fluctua-tions measured at the M1 point in the continuous castingmold.16) The fluctuation is much less than that without theDC magnetic field. This phenomenon is attributable to thelarge braking force acting on the high velocity steel.
4.3. Distribution of Bubbles in Slab and Al2O3 in Bub-bles
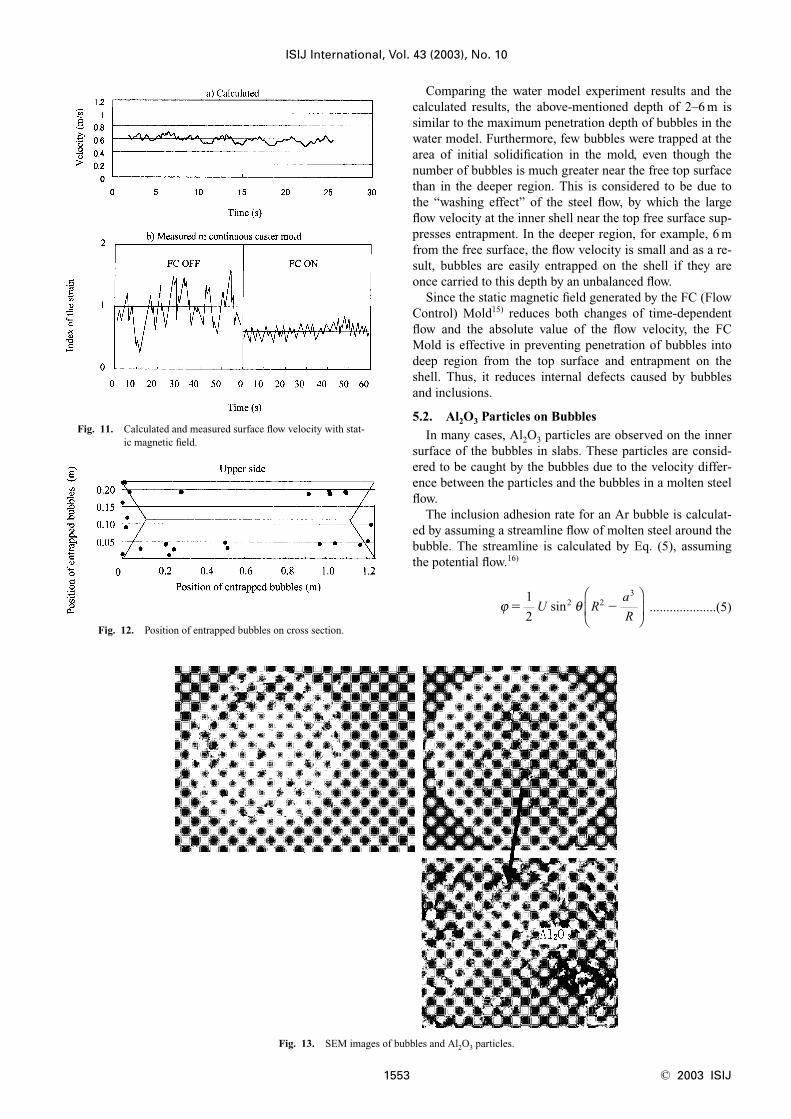
Figure 12 shows the results of an investigation of bubbledistribution by the X-ray transmission method in a samplecut out perpendicular to the casting direction. For compari-son purposes, bubbles which were detected in two samplesseparated by a distance of 0.2 m in the casting direction aresuperimposed on the same drawing. More bubbles were ob-served in the region within 0.3 m from the narrow face thanat the center of width.
The number of Al2O3 particles on the bubble surface wascounted by SEM observation, as shown in Fig. 13. A fewhundred Al2O3 particles are found on the surface of onebubble.
5. Discussion
5.1. Penetration of Bubbles
The position where a bubble was entrapped on the solidi-fied steel shell in the casting mold is calculated based on itsdistance from the surface of the slab. The solidification co-efficient was assumed to be 21 mm/min0.5 in the mold and28 mm/min0.5 in the secondary cooling zone. Thus, thesebubbles were estimated to be entrapped at positions 2–6 mfrom the surface, as shown in Fig. 14.
ISIJ International, Vol. 43 (2003), No. 10
© 2003 ISIJ 1552
Fig. 9. Calculated flow velocity at position M1 and M2 (throughput 6.0 t/min, gas flow rate 10 L/min).
Fig. 10. Flow velocity vector with 0.3 T magnetic field using FC mold (through put 6.0 t/min, gas flow rate 10 L/min).
Comparing the water model experiment results and thecalculated results, the above-mentioned depth of 2–6 m issimilar to the maximum penetration depth of bubbles in thewater model. Furthermore, few bubbles were trapped at thearea of initial solidification in the mold, even though thenumber of bubbles is much greater near the free top surfacethan in the deeper region. This is considered to be due tothe “washing effect” of the steel flow, by which the largeflow velocity at the inner shell near the top free surface sup-presses entrapment. In the deeper region, for example, 6 mfrom the free surface, the flow velocity is small and as a re-sult, bubbles are easily entrapped on the shell if they areonce carried to this depth by an unbalanced flow.
Since the static magnetic field generated by the FC (FlowControl) Mold15) reduces both changes of time-dependentflow and the absolute value of the flow velocity, the FCMold is effective in preventing penetration of bubbles intodeep region from the top surface and entrapment on theshell. Thus, it reduces internal defects caused by bubblesand inclusions.
5.2. Al2O3 Particles on Bubbles
In many cases, Al2O3 particles are observed on the innersurface of the bubbles in slabs. These particles are consid-ered to be caught by the bubbles due to the velocity differ-ence between the particles and the bubbles in a molten steelflow.
The inclusion adhesion rate for an Ar bubble is calculat-ed by assuming a streamline flow of molten steel around thebubble. The streamline is calculated by Eq. (5), assumingthe potential flow.16)
....................(5)ϕ θ� �1
22 2
3
U Ra
Rsin
ISIJ International, Vol. 43 (2003), No. 10
1553 © 2003 ISIJ
Fig. 11. Calculated and measured surface flow velocity with stat-ic magnetic field.
Fig. 12. Position of entrapped bubbles on cross section.
Fig. 13. SEM images of bubbles and Al2O3 particles.

Here, y : stream function, U : flow velocity of steel, a :bubble radius, and R: spherical polar coordinates.
The streamline around a bubble with 5 mm diameter isshown in Fig. 15. The weight of particles caught by thebubble is calculated assuming that the bubble travels inmolten steel with homogenously dispersed oxide particles,and can be expressed by Eq. (6).17)
M�3.3�10�7DbubOppmL .................... (6)
Here, M : weight of particles caught by a bubble (kg),Dbub: diameter of a bubble (m), Oppm: oxygen content ofsteel (ppm), and L: distance of bubble movement (m).
The number of Al2O3 particles on the bubble surface in-creases when the bubble is entrapped on the shell at a deep-er position, that is, further from the top surface of themolten steel, or when the bubble is large, as shown in Eq.(6).
The distance from the steel free surface, L, and the mea-sured bubble diameter, D, were multiplied, and the countednumber of Al2O3 particles was plotted against D�L, asshown in Fig. 16.
The number of Al2O3 particles in a bubble seems to beproportional to D�L, which corresponds qualitatively toEq. (6). This also means that particles tend to collect onbubbles as the bubbles travel in the molten steel in the con-tinuous caster.
Based on Eq. (6), it can be calculated that 6.6 mg of parti-cles become attached to a bubble when a bubble 1 mm in
diameter travels a distance of 1 m in molten steel with a20 ppm oxygen content. Assuming that all Al2O3 particleshave a 5 mm diameter, approximately 45 000 of these parti-cles should be observed on the bubble. However, only a fewpercent of the calculated number of particles will actuallybe caught on the bubble, even if the number of particles isassumed to be several times greater than that actually ob-served in the half plane observed with the SEM.
Bubble attachment behavior, as it relates to reduction inthe number and size of inclusions, was discussed in a previ-ous work that proposed an inclusion size distribution modelfor RH degassing.18) The measured size distribution changecan be explained if the probability of entrapment of Al2O3
on bubbles relative to the total collision rate between bub-bles and particles is assumed to be 3%. With the results ofthe two cases described above, the possibility of entrapmentis considered to be quite low compared with that given byEq. (6), probably because the bubble trajectories are super-imposed to a considerable extent.
Thus, it seems that further theoretical and experimentalexamination is necessary before the entrapment of inclu-sions on bubbles in molten steel can be quantitatively esti-mated.19,20)
6. Conclusion
The flow velocity of an unbalanced time-dependent flowwas evaluated by water model experiments and numericalanalysis. Bubbles and Al2O3 particles in a cast slab were in-vestigated for comparison with the estimated results. Thefollowing findings were obtained.
(1) The flow velocity fluctuates, and these fluctuationsinclude a wide range of flow velocities as large as 0–0.6m/s. The period of these fluctuations was estimated to bearound 15 s based on the water model experiments. The cal-culated results of the average velocity and the peak of theFFT analysis coincided with the measurements.
(2) The position of entrapped bubbles ranges between 2and 6 m below the free surface. This penetration depth isnot consistent with a time-average flow calculation, but canbe explained by the unbalanced time-dependent flow calcu-lation mentioned above.
(3) The number of caught Al2O3 particles increaseswhen a bubble is caught at a deeper position, far from themolten steel surface, or when the bubble is large. The num-
ISIJ International, Vol. 43 (2003), No. 10
© 2003 ISIJ 1554
Fig. 14. Distance of pinhole defect from top surface.
Fig. 15. Calculated streamline around bubble with 5 mm diame-ter.
Fig. 16. Relationship between D�L and number of inclusions onone bubble in slab.

ber of Al2O3 particles on a bubble is proportional to D�L,which corresponds qualitatively to Eq. (6). This also meansthat particles tend to collect on bubbles as the bubbles trav-el in the molten steel in the continuous caster.
(4) Since the static magnetic field generated by the FCMold reduces both the time-dependent flow changes andthe absolute value of the flow velocity, the FC Mold is ef-fective in preventing internal defects caused by bubbles andinclusions, as shown in the simulation results.
Acknowledgement
Authors wish to thank Professor Ohnaka and ProfessorYasuda at Osaka University for their great suggestions.
REFERENCES
1) K. Okazawa: Progress in Research on Ultra Cleen Steel—Fundamental and Applied Aspects—Final Report of Ultra CleanSteel Research Group, Vol. III-3, ISIJ. Tokyo, (1999), 286.
2) I. Sawada and K. Okazawa: CAMP-ISIJ, 8 (1995), 344.3) W. Yamada, K. Okazawa and H. Hasegawa: CAMP-ISIJ, 12 (1999),
156.4) K. Mukai: Tetsu-to-Hagané, 82 (1996), 8.5) H.Yasuda and I. Ohnaka: CAMP-ISIJ, 11 (1998), 53.
6) H. Yasuda, I. Ohnaka and H. Teiji: CAMP-ISIJ, 12 (1999), 774.7) H. Yasunaka, R. Yamanaka, K. Inoue and T. Saito: Tetsu-to-Hagané,
81 (1995), 529.8) A. Idogawa, Y. Kitano and K. Tozawa: Kawasaki Steel Giho, 28
(1996), 46.9) H. Shibata, H. Yin, S. Yoshinaga, T. Emi and M. Suzuki: ISIJ Int., 38
(1998), 149.10) Fluent 5 User’s Guide, Fluent Inc., Lebanon, NH, (1998).11) For example, M. Yasuhara and H. Daiguuji: Suuchi-Ryutai-Rikigaku
(Numerical Fluid Dynamics), Tokyo-Daigaku-Syuppankai, Tokyo,(1992), 213.
12) S. T. Johansen, F. Boysan and W. H. Ayers: Appl. Sci. Res., 44(1987), 197.
13) T. Toh, H. Hasegawa and H. Harada: ISIJ Int., 41 (2001), 1245.14) J. Cao: MHD Modeling with Fluent, Fluent Europe, London, (1997).15) H. Tozawa, H. Nakato and K. Sorimachi: CAMP-ISIJ, 8 (1995),
1114.16) F. M. White: Viscous Fluid Flow, McGraw-Hill Inc., New York,
(1991), 178.17) B. G. Thomas, A. Denissov and H. Bai: 80th Steelmaking Conf.
Proc., ISS, Warrendale, PA, (1997), 375.18) Y. Miki, B. G. Thomas, A. Dennisov and Y. Shimada: Iron
Steelmaker, 32 (1997), 31.19) L. Zhang and S. Taniguchi: Int. Mater. Rev., 45 (2000), 59.20) L. Zhang and S. Taniguchi: Materials Processing in Computer Age,
3 (2000), 111.
ISIJ International, Vol. 43 (2003), No. 10
1555 © 2003 ISIJ