intermediate input imports and innovations: evidence from ...larryqiu/papers/jie-intermediate input...
TRANSCRIPT

Journal of International Economics 103 (2016) 166–183
Contents lists available at ScienceDirect
Journal of International Economics
j ourna l homepage: www.e lsev ie r .com/ locate / j i e
Intermediate input imports and innovations: Evidence from Chinesefirms’ patent filings
Qing Liua, Larry D. Qiub,*aSchool of International Trade and Economics, University of International Business and Economics, ChinabFaculty of Business and Economics, The University of Hong Kong, Hong Kong
A R T I C L E I N F O
Article history:Received 26 May 2015Received in revised form 21 September 2016Accepted 27 September 2016Available online 5 October 2016
JEL classification:F13F15O14O31
Keywords:Trade liberalizationIntermediate inputInnovationPatent
A B S T R A C T
Innovation plays a key role in economic growth. In this paper, we investigate the effects of intermediateinput tariff reduction on the innovation activities of domestic firms. Input tariff reduction has two oppositeeffects on the innovation decision of a firm: it may promote innovation because the cost of innovationactivities decreases, but it may also result in a decrease in innovation because foreign technologies becomecheaper. We use Chinese firm-level data from 1998 to 2007, which features a drastic input tariff cut in2002 because of China’s WTO accession, and find that input tariff cut results in less innovation undertakenby Chinese firms. The findings are obtained using the difference-in-differences technique and are robust tovarious specifications checks of the model. We also provide a theoretical framework to generate insights tothe empirical findings.
© 2016 Elsevier B.V. All rights reserved.
1. Introduction
Innovation and technological progress are key determinantsof economic growth. In his 2014 State of the Union Address,US President Barack Obama claimed that “the nation that goes all-inon innovation today will own the global economy tomorrow”. Thepast few decades have witnessed the race for innovation and deepen-ing globalization worldwide. How does trade liberalization influencethe incentive of firms to engage in innovation activities? This impor-tant question has been addressed by a large body of literature. Mostexisting studies are based on final goods trade and confirm that tradeis one of the most important factors that drive innovation (Kiriyama,2012). In contrast, this paper examines the effects of intermediateinput tariff liberalization on firm innovation activities. Our study isbased on Chinese firm-level data.
A growing share of international trade is in capital goods andintermediate inputs. At the global level, the share of capital goodsin total trade increased from 21.0% in 1970 to 26.5% in 2006 while
* Corresponding author.E-mail addresses: [email protected] (Q. Liu), [email protected] (L. Qiu).
the share of intermediate goods in total trade increased from 7.5%to 13.0% (Onodera, 2009). From 2000 to 2006, the total value ofChina’s capital and intermediate input imports increased by 151%and 256%, respectively. Another notable change is China’s grow-ing innovations. For example, China’s share of global research anddevelopment (R&D) jumped from 2.2% in 2000 to 14.5% in 2011.1
In 2011, China’s patent office received the highest number of appli-cations worldwide.2 Thus, China is a good case for analyzing theeffects of intermediate input imports on innovations. Drastic tradeliberalization in China also makes the country a good case for validempirical investigation of such an issue. On the one hand, the aver-age input tariff rate in China dropped from 13.74% in 1998 to 8.13%in 2007, with the greatest cuts after 2001 when the country becamea member of the WTO. On the other hand, the degrees of inputtariff liberalization differ tremendously across industries. By utiliz-ing these two features, namely, large and sudden tariff cuts due tothe WTO accession and cross-industry variations of the cuts, we are
1 Foreign Policy, “It’s official: China is becoming a new innovation powerhouse”,Feb. 6th, 2014.
2 The Economist, “How innovative is China? Valuing patents”, Jan. 5th, 2013.
http://dx.doi.org/10.1016/j.jinteco.2016.09.0090022-1996/© 2016 Elsevier B.V. All rights reserved.

Q. Liu, L. Qiu / Journal of International Economics 103 (2016) 166–183 167
able to use the difference-in-differences (DID) technique to assessempirically the effects of input tariff cuts on the innovation activitiesof domestic firms.
Against backdrop, our analysis shows that China’s input tariffliberalization reduces innovation activities of firms as measured bypatent filings. This negative effect is both statistically significant andeconomically important: a one-percentage point cut in input tariffrate results in about 0.15% to 0.28% drop in innovations. This findingis robust to different model specifications and concerns of the model.This finding is also interesting because it is neither obvious norexpected.
A cut in intermediate input tariffs could have positive andnegative incentives to innovation activities. On the one hand, inputtariff reduction enables a firm to purchase a larger quantity of inputwith more varieties and higher quality. This capability lowers afirm’s incentive to undertake innovation because the firm can raiseits production productivity or output quality through a cheaperchannel (i.e., importing intermediate inputs). On the other hand,a firm may undertake R&D by using intermediate inputs, andits innovation activities may benefit from the technology embed-ded in imported inputs. As a result, the cost of undertaking R&Ddecreases or the effectiveness increases, and hence, a firm’s incen-tive to do R&D increases. Our empirical finding implies that theinnovation-reducing effect dominates the innovation-raising effectin China.3 We introduce a simple theoretical model to understandthe mechanism at work, and find that under some very plausible con-ditions, a firm imports higher quality inputs in response to a tariff cutin intermediate input, which results in a reduction in innovation.
To the best of our knowledge, the present paper is the firstto investigate the direct effects of intermediate input imports oninnovation based on firm-level data. Two strands of related literatureexist.4 In the first strand, some papers have examined the effectson innovations by trade liberalization in general, but not by inter-mediate input imports in particular, and thus their conclusions andmechanisms differ considerably from the present paper. Generallyspeaking, trade affects innovation through various channels, such astransferring embedded technology, increasing market size, changingcompetition, realizing scale economies, and generating spillovers.Examples in this strand include Baldwin and Gu (2004), de Negriand Turchi (2007), Almeida and Fernandes (2008), Lileeva and Trefler(2010), Aw et al. (2011), Bustos (2011), and Bloom et al. (2016).5
In particular, Bloom et al. (2016) find that import competition fromChina leads to more innovations of European firms, but imports fromother developed countries have no significant effect. Using firm-level data covering 43 developing countries, Almeida and Fernandes(2008) report that on average 53% of the technological innovationsare embodied in new machinery or equipment and transferred fromdeveloped to developing countries through exports and multina-tional firms. In their analysis of 43,595 firms in Brazil and Argentina,de Negri and Turchi (2007) find that national exporters are in
3 A good example which supports this general empirical finding is Changhong’sresponse to imported technology. Changhong is a large TV maker in China. Through“imitation” the company was able to introduce many new product lines in early1980s. Beginning in 1986, Japanese TV makers dumped the new generation of color TVproduction lines and key components to the Chinese market. In response, Changhongstopped its own R&D but just purchased the Japanese technology because of the lowcost. The full story can be found in http://news.xinhuanet.com/fortune/2011-05/03/c_121370462.htm.
4 Grossman and Helpman (1991) provide a very comprehensive study on the rela-tionship between trade and innovation. See Atkeson and Burstein (2010) and Bursteinand Melitz (2013) for the recent approaches.
5 Earlier empirical studies are based on country-level or industry-level data. Forexample, Coe and Helpman (1995) find strong international R&D spillovers throughtrade, based on evidence that the productivity growth of a country depends not onlyon its domestic R&D capital stock but also on the R&D capital stock of its foreigntrading partners.
general more innovative than non-exporters, with the percentage ofinnovating firms in these two categories being 48% and 36%,respectively.
The second strand of literature includes the recently emerg-ing empirical studies on the effects of intermediate input importson firm’s performance.6 Several studies (Halpern et al., 2011 onHungarian firms; Kasahara and Rodrigue, 2008, on Chilean firms)find that imports of intermediates or declines in input tariffs areconducive to productivity gains. Productivity can increase throughthree channels via imported intermediate inputs: learning, improvedinput quality, and increase in input variety. Using Indonesian man-ufacturing plant-level data, Amiti and Konings (2007) find that a10% fall in input tariffs leads to a 12% gain in the productivity ofimporting firms, which is much higher than the productivity gainfrom reducing output tariffs. Qualitatively similar results are alsofound by Topalova and Khandelwal (2011) based on Indian data.Goldberg et al. (2010) examine the effects of trade liberalization inIndia during the 1990s and find that domestic firms increase theirproduct scope because they can access previously unavailable newinput varieties. Approximately 31% of the new products are resultsof lower input tariffs. Using firm-level data from the French agrifoodsector, Chevassus-Lozza et al. (2013) discover that lowering inputtariffs increases the export sales of high-productivity firms at theexpense of low-productivity firms. Bas (2012) shows that Argentinefirms in industries experiencing larger input tariff reductions havehigher probability of entering the export market. Using French data,Bas and Strauss-Kahn (2014) find that using more varieties ofimported input results in higher TFP and export scope. However,not all results are positive. For example, van Biesebroeck (2003)finds that there is no productivity improvement for Columbia firmsthrough the use of input import.7 Muendler (2004) also finds that theuse of foreign inputs plays a minor role in the productivity change ofBrazilian firms.
Similar to the present research, several studies have also exam-ined the effects of Chinese input tariff reductions, but with differentfocuses. Using data on Chinese firms from 2000 to 2006, Yu (2015)finds that both input tariff and output tariff reductions improve firmproductivity for both processing-trade and non-processing-tradefirms. In particular, the effect of input tariff reduction on productiv-ity is stronger than that of output tariff reduction. Ge et al. (2011)investigate the channels of firm productivity gains from input tariffcut and find supports for the learning, variety, and quality channels.Fan et al. (2015) and Bas and Strauss-Kahn (2015) examine theeffect of Chinese input tariff reduction on the change in quality ofexport goods and find significant quality upgrade. Feng et al. (2016)study the connection between firm imports and exports, based onChinese firm-level data from 2002 to 2006. They find that firms thatexpand their intermediate input imports raise the volume of theirexports and increase their export scope. All these studies suggestthat the channel through which intermediate input imports affectfirm performance is the increased technology or quality embeddedin imported inputs.8
6 Theoretical studies have painted a clear picture (e.g., Ethier, 1982). Firms’performance can improve from intermediate input imports because of the increasedvariety of inputs and the utilization of technology embedded in imported inputs.
7 Zhang (2014) decomposes productivity gains to static and dynamic gains.Dynamic gains come from the increase in knowledge and/or innovation of theimporters because of imported intermediate inputs. He uses Columbia data to showthat dynamic gains are more important than static gains.
8 Using new product sales as a measure of innovation, Liu and Buck (2007) showthat Chinese firms increase their innovations when they import more technology.Using data from 1965 to 1995 for 86 countries, Connolly (2003) finds that hightechnology imports from developed countries increase domestic innovations (perhapsthrough initial imitation), especially for developing countries. He argue that this isperhaps through reversed engineering.

168 Q. Liu, L. Qiu / Journal of International Economics 103 (2016) 166–183
Similar to this second strand of literature, our paper alsofocuses on intermediate input import. However, different from allthose studies, we explore directly the effects on innovation, whichdistinguishes the present study from this strand of literature. Ofcourse, the performance measures studied by the above-mentionedpapers are not independent of innovation. For example, newproducts introduced by firms may be the result of firms’ productR&D, and the improved quality of their products could be theoutcome of their innovation specifically targeting quality improve-ment. However, those measures are not equivalent to innovation.The improvements of those performance could be the results ofother efforts by firms, such as improved management practice orchanges in organizational form along with trade liberalization, or asEthier (1982) shows, improved performance could be the results ofintermediate input imports because of the increased variety of inputsand the utilization of technology embedded in imported inputs.
Our finding is also different from all above-mentioned studieseven if we consider the good performance being (partly) the resultof innovations. For example, the increased product scope of Indianfirms can be contributed to the larger amount of product R&Dby firms, and the productivity gain by Indonesian importers isa result of more process R&D undertaken by these firms. Whileinnovation has been “found” to increase in all studies discussedabove (with the exception of two cases with insignificant results,i.e., van Biesebroeck, 2003, and Muendler, 2004) in response tointermediate input tariff reduction, in contrast, we directly showthat patent applications of Chinese firms decrease, which indicatesthat innovation is different from other performance measures andseparately investigating the trade effect on innovation of firms isimportant.
Innovation is an important topic in many disciplines includingeconomics and management. Two of the many issues that theinnovation literatures emphasize are incentive for innovation andspillovers/diffusion of innovation. Factors affecting incentives andspillovers include intellectual property rights (IPR) protection,market competition, education levels, and institutions. We can viewthe issue studied in the present paper as how embodied tech-nology from upstream (intermediate inputs) affects, via diffusion,downstream innovation incentives. In this regard, our paper isalso loosely related to the MAKE-or-BUY issue discussed mostly inthe industrial organization and management literatures. With theMAKE decision, firms conduct R&D in-house and develop their owntechnology, while with the BUY decision, they acquire technologyexternally. Veugelers and Cassiman (1999) provide a useful reviewof this literature. On the one hand, there is substitution between theMAKE and BUY decisions. This view is developed based on transac-tion cost economics (Williamson, 1985) and property rights theory(Grossman and Hart, 1986). There are costs and benefits of usingexternal technology as it helps lower innovation costs and gaintime, but inevitably incurs transaction or agency costs. On the otherhand, there is complementarity between MAKE and BUY. It has beenargued that in-house R&D may serve to absorb, modify and improveexternal technology purchased by the firms (Cohen and Levinthal,1989). Evidence for both substitution and complementarity can befound in the literature (Cassiman and Veugelers, 2006; Lyons, 1995).The mechanism which works in our paper is related but not exactlythe same as those underlying the MAKE-or-BUY decision. Cheaperimported intermediate inputs can make the MAKE option less attrac-tive because the importers can use the embodied technology directly,but can also make the BUY option less attractive because the cost ofdoing R&D is lower.
The remainder of this paper is organized as follows. In the nextsection, we describe our estimation strategy and data. We conductempirical analysis and discuss the findings in Section 3. We explorethe underlying mechanisms in Section 4. Concluding remarks areprovided in Section 5.
2. Background, empirical strategy, and data
2.1. China’s patent applications
Similar to its impressive economic growth, China has also expe-rienced drastic growth in patent applications received by the StateIntellectual Property Office (SIPO). The total patent applicationsincreased from 8558 in 1985 to 928,177 in 2014, indicating anaverage annual growth of 17.54% according to the World IntellectualProperty Office (WIPO). Although patent applications started late andfrom a small base, China has become the largest country receivingpatent applications since 2011, overtaking Japan in 2010 and theUS in 2011. Many studies have attempted to provide explanationsfor the explosion of China’s patent applications. Hu and Jefferson(2009) suggest and test five factors that account for the patent riseincluding intensification of R&D, growth of foreign direct invest-ment (FDI), amendments to the patent law, ownership reform, andindustry structural shift.
In fact, since China passed its first patent law in 1984, it hasamended the law several times including 1992, 2000, and 2008in addition to those made in accordance with the Agreement onTrade-Related Aspects of Intellectual Property Rights (TRIPS). Inter-estingly enough, well before China’s entry to the WTO, China’s1992 amendment had extended the duration of invention patentprotection from 15 to 20 years, which is a major part of the TRIPSrequirement. Hence, the TRIPS does not completely coincide with the2002 tariff reduction from China’s WTO accession.
According to the quantitative study of Future (2012), from 1986to 2010, 2.106 million invention patent applications were publishedby SIPO, with about 53% of them are from entities within China. Thegrowth during the period of 2000–2010 is even more spectacular,at an average annual rate of 28.4%. State-owned enterprises (SOE)were the main corporate inventors before the mid-1990s, but privatecompanies have become the main corporate inventors in the laterperiod. Geographically, the center of gravity of innovation focused onthree cities (Beijing, Shanghai and Shenzhen) in the early years, butlater spread all over the country. The Kairos Future’s Report (2012)attributes the driving forces for the phenomenal growth of patentapplications in China to factors such as policy incentives, increasedR&D spending, rising levels of education, and liberalization of manysectors.
2.2. China’s accession to WTO
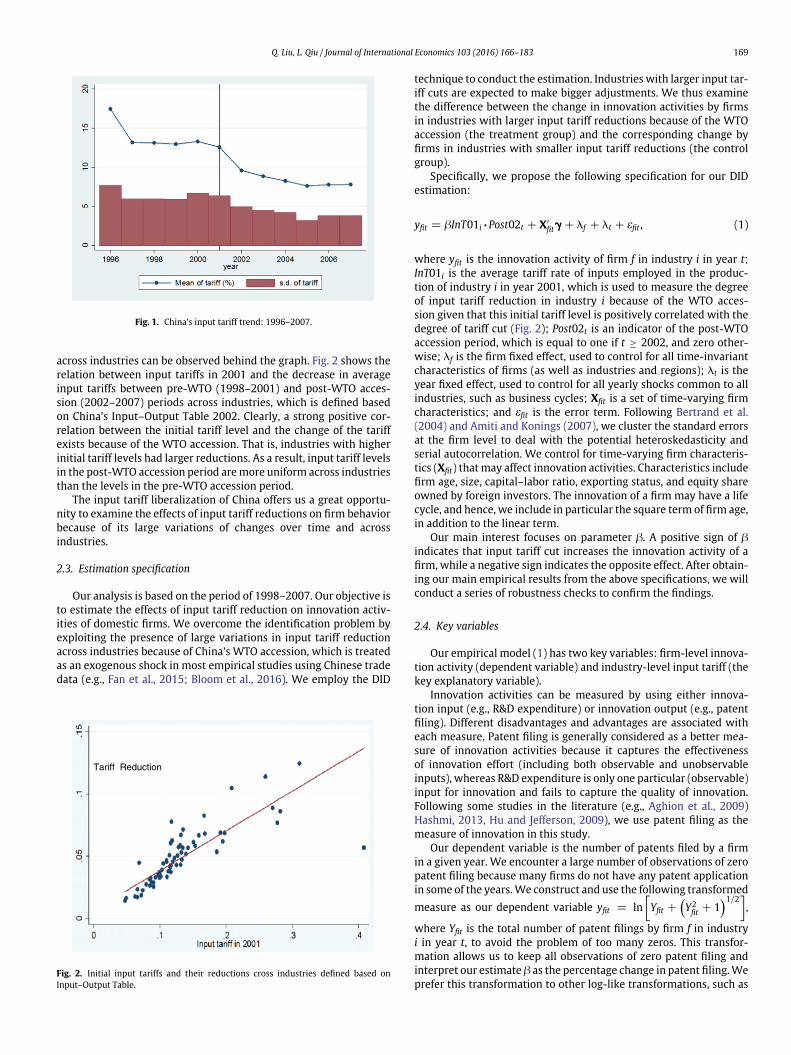
China began its economic reform and adopted an opening-doorpolicy in 1979. The economy was still very closed at the beginningof the reform period. Hence, to open up its economy, the Chinesegovernment introduced a series of trade liberalization policies,including decentralizing foreign trade decisions, allowing manufac-turing firms to engage directly in imports and exports, reducingimport and export controls, removing import quotas, and loweringtariff rates. With the aim to integrate fully into the global marketand make a strong commitment to trade liberalization, China beganpreparing its application for WTO entry in the late 1980s and waseventually accepted by the end of 2001. During the long negotia-tion period of WTO accession, China had unilaterally cut its tariffsmany times, and its tariff cut in 2002, right after the accession,was very drastic. China’s simple average tariff rates (including bothintermediate inputs and final goods) dropped from 42.9% in 1992 to26.6% in 1996, 17% in 2000, and 9.8% after the WTO accession.
Fig. 1 plots the time trend of China’s simple average input tariffsduring the period 1996–2007. The figure shows that tariff ratesdropped substantially in 1997, remained more or less unchangedduring 1997–2001, and started to decrease in 2002 until it reacheda steady state in 2005. While Fig. 1 shows the general pattern ofchanges in input tariffs from all industries, a clear heterogeneity
Q. Liu, L. Qiu / Journal of International Economics 103 (2016) 166–183 169
Fig. 1. China’s input tariff trend: 1996–2007.
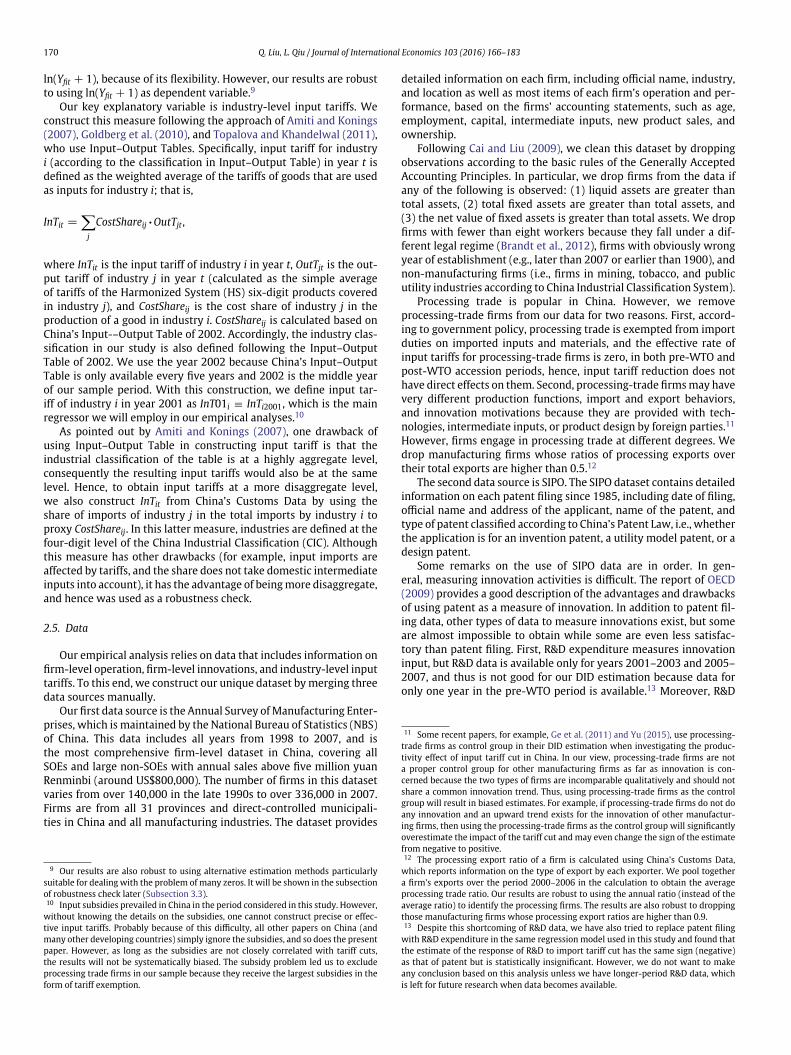
across industries can be observed behind the graph. Fig. 2 shows therelation between input tariffs in 2001 and the decrease in averageinput tariffs between pre-WTO (1998–2001) and post-WTO acces-sion (2002–2007) periods across industries, which is defined basedon China’s Input–Output Table 2002. Clearly, a strong positive cor-relation between the initial tariff level and the change of the tariffexists because of the WTO accession. That is, industries with higherinitial tariff levels had larger reductions. As a result, input tariff levelsin the post-WTO accession period are more uniform across industriesthan the levels in the pre-WTO accession period.
The input tariff liberalization of China offers us a great opportu-nity to examine the effects of input tariff reductions on firm behaviorbecause of its large variations of changes over time and acrossindustries.
2.3. Estimation specification
Our analysis is based on the period of 1998–2007. Our objective isto estimate the effects of input tariff reduction on innovation activ-ities of domestic firms. We overcome the identification problem byexploiting the presence of large variations in input tariff reductionacross industries because of China’s WTO accession, which is treatedas an exogenous shock in most empirical studies using Chinese tradedata (e.g., Fan et al., 2015; Bloom et al., 2016). We employ the DID
Tariff Reduction
Fig. 2. Initial input tariffs and their reductions cross industries defined based onInput–Output Table.
technique to conduct the estimation. Industries with larger input tar-iff cuts are expected to make bigger adjustments. We thus examinethe difference between the change in innovation activities by firmsin industries with larger input tariff reductions because of the WTOaccession (the treatment group) and the corresponding change byfirms in industries with smaller input tariff reductions (the controlgroup).
Specifically, we propose the following specification for our DIDestimation:
yfit = bInT01i • Post02t + X′fitc + kf + kt + efit , (1)
where yfit is the innovation activity of firm f in industry i in year t;InT01i is the average tariff rate of inputs employed in the produc-tion of industry i in year 2001, which is used to measure the degreeof input tariff reduction in industry i because of the WTO acces-sion given that this initial tariff level is positively correlated with thedegree of tariff cut (Fig. 2); Post02t is an indicator of the post-WTOaccession period, which is equal to one if t ≥ 2002, and zero other-wise; kf is the firm fixed effect, used to control for all time-invariantcharacteristics of firms (as well as industries and regions); kt is theyear fixed effect, used to control for all yearly shocks common to allindustries, such as business cycles; Xfit is a set of time-varying firmcharacteristics; and efit is the error term. Following Bertrand et al.(2004) and Amiti and Konings (2007), we cluster the standard errorsat the firm level to deal with the potential heteroskedasticity andserial autocorrelation. We control for time-varying firm characteris-tics (Xfit) that may affect innovation activities. Characteristics includefirm age, size, capital–labor ratio, exporting status, and equity shareowned by foreign investors. The innovation of a firm may have a lifecycle, and hence, we include in particular the square term of firm age,in addition to the linear term.
Our main interest focuses on parameter b. A positive sign of b
indicates that input tariff cut increases the innovation activity of afirm, while a negative sign indicates the opposite effect. After obtain-ing our main empirical results from the above specifications, we willconduct a series of robustness checks to confirm the findings.
2.4. Key variables
Our empirical model (1) has two key variables: firm-level innova-tion activity (dependent variable) and industry-level input tariff (thekey explanatory variable).
Innovation activities can be measured by using either innova-tion input (e.g., R&D expenditure) or innovation output (e.g., patentfiling). Different disadvantages and advantages are associated witheach measure. Patent filing is generally considered as a better mea-sure of innovation activities because it captures the effectivenessof innovation effort (including both observable and unobservableinputs), whereas R&D expenditure is only one particular (observable)input for innovation and fails to capture the quality of innovation.Following some studies in the literature (e.g., Aghion et al., 2009)Hashmi, 2013, Hu and Jefferson, 2009), we use patent filing as themeasure of innovation in this study.
Our dependent variable is the number of patents filed by a firmin a given year. We encounter a large number of observations of zeropatent filing because many firms do not have any patent applicationin some of the years. We construct and use the following transformed
measure as our dependent variable yfit = ln[
Yfit +(
Y2fit + 1
)1/2]
,
where Yfit is the total number of patent filings by firm f in industryi in year t, to avoid the problem of too many zeros. This transfor-mation allows us to keep all observations of zero patent filing andinterpret our estimate b as the percentage change in patent filing. Weprefer this transformation to other log-like transformations, such as
170 Q. Liu, L. Qiu / Journal of International Economics 103 (2016) 166–183
ln(Yfit + 1), because of its flexibility. However, our results are robustto using ln(Yfit + 1) as dependent variable.9
Our key explanatory variable is industry-level input tariffs. Weconstruct this measure following the approach of Amiti and Konings(2007), Goldberg et al. (2010), and Topalova and Khandelwal (2011),who use Input–Output Tables. Specifically, input tariff for industryi (according to the classification in Input–Output Table) in year t isdefined as the weighted average of the tariffs of goods that are usedas inputs for industry i; that is,
InTit =∑
j
CostShareij • OutTjt ,
where InTit is the input tariff of industry i in year t, OutTjt is the out-put tariff of industry j in year t (calculated as the simple averageof tariffs of the Harmonized System (HS) six-digit products coveredin industry j), and CostShareij is the cost share of industry j in theproduction of a good in industry i. CostShareij is calculated based onChina’s Input-–Output Table of 2002. Accordingly, the industry clas-sification in our study is also defined following the Input–OutputTable of 2002. We use the year 2002 because China’s Input–OutputTable is only available every five years and 2002 is the middle yearof our sample period. With this construction, we define input tar-iff of industry i in year 2001 as InT01i ≡ InTi2001, which is the mainregressor we will employ in our empirical analyses.10
As pointed out by Amiti and Konings (2007), one drawback ofusing Input–Output Table in constructing input tariff is that theindustrial classification of the table is at a highly aggregate level,consequently the resulting input tariffs would also be at the samelevel. Hence, to obtain input tariffs at a more disaggregate level,we also construct InTit from China’s Customs Data by using theshare of imports of industry j in the total imports by industry i toproxy CostShareij. In this latter measure, industries are defined at thefour-digit level of the China Industrial Classification (CIC). Althoughthis measure has other drawbacks (for example, input imports areaffected by tariffs, and the share does not take domestic intermediateinputs into account), it has the advantage of being more disaggregate,and hence was used as a robustness check.
2.5. Data
Our empirical analysis relies on data that includes information onfirm-level operation, firm-level innovations, and industry-level inputtariffs. To this end, we construct our unique dataset by merging threedata sources manually.
Our first data source is the Annual Survey of Manufacturing Enter-prises, which is maintained by the National Bureau of Statistics (NBS)of China. This data includes all years from 1998 to 2007, and isthe most comprehensive firm-level dataset in China, covering allSOEs and large non-SOEs with annual sales above five million yuanRenminbi (around US$800,000). The number of firms in this datasetvaries from over 140,000 in the late 1990s to over 336,000 in 2007.Firms are from all 31 provinces and direct-controlled municipali-ties in China and all manufacturing industries. The dataset provides
9 Our results are also robust to using alternative estimation methods particularlysuitable for dealing with the problem of many zeros. It will be shown in the subsectionof robustness check later (Subsection 3.3).10 Input subsidies prevailed in China in the period considered in this study. However,
without knowing the details on the subsidies, one cannot construct precise or effec-tive input tariffs. Probably because of this difficulty, all other papers on China (andmany other developing countries) simply ignore the subsidies, and so does the presentpaper. However, as long as the subsidies are not closely correlated with tariff cuts,the results will not be systematically biased. The subsidy problem led us to excludeprocessing trade firms in our sample because they receive the largest subsidies in theform of tariff exemption.
detailed information on each firm, including official name, industry,and location as well as most items of each firm’s operation and per-formance, based on the firms’ accounting statements, such as age,employment, capital, intermediate inputs, new product sales, andownership.
Following Cai and Liu (2009), we clean this dataset by droppingobservations according to the basic rules of the Generally AcceptedAccounting Principles. In particular, we drop firms from the data ifany of the following is observed: (1) liquid assets are greater thantotal assets, (2) total fixed assets are greater than total assets, and(3) the net value of fixed assets is greater than total assets. We dropfirms with fewer than eight workers because they fall under a dif-ferent legal regime (Brandt et al., 2012), firms with obviously wrongyear of establishment (e.g., later than 2007 or earlier than 1900), andnon-manufacturing firms (i.e., firms in mining, tobacco, and publicutility industries according to China Industrial Classification System).
Processing trade is popular in China. However, we removeprocessing-trade firms from our data for two reasons. First, accord-ing to government policy, processing trade is exempted from importduties on imported inputs and materials, and the effective rate ofinput tariffs for processing-trade firms is zero, in both pre-WTO andpost-WTO accession periods, hence, input tariff reduction does nothave direct effects on them. Second, processing-trade firms may havevery different production functions, import and export behaviors,and innovation motivations because they are provided with tech-nologies, intermediate inputs, or product design by foreign parties.11
However, firms engage in processing trade at different degrees. Wedrop manufacturing firms whose ratios of processing exports overtheir total exports are higher than 0.5.12
The second data source is SIPO. The SIPO dataset contains detailedinformation on each patent filing since 1985, including date of filing,official name and address of the applicant, name of the patent, andtype of patent classified according to China’s Patent Law, i.e., whetherthe application is for an invention patent, a utility model patent, or adesign patent.
Some remarks on the use of SIPO data are in order. In gen-eral, measuring innovation activities is difficult. The report of OECD(2009) provides a good description of the advantages and drawbacksof using patent as a measure of innovation. In addition to patent fil-ing data, other types of data to measure innovations exist, but someare almost impossible to obtain while some are even less satisfac-tory than patent filing. First, R&D expenditure measures innovationinput, but R&D data is available only for years 2001–2003 and 2005–2007, and thus is not good for our DID estimation because data foronly one year in the pre-WTO period is available.13 Moreover, R&D
11 Some recent papers, for example, Ge et al. (2011) and Yu (2015), use processing-trade firms as control group in their DID estimation when investigating the produc-tivity effect of input tariff cut in China. In our view, processing-trade firms are nota proper control group for other manufacturing firms as far as innovation is con-cerned because the two types of firms are incomparable qualitatively and should notshare a common innovation trend. Thus, using processing-trade firms as the controlgroup will result in biased estimates. For example, if processing-trade firms do not doany innovation and an upward trend exists for the innovation of other manufactur-ing firms, then using the processing-trade firms as the control group will significantlyoverestimate the impact of the tariff cut and may even change the sign of the estimatefrom negative to positive.12 The processing export ratio of a firm is calculated using China’s Customs Data,
which reports information on the type of export by each exporter. We pool togethera firm’s exports over the period 2000–2006 in the calculation to obtain the averageprocessing trade ratio. Our results are robust to using the annual ratio (instead of theaverage ratio) to identify the processing firms. The results are also robust to droppingthose manufacturing firms whose processing export ratios are higher than 0.9.13 Despite this shortcoming of R&D data, we have also tried to replace patent filing
with R&D expenditure in the same regression model used in this study and found thatthe estimate of the response of R&D to import tariff cut has the same sign (negative)as that of patent but is statistically insignificant. However, we do not want to makeany conclusion based on this analysis unless we have longer-period R&D data, whichis left for future research when data becomes available.
Q. Liu, L. Qiu / Journal of International Economics 103 (2016) 166–183 171
data can also be severely distorted when various subsidy schemesare provided, which is the case in China. It is true that patent filingactivities could be distorted by government policies, but the matteris the relative degrees. As for incentive for patent, Li (2012) providesa description of various policy initiatives at regional levels such aspatent subsidy programs. The most important part of the subsidyprograms is subsidizing patent filings, which varies across regions,but it is on average around just a few hundred RMB (Chinese cur-rency unit, around RMB6.7 per USD at the present) per patent filing.In contrast, there is huge incentive for R&D. For example, companiesclassified as High and New Technology Enterprise can get a corpo-rate income tax (CIT) rate cutting from the standard rate 25% down toonly 15%. In addition, companies that meet the government’s criteriacan get 150% of eligible R&D expenses deducted before CIT. Accord-ing to PWC (2015), slight change in R&D behavior might result inmore eligible R&D tax benefits. Hence, we expect that distortion ofR&D data is much severer than patent data.14
Second, China’s patent filing and/or granting abroad is a goodalternative because it may reflect more genius innovation, asargued by Holmes et al. (2015). Such data can be found in WIPOdataset. However, linking the WIPO data to the NBS data is almostimpossible.15 In fact, at the aggregate level, we find that the ratioof total patents applied abroad by Chinese residents over all patentsapplied by Chinese residents is very stable over time and very small(only a few hundreds per year in the late-1990s), ranging from min-imum 3.50% to 5.70% over the period 1999–2013, with an average4.66%. Moreover, Wunsch-Vincent et al. (2015) show that China’sforeign patents are concentrated in a few technology fields and in afew firms, mostly in the information technology sector. Hence, usingthese data in our study would not be of high value.
We match NBS and SIPO data using common informationincluded in both datasets. Specifically, we merge the two datasetsusing the official names of firms, and then double-check the matchedoutcomes using location information of the firms. Our matching out-come is reasonably good, for two reasons. First, according to a reportby NBS, about 8.8% of manufacturing firms in China applied forpatents during 2004–2006. During the same period, the number offirms in our matched dataset constitutes about 4% of the total num-ber of firms in the NBS dataset. This is a reasonably good match, giventhat the NBS dataset is very large (with more than 1.3 million obser-vations after cleaning). Second, our matching technique is based onthe names and location of firms, and we use the same techniquefor all industries and for the whole sample period (before and afterWTO accession). Therefore, the degree of mismatch across indus-tries does not appear to be correlated with the degree of input tariffreduction across industries. This alleviates considerably the potentialestimation biases arising from the matching process.
Our third data source is the World Integrated Trade Solution(WITS) database, which is maintained by the World Bank, and con-tains tariff data at the HS six-digit level.16 The data are given atdifferent HS versions over the years, and hence, we convert themto the HS02 version using the UN Statistics Division ConcordanceTable. We calculate industrial-level input tariffs by using this datasettogether with the 2002 Input–Output Table of China.
We construct our unique dataset by merging the three databases.The matched dataset has an unbalanced panel of 337,257 firms and
14 There is an ongoing debate on the correlation between R&D and patents in China.Hu and Jefferson (2009) find weak linkage between patent and R&D, but Dang andMotohashi (2015) argue that patent count is correlated with R&D input and financialoutput and so patent statistics are meaningful indicators of innovations. Following thisdebate, we also check the relationship between firms’ R&D expenditure and patentsbased on our sample. We find that firms’ R&D investment increases their patent filings.15 The two datasets have no common identifier; WIPO contains English names only
while NBS contains Chinese names only.16 WITS does not provide 2002 data and we obtain 2002 data from WTO.
a total of around 1.3 million observations, with both detailed patentfiling information and firm characteristics during the period of 1998–2007. Our analyses are based on this unique dataset.
In the robustness checks, we need to identify the processingtrade status of firms (that is, whether or not the firm is a process-ing trade firm) and their importing status (that is, whether or notthe firm imports inputs directly or not), which requires informationfrom another data source, that is, China’s Customs Data (2000–2006).Hence, we also merge Customs data with NBS data by using thesame method as Yu (2015). The Customs data contains most detailedinformation of each international trade transaction conducted byChinese firms, including product code at HS six-digit level, value andquantity. This data also allows us to do our mechanism test.
Ge et al. (2011) and Yu (2015) use the merged Customs and NBSdata in their studies, whereas we use it only for robustness check.Specifically, they confine their analyses to manufacturing firms thatalso make direct imports, which we call direct importers. Theirstudies omit a large number of manufacturing firms that do notmake direct imports, which we call non-importers. However, non-importers may buy imported inputs from intermediaries and employthese inputs in their production. As pointed out by Goldberg et al.(2010), using the sample of direct importers may result in a bias. Inthe main analysis of our study, we use the entire NBS dataset. There-fore, our analysis will provide a more complete picture of how inputtariff cut affects the innovation of firms.17
Table 1 presents the summary statistics and definitions of themain variables used in this study. Overall, a Chinese manufactur-ing firm applied for 0.15 patents per year on average, and thepatent applications increased significantly from the pre-WTO tothe post-WTO accession period. Input and output tariffs decreasedsignificantly because of WTO accession. Almost all firm-level perfor-mances and industrial characteristics were improved. The degree ofindustrial competition also increased after 2001.
One potential concern is whether our key explanatory variable,the 2001 input tariff levels, is exogenous to individual firms. Thisconcern is generally legitimate, but is alleviated here by the obser-vation on the actual liberalization process in China. As shown inFig. 1, both mean tariff rate and standard deviation remained con-stant in the 1998–2001 period. This feature implies that the stabilityof tariffs holds not only for industry average, but also for individualindustries. Thus, the input tariffs in 2001 were largely determinedby the previous round of liberalization in 1997. That is, tariff rates in2001 are pre-determined before our sample period and do not appearto be affected by innovation activities during the pre-WTO acces-sion period. This finding can be confirmed by the data. FollowingGoldberg et al. (2010), we regress industrial innovation activities inthe pre-WTO accession period on tariff rates in 2001 and find thattariff rates in 2001 are uncorrelated with innovation activities (seecolumn 1 of Table 2). As shown in Table 2 (columns 2–5), other indus-trial performances are also not correlated with the 2001 input tariffrates. This independence result also holds for actual input tariff cutsfrom the WTO accession (instead of initial tariff rates in 2001), asshown by columns 6–10 of Table 2. This observation implies thateither the users of imported inputs did not engage in serious lob-bying activities during 1998–2001, or lobbying by users of importedinputs was not effective.
Timing of China’s accession to WTO is regarded commonly as anexogenous shock at least to individual firms. Hence, a number of
17 A related problem of using the whole sample is that some non-importers may notuse any imported inputs. This possibility may bias the impact of intermediate inputimports downwards. We do find stronger impact on importers than on non-importers,as shown in Subsection 3.4.

172 Q. Liu, L. Qiu / Journal of International Economics 103 (2016) 166–183
Table 1Summary statistics.
Variables All Pre-WTO Post-WTO Difference Definition
(1) (2) (3) (3) − (2)
Patent 0.1507 0.0698 0.1787 0.1089 Total no. of patents(0.0089) (0.0037) (0.0120) (0.0205)
Invention 0.0465 0.0073 0.0601 0.0528 No. of invention patents(0.0080) (0.0015) (0.0107) (0.0183)
Utility 0.0467 0.0225 0.0551 0.0326 No. of utility patents(0.0012) (0.0013) (0.0015) (0.0027)
Design 0.0574 0.0400 0.0634 0.0234 No. of design patents(0.0016) (0.0021) (0.0020) (0.0037)
Input tariff 0.0996 0.1285 0.0821 −0.0464 Industrial input tariff(0.0009) (0.0016) (0.0009) (0.0017)
Age 10.1022 13.7903 8.8264 −4.9639 Firm age(0.0102) (0.0249) (0.0103) (0.0228)
Age squared 234.0097 393.7576 178.7502 −215.0074 Firm age squared(0.5156) (1.3160) (0.5117) (1.1645)
Exporting 0.2784 0.2651 0.2830 0.0179 Firm exporting status indicator(0.0004) (0.0008) (0.0005) (0.0009)
Labor 4.7841 5.0096 4.7062 −0.3035 Log of firm employment(0.0010) (0.0020) (0.0011) (0.0022)
Capital/labor 3.2936 3.0529 3.3764 0.3235 Log of capital–labor ratio(0.0012) (0.0024) (0.0014) (0.0028)
Foreign share 0.0641 0.0518 0.0683 0.0164 Foreign share holding(0.0002) (0.0003) (0.0002) (0.0005)
TFP 2.4688 2.2031 2.5610 0.3579 Firm productivity(0.0011) (0.0021) (0.0012) (0.0024)
Output tariff 0.1328 0.1700 0.1102 −0.0598 Industrial output tariff(0.0016) (0.0030) (0.0016) (0.0031)
SOE share 0.1672 0.2863 0.0949 −0.1914 Share of SOEs(0.0032) (0.0055) (0.0028) (0.0056)
FIE no. 3.7195 3.3805 3.9209 0.5405 Logarithm of no. of FIEs(0.0270) (0.0439) (0.0334) (0.0550)
HHI 0.0520 0.0547 0.0504 −0.0043 Herfindahl–Hirschman index(0.0015) (0.0025) (0.0019) (0.0031)
Standard errors in parentheses.
studies such as Fan et al. (2015) and Bloom et al. (2016) use it asan exogenous variable to proxy China’s trade liberalization. We alsotake this approach.
3. Empirical analysis and findings
3.1. Main results
Table 3 presents the regression results based on our DID spec-ification (1), with control variables introduced step by step. Allestimations show that input tariff reduction leads to a decline in inno-vation of firms. In column 1, with only firm fixed effect and year
fixed effect being controlled for, we find a statistically significantand negative estimate for InT01i • Post02t. The negative sign indicatesthat after China’s WTO accession, firms in industries which face alarger cut in input tariffs (higher InT01i) undertake less innovation. Incolumn 2, we include several time-varying firm characteristics thatmay influence innovation activities, such as age, size, capital–laborratio, export status, and equity share owned by foreign investors.Evidently, the negative effect of input tariff reduction on innovationis very robust to these additional controls. As for the effects of thecontrol variables, we find that firms having a shorter history, largeremployment, or higher capital–labor ratio have more innovations.Exporters also have more innovations than non-exporters, which is
Table 2Correlation between input tariff and pre-WTO industrial.
(1) (2) (3) (4) (5)
Variables ln(patent) Output Output share of domestic firms Value-add per capita Capital–labor ratio
Input tariff in 2001 −1.6748 −0.0636 −0.0072 0.0357 −0.1041(1.2713) (0.1118) (0.0353) (0.0776) (0.0897)
Observations 280 280 280 280 280R-squared 0.0058 0.0010 0.0002 0.0007 0.0031
(6) (7) (8) (9) (10)
Decrease in input tariff 0.2204 0.3833 −0.0130 0.0211 −0.1451(3.3125) (0.3449) (0.0841) (0.1807) (0.2786)
Observations 280 280 280 280 280R-squared 0.0000 0.0047 0.0001 0.0000 0.0008
The dependent variable in each column is the growth rate of the corresponding industrial performance during 1998–2001. Robust standard errors in parentheses.

Q. Liu, L. Qiu / Journal of International Economics 103 (2016) 166–183 173
consistent with the findings in the literature (e.g., Baldwin and Gu,2004). However, the effect of foreign ownership is not statisticallysignificant. As shown below (in columns 3–8), these findings are alsorobust after we introduce other control variables and use alternativemeasures of the key explanatory variable.
China’s WTO accession brings changes in both input and outputtariffs. Output tariff change may affect market competition in China,and consequently influence innovation incentives of firms. In column3, we add a control for industrial output tariff OutTit. We find thatthe estimate of InT01i • Post02t is still negative and statistically signif-icant with a very similar magnitude as in columns 1–2. The effect ofoutput tariff on innovation is statistically insignificant, which holdseven when we introduce additional control variables and use alter-native measures of the key explanatory variable (in columns 5–8).18
That is, input tariff liberalization has a stronger effect on firm inno-vation than output tariff liberalization. This comparison is similarto the findings in the literature that focus on firm productivity. Forexample, Amiti and Konings (2007) disentangle the effect of inputtariff reduction from that of output tariff reduction and find thatinput tariff effect is at least twice as high as the output tariff effect inIndonesia.
If there exist any policy reforms introduced in China around thetime of the WTO accession which may affect our treatment and con-trol groups differently, then the effects of those policy reforms mayalso be captured in the DID estimates. In that case, the regressionresult from Eq. (1) will not be the pure effect of input tariff cuts.Indeed, two important reforms took place in the early 2000s: the SOEreform and the relaxation of FDI entry regulations. These reformswere on-going reforms that had started in the 1980s and 1990s,respectively, and accelerated after the WTO accession. The SOEreform resulted in a large-scale privatization, close-down of smallSOEs, and an improvement in the efficiency of surviving (large) SOEs.The new FDI regulations relaxed the entry requirements for foreigninvestors and reduced the range of industries restricted to foreigninvestment. These reforms may not have differentiated effects onthe treatment and control groups. However, to control for any pos-sible confounding effects from these two policy reforms, we includetwo additional control variables in our DID estimation: SoeShareit
(the ratio of the number of SOEs over the total number of domes-tic firms) and FDIit (the logarithm of the number of foreign investedfirms). The regression result (column 4) indicates that the negativeeffect of input tariff reduction on innovation is still present. Firmsin industries with higher SOE shares tend to undertake less innova-tion, possibly because SOEs undertake less innovation on average,or the presence of SOEs in the market crowds out innovation activ-ities of private firms. However, the presence of foreign firms has nosignificant effect on innovation activities of the domestic firms.
Thus far, we have used input tariff rates of 2001, InT01i, to repre-sent the degrees of tariff liberalization from China’s WTO accession.19
We have strong reasons for using this measure as the key explana-tory variable instead of yearly input tariff rates or actual input tariffreduction to interact with Post02t. First, the schedule of tariff reduc-tions upon WTO accession was released in 2002, and the schedulemay be endogenous; hence, the phase-out process could be exploitedby firms (Guadalupe and Wulf, 2010). Second, initial input tariffsare pre-determined in China. For this reason, in their analysis, Amitiand Konings (2007) also employ initial tariffs as the instrument for
18 How import competition in final goods affects innovation is a different topics.Bloom et al. (2016) provide a good review of this line of study and their own empiri-cal study finds that trade liberalization that leads to more Chinese imports in Europeincreases innovations of European firms. As the effect depends on the sources of com-petition, i.e., origin of the exporting countries, our finding (insignificant result) merelyrepresents the average effect of output tariff reduction.19 Using the average tariffs over 1998–2001 or tariffs in 1998 generates similar
results. The results are available upon request.
actual tariff changes. However, even though our choice of InT01i iswell justified, we still want to check whether the results will be qual-itatively different if these alternative measures are used. We firstreplace InT01i with actual input tariff changes, denoted as DInTi.We define DInTi = InTi1998–2001 − InTi2002–2007, where InTi1998–2001 isthe average input tariff over the period 1998–2001, and InTi2002–2007is the average input tariff over the period 2002–2007. In column5, we run the regression by replacing InT01i • Post02t in model(1) with DInTi • Post02t. The effect of input tariff reduction is stillstatistically significant, negative, and even stronger than that usingInT01i. We then run simple OLS regression with yearly input tarifflevels, denoted as InTit, as key regressor, i.e., replacing InT01i • Post02t
in model (1) with InTit. Column 6 shows the regression results. Thecoefficient of InTit is positive and statistically significant, indicatingthat lower input tariffs lead to significantly less innovation. Bothresults are qualitatively consistent with our main DID estimations.
We followed a common practice in literature (e.g., Goldberg etal., 2010) to calculate industry-level input tariff using China’s Input–Output Table. However, as pointed out earlier, such an approachis restrictive as the obtained input tariffs are available only at ahighly aggregate level. We need to find a way that does not rely onInput–Output Table to obtain input tariffs at a finer level of industrydisaggregation. The approach we take is to calculate the weightedaverage industry-level input tariffs at the CIC 4-digit level, denoted asInTA01i, by using the import share constructed from Customs data asweights instead of using the cost share constructed from the Input–Output Table. We replace InT01i by InTA01i to run the regressionwith this new InTA01i. The results are reported in column 7. Theeffect of input tariff reduction on innovation remains negative andstatistically significant.
While industry-level input tariff is commonly used to proxy tradeliberalization, a firm’s production and corresponding decisions willnot be affected by a change in tariffs of some intermediate inputs thatthe firm does not use in its production. For this reason, using firmspecific (or firm-level) input tariff is desirable, i.e., only consideringtariffs relevant to the firm. We follow Yu (2015) in calculating theweighted input tariff for each firm (FIT01i), where the firm’s importof each input in the initial year is used to construct the weight.20
However, this approach applies to direct importers only. For non-importers, we use the average of firm-specific input tariffs (of directimporters) in each CIC four-digit industry for all of these firms inthe same industry. In contrast, we drop all processing firms. We usethe average pre-WTO firm-specific tariffs (i.e., firm-specific tariffs in2000 and 2001) as the initial tariffs to keep as many observationswith firm-specific tariffs as possible. With firm-specific tariffs, werun the regression using FIT01i • Post02t to replace InT01i • Post02t asregressor of interest. The results are reported in column 8 of Table 3.The main results are robust.21
In summary, we find that input tariff cut reduces innovation ofthe firms. This finding is statistically significant and robust to vari-ous model specifications and input tariff measures. The effect is alsoeconomically significant. For example, with the estimated coefficient(−0.2847) in the specification with actual tariff cut as key regressor(column 5), the average 4.64% input tariff cut because of China’s WTOaccession reduces the patent filings of firms by 0.0132. This decreaseis quite significant because the average patent filings of the entire
20 See Yu (2015) for details of the construction.21 However, in this approach the direct importers account for only about 1% of the
firms in our whole sample. This sample of direct importers is so small because thesefirms must exist and directly imports in year 2000 or 2001 (while there are many newentries after 2001), and many Chinese firms use imported intermediate inputs throughintermediaries or trade companies. For example, our sample shows that during 2000–2006 22.73% of Chinese ordinary imports are conducted by intermediaries. Thus, webelieve that it is not representative to use the tariff of these 1% firms in the mainanalysis.

174 Q. Liu, L. Qiu / Journal of International Economics 103 (2016) 166–183
Table 3Basic results.
(1) (2) (3) (4) (5) (6) (7) (8)
Variables ln(patent) ln(patent) ln(patent) ln(patent) ln(patent) ln(patent) ln(patent) ln(patent)
InT01 ∗ Post02 −0.1555∗∗∗ −0.1561∗∗∗ −0.1516∗∗∗ −0.1886∗∗∗
(0.0189) (0.0190) (0.0194) (0.0203)DInT ∗ Post02 −0.2847∗∗∗
(0.0549)Input tariff 0.1853∗∗∗
(0.0405)InTA01 ∗ Post02 −0.0286∗∗
(0.0116)FIT01 ∗ Post02 −0.0231∗∗
(0.0109)
Firm controlsAge −0.0014∗∗∗ −0.0014∗∗∗ −0.0011∗∗∗ −0.0011∗∗∗ −0.0011∗∗∗ −0.0011∗∗∗ −0.0008∗∗∗
(0.0003) (0.0003) (0.0002) (0.0002) (0.0002) (0.0003) (0.0002)Age squared 0.0000∗∗∗ 0.0000∗∗∗ 0.0000∗∗∗ 0.0000∗∗∗ 0.0000∗∗∗ 0.0000∗∗∗ 0.0000∗∗∗
(0.0000) (0.0000) (0.0000) (0.0000) (0.0000) (0.0000) (0.0000)Exporting 0.0110∗∗∗ 0.0110∗∗∗ 0.0109∗∗∗ 0.0109∗∗∗ 0.0109∗∗∗ 0.0109∗∗∗ 0.0107∗∗∗
(0.0016) (0.0016) (0.0016) (0.0016) (0.0016) (0.0017) (0.0018)ln(Labor) 0.0225∗∗∗ 0.0225∗∗∗ 0.0228∗∗∗ 0.0228∗∗∗ 0.0228∗∗∗ 0.0214∗∗∗ 0.0196∗∗∗
(0.0011) (0.0011) (0.0011) (0.0011) (0.0011) (0.0011) (0.0011)ln(Capital/labor) 0.0047∗∗∗ 0.0047∗∗∗ 0.0047∗∗∗ 0.0047∗∗∗ 0.0047∗∗∗ 0.0044∗∗∗ 0.0039∗∗∗
(0.0005) (0.0005) (0.0005) (0.0005) (0.0005) (0.0005) (0.0005)Foreign share −0.0010 −0.0010 −0.0012 −0.0012 −0.0013 −0.0022 0.0002
(0.0035) (0.0035) (0.0035) (0.0035) (0.0035) (0.0037) (0.0046)
Industrial controlsOutput tariff 0.0151 −0.0024 0.0039 −0.0090 0.0172 0.0148
(0.0132) (0.0133) (0.0133) (0.0147) (0.0135) (0.0132)SOE no. −0.0889∗∗∗ −0.0785∗∗∗ −0.0781∗∗∗ −0.0712∗∗∗ −0.0653∗∗∗
(0.0114) (0.0111) (0.0111) (0.0117) (0.0114)FIE no. 0.0006 0.0010 0.0004 0.0007 0.0007
(0.0010) (0.0010) (0.0010) (0.0011) (0.0011)Firm FE Y Y Y Y Y Y Y YYear FE Y Y Y Y Y Y Y YObservations 1,280,731 1,270,473 1,270,473 1,268,326 1,268,326 1,268,326 1,162,812 1,084,519R-squared 0.5117 0.5132 0.5132 0.5141 0.5140 0.5140 0.5149 0.5078
Robust standard errors clustered at firm in parentheses.∗∗∗ p < 0.01.∗∗ p < 0.05.
sample are 0.1507. That is, patent filings of firms drop by 8.76% as aresult of input tariff liberalization.
3.2. Validity of the DID specifications
The reliability of our estimates, which are reported in Table 3,depends on the validity of our DID specifications. In this subsection,we conduct a series of validity checks. The new regression resultspresented in Table 4 confirm the validity of our specifications.
3.2.1. Flexible estimationIn our main DID regression model, we use a time dummy vari-
able, Post02t, to separate the pre-WTO and post-WTO accessionperiods. The estimate from the interaction term, InT01i × Post02t,yields the average treatment effect, which compares the differencebetween the treatment and control groups in their average differ-ences between the pre-WTO and post-WTO accession periods. Onedrawback of such an approach is that it does not consider year toyear changes. Hence, we now compare the difference between thetreatment and control groups for every year in the entire periodto remedy this weakness. Specifically, we use a flexible estimationspecification to replace the interaction term InT01i×Post02t in model(1) with a series of interaction terms between InT01i and the yeardummies, that is, InT01i × t with t indicating 1999 through 2007.We run this regression and report the results in column 1 of Table 4.The estimated coefficients are statistically insignificant for all yearsbefore 2001, but become negative and statistically significant for
every year from 2001 onwards. The magnitudes also become larger.These results clearly indicate the similarity between the two groupsbefore the WTO accession, the innovation-reducing effect of inputtariff cuts, and the increasing trend of the effect.
3.2.2. Industry-specific time trendIn the DID estimation, we assume that, conditional on(
X′fit ,kf ,kt
), innovation activities of the treatment and control
groups follow the same time trend. This assumption allows us touse innovation activities of the control group as the counterfactualof the treatment group in the post-WTO accession period. How-ever, innovation trends in different industries (or different groups)could be different because they may be affected by industry-specificconfounding factors. Normally, this issue can be dealt with by con-trolling for sector-year fixed effect, but cannot be done here becausethe key regressor (i.e., InT01i • Post02t) of our empirical model isdefined merely at industry-year level, which rules out the pos-sibility of including industry-year fixed effect in the regressions.Alternatively, to check whether unobserved industry-specific factorswould bias our estimates, we add an industry-specific linear timetrend, ki • t, to model (1). This addition enables us to control for allunobserved industry characteristics if they affect firm innovationin the form of a linear time trend. The regression result for the keyexplanatory variable is presented in column 2 of Table 4. The esti-mate is −0.1981, which is negative and statistically significant. Thus,our estimate is not driven by any unobserved industry trends.
Q. Liu, L. Qiu / Journal of International Economics 103 (2016) 166–183 175
Table 4Validity of the specifications.
(1) (2) (3) (4) (5)
Variables ln(patent) ln(patent) ln(patent) ln(patent) ln(patent)
Flexible Linear trend Pre-WTO Processing firms Processing firms
InT01 ∗ Post02 −0.1981∗∗∗ −0.3630 −0.2775(0.0215) (0.6725) (0.2099)
Input tariff −0.0485(0.0535)
InT01∗ Year1999 0.0263(0.0224)
InT01∗ Year2000 0.0101(0.0230)
InT01∗ Year2001 −0.0739∗∗∗
(0.0255)InT01∗ Year2002 −0.1275∗∗∗
(0.0272)InT01∗ Year2003 −0.1645∗∗∗
(0.0280)InT01∗ Year2004 −0.2133∗∗∗
(0.0313)InT01∗ Year2005 −0.2704∗∗∗
(0.0326)InT01∗ Year2006 −0.3414∗∗∗
(0.0335)InT01∗ Year2007 −0.3938∗∗∗
(0.0349)Firm controls Y Y Y Y YIndustrial controls Y Y Y Y YFirm FE Y Y Y Y YYear FE Y Y Y Y YObservations 1,268,326 1,268,326 323,879 89,316 131,293R-squared 0.5142 0.5141 0.6127 0.8145 0.6500
Robust standard errors clustered at firm in parentheses.∗∗∗ p < 0.01.
3.2.3. Placebo test I: pre-WTO accession periodFollowing Topalova (2010), we conduct our first placebo test to
examine the effect of input tariffs on firm innovation in the pre-WTO accession period (1998–2001). The premise is that becausetariffs did not change much during that period, we should not expectany significant effect of input tariffs on innovation; if the resultis the contrary, then it indicates the existence of some underlyingconfounding industrial factors (other than the WTO accession) thatdrive innovation. Accordingly, we replace InT01i • Post02t by InTit
in Eq. (1) and run the regression for the sample in the pre-WTOaccession period. The estimates are given in column 3 of Table 4.The effect of InTit is not statistically significant. Hence, we can ruleout the possibility that some underlying confounding factors driveinnovation.
3.2.4. Placebo test II: subsample of processing-trade firmsIn our second placebo test, we run the regression model (1) using
the subsample of processing-trade firms. As processing-trade firmsenjoy zero input tariff rate during the entire period, their inno-vation decisions should not be affected much by the input tariffliberalization from China’s WTO accession, and the estimation usingthe sample of processing-trade firms should produce an insignifi-cant liberalization effect. We use two criteria to define processing-trade firms. One includes all firms with average ratios of processingexports over total exports larger than 90%, and the other consistsof firms with average ratios larger than 50%. The processing exportratios are calculated based on the Chinese Customs Data.
The regression results are presented in columns 4 and 5 forthe 90% and 50% criteria, respectively. Clearly, the coefficient ofInT01i × Post02t in both cases is highly insignificant, confirming the
conjecture. This test suggests that manufacturing firms adjust theirinnovation activities in response to input tariff reduction after theWTO accession if, and only if, their imported inputs are actuallyaffected by tariff reduction.
3.3. Robustness checks
In this subsection, we further check the robustness of our resultsto address other concerns. Most of the results are presented inTable 5.
3.3.1. Industrial competitionThe fact that market competition affects innovation activities
is well known in innovation literature. In the main model, wehave taken into account changes in import competition resultingfrom China’s output tariff reduction. We further control for overallindustrial competition by including the Herfindahl–Hirschman Index(HHI) in the model. The new variable, HHIit, is the HHI for industryi in year t. Column 1 of Table 5 shows that our result is robust toincluding this competition variable.
3.3.2. Export opportunityWhile China undertook considerable trade liberalization during
the period of 1998–2007, trade liberalization also occurred in othercountries. When foreign countries lower their tariffs on Chineseproducts, the market opportunity for Chinese exporters is increased,which may also induce them to adjust their innovation decisions. Wehandle this issue in two ways. First, we control for the export expan-sion opportunity by adding a term of industry-level total exports,IndExpit. The regression results are reported in column 2 of Table 5.

176 Q. Liu, L. Qiu / Journal of International Economics 103 (2016) 166–183
Table 5Robustness checks.
(1) (2) (3) (4) (5) (6) (7) (8) (9)
ln(patent) ln(patent) ln(patent) ln(patent) ln(patent) ln(patent) ln(patent) ln(patent) ln(patent)
Sample All All Non-exporters Life-cycle Single-product Surviving firms Two-period TFP Initial size
InT01 ∗ Post02 −0.1887∗∗∗ −0.1851∗∗∗ −0.1151∗∗∗ −0.1971∗∗∗ −0.1737∗∗∗ −0.2000∗∗∗ −0.1627∗∗∗ −0.1919∗∗∗ −0.1776∗∗∗
(0.0203) (0.0205) (0.0185) (0.0227) (0.0210) (0.0203) (0.0273) (0.0212) (0.0202)HHI −0.0037
(0.0402)Total exports 0.0042∗∗∗
(0.0013)Length ∗Post02 −0.0087∗∗∗
(0.0031)Post02 0.0210∗∗∗
(0.0039)ln(Output/labor) 0.0131∗∗∗
(0.0007)Firm controls Y Y Y Y Y Y Y Y YIndustrial controls Y Y Y Y Y Y Y Y YFirm FE Y Y Y Y Y Y Y Y YYear FE Y Y Y Y Y Y Y YObservations 1,268,326 1,267,582 913,640 973,993 1,174,680 572,405 475,172 1,195,919 1,268,326R-squared 0.5141 0.5141 0.5110 0.5195 0.5100 0.4497 0.7913 0.5136 0.5156
Robust standard errors clustered at firm in parentheses. In column 9 we include a series of interaction terms between the initial labor size and year dummies.∗∗∗ p < 0.01.
We find a positive and significant effect of industry export on a firm’sinnovation activity (estimated coefficient 0.0042). More importantly,the estimate of our key variable, InT01i × Post02t, remains negativeand statistically significant. Second, to isolate the export expansioneffect, we run the regression using the subsample of non-exportingfirms. The results are reported in column 3 of the table. The mainresult also holds for this sub-group of firms.
3.3.3. Intellectual property rights (IPR) protectionIn the main analysis, we already controlled for SOE privatiza-
tion and FDI entry deregulation, which occurred during China’sWTO accession and could potentially affect the estimation. Anotherimportant policy change during the same period with even moreobvious effect on innovation was the strengthening of IPR protec-tion as required by TRIPS. One can argue that the average effectof TRIPS on innovation has already been controlled for by yeardummies, but we can still explore the policy’s differential effectsacross industries. As shown by Bilir (2014), the extent that an indus-try is affected by IPR changes is correlated with the length of theindustry life cycle. Inspired by this observation, we control for theindustry-differentiated effect of TRIPS by including the interactionterm between the length of product life cycle and post-WTO dummy,i.e., Ti • Post02t. The data of product life-cycle length can be obtainedfrom Bilir (2014), but we need to match the SIC industry code in Bilir(2014) with the CIC. As Bilir’s (2014) measure of product life-cyclelength is only available for a limited number of industries, a signifi-cant loss of observations will take place when we include this controlvariable.
Following Bilir (2014), in our test, we also use different measuresof product life-cycle length, i.e., the average life-cycle length,the life-cycle length based on the seventy-fifth and eighty-fifthpercentiles of each citation lag distribution, in our test. We reportthe result of the use of the average life-cycle length in column 4of Table 5. Our result is robust, and so are the results obtainedfrom the use of other length measures which are omitted in thetable.
3.3.4. Multi-product firmsMany firms produce multiple products that may span over dif-
ferent industries.22 Thus, our dependent variable (i.e., a firm’s totalnumber of patent filings) may cover many industries that experi-ence different degrees of input tariff cut. Thus, the analysis willlead to an imprecise estimation of the impact of input tariff cut onfirm innovation. Hence, to check whether our result is contaminatedby this problem, we restrict our analysis to a subsample of firmsthat produce products all belonging to the same 3-digit industry.23
We run regression (1) based on this subsample of “single-industry”firms and find that the effect of input tariff reductions on innovationremains negative and statistically significant, as shown in column 5of Table 5.24
3.3.5. Surviving firmsWe notice from the summary statistics in Table 1 the presence
of a decrease in average age of firms. This observation implies thata significant number of firms entered after 2001. From the data, wealso observe a significant number of firms exiting. If the new entrantsand/or exiting firms have different patenting behaviors, our earlierestimation results may also capture the selection effect, instead ofthe true effect of input tariff reductions. Hence, to check whether ourestimates are driven by entry and exit, we focus on a subsample ofsurviving firms (i.e., firms in both the pre- and post-WTO accessionperiods). Results are reported in column 6 of Table 5. We still findnegative effect of input tariff reductions and the magnitude becomes
22 Note that each firm reports one industry which it belongs to in the NBS surveyeven if it is a multi-product firm spanning many industries.23 We obtain product-level data from NBS of China for the period 2000–2006, which
contains information of each product (defined at the five-digit product level) producedby every firm. As product-level data and NBS data use the same firm identity, we caneasily match these two datasets and identify firms producing all goods within onlyone three-digit industry.24 Some firms may change location or industry affiliation over the sample period.
Though these firms are very few and we have controlled for firm fixed effects, weconduct regressions with the sample of firms without such a change, and find similarresults.

Q. Liu, L. Qiu / Journal of International Economics 103 (2016) 166–183 177
even larger, implying that the selection from entry and exit does notdrive our findings and if it dose, it causes a bias on our estimatedownwards at the most.
3.3.6. Two-period estimationThe DID estimation and resulting statistical inference crucially
depend on the accuracy of standard errors. In the main analysis, wefollowed Bertrand et al. (2004) to cluster standard errors at the firmlevel. As a robustness check, we use another approach, which is alsosuggested by Bertrand et al. (2004), to calculate the standard errors.In particular, we first collapse the panel structure into two periods(pre-WTO and post-WTO accession) and then use the White-robuststandard errors. The regression results are presented in column 7of Table 5. The results are qualitatively similar to the ones obtainedbefore.
3.3.7. Firm-level productivityFirms with different productivity levels may have different abil-
ities or incentives to conduct innovation. Recall that in the mainanalysis, we included firm fixed effects in all regressions, which con-trol for all firm-level time-invariant characteristics, including theinitial productivity and other factors (e.g., corporate culture) thatmay affect innovation. However, productivity changes over time.Hence, to further control for the effects of productivity on innova-tion, we also introduce contemporary productivity levels of the firmsto the model. In this robustness check, we use labor productivity(output/labor) to represent firm productivity. The new results arereported in column 8 of Table 5. Our key finding remains robust. Theresults also show that more productive firms are more innovative,which is consistent with the findings in literature.
3.3.8. Firm sizeFirms of different sizes may have different incentives to under-
take innovation because of different investment returns. Firms ofdifferent sizes may also have different innovation trends. Thus, tocheck whether introducing a control for the differential trends acrosssizes will affect our estimation, we add a series of interaction termsbetween the initial labor size (to capture firm size) and year dum-mies in our regression. The new results are reported in column 9of Table 5. We find that our key estimation is robust to this sizeconsideration.25
3.3.9. Alternative estimation methodsIn the main model, we use the OLS method to estimate the
effect of input tariff cut on firm innovation. Now, we check ourresults using alternative estimation methods. First, we use the Fixed-effect Poisson model. Column 1 of Table 6 reports the result (thecoefficients are incidence-rate ratios). We still obtain significantlynegative effect of input tariff cut on firm patent filings. However,only 98,868 observations (about 7.8% of the whole sample) remainin the regression because all firms with just one observation or firmswith all zero outcomes are dropped automatically in such nonlinearregressions for panel data. Second, to remedy the severe data lossproblem associated with the Fixed-effect Poisson model, we also usethe Random-effect Poisson model, which keeps all observations. Weobtain very similar results, as shown in column 2 of Table 6.
Third, firms may make innovation decisions in a sequential man-ner, that is, they first decide whether to innovate and then howmuch to innovate. In this case, a two-step selection model is moreappropriate. We check whether our results are robust to this two-step selection model estimation, and to do so requires an excluded
25 Note that in column 9 of the table, we do not report the estimates of the newlyintroduced interaction terms; for otherwise, the table will be too long. Our regressionresult shows that all these interaction terms are positive and statistically significant,implying that larger firms are always more innovative.
variable that affects firms’ decision on whether to innovate but notaffect firms’ decision on how much to innovate. Following Sanyal andGhosh (2013), we use each firm’s patent stock since 1995 (denotedby lnpatentr95) as exclusion restriction in the first step Fixed-effectLogit regression, with patenting indicator as dependent variable.Then, in the second step, we include the inverse Mill’s ratio fromthe first step to correct the potential selection bias in the regres-sion. The results of the two-step selection model are reported incolumns 3 and 4 of Table 6. The results show that past innovationbehavior affects current innovation decision and the existence ofa selection effect in innovation. Most importantly, input tariff cutclearly decreases both the likelihood and the intensity of innova-tion. However, a similar problem as in the Fixed-effect Poisson modeloccurs, that is, we experience a significant loss of observations in thefirst-step regression.
In sum, our findings are robust to alternative nonlinear regressionmodels despite the significant cost of using such regressions (i.e., asubstantial loss in observations).
3.3.10. Importing behaviorAfter focusing on the effect of input trade liberalization on inno-
vation, we now turn to the direct relation between intermediateinput imports and innovation. Specifically, we check whether thereduction in patenting occurs after firms begin to import, or in otherwords, whether input tariff cut affects firm innovation through thechange in importing behavior of firms. We therefore use a two-stage IV regression method to investigate (i) whether input tariffcut affects firms’ importing behavior (first-stage regression), and (ii)whether the changed importing behavior in turn affects firms’ inno-vation behavior (second-stage regression), using input tariff cut toinstrument the importing behavior. Because we need firms’ import-ing behavior information to perform this method, we combine NBSdata with Customs data for the period 2000–2006. We identify eachfirm’s importing status in each year from Customs data, and definea dummy variable ImpStartft that indicates whether firm f starts toimport intermediate inputs in year t. The dummy variable equalszero for the years before the firm starts to import and unity after-wards. We restrict our sample to initial non-importers, that is, firmsthat did not export in the first year they entered the sample. The IVregression results are reported in columns 5 and 6 of Table 6. Thefirst-stage result shows that input tariff cut increases the likelihoodof importing intermediate inputs, which in turn reduces innovationas shown by the second-stage result.
3.4. Heterogenous effects
Firms are heterogeneous in many dimensions, and so are innova-tions. We explore the possible heterogeneous effects of input tariffreductions on innovations. Results are reported in Table 7.
3.4.1. Types of innovationOur data have detailed information with regard to the types of
innovation. Chinese Patent Law classifies patents into three cat-egories, namely, invention, utility model, and design. Inventionpatents refer to technical innovations on products, methods, or both;utility model patents refer to technical proposals on the shape and/orstructure of a product; and design patents refer to changes in theshape and/or color of a product. The requirements for obtaining eachof the three patents are very different, with the invention applicationhaving the most difficult requirements and the design applicationhaving the easiest requirements. Thus, asking whether the effects ofinput tariff cuts on these innovations differ significantly is also rea-sonable. Columns 1–3 present the empirical results obtained fromregressions based on each of the three types of innovation. We findthat input tariff cuts reduce all types of innovation significantly.

178 Q. Liu, L. Qiu / Journal of International Economics 103 (2016) 166–183
Table 6Alternative estimation methods.
(1) (2) (3) (4) (5) (6)
Variables Patent Patent Patent indicator ln(patent) ImpStart ln(patent)
FE Poisson RE Poisson 1st step 2nd step 1st stage 2nd stage
InT01 ∗ Post02 −3.3218∗∗∗ −3.5040∗∗∗ −2.0515∗∗∗ −0.8275∗∗ 0.0384∗∗∗
(1.1609) (0.7862) (0.5660) (0.3282) (0.0146)ImpStart −2.9826∗∗∗
(0.7515)Age −0.016 −0.0116 −0.0311∗∗∗ −0.0131∗∗∗ 0.0017∗∗∗ 0.0046∗∗∗
(0.0119) (0.0097) (0.0057) (0.0032) (0.0002) (0.0014)Age squared 0.0002 0.0002 0.0004∗∗∗ 0.0002∗∗∗ −0.0000∗∗∗ −0.0001∗∗∗
(0.0002) (0.0002) (0.0001) (0.0001) 0.0000 0.0000Exporting −0.0217 0.0402 −0.0056 0.001 0.0231∗∗∗ 0.0759∗∗∗
(0.0614) (0.0563) (0.0432) (0.0231) (0.0015) (0.0176)ln(Labor) 0.6446∗∗∗ 0.7795∗∗∗ 0.1758∗∗∗ 0.1544∗∗∗ 0.0220∗∗∗ 0.0808∗∗∗
(0.0837) (0.0532) (0.0337) (0.0194) (0.0010) (0.0166)ln(Capital/labor) 0.1050∗∗∗ 0.2361∗∗∗ −0.0137 0.0403∗∗∗ 0.0035∗∗∗ 0.0136∗∗∗
(0.0406) (0.0306) (0.0198) (0.0118) (0.0004) (0.0028)Foreign share −0.3359∗ −0.2004 −0.1489 0.0346 0.0176∗∗∗ 0.0523∗∗∗
(0.1974) (0.1627) (0.0952) (0.0493) (0.0050) (0.0149)Output tariff 0.0821 0.0071 0.8485∗∗ −0.2534 −0.0117 −0.0238
(1.1219) (0.7686) (0.4135) (0.2413) (0.0106) (0.0242)SOE no. −1.1608∗ −1.0104∗∗ −0.1161 −0.4275∗∗∗ 0.1452∗∗∗ 0.3759∗∗∗
(0.6122) (0.5011) (0.2538) (0.1460) (0.0100) (0.1076)FIE no. −0.0908 −0.1291∗∗∗ 0.0424 0.0284∗ 0.0038∗∗∗ 0.0107∗∗∗
(0.0720) (0.0458) (0.0277) (0.0158) (0.0009) (0.0032)lnpatentr95 4.5846∗∗∗
(0.0432)Lambda −0.6782∗∗∗
(0.0339)Observations 98,868 1,268,326 96,201 31,127 870,661 870,661R-squared 0.7638 0.6630Number of firm 17,241 335,998 16,446 309,713
Robust standard errors clustered at firm in parentheses.∗∗∗ p < 0.01.∗∗ p < 0.05.∗ p < 0.1.
3.4.2. Capital intensityIndustries differ in many dimensions, which could potentially
affect firms’ responses to input tariff reductions. Capital–labor ratio,
or simply capital intensity, is a determinant of innovation, and dif-fers significantly across industries. We ascertain if the main resultof our analysis is sensitive to capital intensity of the industries
Table 7Heterogeneous effects.
(1) (2) (3) (4) (5) (6)
Variables Invention Utility Design ln(patent) ln(patent) ln(patent)
Sample All All All Low K/L High K/L Low TFP
InT01 ∗ Post02 −0.0821∗∗∗ −0.1027∗∗∗ −0.0464∗∗∗ −0.0961 −0.3564∗∗∗ −0.0267(0.0082) (0.0109) (0.0160) (0.0643) (0.0533) (0.0228)
Firm controls Y Y Y Y Y YIndustrial controls Y Y Y Y Y YFirm FE Y Y Y Y Y YYear FE Y Y Y Y Y YObservations 1,268,326 1,268,326 1,268,326 357,154 334,867 112,972R-squared 0.4871 0.4928 0.4690 0.4837 0.5630 0.3670
(7) (8) (9) (10) (11) (12)
Variables ln(patent) ln(patent) ln(patent) ln(patent) ln(patent) ln(patent)
Sample High TFP SOEs Private Foreign Importer Non-importer
InT01 ∗ Post02 −0.2963∗∗∗ −0.1272∗∗∗ −0.1476∗∗∗ −0.2678∗∗∗ −0.3246∗∗∗ −0.0928∗∗∗
(0.0516) (0.0466) (0.0230) (0.0605) (0.1192) (0.0180)Firm controls Y Y Y Y Y YIndustrial controls Y Y Y Y Y YFirm FE Y Y Y Y Y YYear FE Y Y Y Y Y YObservations 771,325 116,023 902,130 250,173 112,983 843,283R-squared 0.5535 0.4996 0.5259 0.5472 0.6872 0.5642
Robust standard errors clustered at firm in parentheses.∗∗∗ p < 0.01.
Q. Liu, L. Qiu / Journal of International Economics 103 (2016) 166–183 179
by rerunning the regression using a subsample of industries withhigh capital intensity and a subsample of industries with low cap-ital intensity, respectively. We calculate the capital–labor ratio ofeach four-digit CIC industry in the pre-WTO accession period (thesimple average of the ratios in those years) to construct the twosubsamples. The low capital-intensity industry group includes allindustries with a capital intensity lower than the 25th percentile ofthe entire sample, whereas the high capital-intensity industry groupincludes all industries with a capital intensity higher than the 75thpercentile of the entire sample. Column 4 of Table 7 reports theregression results from the low capital-intensity group while column5 reports those from the high capital-intensity group. We find neg-ative effects of input tariff reduction on innovation in both groups.The effect is stronger for firms from high capital-intensity industriesthan from low capital-intensity industries. This comparison is con-sistent with the fact that firms with high capital-intensity undertakemore innovations and thus are more affected by the reduction.
3.4.3. Distance from technology frontierAghion et al. (2009) argue that the distance from the world’s tech-
nology frontier is an important factor in determining firm responsesin innovation to market competition. We explore whether the inputtariff reductions also lead to different responses by firms with differ-ent distance from the world’s technology frontier.
We divide the sample into five quantiles based on the averagetotal factor productivity (TFP) of firms in the pre-WTO accessionperiod.26 Quantiles are constructed within each CIC four-digit indus-try. We run regressions for the subsample of the first quantilefirms (i.e., firms far from the frontier) and the subsample of thefifth quantile firms (i.e., firms close to the frontier), respectively.Columns 6 and 7 report the results. We find that for low-productivityfirms, the effect of input tariff reductions on innovation is insignif-icant, whereas for high-productivity firms, the effect is significantlynegative. One possible reason for such a difference is that low-productivity firms do not use much imported intermediate input intheir production nor do they engage actively in innovation, and thus,their innovation activities are not sensitive to changes in input tariffs.
3.4.4. OwnershipIn terms of ownership structure, three types of firms primarily
exist in China: SOEs, domestic private firms, and foreign investedenterprises (FIEs). FIEs are all business entities established in Chinawith part or all of foreign capital. They include both Sino-foreignjoint ventures and wholly foreign-owned enterprises. Determiningwhether firms with different ownership structures have differentresponses to input tariff reduction would be an interesting exercise.Columns 8–10 show the results for SOEs, domestic private firms,and FIEs, respectively. All types of firms reduce their innovationssignificantly in response to input tariff liberalization. The negativeeffect on SOEs is the weakest. Perhaps, the innovation incentives ofSOEs are less responsive to market and cost conditions. The effect onFIEs is the strongest, which may suggest that they depend more onimported intermediate inputs for production and innovations.
3.4.5. Direct importers and non-importersWe classified firms into direct importers, which are firms
that import intermediate inputs directly by themselves, and non-importers. While direct importers are affected directly by input tariffcuts, non-importers may also be affected indirectly because theymay purchase imported inputs from intermediaries. Amiti and Kon-ings (2007) show that direct importers in Indonesia are affected
26 TFP is estimated using the Levinsohn and Petrin (2003) method at the level of two-digit CIC industry and with information of value added, employment, fixed assets, andintermediate inputs. All nominal variables are deflated using the deflators from Brandtet al. (2012).
more by tariff reductions than non-importers. We examine whetherthe difference obtained for Indonesian firms also exists for Chinesefirms by running regressions using the sample of direct importersand non-importers, respectively. Columns 11 and 12 show the effecton direct importers and non-importers, respectively. We find thatboth types of firms reduce their innovations, with direct importersreducing more than non-importers.
4. Mechanism: a simple model and evidence
Why does a tariff cut in intermediate input imports reduce firminnovations? To understand this interesting observation, we pro-vide one explanation derived from a highly simplified and stylizedmodel in Subsection 4.1. We put the equilibrium analysis (the proofof the results) in the Appendix. In Subsection 4.2, we conduct fur-ther empirical analysis which generates results consistent with themain predictions from the model, thereby providing support for themodel.27
4.1. Model and results
Consider a firm facing demand for its product as P(y), where y isthe quantity and P is the price with P′(y) < 0. Production requiresboth domestic intermediate input, denoted as d, and imported inter-mediate input, denoted as x. Assume that production function takesthe following form: y = f(x, d)h(b, r), where f( • ) is a usual produc-tion function and h(•), which represents the level of productivity, isan increasing function of the quality of the imported intermediateinput b and the firm’s innovation r. Let pd be the price of domesticintermediate input, px(b) the price of imported intermediate input,which is an increasing function of quality (i.e., px′
> 0), pr the price ofimported input for innovation activity, and t the import tariff.
Given px, pr, pd and t, the firm’s optimization problem is
max{b,r,x,d}
[P( y)y − tpx(b)x − tprr − pdd
].
Suppose that the second order conditions for optimization hold.Let us use subscript to denote partial derivative. In the Appendix, weprove the following proposition.
Proposition 1. Suppose that hr or px′px is sufficiently small and hbb > 0.
Then, a decrease in the tariff (t) on intermediate input will result in a risein intermediate input quality (b), but a reduction in innovation activity(r). The firm’s productivity (h) will increase.
When t decreases, many possible combinations of optimalresponses from the three decision variables, namely, x, b and r, existand the possibility of all three increasing is very possible becauseof the price effect (cheaper now). However, our analysis identifiesan interesting (and somewhat surprising) outcome: r decreases. Thisdecrease is accompanied with an increase in b. The intuition is infact very clear. Note from the analysis leading to the corollary thatthe condition on hr and that on px′
px are in relative terms. Thus, under-
standing the result based on the condition that both hr and px′px are
small is a better option. In this case, although everything (x and r)is cheaper, spending the money most efficiently to improve outputand profit remains a concern. Because the marginal improvement inproductivity by increasing innovation is small (hr), and the percent-age increase in the price of intermediate input with higher quality
27 The model of endogenous input and output quality choices proposed by Kuglerand Verhoogen (2012) can also be modified to provide insights on how firms respondto intermediate input tariff cut by adjusting their decisions.
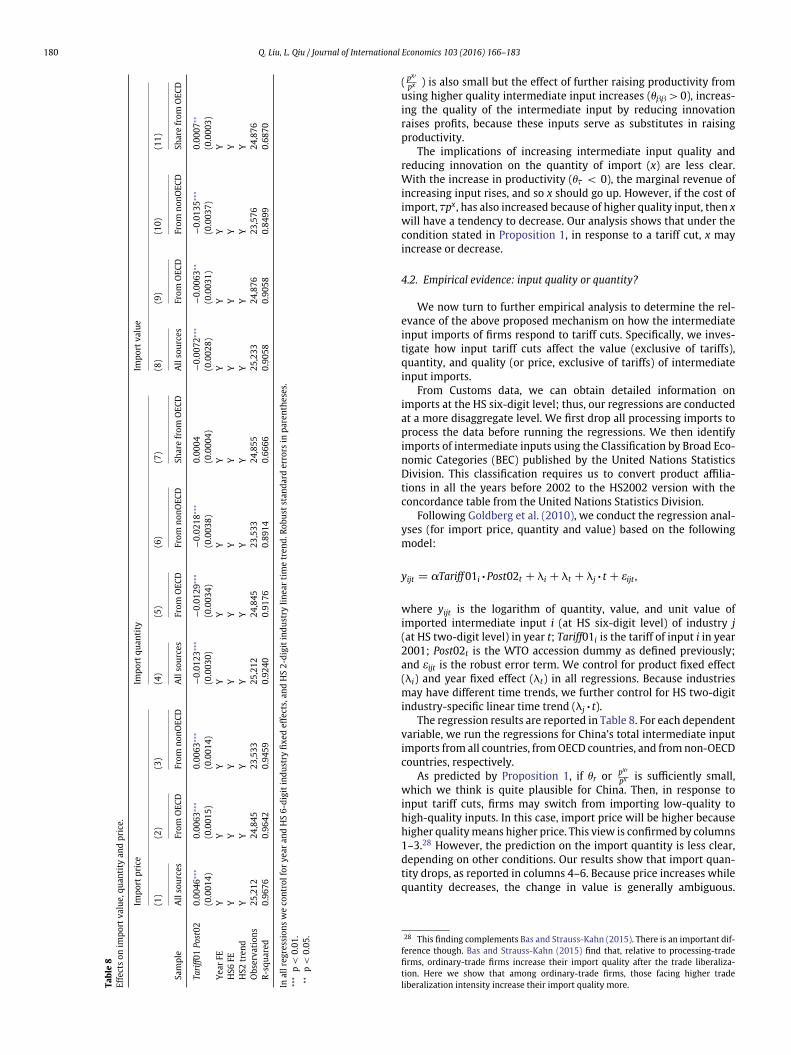
180 Q. Liu, L. Qiu / Journal of International Economics 103 (2016) 166–183
Tabl
e8
Effe
cts
onim
port
valu
e,qu
anti
tyan
dpr
ice.
Impo
rtpr
ice
Impo
rtqu
anti
tyIm
port
valu
e
(1)
(2)
(3)
(4)
(5)
(6)
(7)
(8)
(9)
(10)
(11)
Sam
ple
All
sour
ces
From
OEC
DFr
omno
nOEC
DA
llso
urce
sFr
omO
ECD
From
nonO
ECD
Shar
efr
omO
ECD
All
sour
ces
From
OEC
DFr
omno
nOEC
DSh
are
from
OEC
D
Tari
ff01
Post
020.
0046
∗∗∗
0.00
63∗∗
∗0.
0063
∗∗∗
−0.0
123∗
∗∗−0
.012
9∗∗∗
−0.0
218∗
∗∗0.
0004
−0.0
072∗
∗∗−0
.006
3∗∗
−0.0
135∗
∗∗0.
0007
∗∗
(0.0
014)
(0.0
015)
(0.0
014)
(0.0
030)
(0.0
034)
(0.0
038)
(0.0
004)
(0.0
028)
(0.0
031)
(0.0
037)
(0.0
003)
Year
FEY
YY
YY
YY
YY
YY
HS6
FEY
YY
YY
YY
YY
YY
HS2
tren
dY
YY
YY
YY
YY
YY
Obs
erva
tion
s25
,212
24,8
4523
,533
25,2
1224
,845
23,5
3324
,855
25,2
3324
,876
23,5
7624
,876
R-sq
uare
d0.
9676
0.96
420.
9459
0.92
400.
9176
0.89
140.
6666
0.90
580.
9058
0.84
990.
6870
Inal
lreg
ress
ions
we
cont
rolf
orye
aran
dH
S6-
digi
tin
dust
ryfi
xed
effe
cts,
and
HS
2-di
git
indu
stry
linea
rti
me
tren
d.Ro
bust
stan
dard
erro
rsin
pare
nthe
ses.
∗∗∗
p<
0.01
.∗∗
p<
0.05
.
( px′px ) is also small but the effect of further raising productivity from
using higher quality intermediate input increases (hbb > 0), increas-ing the quality of the intermediate input by reducing innovationraises profits, because these inputs serve as substitutes in raisingproductivity.
The implications of increasing intermediate input quality andreducing innovation on the quantity of import (x) are less clear.With the increase in productivity (ht < 0), the marginal revenue ofincreasing input rises, and so x should go up. However, if the cost ofimport, tpx, has also increased because of higher quality input, then xwill have a tendency to decrease. Our analysis shows that under thecondition stated in Proposition 1, in response to a tariff cut, x mayincrease or decrease.
4.2. Empirical evidence: input quality or quantity?
We now turn to further empirical analysis to determine the rel-evance of the above proposed mechanism on how the intermediateinput imports of firms respond to tariff cuts. Specifically, we inves-tigate how input tariff cuts affect the value (exclusive of tariffs),quantity, and quality (or price, exclusive of tariffs) of intermediateinput imports.
From Customs data, we can obtain detailed information onimports at the HS six-digit level; thus, our regressions are conductedat a more disaggregate level. We first drop all processing imports toprocess the data before running the regressions. We then identifyimports of intermediate inputs using the Classification by Broad Eco-nomic Categories (BEC) published by the United Nations StatisticsDivision. This classification requires us to convert product affilia-tions in all the years before 2002 to the HS2002 version with theconcordance table from the United Nations Statistics Division.
Following Goldberg et al. (2010), we conduct the regression anal-yses (for import price, quantity and value) based on the followingmodel:
yijt = aTariff 01i • Post02t + ki + kt + kj • t + eijt ,
where yijt is the logarithm of quantity, value, and unit value ofimported intermediate input i (at HS six-digit level) of industry j(at HS two-digit level) in year t; Tariff01i is the tariff of input i in year2001; Post02t is the WTO accession dummy as defined previously;and eijt is the robust error term. We control for product fixed effect(ki) and year fixed effect (kt) in all regressions. Because industriesmay have different time trends, we further control for HS two-digitindustry-specific linear time trend (kj • t).
The regression results are reported in Table 8. For each dependentvariable, we run the regressions for China’s total intermediate inputimports from all countries, from OECD countries, and from non-OECDcountries, respectively.
As predicted by Proposition 1, if hr or px′px is sufficiently small,
which we think is quite plausible for China. Then, in response toinput tariff cuts, firms may switch from importing low-quality tohigh-quality inputs. In this case, import price will be higher becausehigher quality means higher price. This view is confirmed by columns1–3.28 However, the prediction on the import quantity is less clear,depending on other conditions. Our results show that import quan-tity drops, as reported in columns 4–6. Because price increases whilequantity decreases, the change in value is generally ambiguous.
28 This finding complements Bas and Strauss-Kahn (2015). There is an important dif-ference though. Bas and Strauss-Kahn (2015) find that, relative to processing-tradefirms, ordinary-trade firms increase their import quality after the trade liberaliza-tion. Here we show that among ordinary-trade firms, those facing higher tradeliberalization intensity increase their import quality more.

Q. Liu, L. Qiu / Journal of International Economics 103 (2016) 166–183 181
Nevertheless, we find that imported value also decreases, as shownby columns 8–10.
An alternative way to proxy input quality is to look at the originof the exporting country, with OECD countries’ exports representinghigher quality. Although both total quantity and value decrease,the share of input imports from OECD increases in both quantity[column 7] and value [column 11], lending further support to thequality upgrade.
As intermediate inputs are classified into intermediate and capitalgoods in the BEC classification, we also check the two types ofintermediate inputs separately and the results are similar.
5. Conclusion
The effects of trade on innovation have long been a hot topic inboth academic and policy circles. Trade in intermediate inputs hasbecome increasingly important in the world economy. This paperinvestigates the effects of intermediate input trade liberalization onfirm innovation, which complements the emerging literature thatinvestigates the effects of intermediate input trade liberalization onfirm performance from different perspectives such as productivity,product scope, and product quality.
We exploit the quasi-natural experiment of China’s WTO acces-sion in 2001 and the rich data on Chinese firms and find that inputtariff reductions in China reduce innovations of the Chinese firms.This result is robust to a series of model specifications, and significantboth statistically and economically.
The driving force underlying the negative effect of intermediateinput imports on firm innovation is that high-quality input importssubstitute for internal innovation of firms. Theoretically, intermedi-ate input imports can be complements to internal innovation in thesense that high-quality inputs help lower innovation cost. On thecontrary, cheaper intermediate inputs from abroad can be substi-tutes for firm innovation because firms can buy instead of makingthem. Our empirical evidence show that the input tariff cut leadsfirms to opt for lesser imports but choose higher-quality intermedi-ate inputs, whereby reducing innovations.
Although the results are somewhat surprising, they are notincompatible with results obtained by other studies on the effects ofintermediate input tariff reductions on the other aspects of the per-formances of the Chinese firms, such as productivity (Yu, 2015) andexport quality (Bas and Strauss-Kahn, 2015; Fan et al., 2015). Intro-ducing a general theoretical framework that can produce all theseresults and provide a clear mechanism is an attractive prospect. Sucha model will also be helpful in predicting whether our negative effectcan also be found in other countries. Further empirical studies onthe experiences of other countries on the effects of intermediateinput trade liberalization on innovation are also encouraged, such asGoldberg et al., 2010 on India.
Acknowledgments
We benefitted from discussions with Elhanan Helpman, Hong Ma,Marc Melitz, Tommy Wu, Xi Weng, Li-an Zhou and the presentationat The UIBE International Trade Workshop (October 2014) andThe Hong Kong Economic Association Conference (December 2014),seminar at Guanghua School of Management, Peking University(March 2015) and Bologna University (April 2015), Summer Work-shop of HKIMR (August 2015), The HKU International Trade Work-shop (December 2015), Kobe University (2015), The Hitotsubashi-Peking University Workshop on Trade & Development (March 2016).We thank Chaoqun Zhan for his assistance in our research and thereferees for their excellent comments and suggestions. Qiu appreci-ates financial support from HKIMR for visiting scholarship and ChungHon-Dak Endowed Professorship in Economic Development.
Appendix
Proof of Proposition 1. In this proof, we reduce the number ofdecision variables to make our points as simple as possible. To thisend, we make two simplifying assumptions. First, we assume that allinputs for R&D are imported. Second, to focus on import decisions,assume that f( • ) takes the Leontief form and the price of domesticinput is sufficiently low that the firm always chooses the level ofdomestic input equal to that of the imported input. This step allowsus to omit the domestic input from the production function, andignoring the cost of domestic input from the profit will not affectthe qualitative results. With further simplification, we can write theproduction function as y = xh(b, r). We will return to discussing theimplications of relaxing these two assumptions later. Relaxing theseassumptions will not alter the qualitative aspect of the result andmay even reinforce it. Consequently, the firm’s optimization problembecomes
max{b,r,x}
[P( y)y − tpx(b)x − tprr
].
Using subscript to denote partial differentiation, we obtain first-order conditions:
P′x2hhb + Pxhb − tpx′x = 0,
P′x2hhr + Pxhr − tpr = 0,
P′xh2 + Ph − tpx = 0,
which can be rewritten as
P′xh + P = tpx′ 1hb
, (2)
P′xh + P = tpr 1hr
1x
, (3)
P′xh + P = tpx 1h. (4)
Combining Eq. (2) with Eqs. (3) and (4), respectively, we obtain
x =pr
px′hb
hr, (5)
h =1
px′ pxhb. (6)
Let us focus on a simple case in which P′′ = 0 and px′′= 0.
Differentiating Eq. (6) with respect to t and using ht = hbbt + hrrtyields
bt = Art , where A ≡ hr
hbb
(px′
px − hbr
hr
). (7)
Similarly, differentiating Eq. (5) with respect to t and usingEq. (7) give
xt = Brt , where B ≡[
pr
px − xhr
(Ahbr + hrr)]. (8)
Differentiating Eq. (1) with respect to t, we have
2P′ [x(hbbt + hrrt) + hxt]
= px′[
1hb
− t
h2b
(hbbbt + hbrrt)
].

182 Q. Liu, L. Qiu / Journal of International Economics 103 (2016) 166–183
Substituting Eqs. (7) and (8) into the above equation and rear-ranging the terms yield
⎡⎢⎢⎢⎣2P′(Axhb + xhr + Bh)︸ ︷︷ ︸
C
+ t
(px′
hb
)2 hr
px︸ ︷︷ ︸D
⎤⎥⎥⎥⎦ rt =
px′
hb.
Hence, if C < 0, we will have rt > 0 because D > 0. UsingEqs.(5)–(8), we can rearrange the terms to get
C =pxpr
hbb
(hb
px′
)2[(
hbr
hr− px′
px
)2
− hbbhrr
h2r
]+ xhr +
pr
px′ hb. (9)
Then, with some manipulation, we have C < 0 if and only if
(hbbhrr − h2
br
) 1h2
r>
px′
px
[px′
px − 2(hbr
hr− hbb
hb
)]. (10)
Note from Eq. (7) that if A < 0, then bt and rt will have theopposite signs, and if hbb > 0, then A < 0 if and only if
px′
px <hbr
hr. (11)
The above analysis leads to the following lemma:
Lemma 1. Suppose hbb > 0. Conditions (10)–(11) are sufficientconditions for bt < 0 and rt > 0.
Let us further suppose that hbbhrr − h2br > 0 to obtain more
meaningful conditions. Then, LHS of Eq. (10) is decreasing in hr whileRHS is increasing in hr. Moreover, LHS can be very large when hr isvery small. Thus, Eq. (10) holds when hr is sufficiently small. Evenif hr is not very small (so that LHS is not very large), Eq. (10) stillholds if px′
px is sufficiently small. An interesting observation is that
Eq. (11) also requires hr to be sufficiently small or px′px be sufficiently
small. Hence, the effects of tariff on intermediate input quality andinnovation activity are established.
Let us turn to the effect on productivity. Note that ht = hbbt +hrrt . Thus, when hr is sufficiently small, we also have ht < 0 becauseaccording to Corollary 1, bt < 0 although rt > 0. Alternatively, usingthe fact that bt = Art and hr > 0 and with the result rt > 0, we caneasily show that the necessary and sufficient condition for ht < 0 is
px′
px <hbr
hr− hbb
hb. (12)
Thus, we have a result on productivity similar to Corollary 1;that is, when hr or px′
px is sufficiently small, a decrease in tariff (t) onintermediate input will result in higher productivity (h).
Note that condition (12) is stronger than Eq. (11). Thus, thecondition stated in Proposition 1 should be the condition thatsatisfies Eq. (12).
Recall that we imposed two simplifying assumptions to carry outthe above analysis. If the firm uses both domestic input and importedinput for R&D, as the imported input becomes cheaper, the firm willsubstitute domestic input with imported input. However, comparedto the case without domestic input, the decrease in R&D cost as aresult of a decrease in t is smaller. Hence, given the condition in
Corollary 1, the firm will have a stronger incentive to reduce R&D.That is, the result stated in Corollary 1 is reinforced.
If substitution between domestic input and imported interme-diate input for production is performed, then the level of domesticinput (d) will be chosen optimally. As a direct effect, tariff drop willclearly reduce the use of domestic input. The firm will face a similarsituation in choosing the other three variables, x, b and r. We donot expect to see the qualitative aspect of Corollary 1 to change. Theincrease in productivity as a result of higher b may push the useof domestic input, which is the indirect effect. Whether the use ofdomestic input will go up or down remains ambiguous.
References
Aghion, P., Blundell, R., Griffith, R., Howitt, P., Prantl, S., 2009. The effects of entry onincumbent innovation and productivity. Rev. Econ. Stat. 91 (1), 20–32.
Almeida, R., Fernandes, A.M., 2008. Openness and technological innovations indeveloping countries: evidence from firm level surveys. J. Dev. Stud. 44 (5),701–727.
Amiti, M., Konings, J., 2007. Trade liberalization, intermediate inputs, and productivity:evidence from Indonesia. Am. Econ. Rev. 97, 1611–1638.
Atkeson, A., Burstein, A., 2010. Innovation, firm dynamics, and international trade. J.Polit. Econ. 118, 433–484.
Aw, B.Y., Roberts, M.J., Daniel, Y.U., 2011. R&D investment, exporting, and productivitydynamics. Am. Econ. Rev. 101, 1312–1344.
Baldwin, J., Gu, W., 2004. Trade liberalization: exporting-market participation, produc-tivity growth and innovation. Economic Analysis Research Paper Series No. 027,Statistics Canada.
Bas, M., 2012. Input-trade liberalization and firm export decisions: evidence fromArgentina. J. Dev. Econ. 97, 481–493.
Bas, M., Strauss-Kahn, V., 2014. Does importing more inputs raise exports? Firm-levelevidence from France. Rev. World Econ. 150 (2), 241–475.
Bas, M., Strauss-Kahn, V., 2015. Input-trade liberalization, export prices and qualityupgrading. J. Int. Econ. 95 (2), 250–262.
Bertrand, M., Duflo, E., Mullainathan, S., 2004. How much should we trustDifferences-in-Differences estimates? Q. J. Econ. 119, 249–275.
Bilir, L.K., 2014. Patent laws, product lifecycle lengths, and multinational activity. Am.Econ. Rev. 104 (7), 1979–2013.
Bloom, N., Draca, M., Reenen, J.V., 2016. Trade induced technical change: the impactof Chinese imports on innovation, diffusion and productivity. Rev. Econ. Stud. 83(1), 87–117.
Brandt, L., Biesebroeck, J.V., Zhang, Y., 2012. Creative accounting or creative destruc-tion? Firm-level productivity growth in Chinese manufacturing. J. Dev. Econ. 97(2), 339–351.
Burstein, A., Melitz, M., 2013. Trade liberalization and firm dynamics. Advancesin Economics and Econometrics Tenth World Congress. Applied Economics.Econometric Society Monographs. vol. 2. Cambridge University Press, UK.
Bustos, P., 2011. Trade liberalization, exports, and technology upgrading: evidence onthe impact of MERCOSUR on Argentinian firms. Am. Econ. Rev. 101, 304–340.
Cai, H., Liu, Q., 2009. Competition and corporate tax avoidance: evidence from Chineseindustrial firms. Econ. J. 119 (537), 764–795.
Cassiman, B., Veugelers, R., 2006. In search of complementarity in innovation strategy:internal R&D and external knowledge acquisition. Manag. Sci. 52 (1), 68–82.
Chevassus-Lozza, E., Gaigne, C., Mener, L.L., 2013. Does input trade liberalization boostdownstream firms’ exports? Theory and firm-level evidence. J. Int. Econ. 90,391–402.
Coe, D., Helpman, E., 1995. International R&D spillovers. Eur. Econ. Rev. 39, 859–887.Cohen, W., Levinthal, D., 1989. Innovation and learning: the two faces of R&D. Econ. J.
99, 569–596.Connolly, M., 2003. The dual nature of trade: measuring its impact on imitation and
growth. J. Dev. Econ. 72, 31–55.Dang, J., Motohashi, K., 2015. Patent statistics: a good indicator for innovation in
China? Patent subsidy program impacts on patent quality. China Econ. Rev. 35,137–155.
de Negri, J.A., Turchi, L.M., 2007. Technological Innovation in Brazilian and ArgentineFirms. IPEA, Brasilia.
Ethier, W.J., 1982. National and international returns to scale in the modern theory ofinternational trade. Am. Econ. Rev. 72 (3), 389–405.
Fan, H., Li, A., Yeaple, S., 2015. Trade liberalization, quality, and export price. Rev. Econ.Stat. 97 (5), 1033–1051.
Feng, L., Li, Z., Swenson, D.L., 2016. The connection between imported intermediateinputs and exports: evidence from Chinese firms. J. Int. Econ. 101, 86–101.
Future, K., 2012. China’s Three Waves of Innovation: A Quantitative Study of China’sNew Invention Landscape, Sweden.
Ge, Y., Lai, H., Zhu, S., 2011. Intermediates import and gains from trade liberalization.Working Paper.
Goldberg, P.K., Khandelwal, A.K., Pavcnik, N., Topalova, P., 2010. Imported intermedi-ate inputs and domestic product growth: evidence from India. Q. J. Econ. 125 (4),1727–1767.
Grossman, G., Helpman, E., 1991. Innovation and Growth in the Global Economy. TheMIT Press, MA.
Q. Liu, L. Qiu / Journal of International Economics 103 (2016) 166–183 183
Grossman, S., Hart, O., 1986. The costs and benefits of ownership: a theory of verticaland lateral integration. J. Polit. Econ. 94, 691–719.
Guadalupe, M., Wulf, J., 2010. The flattening firm and product market competition: theeffect of trade liberalization on corporate hierarchies. Am. Econ. J. Appl. Econ. 2,105–127.
Halpern, L., Koren, M., Szeidl, A., 2011. Imported inputs and productivity. CeFiGWorking Papers 8.
Hashmi, A.R., 2013. Competition and innovation: the inverted-U relationship revisited.Rev. Econ. Stat. 95 (5), 1653–1668.
Holmes, T., McGratten, E.R., Prescott, E.C., 2015. Quid pro quo: technology capitaltransfers for market access in China. Rev. Econ. Stud. forthcoming.
Hu, A.G., Jefferson, G.H., 2009. A great wall of patents: what is behind China’s recentpatent explosion? J. Dev. Econ. 90 (1), 57–68.
Kasahara, H., Rodrigue, J., 2008. Does the use of imported intermediates increaseproductivity? J. Dev. Econ. 87, 106–118.
Kiriyama, N., 2012. Trade and innovation: synthesis report. OECD Trade Policy Papers,No. 135. OECD Publishing.
Kugler, M., Verhoogen, E., 2012. Prices, plant size, and product quality. Rev. Econ. Stud.79 (1), 307–339.
Levinsohn, J., Petrin, A., 2003. Estimating production functions using inputs to controlfor unobservables. Rev. Econ. Stud. 70 (2), 317–341.
Li, X., 2012. Behind the recent surge of Chinese patenting: an institutional view. Res.Policy 41, 236–249.
Lileeva, A., Trefler, D., 2010. Improved access to foreign markets raises plant-levelproductivity. . . for some plants. Q. J. Econ. 125 (3), 1051–1099.
Liu, X., Buck, T., 2007. Innovation performance and channels for internationaltechnology spillovers: evidence from Chinese high-tech industries. Res. Policy 36,355–366.
Lyons, B., 1995. Specific investment, economies of scale, and the make-or-buydecision: a test of transaction cost theory. J. Econ. Behav. Organ. 26 (3), 431–443.
Muendler, M.-A., 2004. Trade, technology, and productivity: a study of Brazilianmanufacturers, 1986-1998. Working Paper.
OECD, 2009. Patent Statistics Manual. OECD Publications, Paris.Onodera, O., 2009. Trade and innovation: a synthesis. OECD J. Gen. Pap. 2008/4,PWC, 2015. China Research & Development Tax Services: an opportunity for tax
savings. Available from the company’s website: www.pwccn.com.Sanyal, P., Ghosh, S., 2013. Product market competition and upstream innovation:
evidence from the US electricity market deregulation. Rev. Econ. Stat. 95 (1),237–254.
Topalova, P., 2010. Factor immobility and regional impacts of trade liberalization:evidence on poverty from India. Am. Econ. J. Appl. Econ. 2 (4), 1–41.
Topalova, P., Khandelwal, A., 2011. Trade liberalization and firm productivity: the caseof India. Rev. Econ. Stat. 93 (3), 995–1009.
van Biesebroeck, J., 2003. Revisiting some productivity debates. NBER Working PaperNo. 10065.
Veugelers, R., Cassiman, B., 1999. Make and buy in innovation strategies: evidencefrom Belgian manufacturing firms. Res. Policy 28 (1), 63–80.
Williamson, O., 1985. The Economic Institutions of Capitalism, Firms, Markets,Relational Contracting. The Free Press, New York.
Wunsch-Vincent, S., Kashcheeva, M., Zhou, H., 2015. International patenting byChinese residents: constructing a database of Chinese foreign-oriented patentfamilies. China Econ. Rev. 36, 198–219.
Yu, M., 2015. Processing trade, tariff reductions, and firm productivity: evidence fromChinese firms. Econ. J. 125, 943–988.
Zhang, H., 2014. Static and dynamic gains from importing intermediate inputs: theoryand evidence. Working Paper, The University of Hong Kong.