interim results for the half year ended 30 june 2017/media/files/c/cobham-ir... · interim results...
TRANSCRIPT

1
3 AUGUST 2017
INTERIM RESULTS FOR THE HALF YEAR ENDED 30 JUNE 2017
First half results in line with expectations; full year outlook unchanged albeit there remains a wide range of potential outcomes for 2017
The Group is in the early stages of turnaround; focus on priorities of: (1) customers, (2) leadership and simplification and (3) control and execution
Order intake 4% higher at constant currency, excluding multi-year Qantas extension received in 2016
Broadly flat organic4 revenue, with headline revenue up 9% driven by favourable currency translation
Reduced underlying operating profit driven primarily by Advanced Electronic Solutions (anticipated increased costs); Aviation Services (reduced natural resources flying and repricing of Qantas contract); and increased IT amortisation
Net debt/EBITDA gearing ratio at 1.5x (31 December 2016: 3.0x). H1 cash generation flattered by c£20m of favourable working capital timing and lower capital expenditure. Heavier phasing of net cash out flows against 2016 exceptional charges expected in next 12 months, confirming limited free cash flow guidance across 2017-18
Portfolio review undertaken; commencing strategic review of Wireless and AvComm businesses (c10% of Group revenue)
David Lockwood, Cobham Chief Executive Officer said:
“We have been working hard to build the foundations for our future success but we are in the early stages of implementing a challenging turnaround in the Group’s performance. Cobham has a number of high quality businesses with differentiated technologies and know-how and leading positions in a number of attractive markets – this gives us confidence in Cobham’s future.”
Note H1 2017 H1 2016
Statutory results
Order intake £915.8m £1,170.4m
Revenue £1,003.3m £916.7m
Operating profit/(loss) £34.7m £(12.0)m
Basic EPS 1 0.8p (1.6)p
Net debt
£460.8m £877.2m
Underlying results* 2
Operating profit £89.9m £102.2m
Operating margin 9.0% 11.1%
Earnings per share (EPS) 1 2.5p 3.8p
Free cash flow 3 £64.6m £54.0m
Cash conversion 120% 106%
Net debt/EBITDA 1.5x 2.3x
*Underlying results are presented to assist with the understanding of the Group’s performance trends. These measures are defined in the notes on page 3 and reconciled to GAAP measures in this statement on page 18.

2
ENQUIRIES
Cobham plc
Julian Wais, Director of Investor Relations +44 (0)1202 857998
MHP Communications
Reg Hoare/Tim Rowntree/Nessyah Hart +44 (0)20 3128 8100
INTERIM RESULTS PRESENTATION INCLUDING WEBCAST AND DIAL-IN DETAILS There will be an interim results presentation at 9.30am UK time on Thursday, 3 August 2017, with a live webcast accessible on the Cobham website (www.cobhaminvestors.com). The webcast will be available on the website for subsequent viewing. There will also be a live dial-in facility available which can be accessed in the UK and internationally on +44 (0)20 3003 2666, confirmation code Cobham, and in the US/Canada on +1 646 843 4608, confirmation code Cobham. A PDF of this interims announcement is available for download from www.cobhaminvestors.com/reports-and-presentations/2017.

3
The following notes apply throughout these interim results:
1. Restatement of prior period EPS relates to the reflection of the bonus element of the May 2017 Rights Issue on the prior period average number of shares and EPS.
2. To assist with the understanding of earnings trends, the Group has included within its published financial statements non-GAAP
measures including underlying operating profit and underlying profit. These are considered by the Board to be the most meaningful
measures by which to assess the true operating performance of the Group. The non-GAAP measures used are not defined terms
under IFRS and therefore may not be comparable to similar measures used by other companies. They are not intended to be a
substitute for, or superior to, GAAP measures.
In order to provide a more comparable view year-on-year, underlying measures remove the distorting effects of the specific
adjusting items described below. These are not considered to reflect the day to day operating results of the Group and are more
clearly understood when presented separately. All underlying measures include the operational results of all businesses including
those held for sale until the point of sale.
Underlying operating profit has been defined as operating profit from continuing operations excluding the specific adjusting items described below:
Business acquisition and divestment related items comprising the amortisation of intangible assets arising on business
combinations, gains or losses arising on business divestments and other direct costs associated with business
combinations and terminated divestments;
Amounts related to prior periods' restructuring programmes which commenced before 2017. These are incremental to
normal operations and non-recurring in nature. In 2017 and 2016, these relate to the integration of the Aeroflex
businesses acquired in 2014;
Changes in the marking to market of non-hedge accounted derivative financial instruments and gains and losses arising on
dividend related foreign exchange contracts; and
Other items deemed by the Directors to be of an exceptional, non-operating nature including impairment of intangible
assets and adjustments arising from the Balance Sheet review set out in the 2016 Annual Report and Accounts.
Further details of specific adjusting items can be found in note 3 to the Interim Financial Statements on page 29.
Underlying profit before taxation is defined as underlying operating profit less net underlying finance costs, which exclude business
acquisition and divestment related items and non-recurring finance costs.
A reconciliation of the statutory results to the respective underlying measures is shown on page 18.
3. Free cash flow is defined as net cash from operating activities plus dividends received from joint ventures, less cash flows related to the purchase or disposal of property, plant, equipment and intangible assets but excluding payments relating to business acquisition and divestment related activities. Operating cash flow is free cash flow before payment of tax, interest and restructuring costs. Operating cash conversion is defined as operating cash flow as a percentage of underlying operating profit excluding the share of post-tax profits of joint ventures and associates.
A reconciliation of underlying operating profit to operating cash flow is shown on page 17.
Net debt is defined as the net of borrowings less cash and cash equivalents at the balance sheet date.
4. Organic revenue is defined as revenue stated at constant translation exchange rates, excluding the incremental effect of acquisitions and divestments.
5. Private Venture (PV or company funded R&D – Research and Development) measures exclude Aviation Services, where, due to the nature of its business, there is no R&D activity.

4
CHIEF EXECUTIVE OFFICER’S REVIEW Introduction We have been working hard building the foundations for our future success but we are in the early stages of implementing a challenging turnaround in the Group’s performance. We are making progress across a number of areas but full implementation of all the required steps will be time consuming and may encounter some turbulence along the way. Against this backdrop it is pleasing to report that the first half results, including Group underlying operating profit of £89.9m (2016: £102.2m), are in line with the Board’s expectations. Progress Against Operational Priorities In March we set out three operational priorities for improvement in 2017: (1) customer focus; (2) leadership and simplification; and (3) control and execution. Customer Focus In order to maximise the Group’s opportunities we need to bring additional focus to our customer relationships, improve our customer delivery and invest in products that meet our customers’ future needs. We have made the following improvements in the period:
I have led regular interaction at senior levels with major customers. As a result we are clearer on our customers’ views on our technology and delivery record. While our technologies and capabilities are generally highly rated, it is evident we need to improve delivery;
We have appointed Air Marshall (retired), Greg Bagwell CB CBE to help build customer relationships and we have increased participation in government and trade associations to support export opportunities;
We have started collecting and reviewing key customer related indicators every month, to better align our internal measures to customer commitments, as well as more actively using customer score cards;
We have been focusing on the internal processes required to improve our on-time delivery, including rolling out a training programme on root cause analysis. We are targeting training for 500 employees this year;
We are resolving issues in individual businesses that have led us to fall short of customer expectations, with coaching on operational planning techniques.
Leadership and Simplification Our improvements will only yield optimal results if we motivate Cobham’s employees by showing visible leadership and simplifying the way we do business. This will allow time for increased focus on customers. Accordingly we have been making changes including:
A major overhaul and strengthening of the Advanced Electronic Solutions Sector Board, which operates under a Special Security Agreement (SSA);

5
We have increased engagement with the top 200 leaders in the Group, including gathering them together for three days in March to instil a common sense of purpose and encourage collaboration;
Increased senior management visibility through site visits and staff meetings. I have personally now visited around two thirds of our sites (covering three quarters of our headcount) around the world and held an all-hands meeting for staff at each site;
A streamlined Group policy framework will be in use by the end of 2017, with the number of policies reducing by around 40%. The Group’s revised delegated authorities have been consolidated into a single table and are being used as an active management tool;
We have removed some 60 system reports and 80 data line items from the Group reporting suite and reduced the number of non-financial key performance indicators, reducing this reporting burden by up to 70%;
The Group’s monthly business unit operational reports have also been standardised with a comprehensive monthly finance pack being used as the basis for monthly performance and forecast reviews.
Control and Execution We have two key objectives of improving our ability to forecast performance and enhancing both operational and finance controls. Examples of actions taken are:
We have moved from quarterly Sector level operational reviews to monthly reviews at the business unit level, giving us greater clarity on business unit performance and improved accountability for delivering improvement;
We have increased the level of oversight over key projects and material development programmes, with increased Group-level (independent) scrutiny;
We have made an internal Chief Operations Officer appointment, consolidating responsibility for the Group’s supply chain, quality, information technology and engineering functions;
Significant investment has commenced to remediate quality management, product quality, supply chain and infrastructure failings in certain larger sites;
We are launching a supply chain plan for Group spend on common categories of items and procurement changes to drive cost reductions and improve on-time delivery and quality. To the same end, we are also looking at how we optimise our manufacturing strategy across the Group;
Onerous Contract Update In 2016 we provided £179.1m of exceptional charges against certain of our fixed price customer contracts, including the KC-46 US tanker programme. We are progressing improvement in our quality management systems and the supply chain to deliver on these programmes. We have significantly increased the collaboration with our customer and key suppliers to resolve delivery issues and, while the programme continues to be challenging, the financial provisions created at 31 December 2016 remain appropriate.
6
Balance Sheet We said in the 2016 preliminary results that the balance sheet was not strong enough to support the operations of the Group or withstand challenging trading conditions, and an accelerated process to remedy this was needed to give customers, suppliers and employees confidence in our financial position. We therefore completed a Rights Issue in May 2017, raising £497m net of expenses. This, coupled with operating cash conversion in the period of 120%, resulted in a lower gearing ratio of 1.5x net debt/EBITDA at 30 June 2017. We expect a heavier phasing of net cash out flows in the next 12 months against the 2016 exceptional charges for onerous contract provisions and other legacy items. As a result, we confirm our previous guidance of limited free cash flow across 2017-2018. In addition, the proportion of the Group’s net debt denominated in US dollars, which had been significantly higher than US dollar denominated profit through 2016, has been more closely aligned during the first half of 2017. This closer alignment mitigates the risk of currency related gearing ratio volatility. Portfolio Review We have undertaken a review of our portfolio of businesses. The methodology used was to look below the business unit level and assess the level of commonality of the markets served and the capabilities and offerings we have. We then judged whether we have the market knowledge and necessary management expertise to optimise performance. In summary, we have concluded that Cobham is best placed to generate value when it focuses on its defence and commercial aerospace markets, in which it designs and delivers services, systems and products. We have therefore decided to commence a strategic review of the Group’s Wireless and AvComm business units, both part of the Communications and Connectivity Sector, comprising circa 10% of the Group’s revenue. These businesses have strong technology and/or market positions and we will investigate how to optimise shareholder value. Technology Investment Private Venture5 (PV) investment was £63.8m (2016: £63.6m) or 7.8% of revenue (2016: 8.6%). PV is an area of focus to ensure it is being correctly allocated and properly managed. Examples of significant investment in PV include within the Communications and Connectivity Sector ongoing investment in the Aviator S next generation SATCOM product, which is smaller and lighter than predecessor products. The Aviator S enables aircrew to share real-time information with dispatchers and ground control for greater safety and it also provides situational awareness and enhanced route optimisation. In addition, within Advanced Electronic Solutions, there are investments in high-power transmitter and amplifier technologies, which have positioned the Sector for a number of new ship, air, and space-based electronic warfare opportunities while addressing size and weight reductions to address emerging threats.
7
Dividend
As previously announced, the Board will not recommend either an interim or final dividend in respect of financial year 2017 and it expects to resume dividend payments when it is prudent to do so. This decision, and the level of payment, will take into account a number of factors including the Group’s underlying earnings, cash flows and gearing, its investment needs and the requirement to maintain an appropriate level of dividend cover. Financial Conduct Authority As announced in June, Cobham was notified by the Financial Conduct Authority that it had appointed investigators to ascertain whether the company had breached the Listing Rules and the Disclosure and Transparency Rules between April 2016 and February 2017 and the Market Abuse Regulation between July 2016 and February 2017. The Group does not intend to update the market further until completion of the investigation. Outlook The Group is in the early stages of its turnaround and there remains a wide range of potential outcomes for 2017 due to operational matters requiring attention, including arresting and reversing the Group’s negative performance trajectory and the resolution of onerous contracts, including the KC-46 US tanker programme, and other legacy issues. The necessary actions will take time and have associated costs. Having considered the first half performance and the progress made to date, the Board’s expectations for the year remain unchanged. Despite the ongoing challenges facing the Group, Cobham has a number of high quality businesses with differentiated technologies and know-how and leading positions in a number of attractive markets. These provide good opportunities over the medium term and give the Board confidence in Cobham’s future.
David Lockwood, OBE Chief Executive Officer BOARD On 31 July Cobham announced the appointment of John McAdam as a Non-executive Director and Senior Independent Director, effective from 3 August 2017, and he will join the Board’s Remuneration and Nomination Committees. John is currently Chairman of Rentokil Initial plc and United Utilities Group plc, roles he has held since 2008, and Senior Independent Director of Electra Private Equity PLC, a London Stock Exchange listed investment trust. It was also announced that Jonathan Flint will stand down as a member of the Cobham Board and Senior Independent Director on the same date. Consistent with the 2016 preliminary results announcement, it is expected that further new and experienced Non-executive Directors will be appointed. These Board changes are in addition to the strengthening of the Advanced Electronic Solutions Sector Board, which operates under an SSA. Further details are set out in the Sector review on page 12.

8
FINANCIAL OVERVIEW OF THE PERIOD
Group order intake was lower at £915.8m (2016: £1,170.4m), with order intake in 2016 benefiting from an initial net AUS$719m order booked relating to the significant multi-year contract extension from Qantas. Excluding this from the comparator, order intake was up 4% at constant exchange rates.
Group revenue increased to £1,003.3m (2016: £916.7m), driven by favourable currency translation. The Group’s organic revenue was broadly flat, largely as a result of a 5% (£12.6m) organic increase in the Advanced Electronic Solutions Sector being offset by a 3% (£12.1m) decrease in the Communications and Connectivity Sector. The Group made a statutory operating profit of £34.7m (2016: £12.0m loss). Offsetting the lower underlying operating profit result (explained below), statutory operating profit included, in addition to some smaller items, lower amortisation of intangible assets arising on business combinations of £72.4m (2016: £81.4m) and the benefit of positive movements in non-hedge accounted derivative financial instruments of £18.2m (2016: £25.1m adverse).
Group underlying operating profit was £89.9m (2016: £102.2m) after a favourable currency movement of £13.0m. Excluding the impact of currency translation, this is a reduction of £25.3m with the largest contributors to this being:
A £9.4m reduction in the Advanced Electronic Solutions Sector, due to £7.5m of increased costs as the Sector continued the build out of IT and functional infrastructure, in addition to an adverse revenue mix;
An £11.2m reduction in the Aviation Services Sector, being the combined impact of reduced natural resources flying, the repriced Qantas contact commencing on 1 January 2017 and a £2.7m charge relating to the settlement of legacy issues;
Additional IT amortisation of £2.8m relating to a large historic Enterprise Resource Planning (ERP) IT project (CBOS), which was recognised in the Head Office and Other segment. The costs of CBOS were largely capitalised up to the end of the first half of 2016.
The Group’s net finance charge was £20.4m (2016: £26.4m). The net expense on cash and debt holdings was £19.3m (2016: £25.5m). The net expense benefited from lower average net debt, following the June 2016 and May 2017 Rights Issues, although this was partially offset by adverse currency translation, as the majority of debt is denominated in foreign currency. The non-cash finance charge from pension schemes was £1.1m (2016: £0.9m). The Group’s underlying tax rate increased to 23.6% (2016: 22.0%) from an underlying tax charge of £16.4m (2016: £16.7m). The increased rate was primarily a result of the expected geographic mix of profits for the full year. The Group’s overall tax credit was £2.0m (2016: £13.4m credit), reflecting the Group’s profit mix after non-underlying items with the charge relating to the amortisation of intangible assets on business combinations having a US bias. The Group is reviewing its internal financing structures and is in the process of resolving certain tax issues from prior years (see note 5 on page 30). Given this, and the expected geographical mix of profits, the underlying tax rate is anticipated to increase by 1-4% over the medium term, subject to any future changes in tax legislation.

9
Basic EPS was 0.8p (2016: (1.6)p), including the restatement of the prior year figure following the 2017 Rights Issue. Underlying EPS was 34% lower at 2.5p (2016: 3.8p, restated), of which 1.1p was due to the higher average share count following the 2017 Rights Issue. Operating cash flow, which is stated after net capital expenditure, but before interest and tax payments was £108.3m (2016: £108.0m). Operating cash conversion was 120% (2016: 106%), and this was flattered by circa. £20m regarding the timing of working capital at the period end and lower net capital expenditure which was £26.6m (2016: £36.5m). Included within operating cash flow was £25m (2016: £nil) of cash out flow against the exceptional charges taken at 31 December 2016. Net interest paid was £21.4m (2016: £27.1m). The cash out flow relating to tax was £17.0m (2016: £9.7m).
Below free cash flow, there was a net inflow of £497.0m (2016: £492.8m – 2016 Rights Issue net proceeds), primarily relating to the net proceeds of the Rights Issue completed in May 2017.
The Group’s net debt decreased to £460.8m (31 December 2016: £1,028.2m) at 30 June 2017, including favourable exchange rate movements of £6.4m (2016: £119.1m adverse), which were largely driven by translation of Cobham’s US dollar denominated debt. The proportion of net debt denominated in US dollars has been more closely aligned to US dollar denominated profit during the first half of 2017. Cobham announced the results of its fully underwritten 2 for 5 Rights Issue on 5 May 2017, raising net proceeds of £496.7m. Consistent with the Group’s borrowing agreements, the net debt/EBITDA ratio was 1.5x (31 December 2016: 3.0x) at 30 June 2017. Interest cover was 5.7x (H1 2016: 5.6x).
SECTOR REVIEW
Intention to Restate Segmental Results
The Directors intend to restate the segmental analysis of underlying operating profit for the year ended 31 December 2017 to eliminate the net underlying operating profit that is currently reported within “Head Office and Other”. The Directors consider that this revision will more fairly reflect the underlying performance of the Sectors. The Group’s consolidated underlying operating profit and cash flow are unaffected by this change. To facilitate this change, a five year historical analysis of the segmental analysis will be provided ahead of the Group’s 2017 preliminary results.

10
Cobham Communications and Connectivity
Provides high performance equipment and solutions to enable reliable connectivity across a range of demanding environments in aerospace, avionics, satellite and radio, wireless and mobile connectivity markets.
£m H1 2016 FX Translation Organic H1 2017
Order intake 311.6 25.9 17.0 354.5 Revenue
328.5
29.4
(12.1)4
345.8
Operating profit** 21.9 5.2 (1.2) 25.9
Operating margin** 6.7% 7.5%
Order book 269.6 263.4 4See page 3 for definition of organic revenue **Underlying measures are defined in the notes on page 3
Organic revenue was 3% lower, principally impacted by AvComm, where organic revenue was lower by £14.4m. AvComm’s performance was driven by lower volumes due to disruption relating to a change of master distributor in North America and a large order shipped in 2016. In addition, there was lower revenue from retrofit of SATCOM products into the commercial aerospace market. Partially offsetting this there was increased Wireless revenue, including both test and measurement and coverage shipments.
Underlying operating profit reduced by £1.2m after the impact of exchange rates. There was an improvement in the trading performance of the Wireless business resulting from increased sales volumes. In addition, Wireless profit in the comparable period in 2016 was reduced by £9m due to accounting adjustments related to operational issues. However, these were offset by an adverse impact from a number of other factors, including the lower AvComm revenue, £3.6m of restructuring costs and increased PV investment of £3.8m in next generation SATCOM products.
Within aerospace markets, the first half of the year has seen the Sector launch a number of new products including Cobham Antenna Systems’ next generation Anti-Jam Global Positioning System (GPS). This provides improved jamming protection compared to a conventional antenna, allowing a platform to operate over 100 times closer to the jammer, while maintaining GPS reception. Cobham Aerospace Communications has also brought to market its new RT-7000 panel-mounted Tactical Radio, which is significantly smaller and lighter than its predecessor. Being interoperable across US federal emergency and military channels, the radio can be used for all public safety and para-public voice and data communication needs. In addition, Cobham’s Aviator S SATCOM product was selected for certification on the A350 XWB aircraft. Cobham SATCOM also marked a major milestone for its market leading Inmarsat FleetBroadband product, with delivery of the 50,000th SAILOR terminal. In Test and Measurement markets, the Wireless business saw strong demand for its TM/E500 test platform, driven by the acceleration of investment into the development of 5G products by major Network Equipment Manufacturers.
11
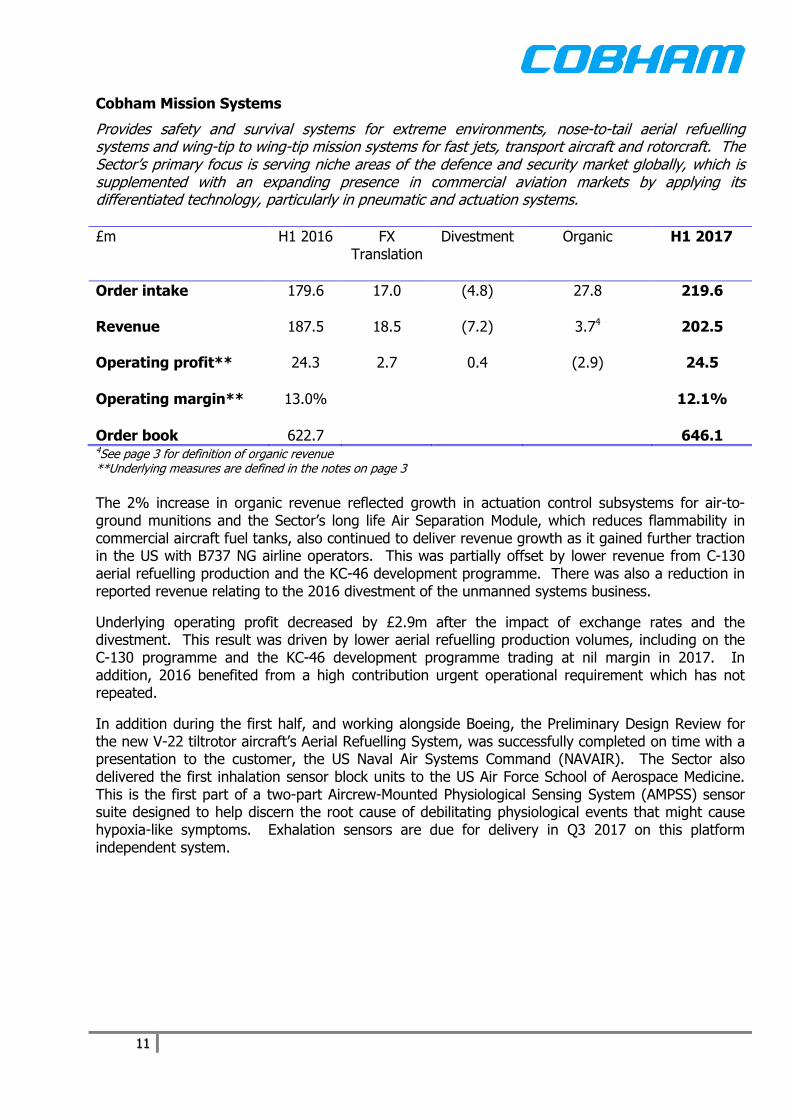
Cobham Mission Systems
Provides safety and survival systems for extreme environments, nose-to-tail aerial refuelling systems and wing-tip to wing-tip mission systems for fast jets, transport aircraft and rotorcraft. The Sector’s primary focus is serving niche areas of the defence and security market globally, which is supplemented with an expanding presence in commercial aviation markets by applying its differentiated technology, particularly in pneumatic and actuation systems.
£m H1 2016 FX Translation
Divestment Organic H1 2017
Order intake 179.6 17.0 (4.8) 27.8 219.6
Revenue 187.5 18.5 (7.2) 3.74 202.5
Operating profit** 24.3 2.7 0.4 (2.9) 24.5
Operating margin** 13.0% 12.1%
Order book 622.7 646.1 4See page 3 for definition of organic revenue **Underlying measures are defined in the notes on page 3
The 2% increase in organic revenue reflected growth in actuation control subsystems for air-to-ground munitions and the Sector’s long life Air Separation Module, which reduces flammability in commercial aircraft fuel tanks, also continued to deliver revenue growth as it gained further traction in the US with B737 NG airline operators. This was partially offset by lower revenue from C-130 aerial refuelling production and the KC-46 development programme. There was also a reduction in reported revenue relating to the 2016 divestment of the unmanned systems business.
Underlying operating profit decreased by £2.9m after the impact of exchange rates and the divestment. This result was driven by lower aerial refuelling production volumes, including on the C-130 programme and the KC-46 development programme trading at nil margin in 2017. In addition, 2016 benefited from a high contribution urgent operational requirement which has not repeated.
In addition during the first half, and working alongside Boeing, the Preliminary Design Review for the new V-22 tiltrotor aircraft’s Aerial Refuelling System, was successfully completed on time with a presentation to the customer, the US Naval Air Systems Command (NAVAIR). The Sector also delivered the first inhalation sensor block units to the US Air Force School of Aerospace Medicine. This is the first part of a two-part Aircrew-Mounted Physiological Sensing System (AMPSS) sensor suite designed to help discern the root cause of debilitating physiological events that might cause hypoxia-like symptoms. Exhalation sensors are due for delivery in Q3 2017 on this platform independent system.

12
Cobham Advanced Electronic Solutions
Provides critical solutions for communication on land, at sea, in the air and in space through off-the-shelf and customised products including radio frequency, microwave, and high reliability microelectronics, antenna subsystems and motion control solutions. This incorporates defence, including missile, radar and electronic warfare, X-ray imaging, medical and industrial markets.
£m H1 2016 FX Translation Organic H1 2017
Order intake 247.1 33.3 (23.2) 257.2
Revenue 225.6 30.2 12.64 268.4
Operating profit** 27.3 3.3 (9.4) 21.2
Operating margin** 12.1% 7.9%
Order book 615.0 630.1 4See page 3 for definition of organic revenue **Underlying measures are defined in the notes on page 3
Organic revenue increased by 5% and this increase was across a number of product areas including development revenue on US government electronic warfare and radar programmes and from the motion control portfolio. This included an increase in volumes relating to the F-35 Joint Strike Fighter, with the Sector having significant electronic warfare and radar subsystem content on this aircraft. This revenue growth was partially offset by lower revenue from radio frequency and microwave components, and lower revenue from sales of application specific integrated circuits.
Operating profit decreased by £9.4m after the impact of exchange rates. This was driven by previously reported increases to the Sector’s costs to strengthen its functional infrastructure. This included the build out of its IT systems and security compliance costs. In addition, the Sector has continued to be impacted by an adverse revenue mix, including lower margin development revenue.
During the half, the Sector received Low Rate Initial Production awards for a surface based electronic warfare programme, which is expected to deliver revenue growth in 2018 and future years. In addition, initial funding was received for the upgrade of the jammer used on the US Navy EA-18G Growler aircraft. This upgrade programme will deliver continued revenue streams on a critical system. The Sector also received initial funding for electronic warfare antenna and array products to support aircraft systems, including for the MC-130J aircraft. One of the Sector’s major sites will receive significant investment to transform production performance and remediate certain environmental issues.
As set out on page 51 of Cobham’s 2016 Annual Report and Accounts, the Sector operates under an SSA. As part of a plan to deliver improvement to governance and performance, the Sector Board has been significantly strengthened with the following new appointments:
Admiral Steve Abbot USN (retired) – former Deputy Commander in Chief US European Command;
General Mike Hagee USMC (retired) – 33rd Commandant of the US Marine Corps and Non-executive Director on the Cobham plc Board;

13
Cindy Moran – President and managing partner of IT consultancy, Pikes Way LLC, and former Director of Network Services, US Defense Information Systems Agency;
Scott Webster – Co-founder and executive director of Orbital Sciences Corporation.
Cobham Aviation Services
Delivers outsourced aviation services for customers worldwide, including military training, special mission flight operations, outsourced commercial aviation, including fly-in fly-out services to the natural resources industry and aircraft engineering. £m H1 2016 FX Translation Organic H1 2017
Order intake 432.1 64.5 (410.6) 86.0
Revenue 175.7 17.1 (5.0)4 187.8
Operating profit** 21.2 1.7 (11.2) 11.7
Operating margin** 12.1% 6.2%
Order book 1,436.4 1,276.1 4See page 3 for definition of organic revenue **Underlying measures are defined in the notes on page 3
The Sector’s organic revenue was 3% lower which was attributable to its commercial markets with lower flying activity from Australian natural resources customers and from the repricing of the contract with Qantas, with an extended agreement commencing in January 2017. There was also the completion of a helicopter services contract. This was partially offset by the new Australian Maritime Safety Authority (AMSA) contract, which continued to mobilise during the half. Underlying operating profit was £11.2m lower after the impact of exchange rates, due to the revenue variances above and £2.7m of non-recurring charges, relating to the settlement of legacy issues which became apparent in the period.
The Sector’s order intake was lower than the prior year, which included receipt of the net initial order for AUS$719m relating to the multi-year Qantas contract extension in 2016. Despite continuing challenging conditions within the Australian natural resources market the Sector will start flying operations from Adelaide for the recently awarded Oz Minerals fly-in, fly-out contract in the second half. The ten year contract extension to continue operations across Australia for Qantas commenced on 1 January 2017, providing a solid foundation for the commercial business. Three of the four specially modified Bombardier Challenger CL-604 aircraft for the AMSA contract are now fully operational, with mobilisation of the spare aircraft nearing completion. The Sector also announced in March 2017 the formation of the Cobham Helicopter Academy, based in Newquay in the UK, to provide military and civil helicopter training. The academy will enable the Sector to continue to provide helicopter training services, when the UK Defence Helicopter Flying School contract finishes at the end of the first quarter of 2018.

14
OTHER FINANCIAL ITEMS
Summary of Underlying Results
To assist with the understanding of earnings trends, the Group has included within its published financial statements non-GAAP measures including underlying operating profit and underlying earnings. These are considered by the Board to be the most meaningful measures under which to assess the operating performance of the Group and provide additional useful information on underlying trends to shareholders. The non-GAAP measures used do not include the impact of items described below which are not considered to reflect the day-to-day operating results of the Group. As the Group has been acquisitive over time, these include certain accounting treatments and adjustments that do not result from the underlying business activity. Underlying measures are therefore considered to provide a more comparable view year on year, having removed the distorting effects of excluded items which are more clearly understood when presented separately. A reconciliation of statutory to underlying profit numbers is set out on page 18. A summary of the Group’s underlying results is set out below:
£m H1 2017 H1 2016
Revenue 1,003.3 916.7
Operating profit Operating margin
89.9 9.0%
102.2 11.1%
Net finance expense (20.4) (26.4)
Profit before tax Tax Tax rate
69.5 (16.4)
23.6%
75.8 (16.7) 22.0%
Profit after tax Weighted average number of shares (millions)*
53.1 2,084.2
59.1 1,556.7
EPS (pence)* 2.5 3.8
*Comparatives restated to reflect the bonus element of the Rights Issue completed during 2017.
Currency Translation Exchange Rates
The following are the average and closing rates for the four foreign currencies that have most impact on translation into pounds sterling of the Group’s Income Statement and Balance Sheet:
H1 2017 H1 2016
Income Statement - average rate US$/£ 1.26 1.43 AUS$/£ 1.67 1.95 €/£ 1.16 1.28 DKK/£ 8.64 9.54
Balance Sheet - closing rate US$/£ 1.30 1.34 AUS$/£ 1.69 1.80 €/£ 1.14 1.20 DKK/£ 8.47 8.95

15
Statutory Operating Profit
The Group made a statutory operating profit of £34.7m (2016: £12.0m loss). In addition to the lower underlying operating profit result, statutory operating profit includes items which have been accounted for as non-underlying, consistent with prior years. The net charge arising from these non-underlying items is lower than the prior period, and these comprise:
Amortisation of intangible assets arising on business combinations of £72.4m (2016: £81.4m);
Goodwill and other intangible assets arising on business combinations are recognised as a result of the purchase price allocation on acquisition of subsidiaries.
Favourable movements in non-hedge accounted derivative financial instruments of £18.2m
(2016: £25.1m adverse);
The impact of derivative financial instruments excluded from underlying results includes changes in the marking to market of non-hedge accounted derivative financial instruments. These amounts relate to foreign currency exchange contracts and would not impact results had the Group chosen to comply with IAS 39 requirements to enable these contracts to be hedge accounted.
Amounts relating to relate to the integration of the 2014 Aeroflex acquisition of £2.4m
(2016: £8.3m);
These costs relate to prior years’ restructuring programmes which have been accounted for as incremental to normal operations and non-recurring in nature.
There was a credit adjustment of £1.4m (2016: £nil) relating to the revisions of carrying value of other assets provided at 31 December 2016;
This adjustment related to a provision against aged receivables, which was considered doubtful at 31 December 2016, but which has now been recovered. Narrative on the Group’s underlying profit is set out in the individual Sector reviews. Profit Before Tax The Group made a statutory profit before tax of £14.3m (2016: £38.4m - loss). The Group’s underlying profit before tax was £69.5m (2016: £75.8m). Earnings per Share (EPS)
Basic EPS was 0.8p (2016: (1.6)p), including the restatement of the prior year figure for the bonus factor of 1.15, following the 2017 Rights Issue. In addition to the underlying operating performance, basic EPS was impacted by the exceptional items set out in the paragraphs on statutory operating profit, most notably the charge for amortisation of intangible assets, partially offset by a gain on non-hedge accounted derivative financial instruments. There was also a higher share count, as set out below. Underlying EPS was 34% lower at 2.5p (2016: 3.8p, restated) of which 1.1p was due to the higher average share count following the 2017 Rights Issue. There was also an impact from the lower underlying operating profit and a higher underlying tax rate but this was partially offset by the favourable impact from the lower interest charge and currency translation.

16
The Group’s average share count in the half year was 2,084.2m (2016: 1,353.7m or 1,556.7m restated to reflect the bonus element of the Rights Issue completed during 2017). The share count at 30 June 2017, excluding treasury shares, was 2,391.0m shares (31 December 2016: 1,707.9m). Retirement Obligations
Cobham operates a number of defined benefit pension schemes, with the largest being the Cobham Pension Plan in the UK. At 30 June 2017 the estimated deficit for accounting purposes, which is the difference between the aggregate value of the schemes’ assets and the present value of their future liabilities, was £64.2m before deferred tax (31 December 2016: £87.0m). The most significant reductions to the deficit were due to:
Net employer contributions of £9.0m;
Actuarial gains of £6.1m on plan liabilities, which arose due to the decrease in inflation rate projections, partially offset by a decrease in the corporate bond discount rate;
Actuarial investment gains of £8.4m, with a contribution from liability driven investments, which partially hedges movements in the discount rate.
Cash Flow
Operating cash flow, which is stated after net capital expenditure, but before interest and tax payments was £108.3m (2016: £108.0m). Operating cash conversion was 120% (2016: 106%). The higher cash conversion was driven by a cash inflow from working capital of £45.8m (2016: £23.1m), which was flattered by circa £20m regarding the timing of working capital around the period end. In addition, there was lower net capital expenditure of £26.6m (2016: £36.5m). Included within operating cash flow was £25m (2016: £nil) of cash out flow against the exceptional charges taken at 31 December 2016. Free cash flow was £64.6m (2016: £54.0m). There was net interest paid of £21.4m (2016: £27.1m). In addition, tax payments were £17.0m (2016: £9.7m), due to timing and the geographic mix of profits. Also included in free cash flow were payments relating to prior periods’ restructuring programmes of £5.3m (2016: £17.2m). Below free cash flow, there was no dividend payment (2016: £91.6m), following the previously announced decision to suspend the 2016 final dividend. There was a net inflow of £497.0m (2016: £492.8m – 2016 Rights Issue net proceeds), primarily relating to the net proceeds of the Rights Issue completed in the half.

17
The table below sets out the Group’s cash flows over the period:
£m H1 2017 H1 2016 Underlying operating profit 89.9 102.2 Less: share of post-tax results of joint ventures - (0.1) Underlying operating profit (excluding joint ventures) 89.9 102.1 Depreciation and amortisation 41.4 33.9 Share based payments 2.3 1.3 Movement in provisions (35.9) (7.7) Pension contributions in excess of pension charges (8.6) (8.2) Decrease in working capital 45.8 23.1 Gross capital expenditure (27.4) (40.7) Proceeds on disposal of property, plant & equipment 0.8 4.2
Operating cash flow 108.3 108.0 Operating cash/operating profit (excluding JV’s) 120% 106% Net interest paid (21.4) (27.1) Taxation paid (17.0) (9.7) Amounts related to prior periods’ restructuring programmes (5.3) (17.2) Free cash flow 64.6 54.0 Dividends paid - (91.6) Business acquisition and divestment related costs paid (0.6) (6.5) Net Rights Issue proceeds and treasury shares allocation 497.0 492.8 Exchange movements 6.4 (119.1) Decrease in net debt 567.4 329.6 Opening net debt (1,028.2) (1,206.8)
Closing net debt (460.8) (877.2)
Net Debt, Gearing and 2017 Rights Issue
The Group’s net debt decreased to £460.8m (31 December 2016: £1,028.2m) at 30 June 2017, including favourable exchange rate movements of £6.4m (2016: £119.1m adverse), which were largely driven by translation of Cobham’s US dollar denominated debt between the opening and closing rates. At 30 June 2017 net debt comprised gross debt of £943.3m (30 June 2016: £1,371.0m) and cash of £482.5m (30 June 2016: £493.8m). Cobham announced the results of its fully underwritten 2 for 5 Rights Issue on 5 May 2017. The Rights Issue raised net proceeds of £496.7m in the period. The net proceeds have been used to pay down Group debt as it matured, principally variable rate bank debt of £183m. The Group has also repaid a US$44m fixed rate senior note without incurring make-whole charges. The balance is being held in bank deposits. The Group currently intends to refinance its revolving credit facilities in advance of their maturity in October 2018 and will then review the appropriate level of senior notes and cash holdings.
In addition, the proportion of the Group’s net debt denominated in US dollars, which had been significantly higher than US dollar denominated profit through 2016, has been more closely aligned during the first half of 2017. This closer alignment mitigates the risk of currency related gearing ratio volatility. Consistent with the Group’s borrowing agreements, the net debt/EBITDA ratio was 1.5x (31 December 2016: 3.0x) at 30 June 2017. Interest cover was 5.7x (H1 2016: 5.6x).

18
RECONCILIATION OF UNDERLYING MEASURES
To assist with the understanding of earnings trends, the Group has included within its published financial statements non-GAAP measures including underlying operating profit and underlying earnings results. These are considered by the Board to be the most meaningful measures under which to assess the operating performance of the Group and provide additional useful information on underlying trends to shareholders. The non-GAAP measures used do not include the impact of items described below which are not considered to reflect the day to day operating results of the Group. As the Group has been acquisitive over time, these include certain accounting treatments and adjustments that do not result from the underlying business activity. Underlying measures are therefore considered to provide a more comparable view year-on-year, having removed the distorting effects of the excluded items which are more clearly understood when presented separately. Definitions of the underlying measures can be found on page 3. The table below provides a reconciliation between the statutory operating profit (2016: loss) and underlying operating profit, as well as between the statutory profit before tax (2016: loss) and underlying profit before tax.
£m H1 2017
H1 2016
Operating profit/(loss) 34.7 (12.0)
Adjusted to exclude:
Amortisation of intangible assets arising on business combinations
72.4 81.4
Amounts relating to prior periods’ restructuring programmes
2.4 8.3
Derivative financial instruments (18.2) 25.1
Adjustments to revisions of the carrying value of other assets provided at 31 December 2016
(1.4) -
Profit on divestments - (0.6)
Total operating reconciling items 55.2 114.2
Underlying operating profit 89.9 102.2
£m
Underlying profit before tax is calculated as follows:
Profit/(loss) before taxation 14.3 (38.4)
Total operating reconciling items as above 55.2 114.2
Underlying profit before taxation 69.5 75.8
Taxation charge on underlying profit (16.4) (16.7)
Underlying profit after taxation 53.1 59.1
Underlying EPS (pence) 2.5 3.8
19
Cautionary Statements
This announcement contains ‘forward-looking statements’ with respect to the financial condition, results of
operations and business of Cobham and to certain of Cobham’s plans and objectives with respect to these
items.
Forward-looking statements are sometimes but not always identified by the use of a date in the future or such
words as ‘anticipates’, ‘aims’, ‘due’, ‘could’, ‘may’, ‘should’, ‘expects’, ‘believes’, ‘intends’, ‘plans’, ‘targets’,
‘goal’, or ‘estimates’ (or the negatives thereof). By their very nature forward-looking statements are
inherently unpredictable, speculative and involve risk and uncertainty because they relate to events and
depend on circumstances that may or will occur in the future.
There are various factors that could cause actual results and developments to differ materially from those
expressed or implied by these forward-looking statements. These factors include, but are not limited to,
changes in the economies, political situations and markets in which the Group operates; changes in
government priorities due to programme reviews or revisions to strategic objectives; changes in the
regulatory or competition frameworks in which the Group operates; the impact of legal or other proceedings
against or which affect the Group; changes to or delays in programmes in which the Group is involved; the
completion of acquisitions and divestitures and changes in commodity prices, inflation or exchange rates.
All written or verbal forward-looking statements, made in this document or made subsequently, which are
attributable to Cobham or any other member of the Group or persons acting on their behalf, are expressly
qualified in their entirety by the factors referred to above. Neither Cobham nor any other person intends to
update these forward-looking statements.
No statement in this announcement is intended as a profit forecast and no statement in this announcement
should be interpreted to mean that underlying operating profit for the current or future financials years would
necessarily be above a minimum level, or match or exceed the historical published operating profit or set a
minimum level of operating profit.
20
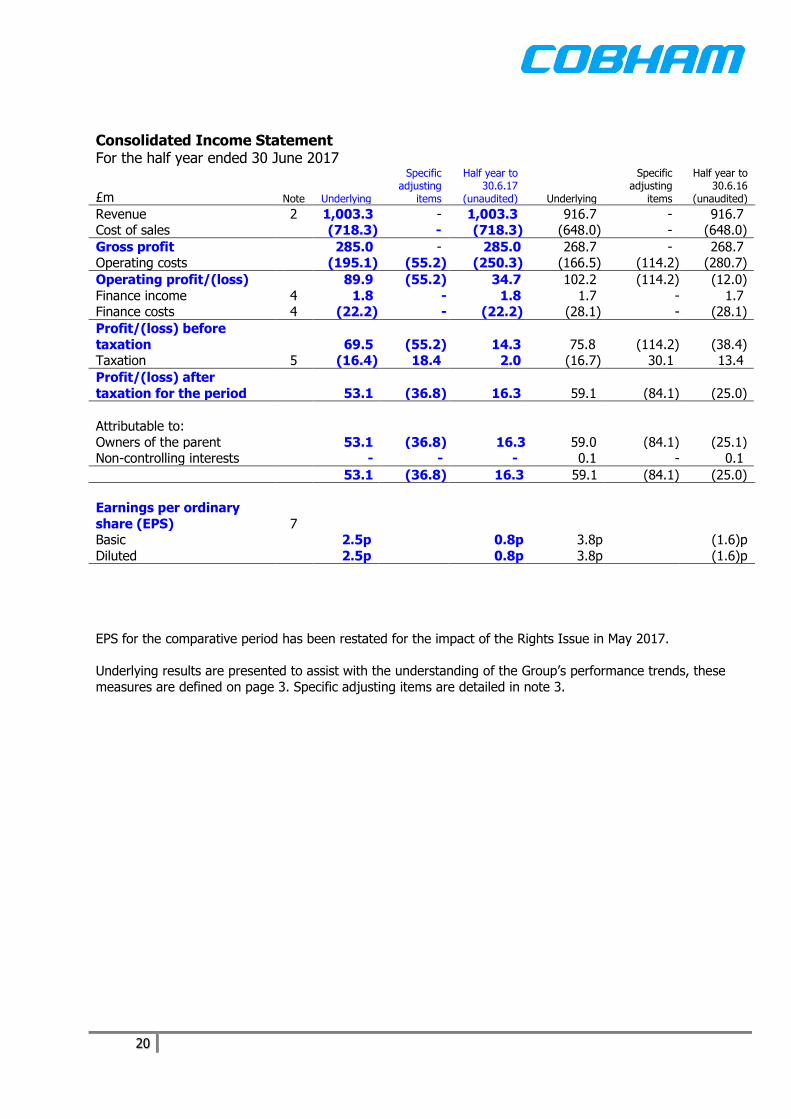
EPS for the comparative period has been restated for the impact of the Rights Issue in May 2017.
Underlying results are presented to assist with the understanding of the Group’s performance trends, these
measures are defined on page 3. Specific adjusting items are detailed in note 3.
Consolidated Income Statement For the half year ended 30 June 2017
£m Note Underlying
Specific adjusting
items
Half year to 30.6.17
(unaudited) Underlying
Specific adjusting
items
Half year to 30.6.16
(unaudited)
Revenue 2 1,003.3 - 1,003.3 916.7 - 916.7 Cost of sales (718.3) - (718.3) (648.0) - (648.0)
Gross profit 285.0 - 285.0 268.7 - 268.7 Operating costs (195.1) (55.2) (250.3) (166.5) (114.2) (280.7)
Operating profit/(loss) 89.9 (55.2) 34.7 102.2 (114.2) (12.0)
Finance income 4 1.8 - 1.8 1.7 - 1.7 Finance costs 4 (22.2) - (22.2) (28.1) - (28.1)
Profit/(loss) before
taxation 69.5 (55.2) 14.3 75.8 (114.2) (38.4) Taxation 5 (16.4) 18.4 2.0 (16.7) 30.1 13.4
Profit/(loss) after
taxation for the period 53.1 (36.8) 16.3 59.1 (84.1) (25.0)
Attributable to:
Owners of the parent 53.1 (36.8) 16.3 59.0 (84.1) (25.1) Non-controlling interests - - - 0.1 - 0.1
53.1 (36.8) 16.3 59.1 (84.1) (25.0)
Earnings per ordinary
share (EPS) 7
Basic 2.5p 0.8p 3.8p (1.6)p
Diluted 2.5p 0.8p 3.8p (1.6)p

21
Consolidated Statement of Comprehensive Income For the half year ended 30 June 2017
£m Note
Half year to
30.6.17 (unaudited)
Half year to
30.6.16 (unaudited)
Profit/(loss) after taxation for the period 16.3 (25.0)
Items that will not be reclassified subsequently to profit or loss Remeasurements of defined benefit retirement benefit obligations 12 14.5 (23.3)
Tax effects (2.8) 4.7
11.7 (18.6)
Items that may subsequently be reclassified to profit or loss Net translation differences on investments in overseas subsidiaries (22.8) 51.3
Reclassification of cash flow hedge fair values 0.3 1.0 Hedge accounted derivative financial instruments (0.9) (0.3)
Tax effects 0.1 0.1
(23.3) 52.1
Other comprehensive (expense)/income for the period (11.6) 33.5
Total comprehensive income for the period 4.7 8.5
Attributable to:
Owners of the parent 4.6 8.3 Non-controlling interests 0.1 0.2
4.7 8.5

22
Consolidated Balance Sheet
As at 30 June 2017
£m Note As at 30.6.17
(unaudited) As at 30.6.16
(unaudited) As at 31.12.16
(audited)
Assets Non-current assets
Intangible assets 9 1,069.7 1,769.0 1,165.9
Property, plant and equipment 10 403.0 406.7 422.9 Investment properties 3.5 4.2 3.6
Investments in joint ventures and associates 3.8 3.4 3.6 Trade and other receivables 69.8 80.3 66.0
Other financial assets 6.1 6.1 6.1
Deferred tax 38.1 14.1 42.3 Derivative financial instruments 22.7 18.4 19.7
1,616.7 2,302.2 1,730.1
Current assets Inventories 415.8 439.3 405.3
Trade and other receivables 359.0 366.5 409.8 Current tax receivables 5.0 4.4 3.1
Derivative financial instruments 8.5 6.4 8.5
Cash and cash equivalents 482.5 493.8 236.2 Assets classified as held for sale - 8.5 -
1,270.8 1,318.9 1,062.9
Liabilities Current liabilities
Borrowings (57.9) (93.7) (60.9) Trade and other payables (439.0) (421.3) (430.8)
Provisions 11 (154.5) (73.4) (180.6)
Current tax liabilities (146.5) (114.6) (149.5) Derivative financial instruments (26.6) (40.1) (42.2)
Liabilities associated with assets classified as held for sale - (4.0) -
(824.5) (747.1) (864.0)
Non-current liabilities
Borrowings (885.4) (1,277.3) (1,203.5) Trade and other payables (40.4) (30.5) (31.5)
Provisions 11 (41.0) (51.1) (57.3)
Deferred tax (11.6) (88.6) (27.6) Derivative financial instruments (26.8) (32.7) (32.2)
Retirement benefit obligations 12 (64.2) (74.0) (87.0)
(1,069.4) (1,554.2) (1,439.1)
Net assets 993.6 1,319.8 489.9
Equity
Share capital 61.7 44.6 44.6
Share premium 1,257.9 778.3 778.3 Other reserves 15.3 50.7 37.9
Retained earnings (342.5) 445.1 (372.0)
Total equity attributable to the owners of the parent 992.4 1,318.7 488.8
Non-controlling interests in equity 1.2 1.1 1.1
Total equity 993.6 1,319.8 489.9

23
Consolidated Statement of Changes in Equity For the half year ended 30 June 2017 (unaudited)
£m Share capital
Share premium
Other reserves
Retained earnings
Total attributable
to owners of the parent
Non-controlling
interests Total
equity
Total equity at 1 January 2017 44.6 778.3 37.9 (372.0) 488.8 1.1 489.9
Profit for the period - - - 16.3 16.3 - 16.3 Items that will not be reclassified subsequently to profit or loss - - - 11.7 11.7 - 11.7 Items that may subsequently be reclassified to profit or loss - - (24.0) 0.6 (23.4) 0.1 (23.3) Total comprehensive income for the period - - (24.0) 28.6 4.6 0.1 4.7
Issue of shares, net of costs (note 7) 17.1 479.6 - - 496.7 - 496.7 Proceeds on allocation of treasury shares - - - 0.3 0.3 - 0.3
Share based payments - - 2.3 - 2.3 - 2.3 Transfer of other reserves to retained earnings - - (0.6) 0.6 - - -
Tax effects - - (0.3) - (0.3) - (0.3)
Total equity at 30 June 2017 61.7 1,257.9 15.3 (342.5) 992.4 1.2 993.6
For the year ended 31 December 2016 (audited)
£m Share capital
Share premium
Other reserves
Retained earnings
Total attributable
to owners of the parent
Non-controlling
interests Total
equity
Total equity at 1 January 2016 30.4 301.9 (0.3) 576.8 908.8 0.9 909.7
Loss for the year - - - (795.2) (795.2) 0.1 (795.1) Items that will not be reclassified subsequently to profit or loss - - - (34.9) (34.9) - (34.9) Items that may subsequently be reclassified to profit or loss - - 40.5 - 40.5 - 40.5 Total comprehensive expense for the year - - 40.5 (830.1) (789.6) 0.1 (789.5)
Issue of shares, net of costs 14.2 476.4 - - 490.6 - 490.6 Proceeds on allocation of treasury shares - - - 2.3 2.3 - 2.3
Dividends (note 6) - - - (126.1) (126.1) - (126.1)
Share based payments - - 3.8 - 3.8 - 3.8 Transfer of other reserves to retained earnings - - (5.1) 5.1 - - -
Tax effects - - (1.2) - (1.2) - (1.2)
Foreign exchange adjustments - - 0.2 - 0.2 0.1 0.3 Total equity at 31 December 2016 44.6 778.3 37.9 (372.0) 488.8 1.1 489.9

24
Consolidated Statement of Changes in Equity (continued)
For the half year ended 30 June 2016 (unaudited)
£m Share capital
Share premium
Other reserves
Retained earnings
Total attributable
to owners of the parent
Non-controlling
interests Total
equity
Total equity at 1 January 2016 30.4 301.9 (0.3) 576.8 908.8 0.9 909.7
Loss for the period - - - (25.1) (25.1) 0.1 (25.0) Items that will not be reclassified subsequently to profit or loss - - - (18.6) (18.6) - (18.6) Items that may subsequently be reclassified to profit or loss - - 52.0 - 52.0 0.1 52.1 Total comprehensive income for the period - - 52.0 (43.7) 8.3 0.2 8.5
Issue of shares, net of costs 14.2 476.4 - - 490.6 - 490.6 Proceeds on allocation of treasury shares - - - 2.2 2.2 - 2.2
Dividends (note 6) - - - (91.6) (91.6) - (91.6)
Share based payments - - 1.3 - 1.3 - 1.3 Transfer of other reserves to retained earnings - - (1.4) 1.4 - - -
Tax effects - - (0.9) - (0.9) - (0.9)
Total equity at 30 June 2016 44.6 778.3 50.7 445.1 1,318.7 1.1 1,319.8

25
Consolidated Cash Flow Statement
For the half year ended 30 June 2017
£m Note
Half year to 30.6.17
(unaudited)
Half year to 30.6.16
(unaudited)
Year to 31.12.16 (audited)
Cash generated from operations 8 129.5 120.6 226.0
Tax paid (17.0) (9.7) (20.1) Interest paid (22.7) (28.5) (74.7)
Interest received 1.3 1.4 3.5
Net cash from operating activities 91.1 83.8 134.7
Cash flows from investing activities
Purchase of property, plant and equipment (21.7) (35.7) (82.8) Purchase of intangible assets (5.7) (5.0) (9.1)
Capitalised expenditure on intangible assets - - (0.3) Proceeds on disposal of property, plant and equipment 0.8 4.2 6.1
Acquisition of subsidiaries - - (1.4) (Costs)/proceeds of business divestments (0.5) 0.2 1.0
Net cash used in investing activities (27.1) (36.3) (86.5)
Cash flows from financing activities
Issue of share capital 7 496.7 490.6 490.6
Dividends paid 6 - (91.6) (126.1) Proceeds on allocation of treasury shares 0.3 2.2 2.3
New borrowings - - 9.9 Repayment of borrowings (281.5) (292.0) (497.0)
Net cash from/(used in) financing activities 215.5 109.2 (120.3)
Net increase/(decrease) in cash and cash equivalents 279.5 156.7 (72.1)
Exchange movements (33.2) 43.1 14.3
Cash and cash equivalents at start of period 236.2 294.0 294.0
Cash and cash equivalents at end of period 482.5 493.8 236.2
Reconciliation of cash and cash equivalents and net debt
£m As at 30.6.17
(unaudited) As at 30.6.16
(unaudited) As at 31.12.16
(audited)
Cash and cash equivalents 482.5 493.8 236.2
Borrowings - current liabilities (57.9) (93.7) (60.9)
Borrowings - non-current liabilities (885.4) (1,277.3) (1,203.5)
Net debt (460.8) (877.2) (1,028.2)
Reconciliation of movements in net debt
£m
Half year to 30.6.17
(unaudited)
Half year to 30.6.16
(unaudited)
Year to 31.12.16 (audited)
Net debt at start of period (1,028.2) (1,206.8) (1,206.8) Increase/(decrease) in cash and cash equivalents per Cash Flow
Statement 279.5 156.7 (72.1)
New borrowings - - (9.9)
Repayment of borrowings 281.5 292.0 497.0
Exchange movements 6.4 (119.1) (236.4)
Net debt at end of period (460.8) (877.2) (1,028.2)

26
Notes to the Interim Financial Statements
For the half year ended 30 June 2017 1. Basis of preparation This unaudited condensed interim financial information for the half year ended 30 June 2017 has been
prepared in accordance with the Disclosure Guidance and Transparency Rules sourcebook of the Financial Conduct Authority, and with IAS 34, Interim Financial Reporting, as adopted by the European Union (EU) and
applicable laws and regulations. It comprises the Consolidated Income Statement, the Consolidated
Statement of Comprehensive Income, the Consolidated Balance Sheet, the Consolidated Statement of Changes in Equity, the Consolidated Cash Flow Statement and the related notes (the Interim Financial
Statements). This information should be read in conjunction with the annual financial statements for the year ended 31 December 2016, which have been prepared in accordance with IFRS as adopted by the EU. These
Interim Financial Statements have been reviewed, not audited.
The Directors believe, after making enquiries they consider to be appropriate, that the Group has adequate
resources to continue in operational existence for the foreseeable future. For this reason they continue to adopt the going concern basis in preparing the financial statements. The Directors have made this
assessment after consideration of the Group's forecast operating cash flows and related assumptions, undrawn debt facilities, debt maturity review, analysis of debt covenants and in accordance with the Going
Concern and Liquidity Risk: Guidance for Directors of UK Companies 2009, published by the Financial
Reporting Council.
These Interim Financial Statements and the comparative figures for the year ended 31 December 2016 do not constitute statutory accounts within the meaning of section 434 of the Companies Act 2006. Full accounts for
that year have been delivered to the Registrar of Companies. The report of the auditors on those accounts
included a reference to matters to which the auditor drew attention by way of emphasis without qualifying the report, but did not contain any statement under section 498 of the Companies Act 2006.
The emphasis of matter paragraph included in the auditors' report for the year ended 31 December 2016 was
as follows:
"In forming our opinion on the financial statements [the 2016 Annual Report and Accounts], which is not
modified, we have considered the adequacy of the disclosures made in note 1 to the financial statements [the 2016 Annual Report and Accounts] concerning the Group’s ability to continue as a going concern. The matters
explained in the Directors’ going concern assessment on page 33 [in the 2016 Annual Report and Accounts] disclose that a shareholder vote is required in order to increase the share capital of the Company which is
needed to raise additional capital through a Rights Issue and this has not yet taken place. The Rights Issue is
fully underwritten on a standby basis, subject to customary conditions. These conditions, along with the other matters explained in note 1 to the financial statements [the 2016 Annual Report and Accounts] indicates the
existence of a material uncertainty which may cast significant doubt about the Group’s ability to continue as a going concern. The financial statements do not include the adjustments that would result if the Group was
unable to continue as a going concern."
The shareholder vote referred to above was passed as proposed and the Rights Issue successfully completed
in May 2017, raising £496.7m net of costs.
The Interim Results were approved by the Board of Directors and approved for issue on 2 August 2017. The report is being sent to shareholders on request and will be available to members of the public at Cobham plc’s
registered office at Brook Road, Wimborne, Dorset, BH21 2BJ, UK and on the Company’s website,
www.cobham.com.

27
Accounting policies The accounting policies applied are consistent with those published in the financial statements for the year
ended 31 December 2016 and are expected to be applied for the year ended 31 December 2017. From 1 January 2017 a number of amendments to existing standards, which were effective from 1 January 2017 and
have been endorsed by the EU, have been adopted; however no changes to previously published accounting
policies or other adjustments were required on their adoption.
In the interim financial statements, taxes on income are accrued using the best estimate of the weighted average tax rate that is expected to be applicable for the full financial year.
The Group will adopt IFRS 15, Revenue from Contracts with Customers, from 1 January 2018. When IFRS 15 is adopted in 2018 comparatives will be restated using the fully retrospective approach and this will result in
amounts included in work in progress in respect of the contracts where revenue is recognised over time being recognised within trade receivables including margin. In the 2016 Annual Report a more detailed description
of the expected impact of adopting IFRS 15 was provided. Cash flows will not be impacted by the Standard. The impact of IFRS 15 on the 2017 and 2018 results will depend on the contracts in force during the year,
and the assessment of the impact of this new Standard continues to be refined with reference to contracts
currently in place. While detailed work is ongoing, a preliminary assessment of the impact on the half year ended 30 June 2017 indicates that £125m of work in progress would be derecognised and replaced by trade
receivables of £125m plus margin. The preliminary assessment of the impact on the December 2016 Balance Sheet indicates that £137m of work in progress would be derecognised and replaced by trade receivables
gross of margin. After considering foreign exchange movements, the percentage impact on revenue and gross
profit recognised in the half year ended 30 June 2017 is not expected to be material.
IFRS 16, effective from 1 January 2019, subject to EU endorsement, requires all leases to be recognised on the Balance Sheet. Broadly the Group will recognise leases currently treated as operating leases as a lease
liability and a right-to-use asset, after adjusting for extension periods that are reasonably certain to be taken
and discounting using the rate implicit in the lease or the incremental cost of borrowing. Management are currently assessing the impact of adopting this standard and considering the different transition options.
Definitions
Underlying measures
To assist with the understanding of earnings trends, the Group has included within its published financial
statements non-GAAP measures including underlying operating profit and underlying profit. These are considered by the Board to be the most meaningful measures under which to assess the true operating
performance of the Group.
The non-GAAP measures used are not defined terms under IFRS and therefore may not be comparable to similar measures used by other companies. They are not intended to be a substitute for, or superior to, GAAP
measures.
In order to provide a more comparable view year-on-year, underlying measures remove the distorting effects
of the specific adjusting items described below. These are not considered to reflect the day to day operating results of the Group and are more clearly understood when presented separately. All underlying measures
include the operational results of all businesses including those held for sale until the point of sale.
Underlying operating profit has been defined as operating profit from continuing operations excluding the
specific adjusting items as described below:
business acquisition and divestment related items comprising the amortisation of intangible assets
arising on business combinations, gains or losses arising on business divestments, adjustments to businesses held for sale, the writing off of the pre-acquisition profit element of inventory written up
on acquisition, revaluation gains and losses arising on the original equity interests on stepped

28
acquisitions, other direct costs associated with business combinations and terminated divestments,
and adjustments to contingent consideration related to previously acquired businesses; amounts related to prior periods' restructuring programmes which commenced before 2017. These
are incremental to normal operations and non-recurring in nature. In 2017 and 2016, they relate to
the integration of the Aeroflex businesses acquired in 2014; changes in the marking to market of non-hedge accounted derivative financial instruments and gains
and losses arising on dividend related foreign exchange contracts; and
other items deemed by the Directors to be of an exceptional, non-operating nature including
impairment of intangible assets and adjustments arising from the Balance Sheet review set out in the 2016 Annual Report and Accounts.
Further details of specific adjusting items can be found in note 3.
Underlying profit before taxation is defined as underlying operating profit less net underlying finance costs, which exclude business acquisition and divestment related items and non-recurring finance costs.
Net debt Net debt is defined as the net of borrowings less cash and cash equivalents at the balance sheet date.
Free cash flow and operating cash flow Free cash flow is defined as net cash from operating activities plus dividends received from joint ventures,
less cash flows related to the purchase or disposal of property, plant, equipment and intangible assets but excluding payments relating to business acquisition and divestment related activities.
Operating cash flow is free cash flow before payment of tax, interest and restructuring costs.
Operating segments The chief operating decision making body for the Group has been identified as the Board. It reviews the
Group’s internal reporting in order to assess performance and allocate resources. Details of the composition
and purpose of the Board can be found on pages 44 to 52 of the 2016 Annual Report and Accounts. The Group reports four operating segments whose revenue and results are reported to the Board as disclosed in
note 2. All operating segments meet the definition of reportable segments as defined in IFRS 8.
The Board assesses the trading performance of operating segments based on revenue and underlying
operating profit as defined above. Finance income, finance costs and taxation are not segmented and are reviewed by the Board on a consolidated basis.
29
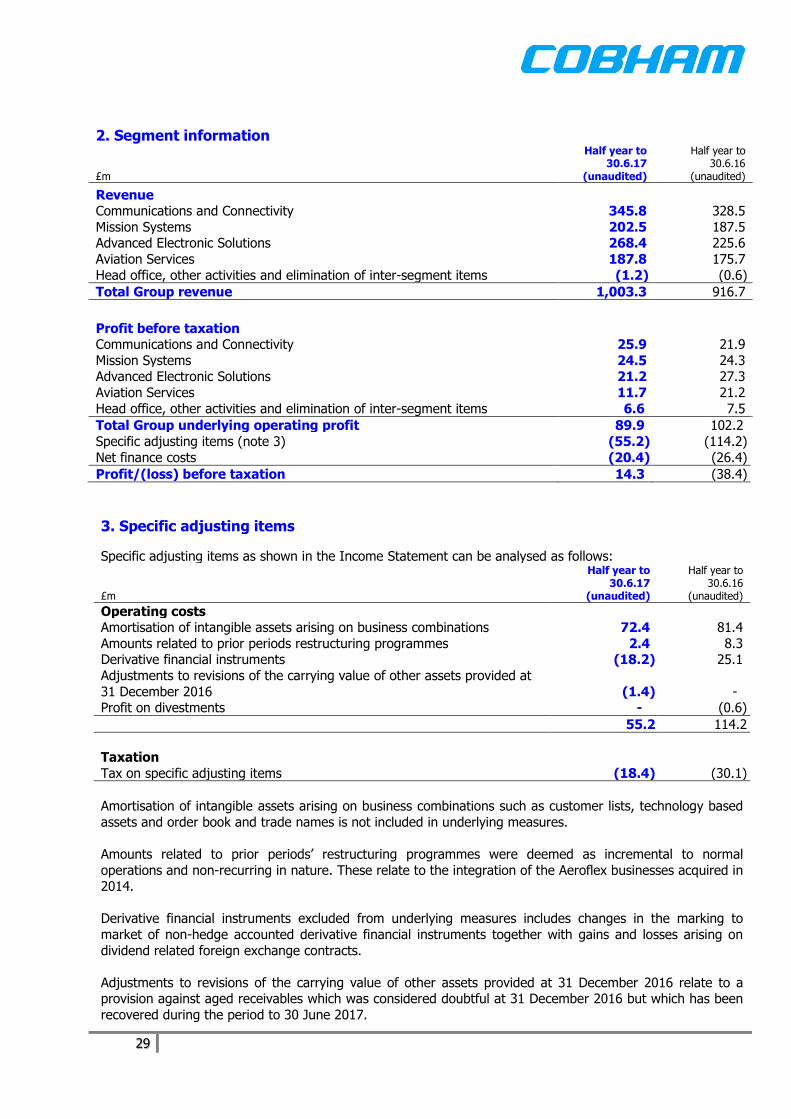
2. Segment information
£m
Half year to 30.6.17
(unaudited)
Half year to 30.6.16
(unaudited)
Revenue Communications and Connectivity 345.8 328.5
Mission Systems 202.5 187.5 Advanced Electronic Solutions 268.4 225.6
Aviation Services 187.8 175.7
Head office, other activities and elimination of inter-segment items (1.2) (0.6)
Total Group revenue 1,003.3 916.7
Profit before taxation Communications and Connectivity 25.9 21.9
Mission Systems 24.5 24.3 Advanced Electronic Solutions 21.2 27.3
Aviation Services 11.7 21.2
Head office, other activities and elimination of inter-segment items 6.6 7.5
Total Group underlying operating profit 89.9 102.2
Specific adjusting items (note 3) (55.2) (114.2)
Net finance costs (20.4) (26.4)
Profit/(loss) before taxation 14.3 (38.4)
3. Specific adjusting items
Specific adjusting items as shown in the Income Statement can be analysed as follows:
£m
Half year to 30.6.17
(unaudited)
Half year to 30.6.16
(unaudited)
Operating costs Amortisation of intangible assets arising on business combinations 72.4 81.4
Amounts related to prior periods restructuring programmes 2.4 8.3 Derivative financial instruments (18.2) 25.1
Adjustments to revisions of the carrying value of other assets provided at
31 December 2016 (1.4) - Profit on divestments - (0.6)
55.2 114.2
Taxation
Tax on specific adjusting items (18.4) (30.1)
Amortisation of intangible assets arising on business combinations such as customer lists, technology based
assets and order book and trade names is not included in underlying measures.
Amounts related to prior periods’ restructuring programmes were deemed as incremental to normal
operations and non-recurring in nature. These relate to the integration of the Aeroflex businesses acquired in 2014.
Derivative financial instruments excluded from underlying measures includes changes in the marking to
market of non-hedge accounted derivative financial instruments together with gains and losses arising on
dividend related foreign exchange contracts.
Adjustments to revisions of the carrying value of other assets provided at 31 December 2016 relate to a provision against aged receivables which was considered doubtful at 31 December 2016 but which has been
recovered during the period to 30 June 2017.

30
4. Finance income and costs
£m
Half year to 30.6.17
(unaudited)
Half year to 30.6.16
(unaudited)
Bank interest 0.7 0.6 Other finance income 1.1 1.1
Total finance income 1.8 1.7
Interest on bank overdrafts and loans (20.8) (26.8)
Interest on net pension scheme liabilities (1.1) (0.9) Other finance expense (0.3) (0.4)
Total finance costs (22.2) (28.1)
Net finance costs (20.4) (26.4)
5. Tax
£m
Half year to 30.6.17
(unaudited)
Half year to 30.6.16
(unaudited)
Tax on underlying profit (effective rate 23.6%; 2016: 22.0%) 16.4 16.7
Tax on specific adjusting items (effective rate 33.3%; 2016: 26.4%) (18.4) (30.1)
Total taxation credit (2.0) (13.4)
The increase in the underlying tax rate reflects the expected geographic mix of profits for the full year. The
Group is reviewing its internal financing structures and is in the process of resolving certain tax issues from prior years. Given this, and the expected geographical mix of profits, the underlying tax rate is anticipated to
increase by 1-4% over the medium term, subject to any future changes in tax legislation.
The Group is subject to corporate and other tax rules in the jurisdictions where it conducts its business
operations. Changes in tax rates, tax reliefs and tax laws, changes in practice or interpretation of the law by the relevant tax authorities, increasing challenges by relevant tax authorities, or any failure to manage tax
risks adequately could result in increased charges, financial loss, penalties and reputational damage, which may materially adversely affect the Group’s financial condition and results of operations. In addition, tax
enforcement has become a higher priority for many tax authorities in jurisdictions in which the Group
operates, which has led to an increase in tax audits, enquiries and challenges, or the testing through litigation of the boundaries of the correct interpretation of legislation. Tax authorities may also actively pursue
additional taxes based on retroactive changes to tax laws and the Group may have disagreements with tax authorities which could result in a material restatement to the tax position. For example, the availability of
certain interest deductions on one of the Group’s internal financing arrangements, principally as a result of
various US acquisitions, has been under challenge for some time. Over the life of this internal financing arrangement, the aggregate tax value of the interest deductions amounted to approximately £130m. If
decided adversely to the Group, this could lead to increased tax liabilities in excess of those provided in the Group’s Balance Sheet, and result in a substantial tax payment becoming due. The Group has taken external
advice and considers that it has strong support for its position. However, the timing and resolution of this
issue is uncertain.

31
6. Dividends
£m
Half year to 30.6.17
(unaudited)
Half year to 30.6.16
(unaudited)
Year to 31.12.16 (audited)
Final dividend of 8.13p per share for 2015 - 91.6 91.6 Interim dividend of 2.03p per share for 2016 - - 34.5
Total dividend authorised and paid during the period - 91.6 126.1
For the year ended 31 December 2016, a final dividend was not paid. As announced on 2 March 2017, the
Board will not recommend either an interim or final dividend in respect of the financial year 2017 and it expects to resume dividend payments when it is prudent to do so.
7. Earnings per ordinary share (EPS)
Half year to 30.6.17
(unaudited)
Half year to 30.6.16
(restated, unaudited)
Basic EPS
Earnings attributable to owners of the parent £m 16.3 (25.1)
Weighted average number of shares million 2,084.2 1,556.7 Basic EPS pence 0.8 (1.6)
Diluted EPS
Earnings attributable to owners of the parent £m 16.3 (25.1)
Weighted average number of shares million 2,084.2 1,556.7 Effect of dilutive securities 2.6 -
Diluted number of shares million 2,086.8 1,556.7
Diluted EPS pence 0.8 (1.6)
When losses are made, potentially dilutive shares have no impact on EPS.
Half year to
30.6.17 (unaudited)
Half year to 30.6.16
(restated, unaudited)
Underlying EPS Underlying profit attributable to owners of the parent £m 53.1 59.0
Weighted average number of shares million 2,084.2 1,556.7
Underlying EPS pence 2.5 3.8
Diluted EPS
Underlying profit attributable to owners of the parent £m 53.1 59.0 Weighted average number of shares million 2,084.2 1,556.7
Effect of dilutive securities 2.6 4.0
Diluted number of shares million 2,086.8 1,560.7
Underlying diluted EPS pence 2.5 3.8
Following a 2 for 5 fully underwritten Rights Issue, 683,145,540 ordinary shares of 2.5 pence each were
issued on 4 May 2017 at an issue price of 75p per share. Net proceeds of £496.7m were realised net of costs of £15.7m; £17.1m was recognised as share capital and £479.6m as share premium.
EPS for the comparative period above has been restated and adjusted by the bonus factor of 1.15 to reflect
the bonus element of the Rights Issue, in accordance with IAS 33, Earnings Per Share.
At 30 June 2017, 90,102,594 (31 December 2016: 88,587,855) ordinary shares were held in Treasury,
including 14,150,870 (31 December 2016: 12,636,131) shares held in the Cobham Employee Benefit Trust.
32
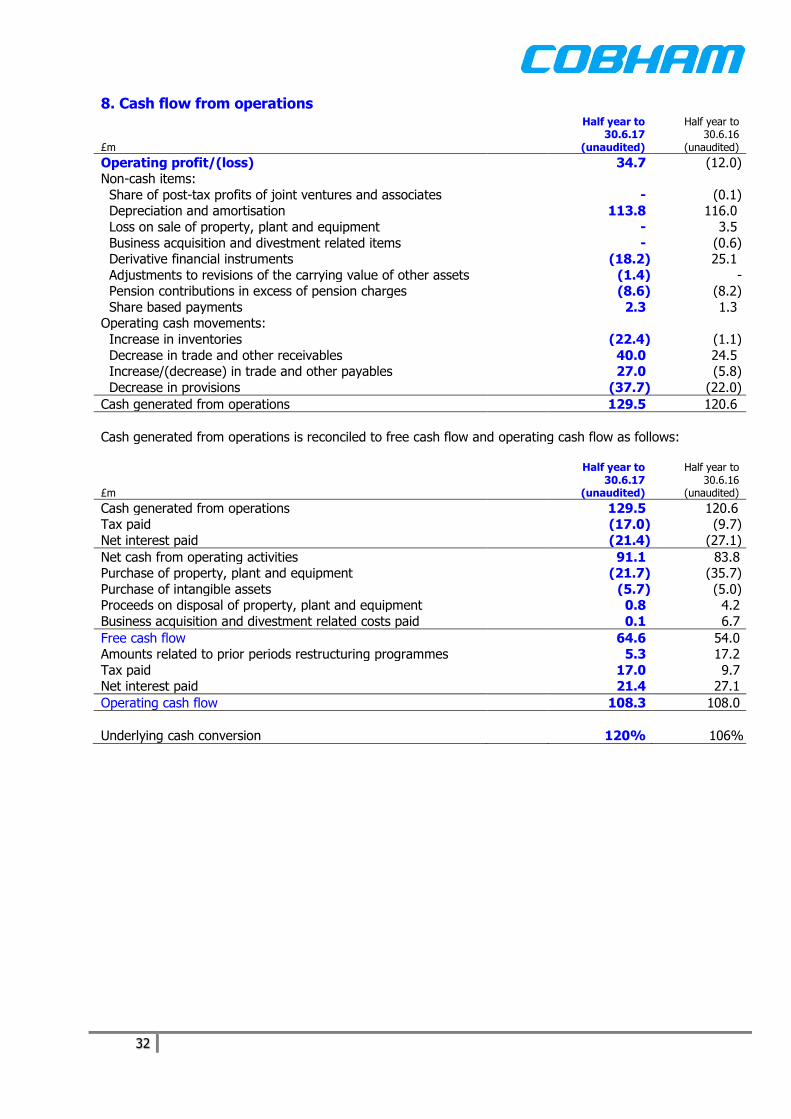
8. Cash flow from operations
£m
Half year to 30.6.17
(unaudited)
Half year to 30.6.16
(unaudited)
Operating profit/(loss) 34.7 (12.0) Non-cash items:
Share of post-tax profits of joint ventures and associates - (0.1) Depreciation and amortisation 113.8 116.0
Loss on sale of property, plant and equipment - 3.5
Business acquisition and divestment related items - (0.6) Derivative financial instruments (18.2) 25.1
Adjustments to revisions of the carrying value of other assets (1.4) - Pension contributions in excess of pension charges (8.6) (8.2)
Share based payments 2.3 1.3 Operating cash movements:
Increase in inventories (22.4) (1.1)
Decrease in trade and other receivables 40.0 24.5 Increase/(decrease) in trade and other payables 27.0 (5.8)
Decrease in provisions (37.7) (22.0)
Cash generated from operations 129.5 120.6
Cash generated from operations is reconciled to free cash flow and operating cash flow as follows:
£m
Half year to 30.6.17
(unaudited)
Half year to 30.6.16
(unaudited)
Cash generated from operations 129.5 120.6 Tax paid (17.0) (9.7)
Net interest paid (21.4) (27.1)
Net cash from operating activities 91.1 83.8 Purchase of property, plant and equipment (21.7) (35.7)
Purchase of intangible assets (5.7) (5.0) Proceeds on disposal of property, plant and equipment 0.8 4.2
Business acquisition and divestment related costs paid 0.1 6.7
Free cash flow 64.6 54.0 Amounts related to prior periods restructuring programmes 5.3 17.2
Tax paid 17.0 9.7 Net interest paid 21.4 27.1
Operating cash flow 108.3 108.0
Underlying cash conversion 120% 106%

33
9. Intangible assets
£m
Half year to 30.6.17
(unaudited)
Half year to 30.6.16
(unaudited)
Year to 31.12.16 (audited)
Carrying amount at start of period 1,165.9 1,729.5 1,729.5
Additions 5.6 4.3 8.2 Additions - internally generated - - 0.3
Business divestments - - (1.0) Disposals - (0.1) (0.2)
Amortisation and impairment of intangible assets arising on
business combinations (72.4)
(81.4) (735.0) Other amortisation (5.3) (3.0) (14.0)
Reclassifications 0.3 (4.3) 2.0 Foreign exchange adjustments (24.4) 124.0 176.1
Carrying amount at end of period 1,069.7 1,769.0 1,165.9
10. Property, plant and equipment
£m
Half year to 30.6.17
(unaudited)
Half year to 30.6.16
(unaudited)
Year to 31.12.16 (audited)
Carrying amount at start of period 422.9 379.9 379.9
Additions 22.3 39.0 81.5 Business divestments - - (0.9)
Disposals (0.8) (7.7) (10.5)
Depreciation (36.0) (31.5) (72.2) Reclassifications (0.3) (0.9) (2.3)
Foreign exchange adjustments (5.1) 27.9 47.4
Carrying amount at end of period 403.0 406.7 422.9
Commitments for the acquisition of property, plant and equipment are as follows:
£m As at 30.6.17
(unaudited) As at 30.6.16
(unaudited) As at 31.12.16
(audited)
Commitments at end of period 12.5 21.6 14.3
11. Provisions
£m
Half year to 30.6.17
(unaudited)
Half year to 30.6.16
(unaudited)
Year to 31.12.16 (audited)
At start of period (237.9) (142.5) (142.5)
Additional provisions in the period (10.6) (7.1) (176.5) Utilisation of provisions 43.2 25.5 56.0
Provisions released 1.5 7.8 43.0 Disposed with undertakings - - 2.2
Reclassifications 3.9 2.0 (2.0) Foreign exchange adjustments 4.4 (10.2) (18.1)
At end of period (195.5) (124.5) (237.9)
Current liabilities (154.5) (73.4) (180.6) Non-current liabilities (41.0) (51.1) (57.3)
(195.5) (124.5) (237.9)
The movements in provisions in the period to 30 June 2017 primarily relate to contract loss provisions.

34
12. Retirement benefit obligations
£m As at 30.6.17
(unaudited) As at 30.6.16
(unaudited) As at 31.12.16
(audited)
Defined benefit scheme assets 797.6 747.8 790.0 Defined benefit obligations (861.8) (821.8) (877.0)
Net liability at end of period (64.2) (74.0) (87.0)
£m
Half year to 30.6.17
(unaudited)
Half year to 30.6.16
(unaudited)
Year to 31.12.16 (audited)
Net liability at start of period (87.0) (56.7) (56.7)
Amount recognised in Income Statement (1.5) (2.6) (3.6) Contributions paid by employer 9.0 9.9 18.5
Actuarial gains/(losses) recognised in OCI 14.5 (23.3) (42.6) Exchange differences 0.8 (1.3) (2.6)
Net liability at end of period (64.2) (74.0) (87.0)
The estimated shortfall between the value of defined benefit pension scheme assets and the present value of future liabilities at 30 June 2017 has decreased by £22.8m since 31 December 2016, excluding the deferred
tax impact. Actuarial gains of £6.1m on plan liabilities arose due to the decrease in the inflation rate
projections partly offset by a decrease in the discount rate. This decrease in discount rate is partly hedged by liability driven investments which increased in value during the period, contributing to actuarial investment
gains of £8.4m.
The fair value of major categories of scheme assets is as follows:
£m As at 30.6.17
(unaudited) As at 30.6.16
(unaudited) As at 31.12.16
(audited)
UK equity instruments 69.2 58.8 66.9
Overseas equities 34.3 28.1 31.2 Emerging markets equities 23.1 18.8 21.2
Liability driven investments 81.3 103.6 79.0 Corporate bonds 86.4 56.9 85.6
Private credit 25.2 - 14.7 Diversified growth funds 148.7 165.2 146.1
Insurance contracts 315.2 312.5 318.4
Other assets including cash 14.2 3.9 26.9
797.6 747.8 790.0
The major assumptions of the Cobham Pension Plan are:
As at 30.6.17
(unaudited) As at 30.6.16
(unaudited) As at 31.12.16
(audited)
Discount rate 2.6% 2.9% 2.65% RPI inflation assumption 3.3% 3.0% 3.45%
CPI inflation assumption 2.3% 2.0% 2.45%
Life expectancy in years: Male member currently aged 65 87.6 87.8 87.6
Female member currently aged 65 89.6 89.8 89.6
Male member aged 65 in 2045 90.2 90.6 90.2 Female member aged 65 in 2045 92.3 92.7 92.3
These assumptions are used by qualified actuaries to calculate the period end net pension liability in
accordance with IAS 19, Employee benefits. Changes in these assumptions have no impact on the cash
payments into the pension schemes. The cash payments are reassessed after every triennial valuation calculated on a funding basis using assumptions agreed by the Scheme trustees. A funding basis valuation
typically produces a larger scheme deficit value than that calculated under IAS 19, primarily because the discount rate is based on a risk free rate compared to a corporate bond rate used for an IAS 19 valuation.
The latest triennial valuation of the Cobham Pension Plan was at 1 April 2015 which requires £17.1m of
contributions for 2017 and 2018, £9.6m in 2019 and £8.1m for each subsequent year to 2022.
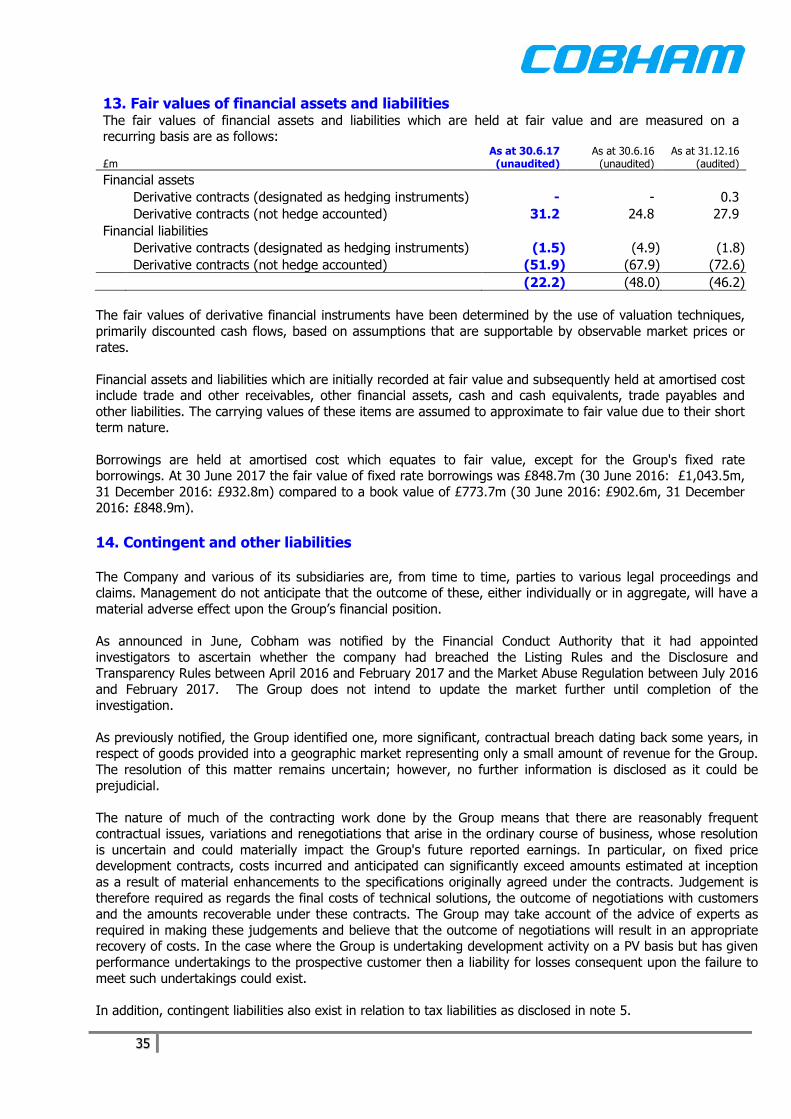
35
13. Fair values of financial assets and liabilities
The fair values of financial assets and liabilities which are held at fair value and are measured on a recurring basis are as follows:
£m As at 30.6.17
(unaudited) As at 30.6.16
(unaudited) As at 31.12.16
(audited)
Financial assets
Derivative contracts (designated as hedging instruments) - - 0.3
Derivative contracts (not hedge accounted) 31.2 24.8 27.9
Financial liabilities
Derivative contracts (designated as hedging instruments) (1.5) (4.9) (1.8)
Derivative contracts (not hedge accounted) (51.9) (67.9) (72.6)
(22.2) (48.0) (46.2)
The fair values of derivative financial instruments have been determined by the use of valuation techniques,
primarily discounted cash flows, based on assumptions that are supportable by observable market prices or
rates.
Financial assets and liabilities which are initially recorded at fair value and subsequently held at amortised cost include trade and other receivables, other financial assets, cash and cash equivalents, trade payables and
other liabilities. The carrying values of these items are assumed to approximate to fair value due to their short term nature.
Borrowings are held at amortised cost which equates to fair value, except for the Group's fixed rate borrowings. At 30 June 2017 the fair value of fixed rate borrowings was £848.7m (30 June 2016: £1,043.5m,
31 December 2016: £932.8m) compared to a book value of £773.7m (30 June 2016: £902.6m, 31 December 2016: £848.9m).
14. Contingent and other liabilities The Company and various of its subsidiaries are, from time to time, parties to various legal proceedings and claims. Management do not anticipate that the outcome of these, either individually or in aggregate, will have a
material adverse effect upon the Group’s financial position.
As announced in June, Cobham was notified by the Financial Conduct Authority that it had appointed
investigators to ascertain whether the company had breached the Listing Rules and the Disclosure and Transparency Rules between April 2016 and February 2017 and the Market Abuse Regulation between July 2016
and February 2017. The Group does not intend to update the market further until completion of the
investigation.
As previously notified, the Group identified one, more significant, contractual breach dating back some years, in respect of goods provided into a geographic market representing only a small amount of revenue for the Group.
The resolution of this matter remains uncertain; however, no further information is disclosed as it could be
prejudicial.
The nature of much of the contracting work done by the Group means that there are reasonably frequent contractual issues, variations and renegotiations that arise in the ordinary course of business, whose resolution
is uncertain and could materially impact the Group's future reported earnings. In particular, on fixed price development contracts, costs incurred and anticipated can significantly exceed amounts estimated at inception
as a result of material enhancements to the specifications originally agreed under the contracts. Judgement is
therefore required as regards the final costs of technical solutions, the outcome of negotiations with customers and the amounts recoverable under these contracts. The Group may take account of the advice of experts as
required in making these judgements and believe that the outcome of negotiations will result in an appropriate recovery of costs. In the case where the Group is undertaking development activity on a PV basis but has given
performance undertakings to the prospective customer then a liability for losses consequent upon the failure to
meet such undertakings could exist.
In addition, contingent liabilities also exist in relation to tax liabilities as disclosed in note 5.

36
15. Related party transactions Transactions between Cobham plc and its subsidiaries, which are related parties of the Company, have been eliminated on consolidation and are not disclosed. There were no material related party transactions during
the periods covered by these Interim Financial Statements.

37
Statement of Key Risks and Uncertainties
The Risk Committee meets regularly to monitor and update the Group's risks and ensure mitigation activities
are in place. As part of the interim process, the Committee concluded that the Group's principal risks identified on pages 36 to 39 of the 2016 Annual Report and Accounts remain valid and relate to:
1. Volatile macroeconomic environment; 2. Market characteristics and contracting environment;
3. Group strategy not being executed; 4. Project and programme management not being effective;
5. Borrowing agreements containing covenants that may not be complied with, and may not generate
sufficient liquidity; 6. Shortage of appropriate skills and talent;
7. Continuous improvement and transformation programmes not being successfully executed; 8. Value creating M&A and divestment activity not being executed;
9. Occurrence of an event leading to a significant business interruption; 10. The integration benefits arising from the Aeroflex acquisition not being realised;
11. Failure to comply with laws and regulations;
12. Governance framework being poorly constructed and implemented; 13. Information assurance security measures being insufficient to prevent data loss;
14. Taxation liabilities being larger than anticipated; 15. The deficit within the Cobham Pension Plan changing.
Risk 5 above, that borrowing agreements containing covenants that may not be complied with, and may not generate sufficient liquidity, is considered to have reduced during the period, reflecting successful completion
of the Rights Issue on 4 May 2017.
The Group's risk management process is detailed on pages 34 and 35 of the 2016 Annual Report and
Accounts.

38
Statement of Directors' Responsibilities The Directors confirm that to the best of their knowledge, these condensed Interim Financial Statements have
been prepared in accordance with IAS 34, Interim Financial Reporting, as adopted by the European Union and that the interim management report includes a fair review of the information required by DTR 4.2.7R and DTR
4.2.8R, namely:
an indication of important events that have occurred during the first six months of the financial year
and their impact on the condensed set of financial statements, and a description of the principal risks and uncertainties for the remaining six months of the financial year; and
material related party transactions in the first six months of the financial year and any material
changes in the related party transactions described in the last Annual Report.
The Directors of Cobham plc are as shown on pages 44 to 47 of the 2016 Annual Report and Accounts. On 31
July 2017, the following changes were announced, both effective 3 August 2017: John McAdam is appointed as a Non-executive Director and the Senior Independent Director; and
Jonathan Flint stands down as a member of the Cobham Board and the Senior Independent Director.
A list of current Directors is maintained on the Cobham Group website: www.cobham.com.
On behalf of the Board
David Lockwood Chief Executive Officer
David Mellors Chief Financial Officer
3 August 2017

39
Independent review report to Cobham plc
Report on the Interim Results Our conclusion We have reviewed Cobham plc's interim financial information (the "Interim Financial Statements") in the Interim Results for the half year ended 30 June 2017. Based on our review, nothing has come to our attention
that causes us to believe that the Interim Financial Statements are not prepared, in all material respects, in
accordance with IAS 34, Interim Financial Reporting, as adopted by the European Union and the Disclosure Guidance and Transparency Rules sourcebook of the United Kingdom’s Financial Conduct Authority.
What we have reviewed The Interim Financial Statements comprise:
• the Consolidated Income Statement and Consolidated Statement of Comprehensive Income for the half
year ended 30 June 2017; • the Consolidated Balance Sheet as at 30 June 2017;
• the Consolidated Statement of Changes in Equity for the period then ended;
• the Consolidated Cash Flow Statement for the period then ended; and • the Notes to the Interim Financial Statements.
The Interim Financial Statements included in the Interim Results for the half year ended 30 June 2017 have
been prepared in accordance with IAS 34, Interim Financial Reporting, as adopted by the European Union and
the Disclosure Guidance and Transparency Rules sourcebook of the United Kingdom’s Financial Conduct Authority.
As disclosed in note 1 to the Interim Financial Statements, the financial reporting framework that has been
applied in the preparation of the full annual financial statements of the Group is applicable law and International Financial Reporting Standards (IFRSs) as adopted by the European Union.
Responsibilities for the Interim Financial Statements and the review Our responsibilities and those of the Directors The Interim Results for the half year, including the Interim Financial Statements, are the responsibility of, and
has been approved by, the Directors. The Directors are responsible for preparing the Interim Results for the half year in accordance with the Disclosure Guidance and Transparency Rules sourcebook of the United
Kingdom’s Financial Conduct Authority.
Our responsibility is to express a conclusion on the Interim Financial Statements in the Interim Results for the
half year based on our review. This report, including the conclusion, has been prepared for and only for the Company for the purpose of complying with the Disclosure Guidance and Transparency Rules sourcebook of
the United Kingdom’s Financial Conduct Authority and for no other purpose. We do not, in giving this
conclusion, accept or assume responsibility for any other purpose or to any other person to whom this report is shown or into whose hands it may come save where expressly agreed by our prior consent in writing.
What a review of interim financial information involves We conducted our review in accordance with International Standard on Review Engagements (UK and Ireland) 2410, Review of Interim Financial Information Performed by the Independent Auditor of the Entity,
issued by the Auditing Practices Board for use in the United Kingdom. A review of interim financial information consists of making enquiries, primarily of persons responsible for financial and accounting matters, and
applying analytical and other review procedures.

40
A review is substantially less in scope than an audit conducted in accordance with International Standards on
Auditing (UK) and, consequently, does not enable us to obtain assurance that we would become aware of all significant matters that might be identified in an audit. Accordingly, we do not express an audit opinion.
We have read the other information contained in the Interim Results and considered whether it contains any
apparent misstatements or material inconsistencies with the information in the Interim Financial Statements. PricewaterhouseCoopers LLP Chartered Accountants
London
3 August 2017 Notes: (a) The maintenance and integrity of the Cobham plc website is the responsibility of the Directors; the work carried out by the auditors does not involve consideration of these matters and, accordingly, the auditors accept no responsibility for any changes that may have occurred to the financial statements since they were initially presented on the website. (b) Legislation in the United Kingdom governing the preparation and dissemination of financial statements may differ from legislation in other jurisdictions.
-ends-