interim results 2017/18 - renewi plc/media/files/r/renewi/documents... · · 2017-11-092017/18...
TRANSCRIPT
Interim Results2017/18
9 November 2017
Disclaimer
This presentation contains certain forward-looking statements with respect to the operations, performance
and financial condition of Renewi. These forward-looking statements are subject to risks, uncertainties
and other factors which as a result could cause Renewi’s actual future financial condition, performance
and results to differ materially from the plans, goals and expectations set out in the forward-looking
statements. Such statements are made only as at the date of this presentation and, except to the extent
legally required, Renewi undertakes no obligation to revise or update such forward-looking statements.
2

Highlights
Very strong first half performance leading to recent FY18 upgrade
Good operational delivery underpinned by positive market backdrop
Post merger integration on track for both cost and revenue synergies
Clear strategy for sustained long-term profitable growth
3
1
2
3
4

2017/18 Interim Results
Revenue &
Profits*• Revenue up 4% to £783m
• Underlying EBIT up 21% to £43.6m
Divisional
Performance*
• Commercial: underlying EBIT up 38% overall and up 73% in the Netherlands
• Hazardous Waste: underlying EBIT up 5%
• Monostreams: underlying EBIT up 29%
• Municipal: UK recovery plans underway; short-term challenges in Canada
Cash Flow &
Financing• Core net debt at £436m, including adverse currency movement
• Core net debt to EBITDA ratio of 2.8x, better than management expectations
EPS &
Dividend• Underlying EPS up 6%
• Interim dividend maintained at 0.95p per share
* All variances are at constant currency and on a pro forma basis (where applicable) 4
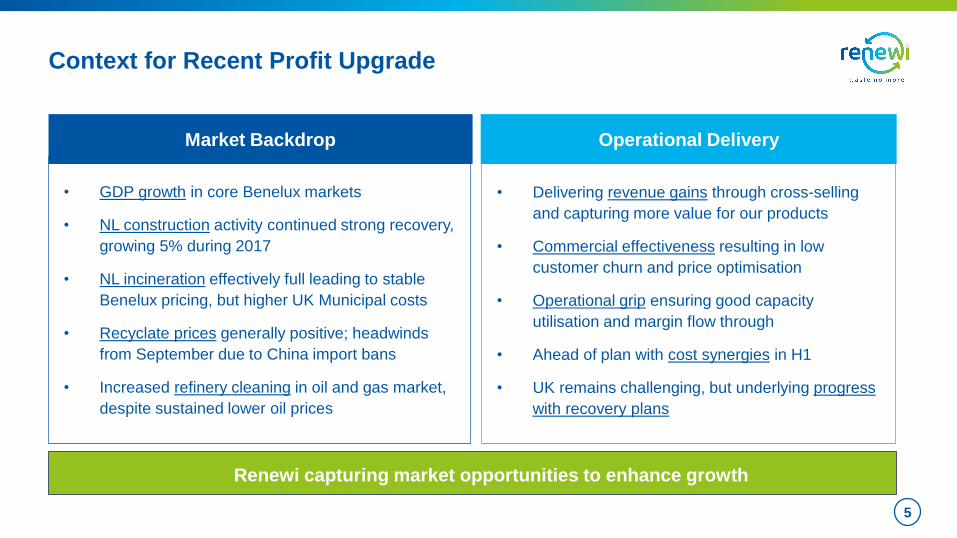
Context for Recent Profit Upgrade
5
Renewi capturing market opportunities to enhance growth
• Delivering revenue gains through cross-selling
and capturing more value for our products
• Commercial effectiveness resulting in low
customer churn and price optimisation
• Operational grip ensuring good capacity
utilisation and margin flow through
• Ahead of plan with cost synergies in H1
• UK remains challenging, but underlying progress
with recovery plans
Operational Delivery
• GDP growth in core Benelux markets
• NL construction activity continued strong recovery,
growing 5% during 2017
• NL incineration effectively full leading to stable
Benelux pricing, but higher UK Municipal costs
• Recyclate prices generally positive; headwinds
from September due to China import bans
• Increased refinery cleaning in oil and gas market,
despite sustained lower oil prices
Market Backdrop

Results & Guidance

Excluding
Sep 17 Sep 16 Change Change currency
£m £m £m % change %
Revenue (pro forma) 782.9 708.5 74.4 11% 4%
Underlying EBIT (pro forma) 43.6 32.9 10.7 33% 21%
Underlying EBIT (as reported) 43.6 20.7 22.9 111% 92%
Net Interest (10.4) (6.2)
Income from associates and JVs 1.0 0.9
Underlying profit before tax 34.2 15.4 18.8 123% 102%
Non-trading and exceptional items (12.0) (16.3) 4.3
Profit (loss) before tax 22.2 (0.9) 23.1
Taxation (6.9) (2.5)
Profit (loss) after tax 15.3 (3.4) 18.7
Discontinued operations (0.1) -
Profit (loss) after tax 15.2 (3.4) 18.6
Continuing operations:
Basic earnings per share (p) 2.0 (0.7) 2.7
Underlying earnings per share (p) 3.2 2.7 0.5 19% 6%
Interim dividend (pence per share) 0.95p 0.95p
Income Statement
7
Pro forma results in the period to September 2016 include Van Gansewinkel as if owned throughout the period rather than from legal completion on 28 February 2017

Commercial Waste
Netherlands
• Market conditions continue to improve
• 9% construction volume growth vs 5% market
• 7% mixed commercial volume growth vs 3% GDP
• Positive recyclate markets in the period; impact of
Chinese market will moderate the second half
8
Belgium
• More than offset prior period €5m non-recurring profits
in the wood segment of former VGG business
• Modest volume and pricing growth on inbound waste
• Lack of capacity in incinerators and cement kilns
disrupted sales of SRF/burnable waste
Sep 17 Sep 16 Change
€m €m €m %
Revenue
Netherlands Commercial Waste 363.9 340.9 23.0 7%
Belgium Commercial Waste 211.3 207.6 3.7 2%
Intra-segment revenue (0.6) (1.1) 0.5
Total Revenue (pro forma) 574.6 547.4 27.2 5%
Total Revenue £m (pro forma at average rate) 505.5 446.5 59.0 13%
Revenue as reported (£m) 505.5 158.9 346.6
Underlying EBIT
Netherlands Commercial Waste 25.1 14.5 10.6 73%
Belgium Commercial Waste 16.0 15.2 0.8 5%
Total Underlying EBIT (pro forma) 41.1 29.7 11.4 38%
Total Underlying EBIT £m (pro forma at average rate) 36.2 24.4 11.8 48%
Underlying EBIT as reported (£m) 36.2 9.5 26.7
Underlying EBIT Margin
NL Commercial Waste 6.9% 4.3%
BE Commercial Waste 7.6% 7.3%
Total Underlying EBIT Margin (pro forma) 7.2% 5.4%
Return on operating assets
NL Commercial Waste 14.6% 8.8%
BE Commercial Waste 25.2% 24.5%
Total Return on operating assets (pro forma) 17.5% 12.9%
Pro forma results in the period to September 2016 include Van Gansewinkel as if owned throughout the period
rather than from legal completion on 28 February 2017
The return on operating assets for Netherlands includes properties rented from the legacy VGG property company
The return on operating assets for Belgium excludes all landfill related provisions

Hazardous Waste
9
Reym & VGIS: Industrial Cleaning
• Core oil and gas markets mixed – onshore gas
production falling due to regulatory restrictions,
increase in oil segment cleaning activity
• Continued good performance from Theemsweg facility
and new ultrasonic cleaning system
• VGIS integration going well
ATM & CFS: Soil, Water & Chemical Waste Treatment
• Soil intake strong in the period
• Water intake and treatment stable – very strong ship
volumes offset weaker truck and sludge volumes
• Increased performance at the pyro – overcoming
operational restrictions as the new storage facility is
built
• Voluntary reduction in soil treatment volumes as IL&T
review negatively affected the off-set of treated soil
Sep 17 Sep 16 Change
€m €m €m %
Revenue (pro forma) 117.3 115.6 1.7 1%
Revenue £m (pro forma at average rate) 103.0 94.2 8.8 9%
Revenue as reported (£m) 103.0 80.5 22.5
Underlying EBIT (pro forma) 15.7 15.0 0.7 5%
Underlying EBIT £m (pro forma at average rate) 13.7 12.3 1.4 11%
Underlying EBIT as reported (£m) 13.7 11.4 2.3
Underlying EBIT Margin (pro forma) 13.4% 13.0%
Return on operating assets (pro forma) 28.1% 27.1%
Pro forma results in the period to September 2016 include Van Gansewinkel as if owned throughout the period
rather than from legal completion on 28 February 2017
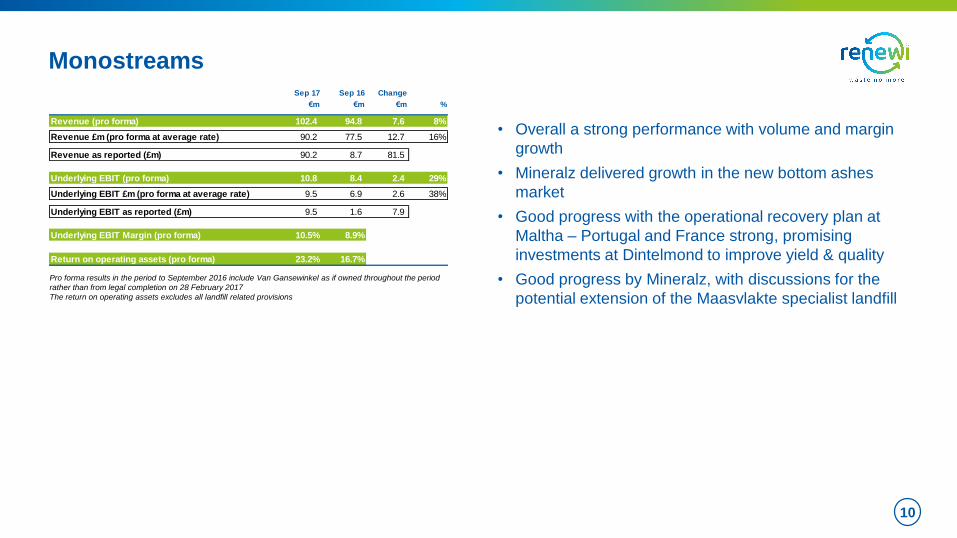
Sep 17 Sep 16 Change
€m €m €m %
Revenue (pro forma) 102.4 94.8 7.6 8%
Revenue £m (pro forma at average rate) 90.2 77.5 12.7 16%
Revenue as reported (£m) 90.2 8.7 81.5
Underlying EBIT (pro forma) 10.8 8.4 2.4 29%
Underlying EBIT £m (pro forma at average rate) 9.5 6.9 2.6 38%
Underlying EBIT as reported (£m) 9.5 1.6 7.9
Underlying EBIT Margin (pro forma) 10.5% 8.9%
Return on operating assets (pro forma) 23.2% 16.7%
Monostreams
10
• Overall a strong performance with volume and margin
growth
• Mineralz delivered growth in the new bottom ashes
market
• Good progress with the operational recovery plan at
Maltha – Portugal and France strong, promising
investments at Dintelmond to improve yield & quality
• Good progress by Mineralz, with discussions for the
potential extension of the Maasvlakte specialist landfill
Pro forma results in the period to September 2016 include Van Gansewinkel as if owned throughout the period
rather than from legal completion on 28 February 2017
The return on operating assets excludes all landfill related provisions
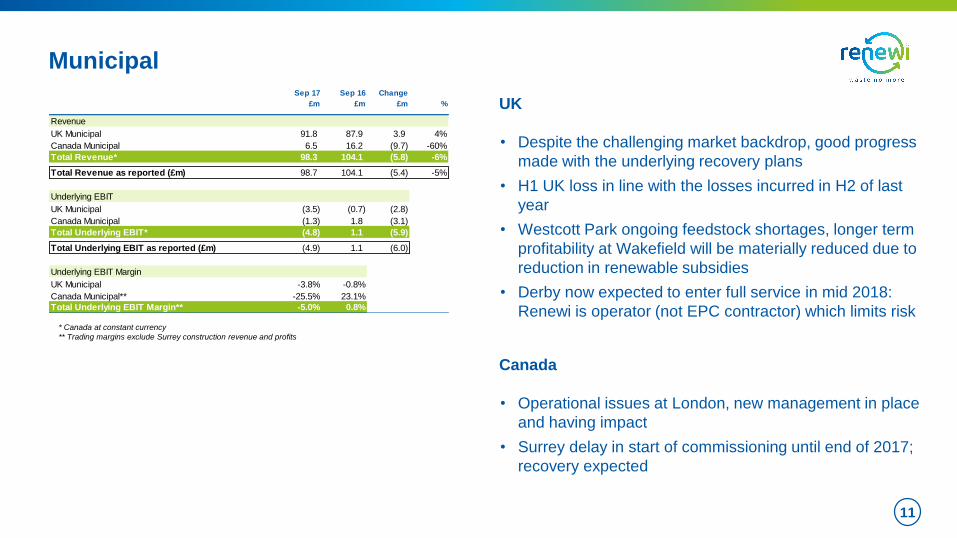
Sep 17 Sep 16 Change
£m £m £m %
Revenue
UK Municipal 91.8 87.9 3.9 4%
Canada Municipal 6.5 16.2 (9.7) -60%
Total Revenue* 98.3 104.1 (5.8) -6%
Total Revenue as reported (£m) 98.7 104.1 (5.4) -5%
Underlying EBIT
UK Municipal (3.5) (0.7) (2.8)
Canada Municipal (1.3) 1.8 (3.1)
Total Underlying EBIT* (4.8) 1.1 (5.9)
Total Underlying EBIT as reported (£m) (4.9) 1.1 (6.0)
Underlying EBIT Margin
UK Municipal -3.8% -0.8%
Canada Municipal** -25.5% 23.1%
Total Underlying EBIT Margin** -5.0% 0.8%
Municipal
11
* Canada at constant currency
** Trading margins exclude Surrey construction revenue and profits
UK
• Despite the challenging market backdrop, good progress
made with the underlying recovery plans
• H1 UK loss in line with the losses incurred in H2 of last
year
• Westcott Park ongoing feedstock shortages, longer term
profitability at Wakefield will be materially reduced due to
reduction in renewable subsidies
• Derby now expected to enter full service in mid 2018:
Renewi is operator (not EPC contractor) which limits risk
Canada
• Operational issues at London, new management in place
and having impact
• Surrey delay in start of commissioning until end of 2017;
recovery expected
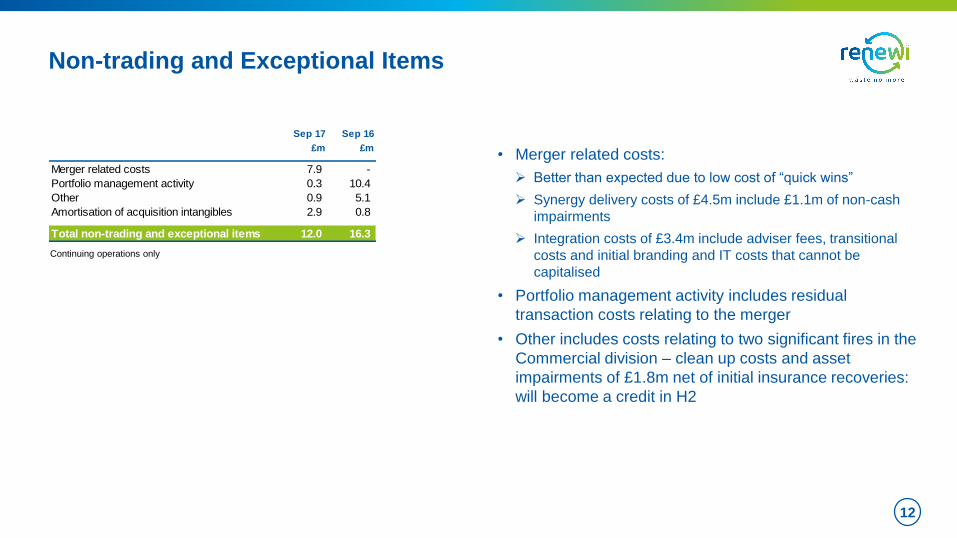
Non-trading and Exceptional Items
• Merger related costs:
Better than expected due to low cost of “quick wins”
Synergy delivery costs of £4.5m include £1.1m of non-cash
impairments
Integration costs of £3.4m include adviser fees, transitional
costs and initial branding and IT costs that cannot be
capitalised
• Portfolio management activity includes residual
transaction costs relating to the merger
• Other includes costs relating to two significant fires in the
Commercial division – clean up costs and asset
impairments of £1.8m net of initial insurance recoveries:
will become a credit in H2
12
Continuing operations only
Sep 17 Sep 16
£m £m
Merger related costs 7.9 -
Portfolio management activity 0.3 10.4
Other 0.9 5.1
Amortisation of acquisition intangibles 2.9 0.8
Total non-trading and exceptional items 12.0 16.3
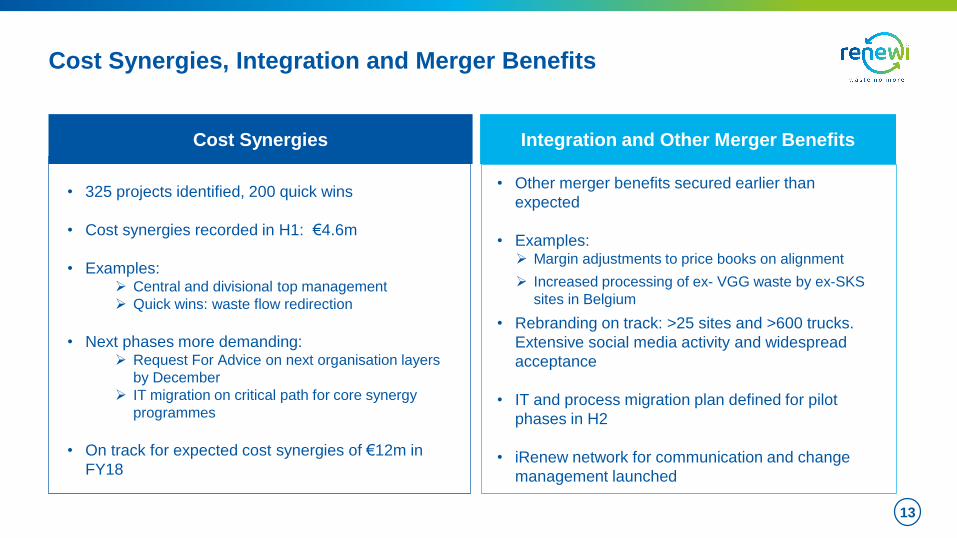
Cost Synergies, Integration and Merger Benefits
13
Cost Synergies
• 325 projects identified, 200 quick wins
• Cost synergies recorded in H1: €4.6m
• Examples: Central and divisional top management
Quick wins: waste flow redirection
• Next phases more demanding: Request For Advice on next organisation layers
by December
IT migration on critical path for core synergy
programmes
• On track for expected cost synergies of €12m in
FY18
• Other merger benefits secured earlier than
expected
• Examples: Margin adjustments to price books on alignment
Increased processing of ex- VGG waste by ex-SKS
sites in Belgium
• Rebranding on track: >25 sites and >600 trucks.
Extensive social media activity and widespread
acceptance
• IT and process migration plan defined for pilot
phases in H2
• iRenew network for communication and change
management launched
Integration and Other Merger Benefits

Sep 17 Sep 16
£m £m
EBITDA 87.1 40.2
Working capital movement and other 14.1 (17.5)
Net replacement capital expenditure (35.5) (14.7)
Interest and tax (13.0) (9.4)
Underlying free cash flow 52.7 (1.4)
Growth capital expenditure (1.2) (2.9)
UK PFI funding (1.8) (4.2)
Canada Municipal funding (5.9) (9.9)
Acquisitions and disposals - 4.0
Dividends paid (16.8) (9.4)
Restructuring spend (0.8) (0.9)
Synergy & integration spend (7.3) -
Transaction related spend (9.1) (1.2)
Other (11.1) (5.4)
Net core cash flow (1.3) (31.3)
Free cash flow conversion 121% -7%
Cash Flow Performance
Underlying cash flow very strong – driven by strong
trading and good working capital performance
• Prior period comparative is as reported last year and on a
pre-merger basis
• Capital expenditure tightly controlled across all Divisions
(at 81% of depreciation); increase in planned expenditure
in H2 with full year estimate at £100m including
rebranding spend
• Increased cash interest spend due to increased
borrowings related to the merger and loan fees paid on
exercise of one year extension option
• Deal related cash spend includes the settlement of fees
not paid before March 2017
• Other includes cash outflows on Municipal onerous
contracts of £6.0m and pension cash funding of £1.5m
14
All numbers above include both continuing and discontinued operations
September 2016 is as per the prior year interims release and does not include VGG as the
merger only completed in the second half
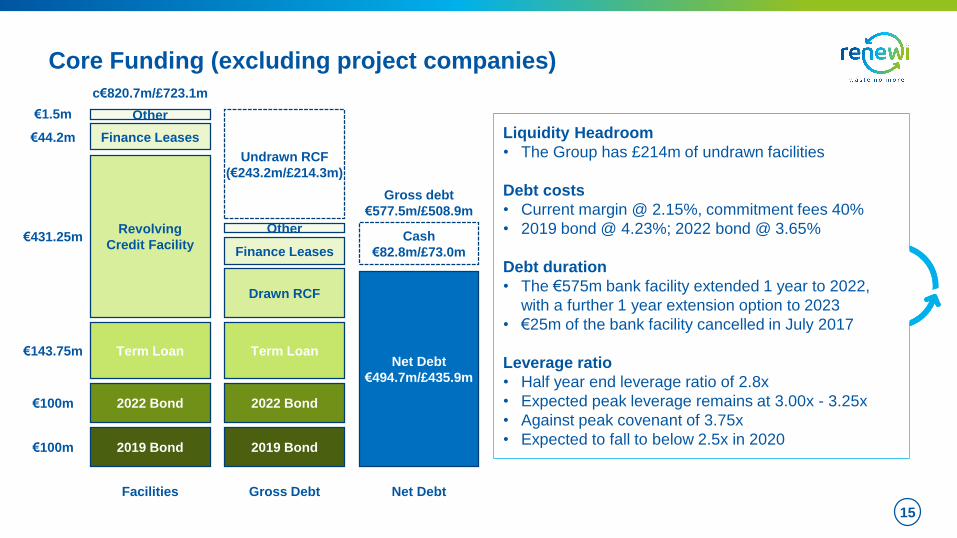
Core Funding (excluding project companies)
Liquidity Headroom
• The Group has £214m of undrawn facilities
Debt costs
• Current margin @ 2.15%, commitment fees 40%
• 2019 bond @ 4.23%; 2022 bond @ 3.65%
Debt duration
• The €575m bank facility extended 1 year to 2022,
with a further 1 year extension option to 2023
• €25m of the bank facility cancelled in July 2017
Leverage ratio
• Half year end leverage ratio of 2.8x
• Expected peak leverage remains at 3.00x - 3.25x
• Against peak covenant of 3.75x
• Expected to fall to below 2.5x in 2020
15
2019 Bond
2022 Bond
Term Loan
Revolving
Credit Facility
Finance Leases
€100m
€100m
€143.75m
€431.25m
€44.2m
Facilities
2019 Bond
2022 Bond
Term Loan
Drawn RCF
Finance Leases
Gross Debt
Cash
€82.8m/£73.0m
Net Debt
€494.7m/£435.9m
Net Debt
Undrawn RCF
(€243.2m/£214.3m)
Gross debt
€577.5m/£508.9m
c€820.7m/£723.1m
Other
Other
€1.5m

FY2017/18 Divisional and Trading Outlooks
16
Commercial: continue to perform well, with H2 growth moderated by end of strong C&D
season and lower recyclate prices due to Chinese policy shift
Hazardous Waste: in line with expectations, ATM soil outlet impact at present expected to be
up to €5m in H2
Monostreams: in line with expectations: seasonally slower in second half
Municipal: UK underlying recovery in line with expectations. Canada seasonally weaker in
H2 but core challenges in London and Surrey expected to resolve
€12m cost synergy delivery as expected
1
2
3
4
5
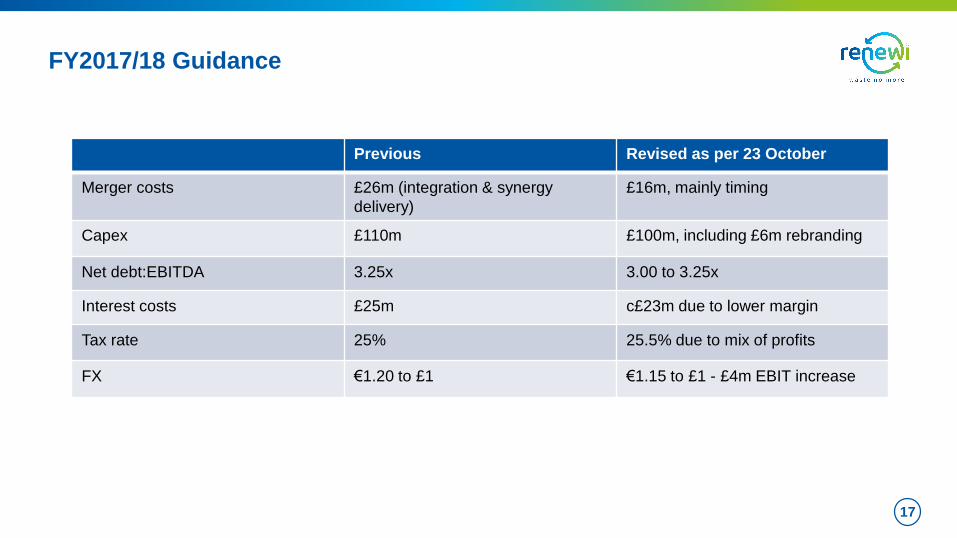
FY2017/18 Guidance
17
Previous Revised as per 23 October
Merger costs £26m (integration & synergy
delivery)
£16m, mainly timing
Capex £110m £100m, including £6m rebranding
Net debt:EBITDA 3.25x 3.00 to 3.25x
Interest costs £25m c£23m due to lower margin
Tax rate 25% 25.5% due to mix of profits
FX €1.20 to £1 €1.15 to £1 - £4m EBIT increase

Summary of H1 Trading
• First half trading significantly ahead of expectations
• Benelux Divisions particularly strong operational performance, supported by improving
markets
• UK Municipal trading in line with H2 FY17, ongoing Canadian operational challenges
• Non-trading and exceptional items significantly better than expected
• Net debt and leverage significantly better than expected with tight control of working
capital, capital expenditure and merger costs
• Profit upgrade for FY18 expectations on 23 October despite output reduction at ATM
18
Value Creation

Increasing Demand for Renewi’s Services
20Underpinned by GDP recovery and capacity balance improvements in our sector
Clear
environmental
need
Greater
customer
pull
Increasing
regulatory
push
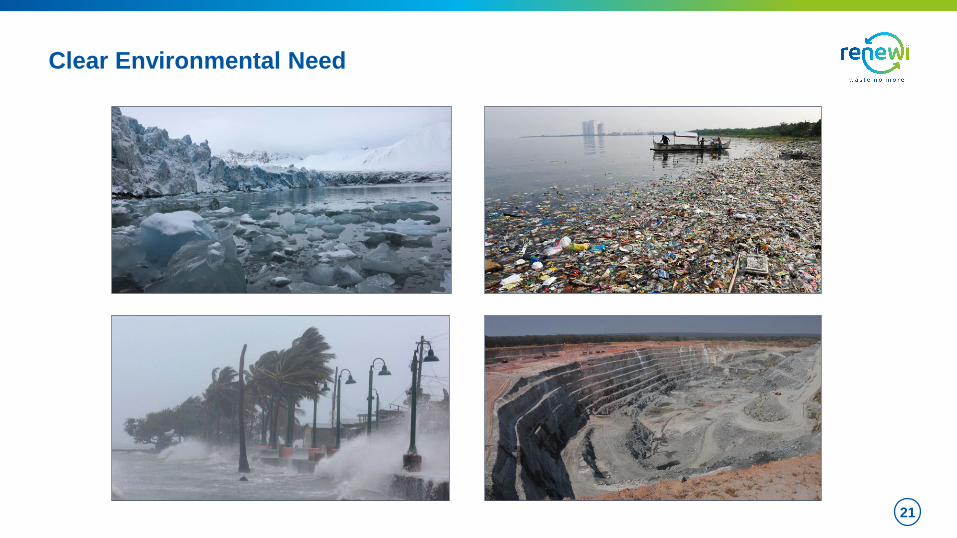
Clear Environmental Need
21

Increasing Regulatory Push
Governments are acting to drive change
and action...
• <10% landfill in 2030
• 75% of packaging waste recycled by 2030
• Domestic incineration and landfill target 50%
reduction by 2020 versus 2015
• MSW sorting up to 75% in 2020 versus 58% in
2015
• Plan to extend MSW recycling rate (currently
best in EU @ 62%)
• No landfill of burnable non-recyclable C&I waste
• Flanders: 70% separate collection MSW by 2022
• Initially maintaining EU targets post Brexit
• Scotland: Zero Waste Directive
22
…the emerging Circular Economy
gaining traction
Recycling is the most tangible lever with the greatest impact today
EU
NL
BE
UK
Source: Logo graphic from Circle Economy and Acceleratio

Greater Customer Pull
23
Improving recycling rates and using secondary raw materials are smart
and concrete sustainability targets for large corporates
We help customers become more sustainable, while generating returns for our shareholders
• 100% recyclable plastic packaging by 2025
• 90% of office waste reused, recycled or
recovered by 2015
• 40 % of PET used to be recycled PET or
PET from renewable resources
• Virtual carbon price of €50 per ton CO2
used for decision-making processes
• Separation of building site residual waste
at 70% in 2017 and beyond
• Green Deal Circular Procurement: Ministries
& 40 Dutch companies to procure >€100 M in
circular economy
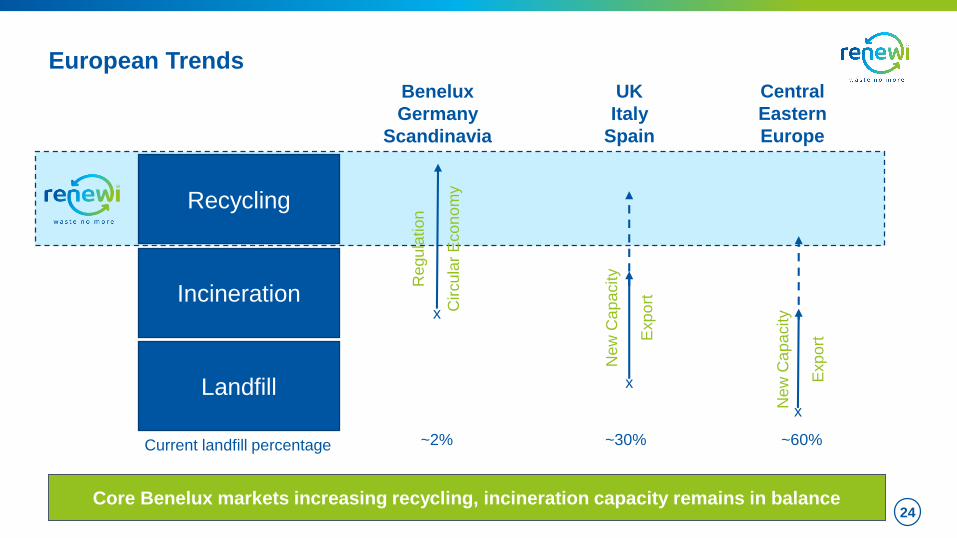
European Trends
24Core Benelux markets increasing recycling, incineration capacity remains in balance
Recycling
Incineration
Landfill
Benelux
Germany
Scandinavia
UK
Italy
Spain
Central
Eastern
Europe
~2% ~30% ~60%
Regu
lation
Circula
r E
co
no
my
x
New
Ca
pa
city
Exp
ort
x
x
Current landfill percentage
New
Ca
pa
city
Exp
ort

Conclusion: Short-Term Recovery and Long-Term Growth
25
Clear
environmental
need
Greater
customer
pull
Increasing
regulatory
push
Strong thematic and macro growth drivers:
Renewi uniquely positioned to meet increased demand and deliver profitable growth
• NL recycling market set for continued
recovery after sustained margin pressure
• Clear macro drivers demanding greater
recycling versus landfill and incineration
• Incineration will become less of a substitute
destination for recycling
• Incineration capacity should also remain
balanced across advanced EU markets
• Some UK uncertainty regarding Brexit, but
exports likely to remain
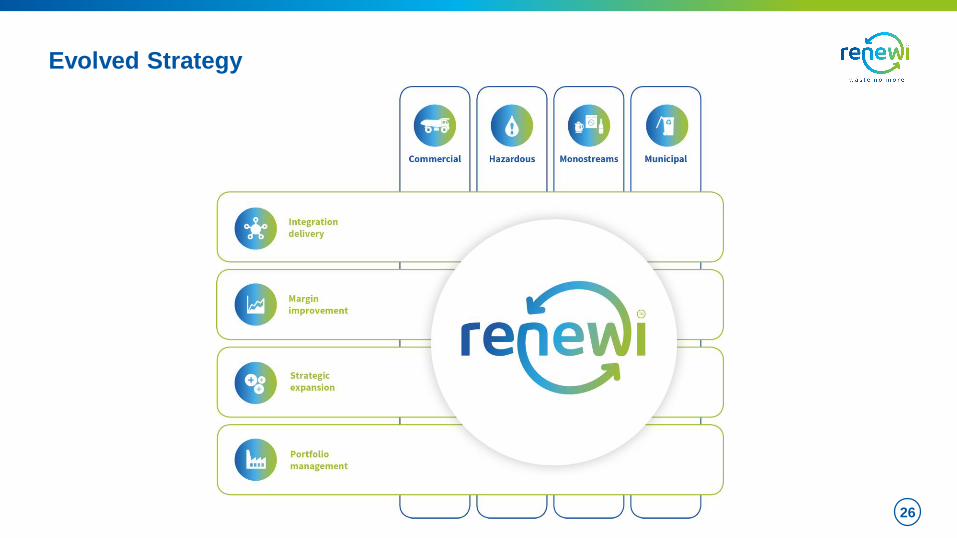
Evolved Strategy
26

Divisional Growth Strategies
27
Commercial
Hazardous
Municipal
Deliver improved profitability and returns through merger
benefits, self-help initiatives and market recovery
Continue to grow in established and adjacent markets while
maintaining attractive returns
Restore profitability through operational gains, off-take
management and ramping-up new assets
Monostreams Deliver profitable growth through operational excellence and
extending current ‘product focused’ business models

Growth Journey
28
Wave 1
Deliver integration
Wave 2
Improve margins
Wave 3
Strategic expansion
Value
Time
Portfolio management
2020
Milestone

Wave 1: Deliver Integration
29
Synergy Delivery
1. Site rationalisation
2. Route optimisation
3. Overhead reduction
4. Off-take management
5. Procurement
¹ Includes SSC
² Includes overhead and facilities rationalisation
Execution driven within integrating divisions with tight central co-ordination
Proven capability and track record in relevant markets

Wave 2: Improve Margins
30
Favourable market conditions
Advantaged cost position
Proven margin expansion tools• Commercial effectiveness methodology
• Continuous improvement (lean and six sigma)
• Value selling for Renewi end-products
• Long-term off-take contracts
• Processing scale and capacity utilisation
• Route density reducing transport unit costs
• Increasing demand and volumes
• Gross margin expansion trends
• SKS segmentation with granular VGG data
Building on legacy capabilities to create Renewi muscle

Wave 3: Strategic Expansion
31
Broaden
products &
services
Product Innovation
Digitalisation
New service models
The
leading
waste-to-
product
company
1 Expand
geographical
footprint
Extended capacity
Leverage technology
Economies of scale
2 Value chain
integration and
extension
Further secondary
material processing
Circular business
models
Core filters and principles for strategic expansion:
• Strategic fit
• Sustainable competitive advantage
• Target returns
3
Developing process to identify, filter and incubate innovative ideas
Innovation

Long-term Value Creation
32
FY20
Milestone
Significant
EPS accretion
Further EPS
expansion
Renewi has a strong position in growing markets and a clear plan to deliver
highly accretive merger and long-term shareholder value
• Revenue growth with
attractive returns
• Increased margins in all
divisions
• €40m annual cost synergies,
plus revenue synergies
• Positive cash generation to
invest in growth
Key Deliverables
Wave 1
Deliver integration
Wave 2
Improve margins
Wave 3
Strategic expansion
Value
Time
Highlights
Very strong first half performance leading to recent FY18 upgrade
Good operational delivery underpinned by positive market backdrop
Post merger integration on track with cost and revenue synergies
Clear strategy for sustained long-term profitable growth
33
1
2
3
4

Appendices

Background Information

Renewi Overview
37
• £1.5B pro forma revenue
• £150m pro forma EBITDA
• c. 8,000 people
• Four divisions:
Commercial
Hazardous
Monostreams
Municipal
Our vision: “To be the leading waste-to-product company”

Our Divisions
38
All divisions have “Waste-to-product” business model
• #1 in waste
collection and
processing
• #1 in most main
market segments
• Complete
geographical
coverage
Netherlands
• c. 3,500 FTEs
Commercial NL
• #1 in glass
recycling and
trading of recycled
glass “cullet”
• #1 handler of
mineral waste in
NL
• #2 in NL organics
• Leading EU WEEE
recycling player
• c. 470 FTEs
Monostreams
• UK leader in MBT
treatment of waste
• Canadian leader in
treatment of
organic waste
• c. 700 FTEs
Municipal
• #1 or 2 in waste
collection and
processing
• #1 in most main
market segments
• Complete
geographical
coverage in
Belgium
• c. 1,900 FTEs
Commercial BE
• #1 in European
thermal soil
treatment, Dutch
waste water
treatment and high
end industrial
cleaning
• Primarily in the
Netherlands
• c. 950 FTEs
Hazardous

Extensive Renewi Product Range
39

Well Positioned to Meet Growing Recycling Needs
• Strong footprint sorting and
recycling in core markets
• Integration fills white space:
geographical and services
• No incineration plants in
portfolio: focus on recycling
• Potential for further EU-wide
expansion in recycling
• Collection possibilities for
new service models
40

• The Circular Coalition founded in 2016 with >35 of
Renewi’s larger customers learning about the
transition to a Circular Economy
• In 2017 Renewi launched a consultancy concept
helping its customers with specific expertise to
improve their materials and waste management
• We improve the quality of the products we make from
waste and have become a partner for OEMs and a
player in the secondary raw materials market
Customer Pull Examples
41
Renewi serves customers at both ends of the value chain and is recognised for its
role as a connector and thought leader in the Circular Economy

Segment Volume(1) Volume Drivers Destination & Collection Themes Recycling Rates(2) Outlook
Municipal (MSW)
8MT
• Waste regulation
• End Producer Responsibility
(EPR)
• Improved packaging (“PMD”
collection)
• Local Circular Economy (CE)
ambitions
• New service driven collection
schemes – eg, inverse collection
• Local CE closed loops, civilian
involvement
• Further source segregation
58% in 2015;
75% target 2020
Residual
waste/inhabitant
202kg in 2015;
100kg target in 2020
Reduced volumes
Higher recycling
rates
I&C
23MT
• GDP growth
• Regulatory attention for
residual I&C reduction
• End Producer Responsibility
(EPR)
• Less waste direct to incineration
• Increasing regulatory pressure to
further separate at the source
• Expected ban to stop all waste to
incineration
Industrial waste:
83% recycling
12% incineration
Commercial waste:
55% recycling
37% incineration
Stable volumes
Higher recycling
rates
C&D
27.7MT
(15%
mixed
C&D
waste)
• GDP growth
• Construction sector growth
• Large infrastructure projects
(increase expected after 2018)
• Most waste sorted/recycled or
reprocessed already
• Collection typically by
sorter/recycler
98% valorisation
(source segregation
and recycling; limited
volume to incineration)
Increasing volumes
Stable recycling
rates
(1) Estimated total market volume in NL 2015; (2) Public data 2014-2017, company estimates
Waste Arising Outlook – NL Case Study
Overall waste arising expected to be broadly flat,
recycling rate set to increase significantly
42

Dutch C&D Outlook
16A 17F 18F
Overall 7% > 5% 2,5 - 4%
Homes 7% > 6% ~ 5%
Utilities 3,5% 3,0% 3,0%
Infra 0-1% 1,5% 1-2%
43
Construction sector overall is still growing but at lower
rates compared to last two years
• Development of new build houses is stabilising
with permit volumes stable
• Sales of existing houses still growing, but will
stabilise due to a natural cap in stock
• Higher sales leads to growing renovation activities
• Utilities have seen growing order books and are
expected to have comparable growth rates
• Infrastructure will see growth due to some large
plans starting in 2018
Order books of construction companies as a whole
have grown further during 2017
Strong positive outlook for core Renewi segment
Source: Rabobank trends forecast Q3 – 2017 and ING sector analysis May 17
New build
houses
existing
houses
Sale of homes 12 month rolling

Incineration Capacity Balance
44
2017 2025
Incineration
Capacity
MT
Available
Combustible
Waste MT
Under (-)
Over (+)
Capacity MT
Under (-)
Over (+)
Capacity %
Trend
towards 2025
UK 18.6 32.2 -13.6 -73%Expected >5MT under capacity, export
outlet remains
BE 3.7 3.7 0 0Wallonia: under capacity expected in
coming years, but stable by 2025
NL 8 5.9 +0.4
(with 1.7M import)<5% net
Volume decrease (regulation), leads to
larger overcapacity more structural or
possibly EfW line closures
G 30.3 25.6 +3.3
(with 1.4M import)<10% net
Some volume decrease, slightly larger
overcapacity filled by Southern/
Eastern EU volumes
Significant under capacity incineration remains in Southern, Central and Eastern Europe;
for example ~13MT in Italy and ~17MT in Poland
Source: CEWP, Eunomia, Eurostat, Renewi Analysis
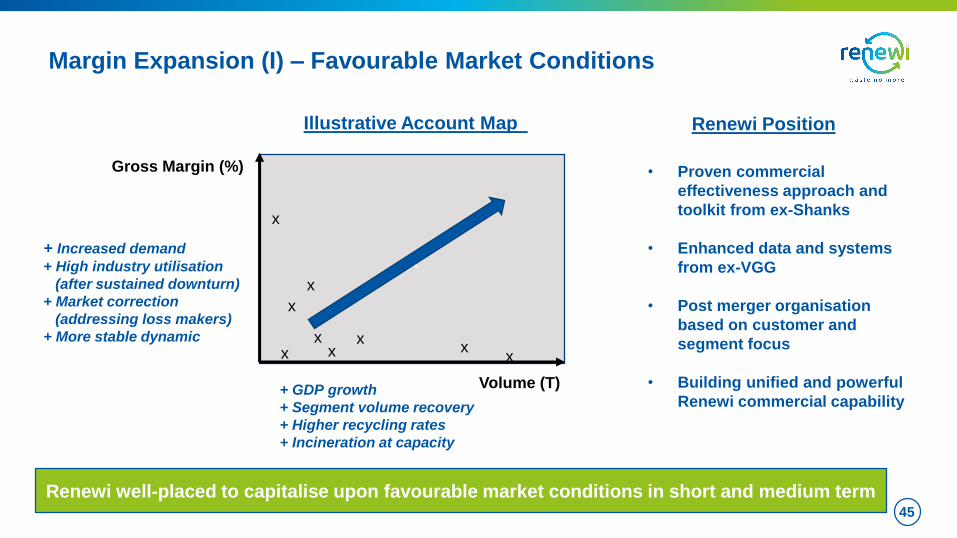
Margin Expansion (I) – Favourable Market Conditions
45
+ Increased demand
+ High industry utilisation
(after sustained downturn)
+ Market correction
(addressing loss makers)
+ More stable dynamic
Illustrative Account Map
Gross Margin (%)
Volume (T)
xx
xx
xx
x
xx
x
• Proven commercial
effectiveness approach and
toolkit from ex-Shanks
• Enhanced data and systems
from ex-VGG
• Post merger organisation
based on customer and
segment focus
• Building unified and powerful
Renewi commercial capability
Renewi Position
Renewi well-placed to capitalise upon favourable market conditions in short and medium term
+ GDP growth
+ Segment volume recovery
+ Higher recycling rates
+ Incineration at capacity

Margin Expansion (II) – Advantaged Cost Position
46
Successful
integration will
increase Renewi
competitiveness
further
CommercialCommercial P&L
Components

Margin Expansion (III) – Proven Tools
47
Continuous
Improvement
Intake
Volumes
Product
Sales
Commercial
Effectiveness
Value
Selling
Building on legacy ‘margin improvement’ initiatives to create Renewi muscle
Processing
Proven Tools Throughout Renewi Value Chain

Innovation: Product Case Studies
48
Over 100 projects from both legacy companies are identified already!
Paint it Back project
Recycled paint sold in second
hand shops in Belgium
FORZ - Mineralz
Making clean building product from
bottom ashes of incineration plants
HIPS Filament for 3D printing
From plastics from recycled fridges
developed together with NL Startup

Innovation: Partnership Case Studies
49
Partnerships in the
value chain
• Development of new (chemical)
recycling technology - base
chemicals & fuels
• More complex mixed waste streams
• Higher demands for secondary raw
materials
• Currently engaged as potential
supply partner
Partnerships with
start-ups
• Partnership with start-up to test the
feasibility of treating citrus fruit
peelings
• Rich on cellulose but also oils /
pectin (products used in pharma
and food industry).
• Renewi customers e.g.
supermarkets also involved
Partnerships with
innovators
• Partnership with innovative
engineering company
• Technology to gain high quality
cellulose (e.g. from nappies)
• Supported by government e.g. in NL
only over 250KT ends up in
incineration

Portfolio Management
50
BUY SELL
Not expecting or planning significant moves until integration advanced
Active management of
our portfolio of
businesses based on:
• Strategic fit
• Sustainable
competitive
advantage
• Target financial
returns
Van Gansewinkel
City of Leiden PRAUK Solid Waste
Industrial Cleaning Wallonia
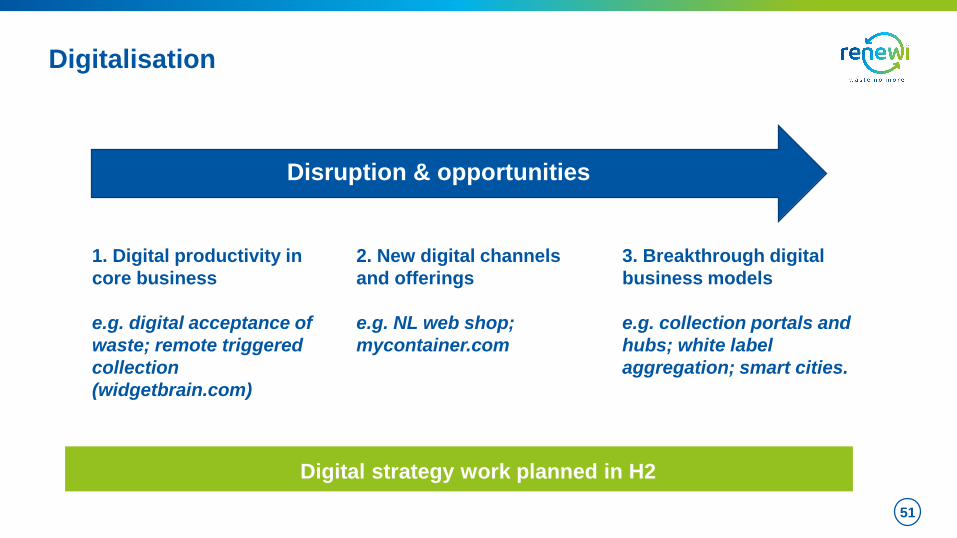
Digitalisation
51
1. Digital productivity in
core business
e.g. digital acceptance of
waste; remote triggered
collection
(widgetbrain.com)
Disruption & opportunities
2. New digital channels
and offerings
e.g. NL web shop;
mycontainer.com
3. Breakthrough digital
business models
e.g. collection portals and
hubs; white label
aggregation; smart cities.
Digital strategy work planned in H2

Merger Information
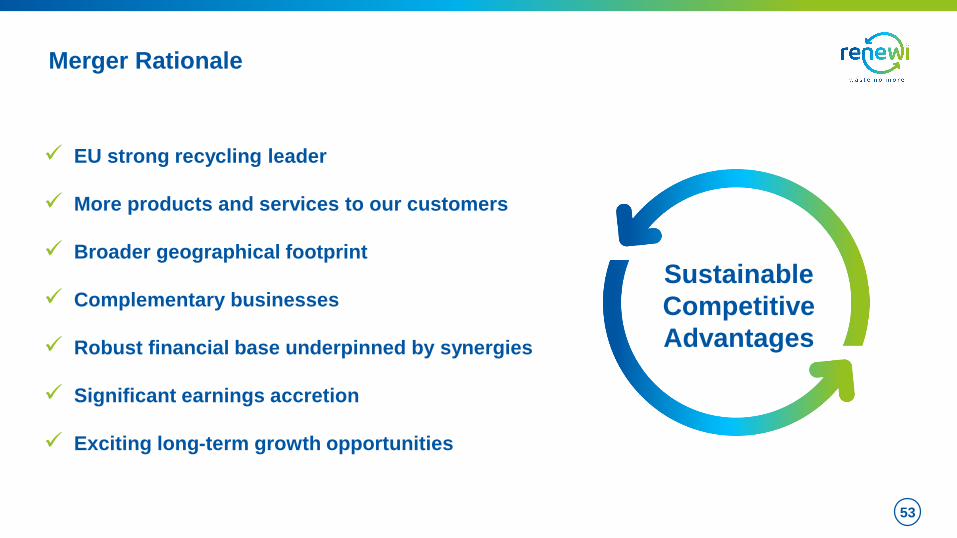
Merger Rationale
53
EU strong recycling leader
More products and services to our customers
Broader geographical footprint
Complementary businesses
Robust financial base underpinned by synergies
Significant earnings accretion
Exciting long-term growth opportunities
Sustainable
Competitive
Advantages
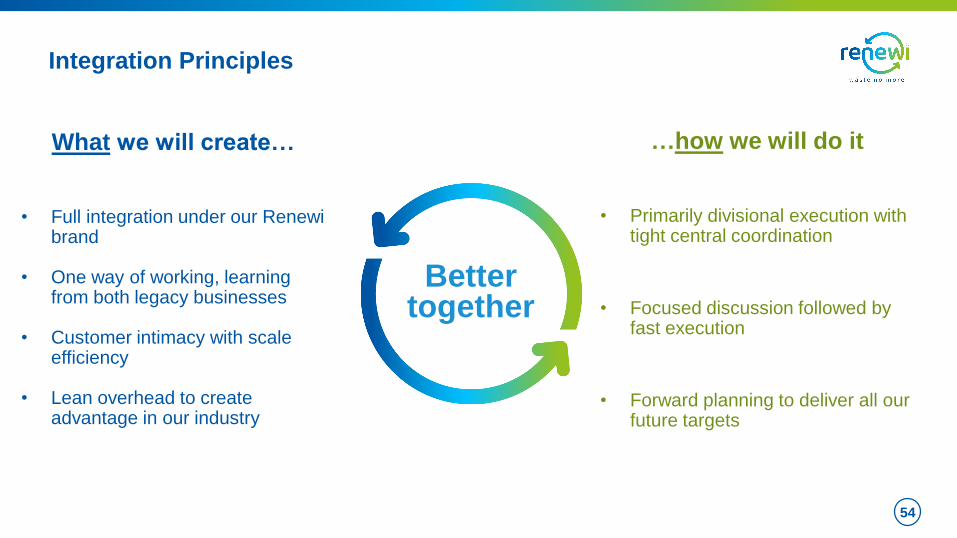
Integration Principles
54
Better together
What we will create…
• Full integration under our Renewibrand
• One way of working, learning from both legacy businesses
• Customer intimacy with scale efficiency
• Lean overhead to create advantage in our industry
…how we will do it
• Primarily divisional execution with tight central coordination
• Focused discussion followed by fast execution
• Forward planning to deliver all our future targets

Proven Track Record
• €20m structural cost programme 2012-15 on
time and on budget
• Shared Service Centres built in NL & BE
• Self-help programmes (CE & CI)
• Harmonisation and standardisation of
fragmented operating company processes
• Extensive portfolio management
• Focus on increasing returns (e.g.
Netherlands up 500bps in last 2 years)
• Business centralisation and reorganisation
• Accustomed to standardised processes and
controls
• Top line revitalisation programme
• Disposal of non-core assets
• Traction gained with margin recovery in 2016
(EBITDA up >20%)
Plus extensive leadership experience in business integration and cost reduction
at other international companies
Shanks Van Gansewinkel
55

Financial Information

Excluding Excluding
Sep 17 Sep 16 Change currency Sep 17 Sep 16 Change currency
£m £m % change % £m £m % change %
Commercial Waste 505.5 446.5 13 5 36.2 24.4 48 38
Hazardous Waste 103.0 94.2 9 1 13.7 12.3 11 5
Monostreams 90.2 77.5 16 8 9.5 6.9 38 29
Municipal 98.7 104.1 (5) (6) (4.9) 1.1 N/A N/A
Group central services - - (10.9) (11.8) 8 11
Inter-segment revenue (14.5) (13.8) - -
Total (pro forma basis) 782.9 708.5 11 4 43.6 32.9 33 21
Total (reported basis) 782.9 348.4 125 43.6 20.7 111
Revenue Underlying EBIT
Segmental Analysis
57
Underlying EBIT = operating profit before non-trading and exceptional items
5yr Min 5yr Max
Mar-17 Sep-17
€0
€50
€100
€150
€200
€250
€300
Sep-12 Sep-13 Sep-14 Sep-15 Sep-16 Sep-17
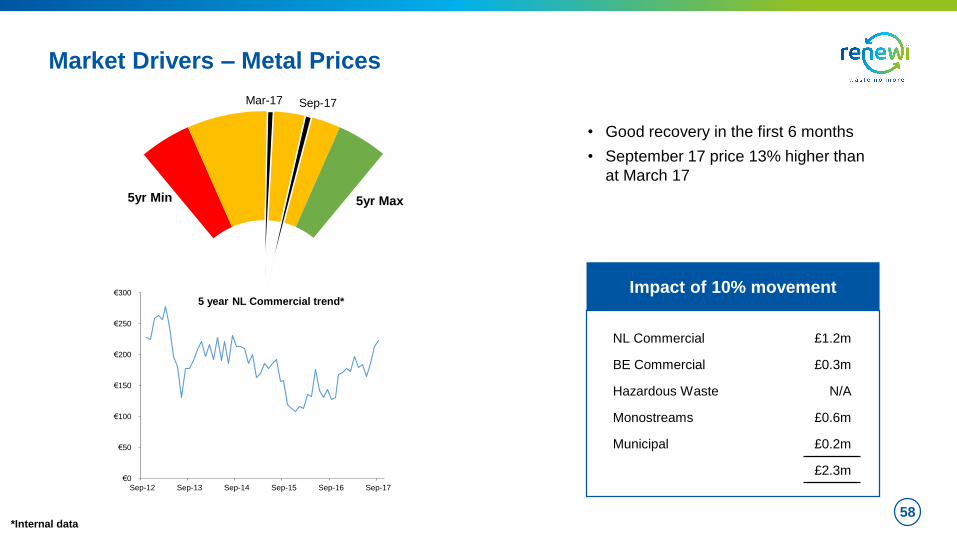
58
Impact of 10% movement
Market Drivers – Metal Prices
NL Commercial £1.2m
BE Commercial £0.3m
Hazardous Waste N/A
Monostreams £0.6m
Municipal £0.2m
£2.3m
5 year NL Commercial trend*
*Internal data
• Good recovery in the first 6 months
• September 17 price 13% higher than
at March 17
5yr Min 5yr Max
Mar-17Sep-17
€0
€20
€40
€60
€80
€100
€120
€140
€160
€180
Sep-12 Sep-13 Sep-14 Sep-15 Sep-16 Sep-17
59
Impact of 10% movement
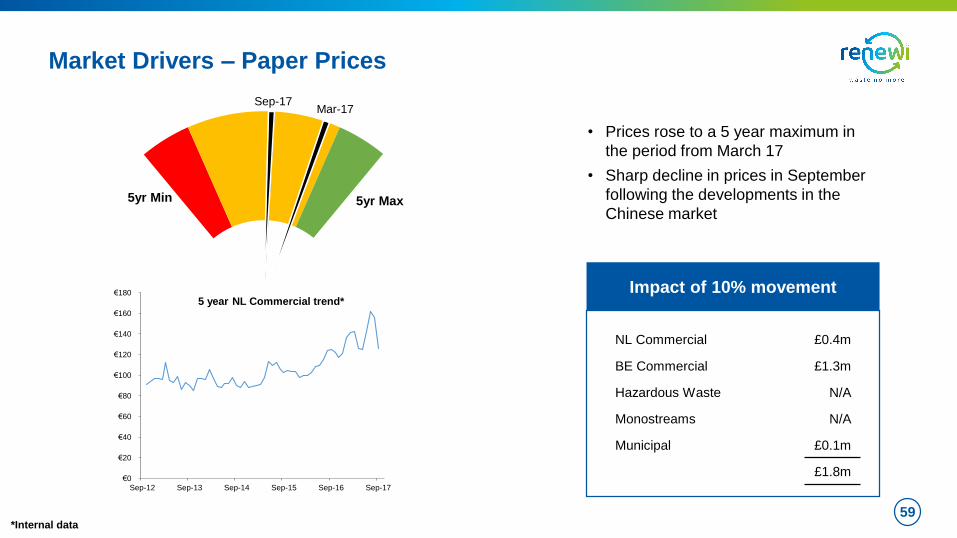
Market Drivers – Paper Prices
*Internal data
• Prices rose to a 5 year maximum in
the period from March 17
• Sharp decline in prices in September
following the developments in the
Chinese market
5 year NL Commercial trend*
NL Commercial £0.4m
BE Commercial £1.3m
Hazardous Waste N/A
Monostreams N/A
Municipal £0.1m
£1.8m
5yr Min 5yr Max
Mar-17Sep-17
$0
$20
$40
$60
$80
$100
$120
$140
Sep-12 Sep-13 Sep-14 Sep-15 Sep-16 Sep-17
60
Impact
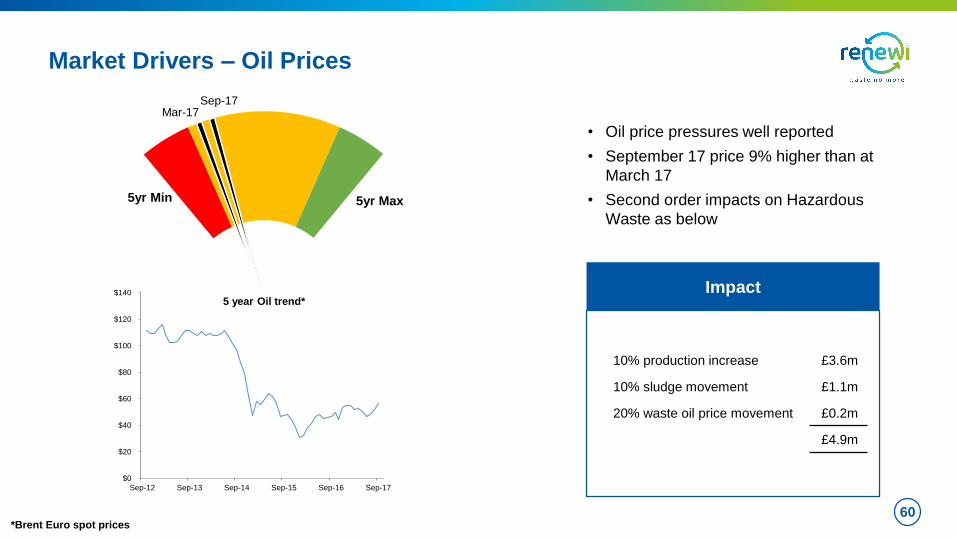
Market Drivers – Oil Prices
10% production increase £3.6m
10% sludge movement £1.1m
20% waste oil price movement £0.2m
£4.9m
*Brent Euro spot prices
• Oil price pressures well reported
• September 17 price 9% higher than at
March 17
• Second order impacts on Hazardous
Waste as below
5 year Oil trend*

4yr Min 4yr Max
Sep-17Mar-17
€0
€1
€2
€3
€4
€5
€6
Sep-13 Sep-14 Sep-15 Sep-16 Sep-17
61
Impact of 10% movement
Market Drivers – Electricity Prices
*Internal data
NM – Not Material
• Further increase in pricing since March 17
• Electricity prices impact energy production
from landfills and AD plants
• Follow on impact on subsidies
NL Commercial NM
BE Commercial £0.3m
Hazardous Waste N/A
Monostreams £0.2m
Municipal £0.2m
£0.7m
4 year Monostreams trend*