interim report january - june 2015 - hoist...
TRANSCRIPT
Interim report January - June 2015 July 31, 2015
Continued stable earnings and growth

Funding operations (HoistSpar) and Headquarter
Debt Purchasing and Debt Collection operations
• Established in 1994, Hoist Finance is a leading debt restructuring partner to international banks
• Main focus is the acquisition and management of bank-originated non-performing unsecured consumer loans (NPLs)
• 20 year track record of successfully acquiring and collecting on more than 1,550 NPL portfolios
• Amicable collection process striving for sustainable repayment plans
• Licensed and supervised by the SFSA with access to cost-efficient deposit funding base, HoistSpar, in Sweden (98% of deposits covered by Swedish deposit guarantee scheme)
• Diversified funding through senior and subordinated unsecured bonds in SEK and EUR
2
Introduction to Hoist Finance
Pan-European presence in nine countries Introduction
1) Including run –off portfolio of consumer loans and portfolios contained in joint venture
2) Third-party collections and other ratio defined as revenue from servicing divided by total revenues
3) Financial institutions ratio defined as unsecured B2C FI debt to total. Trade & Other include unsecured B2C Retail, Secured and Other
Clear focus on debt purchase and FIs
PRODUCT MIX(2)
Revenue Q2 2015
TYPE OF DEBT(3)
Carrying value 30 June 2015
Focus on bank originated debt
Carrying value(1) 9.0bn
23%
25%
22%
16%
14%
Financial Institutions (FI)
98%
Trade & Other 2%
Debt Purchase 90%
Third-party collections &
Other 10%

S 3
Highlights Q2 Key events during the quarter
• Continued stable earnings and growth
• High market activity with negotiations and acquisitions in multiple markets
• Increased operating expenses mainly due to aqcuisitions and greater business volumes and to the rise in legal collection activities, primarily in the UK
• Negative impact from one-off financial items
• Major efforts on preparation for the Compello acquisition that was finalised on 1 of July
• Acquisitions were completed very late in the quarter and will generate revenue as of Q3
• Platforms in Italy and Poland acquired in 2014 perform and deliver according to plan

The timing of our portfolio investments are uneven during the year.
Very strong start in the third quarter, including the large Compello transaction
Acquisitions in the second quarter of 2015 were somewhat below the same period in previous years, and in addition completed very late in the quarter
4
Seasonality in portfolio acquisitions
Prerequisites Outcome
0
500
1 000
1 500
2 000
2 500
3 000
3 500
2013 2014 2015
Q1 Q2 Q3 Q4
SEK million
Q3 pro-forma including Compello

Jan-Jun 2015 includes IPO costs of SEK 46m that have a negative impact on EBIT
5
Second quarter key financial highlights
Gross cash collections (SEK million) EBIT (SEK million)
Total revenue (SEK million)
Portfolio acquisitions (SEK million)
132 161
253 276
Q2 2014 Q2 2015 Jan-Jun 2014 Jan-Jun 2015
897
665
1,330
938
Q2 2014 Q2 2015 Jan-Jun 2014 Jan-Jun 2015
401 537
759
1,036
Q2 2014 Q2 2015 Jan-Jun 2014 Jan-Jun 2015
615 834
1,151
1,625
Q2 2014 Q2 2015 Jan-Jun 2014 Jan-Jun 2015
6
SEK Million Q2 2015 Q2 2014 Change % Jan-Jun 2015 Jan-Jun 2014 Change %
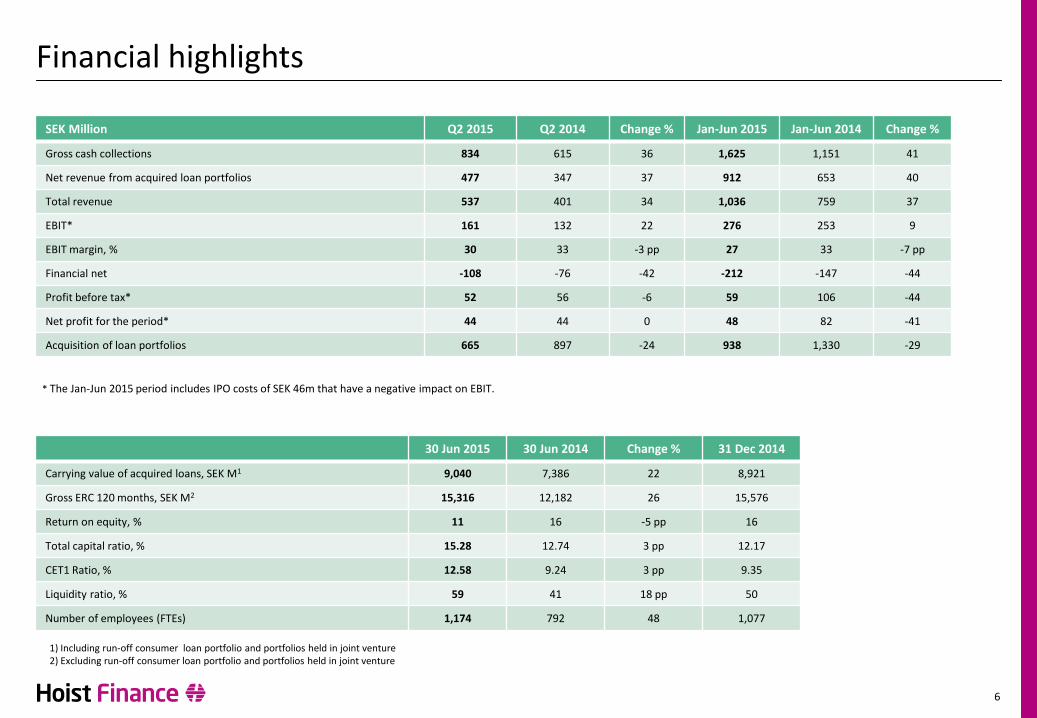
Gross cash collections 834 615 36 1,625 1,151 41
Net revenue from acquired loan portfolios 477 347 37 912 653 40
Total revenue 537 401 34 1,036 759 37
EBIT* 161 132 22 276 253 9
EBIT margin, % 30 33 -3 pp 27 33 -7 pp
Financial net -108 -76 -42 -212 -147 -44
Profit before tax* 52 56 -6 59 106 -44
Net profit for the period* 44 44 0 48 82 -41
Acquisition of loan portfolios 665 897 -24 938 1,330 -29
Financial highlights
30 Jun 2015 30 Jun 2014 Change % 31 Dec 2014
Carrying value of acquired loans, SEK M1 9,040 7,386 22 8,921
Gross ERC 120 months, SEK M2 15,316 12,182 26 15,576
Return on equity, % 11 16 -5 pp 16
Total capital ratio, % 15.28 12.74 3 pp 12.17
CET1 Ratio, % 12.58 9.24 3 pp 9.35
Liquidity ratio, % 59 41 18 pp 50
Number of employees (FTEs) 1,174 792 48 1,077
1) Including run-off consumer loan portfolio and portfolios held in joint venture 2) Excluding run-off consumer loan portfolio and portfolios held in joint venture
* The Jan-Jun 2015 period includes IPO costs of SEK 46m that have a negative impact on EBIT.

SEK million Q2 2015 Q2 2014 Change Full year
2014
Gross cash collections 210 155 35% 724
Total revenue 104 88 18% 446
EBIT 43 35 24% 224
EBIT-margin, (%) 42 39 3 pp 50
Carrying value1 2,221 2,010 10% 2,350
120-month ERC2 3,616 3,235 12% 3,817
• Gross cash collections up 35%, mainly attributable to two large acquisitions
• EBIT improved with 24% as a result of increased collections where operating expenses have increased to a lesser extent
• Carrying value increased by 10% due to higher acquisition activity
7
Regional overview – Germany and Austria
Comments
1) Including run-off portfolio of consumer loans 2) Excluding run-off portfolio of consumer loans
SEK million Q2 2015 Q2 2014 Change Full year
2014
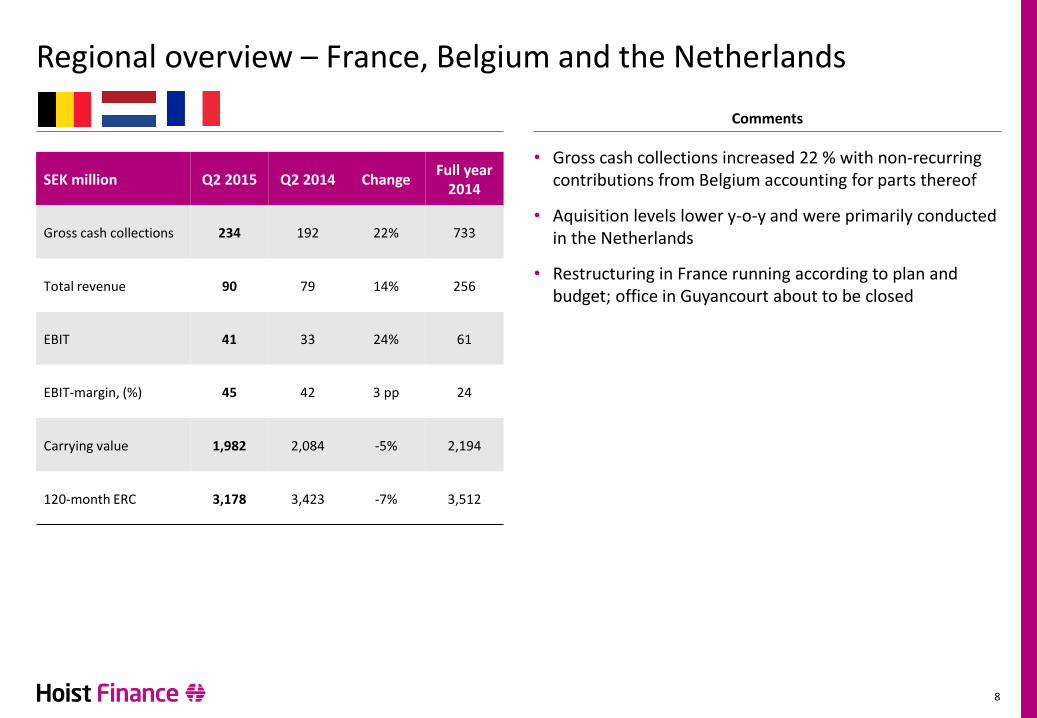
Gross cash collections 234 192 22% 733
Total revenue 90 79 14% 256
EBIT 41 33 24% 61
EBIT-margin, (%) 45 42 3 pp 24
Carrying value 1,982 2,084 -5% 2,194
120-month ERC 3,178 3,423 -7% 3,512
• Gross cash collections increased 22 % with non-recurring contributions from Belgium accounting for parts thereof
• Aquisition levels lower y-o-y and were primarily conducted in the Netherlands
• Restructuring in France running according to plan and budget; office in Guyancourt about to be closed
8
Regional overview – France, Belgium and the Netherlands
Comments
SEK million Q2 2015 Q2 2014 Change Full year
2014
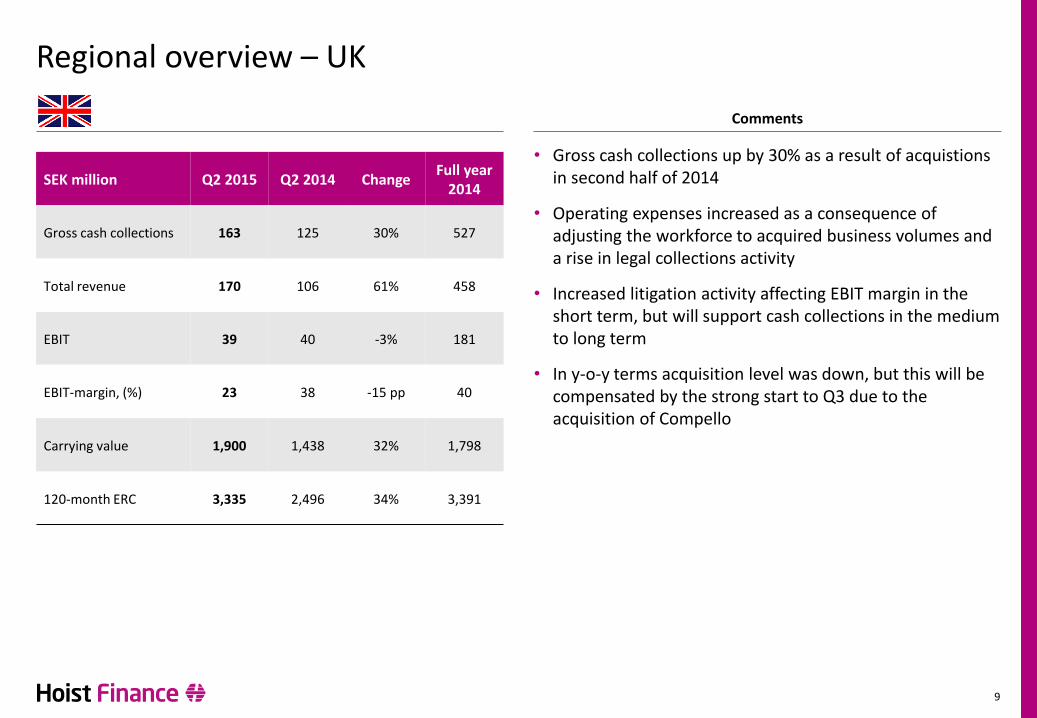
Gross cash collections 163 125 30% 527
Total revenue 170 106 61% 458
EBIT 39 40 -3% 181
EBIT-margin, (%) 23 38 -15 pp 40
Carrying value 1,900 1,438 32% 1,798
120-month ERC 3,335 2,496 34% 3,391
• Gross cash collections up by 30% as a result of acquistions in second half of 2014
• Operating expenses increased as a consequence of adjusting the workforce to acquired business volumes and a rise in legal collections activity
• Increased litigation activity affecting EBIT margin in the short term, but will support cash collections in the medium to long term
• In y-o-y terms acquisition level was down, but this will be compensated by the strong start to Q3 due to the acquisition of Compello
9
Regional overview – UK
Comments
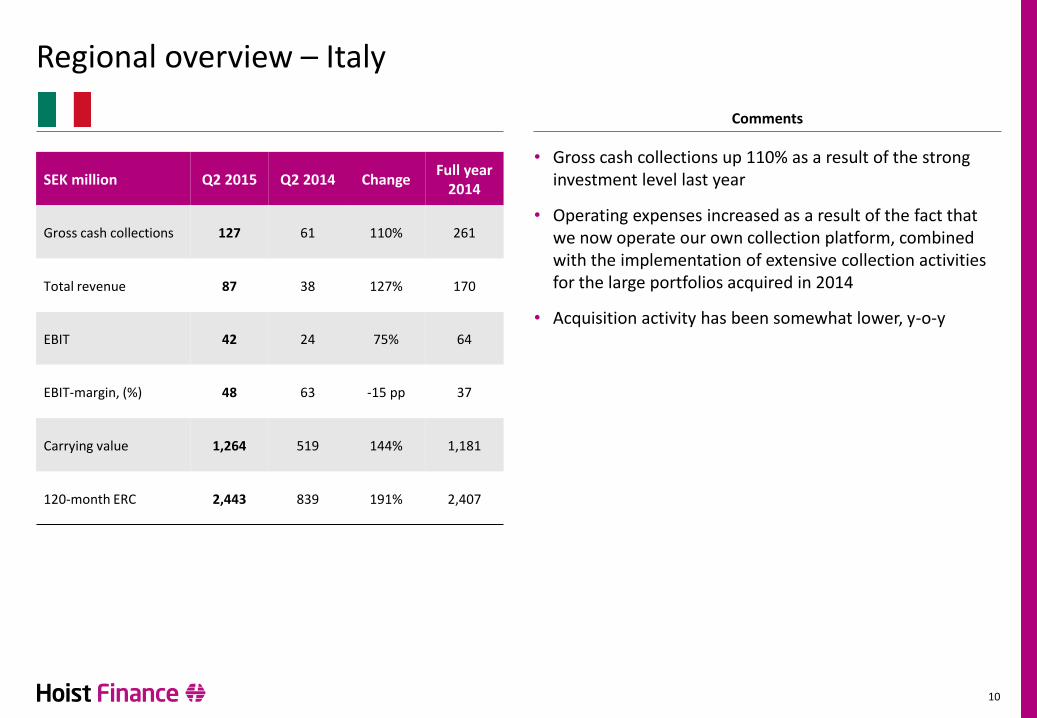
SEK million Q2 2015 Q2 2014 Change Full year
2014
Gross cash collections 127 61 110% 261
Total revenue 87 38 127% 170
EBIT 42 24 75% 64
EBIT-margin, (%) 48 63 -15 pp 37
Carrying value 1,264 519 144% 1,181
120-month ERC 2,443 839 191% 2,407
• Gross cash collections up 110% as a result of the strong investment level last year
• Operating expenses increased as a result of the fact that we now operate our own collection platform, combined with the implementation of extensive collection activities for the large portfolios acquired in 2014
• Acquisition activity has been somewhat lower, y-o-y
10
Regional overview – Italy
Comments

SEK million Q2 2015 Q2 2014 Change Full year
2014
Gross cash collections 99 82 22% 296
Total revenue 73 78 -6% 279
EBIT 51 61 -15% 202
EBIT-margin, (%) 71 78 -7 pp 72
Carrying value 1,449 1,115 30% 1,182
120-month ERC 2,744 2,189 25% 2,449
• Cash collections continued to grow, up 22% y-o-y
• EBIT margin remain on a very attractive level and reflect a profitable market in which we have historically acquired portfolios with good returns
• Integration of Navi Lex progressing well. In connection with this further portfolios undergoing review leading to changes in portfolio valuation amounting to -6 MSEK.
• Acquisition activity picked up significantly in Q2
11
Regional overview – Poland
Comments

12
Balance sheet
Balance sheet structure 30 June 2015 Balance sheet development
1) Including run-off portfolio of consumer loans and portfolios held in joint venture
SEK million
Senior Unsecured Debt
SEK million 30 June
2015 31 March
2015 Change
Cash and interest-bearing securities 7,675 7,429 3%
Acquired loans1 9,040 8,827 2%
Other assets 688 593 16%
Total 17,403 16,849 3%
Deposits 12,768 12,317 4%
Senior unsecured debt 1,459 1,464 0%
Subordinated debt 335 334 0%
Other liabilities 694 608 14%
Shareholders’ equity 2,148 2,126 1%
Total 17,403 16,849 3%
Other Assets
Acquired Loans
Cash and Interest-bearing
Securities
Other Liabilities
Subordinated Debt
1-3 Year Deposits
Floating Deposits
53% Term-funding
44% Liquidity Reserve
Shareholders Equity (incl. Tier 1)

13
Managing our competitive funding with focus on the long term
Recent development Near term outlook
• Partial buy-back of SEK-bond initiated in Q2
• Deposit mix gradually moving towards term
• Adjusting offer in sync with market
• Instant effect on current accounts; effect on term deposits linked to maturity profile with current turnover in stock being modest
• Composition unchanged; very low risk, short tenor, close to zero yield
• Liquidity available to accommodate potentially large acquisitions (e.g. Compello in early Q3)
• Unfavorable credit spread development impacting net interest income in Q2 by -13 MSEK, although aim is to hold to maturity
Confident in current funding strategy
Capacity to acquire, even if net deposit flow would turn negative in some period
Further bond issues unlikely in the near term
Lowering offered deposit rates
Strive for diverse funding, reducing mismatch
Exceptionally large liquidity portfolio, with poor realized yield

14
Funding structure, capital- and liquidity ratios
Capital ratios
• Improved capital ratios
• Improved maturity matching
• Strong liquidity ratio
Funding structure
Liquidity ratios
59%
41%
Liquidity ratio
Q2 2015 Q2 2014
12.58% 13.28% 15.28%
9.24% 10.74%
12.74%
Common Equity Tier 1 capitalratio
Tier 1 capital ratio Total capital ratio
Q2 2015 Q2 2014
44%
59%
32%
20%
9% 7% 2% 3%
13% 11%
Q2 2015 Q2 2014
Equity
Subordinated debt
Senior unsecured debt
1-3 Year deposits
Floating deposits

15
Our strategy and financial targets
Cornerstones of our strategy Our financial targets
TO CONTINUE TO POSITION THE COMPANY AS THE LEADING DEBT RESTRUCTURING PARTNER TO
INTERNATIONAL BANKS By utilizing our operating leverage we aim to achieve an EBIT margin of above 40% in the medium term
Common equity Tier 1 capital (CET1) ratio to exceed 12% with potential to temporarily go below as a result of large portfolio or goodwill acquisitions
As we continue to foresee substantial acquisition opportunities in our markets we will initially aim to distribute around 25–30% of our net profit as dividend over the medium term. Given the historically strong cash flow generation of our business, our long term aim is to distribute around 50% of the annual net profit as dividend
• Strengthen platform in current markets and continue European expansion
• Maintain business focus and underwriting discipline
• Optimize collection strategies with primary focus on in-house collections
• Utilize embedded operating leverage to increase efficiency
• Maintain solid capital and liquidity positions
Profitability
Capitalization
Dividend policy
S
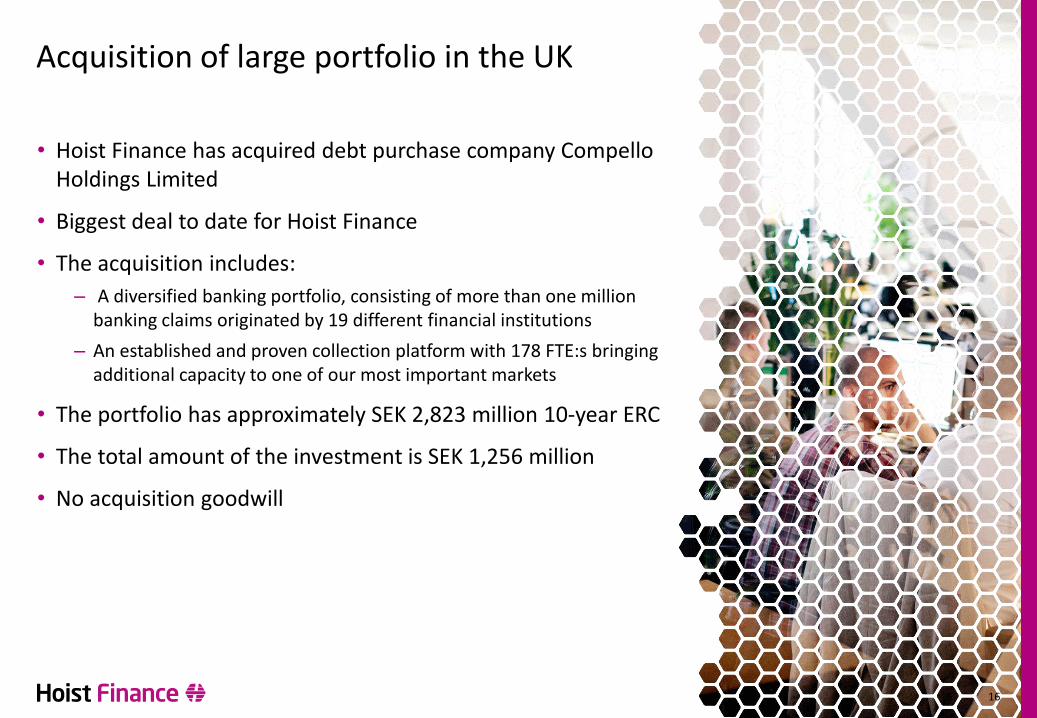
• Hoist Finance has acquired debt purchase company Compello Holdings Limited
• Biggest deal to date for Hoist Finance
• The acquisition includes:
– A diversified banking portfolio, consisting of more than one million banking claims originated by 19 different financial institutions
– An established and proven collection platform with 178 FTE:s bringing additional capacity to one of our most important markets
• The portfolio has approximately SEK 2,823 million 10-year ERC
• The total amount of the investment is SEK 1,256 million
• No acquisition goodwill
16
Acquisition of large portfolio in the UK
17
Outlook
• Continued focused strategy on profitable growth and geographical expansion
• Well positioned to capture growth opportunities in the market
• Positive trend with substantial amount of portfolios in pipeline
• Pricing harmonisation between countries
• Target for FY 2015: purchase volumes in line with or higher than 2014
• Q2 well in line with our expectations with stable earnings and growth
• High market activity
• Platforms acquired in 2014 well integrated and performing according to plan
• Strong balance sheet
• Good start of Q3 with single biggest deal to date
18
Key takeaways


Appendix

21
Cash flow (incl. Adjusted EBITDA)
Adjusted EBITDA reconciliation Adjusted EBITDA development
SEK million Q2
2015 Q2
2014 Jan-Jun
2015 Jan-Jun
2015 Full Year
2014
Net profit for the period 44 44 48 82 180
+ income taxes 8 12 12 24 38
+ portfolio revaluations 6 - 9 - 15
- interest income (excl. interest from run-off performing portfolio)
12 -12 7 -23 -52
+ interest expense 93 82 185 166 345
+/- net result from financial transactions 4 7 24 4 18
+ depreciation and amortisation 11 7 22 14 30
EBITDA 178 140 307 267 574
+ amortisation on run-off portfolio 17 23 37 54 91
+ amortisation on acquired loan portfolios 354 278 710 519 1,128
Adjusted EBITDA 549 441 1,054 840 1,793
Capital expenditure PPE and IT -10 -8 -23 -14 -79
Operating cash flow 539 433 1,031 826 1,714
Net interest expenses (excl. Interest from run-off performing portfolio)
-105 -70 -192 -143 -293
Operating cash flow after financing expenses
434 363 839 683 1,421
Portfolio acquisitions 665 897 938 1,330 3,227
SEK million
441
549
840
1,054
1,793
Q2 2014 Q2 2015 Jan-Jun 2014 Jan-Jun 2015 Full year 2014
+24%
+25%
