interim report first months
TRANSCRIPT

Interim Report First 6 Months 2018/19October 1, 2018 to March 31, 2019
2 Aurubis · Interim Report First 6 Months 2018/19
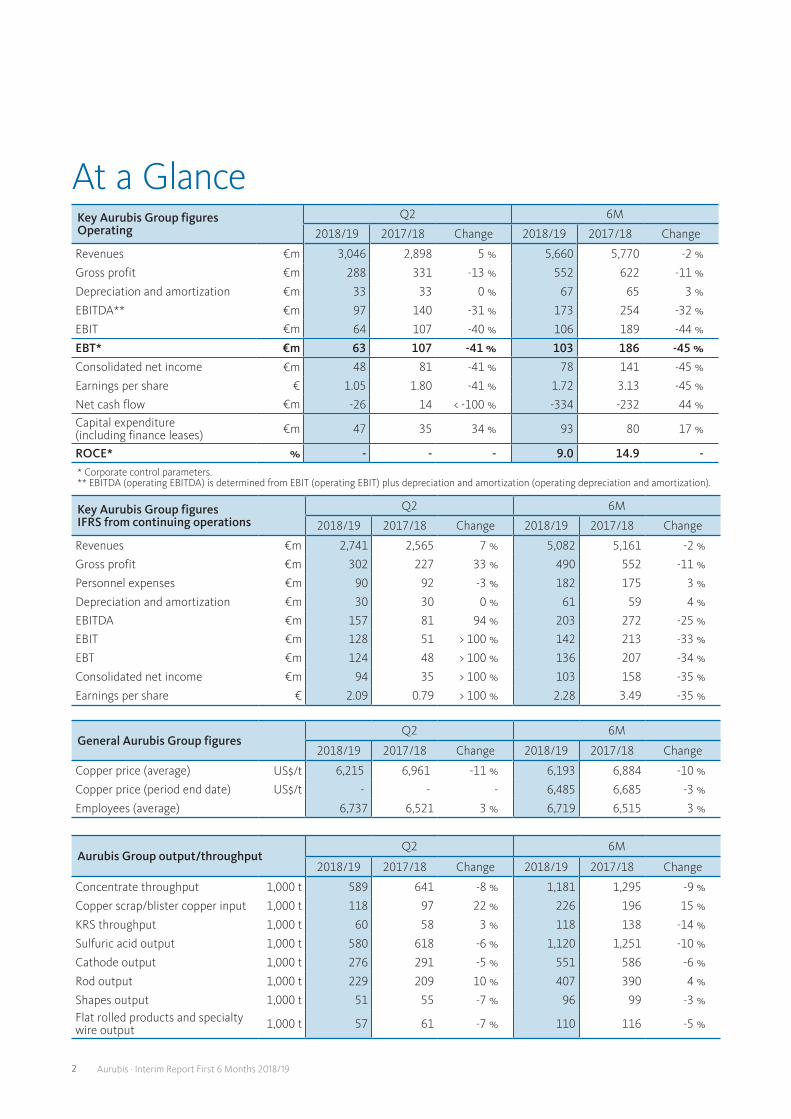
At a Glance
Aurubis Group output/throughputQ2 6M
2018/19 2017/18 Change 2018/19 2017/18 Change
Concentrate throughput 1,000 t 589 641 -8 % 1,181 1,295 -9 %
Copper scrap/blister copper input 1,000 t 118 97 22 % 226 196 15 %
KRS throughput 1,000 t 60 58 3 % 118 138 -14 %
Sulfuric acid output 1,000 t 580 618 -6 % 1,120 1,251 -10 %
Cathode output 1,000 t 276 291 -5 % 551 586 -6 %
Rod output 1,000 t 229 209 10 % 407 390 4 %
Shapes output 1,000 t 51 55 -7 % 96 99 -3 %Flat rolled products and specialty wire output 1,000 t 57 61 -7 % 110 116 -5 %
Key Aurubis Group figures Operating
Q2 6M
2018/19 2017/18 Change 2018/19 2017/18 Change
Revenues €m 3,046 2,898 5 % 5,660 5,770 -2 %
Gross profit €m 288 331 -13 % 552 622 -11 %
Depreciation and amortization €m 33 33 0 % 67 65 3 %
EBITDA** €m 97 140 -31 % 173 254 -32 %
EBIT €m 64 107 -40 % 106 189 -44 %
EBT* €m 63 107 -41 % 103 186 -45 %
Consolidated net income €m 48 81 -41 % 78 141 -45 %
Earnings per share € 1.05 1.80 -41 % 1.72 3.13 -45 %Net cash flow €m -26 14 < -100 % -334 -232 44 %Capital expenditure (including finance leases) €m 47 35 34 % 93 80 17 %
ROCE* % - - - 9.0 14.9 -* Corporate control parameters.** EBITDA (operating EBITDA) is determined from EBIT (operating EBIT) plus depreciation and amortization (operating depreciation and amortization).
General Aurubis Group figuresQ2 6M
2018/19 2017/18 Change 2018/19 2017/18 Change
Copper price (average) US$/t 6,215 6,961 -11 % 6,193 6,884 -10 %
Copper price (period end date) US$/t - - - 6,485 6,685 -3 %
Employees (average) 6,737 6,521 3 % 6,719 6,515 3 %
Key Aurubis Group figures IFRS from continuing operations
Q2 6M
2018/19 2017/18 Change 2018/19 2017/18 Change
Revenues €m 2,741 2,565 7 % 5,082 5,161 -2 %Gross profit €m 302 227 33 % 490 552 -11 %
Personnel expenses €m 90 92 -3 % 182 175 3 %
Depreciation and amortization €m 30 30 0 % 61 59 4 %EBITDA €m 157 81 94 % 203 272 -25 %EBIT €m 128 51 > 100 % 142 213 -33 %
EBT €m 124 48 > 100 % 136 207 -34 %
Consolidated net income €m 94 35 > 100 % 103 158 -35 %
Earnings per share € 2.09 0.79 > 100 % 2.28 3.49 -35 %

3Aurubis · Interim Report First 6 Months 2018/19
Table of Contents
4 Highlights
6 Interim Group Management Report First 6 Months 2018/19 6 Results of Operations, Net Assets, and Financial Position 14 Segment Metal Refining & Processing 18 Segment Flat Rolled Products 19 Corporate Governance 19 Risk and Opportunity Management 20 Outlook
22 Interim Consolidated Financial Statements First 6 Months 2018/19 22 Consolidated Income Statement 23 Consolidated Statement of Comprehensive Income 24 Consolidated Statement of Financial Position 26 Consolidated Cash Flow Statement 27 Consolidated Statement of Changes in Equity 28 Selected Notes to the Consolidated Financial Statements 35 Consolidated Segment Reporting 38 Responsibility Statement
39 Dates and Contacts
This report may include slight deviations in the totals due to rounding.

4 Aurubis · Interim Report First 6 Months 2018/19
The Aurubis Group generated operating earnings before taxes (EBT) of € 103 million in the first half of FY 2018/19 (previous year: € 186 million). The operating result was strongly influenced by significantly lower concentrate throughputs and significantly lower refining charges for copper scrap. Operating return on capital employed (ROCE) was 9.0 % (previous year: 14.9 %). IFRS earnings before taxes (EBT) from continuing operations (see page 6) were € 136 million (previous year: € 207 million).
Highlights
The Group generated revenues of € 5,660 million during the first half of FY 2018/19 (previous year: € 5,770 million). This development is due to the lower concen-trate throughput and the lower average copper price.
Operating EBT was € 103 million (previous year: € 186 million) and was negatively influenced by:
» Significantly lower concentrate throughputs, coupled with lower treatment and refining charges for copper concentrates,
» Unplanned shutdowns already in Q1 2018/19 at our Hamburg, Pirdop, and Lünen sites with a negative effect of approximately € 25 million on earnings,
» Significantly lower refining charges for copper scrap compared to the previous year, with a good supply,
» Higher energy costs,» Weaker demand for flat rolled products.
Positive effects on operating EBT included:
» Higher sulfuric acid revenues due to considerably higher sales prices, despite lower output volumes resulting from the shutdowns,
» A robust, high level of sales of copper rod and shapes products,
» The recognition of a receivable of € 20 million from Wieland-Werke AG from the rejected sale of Segment Flat Rolled Products,
» Positive contributions from our efficiency improvement program.
Operating ROCE (taking the operating EBIT of the last four quarters into consideration) was 9.0 % (previous year: 14.9 %). The decrease resulted from lower contributions to earnings compared to the previous year, with an increase in capital employed due primarily to a build-up of inventories. EBT from continuing operations on an IFRS basis amounted to € 136 million (previous year: € 207 million).
The net cash flow as at March 31, 2019 was € -334 million (previous year: € -232 million). The significant decrease is mainly the result of higher inventories of intermediate products to prepare for scheduled maintenance shutdowns, as well as finished products, compared to September 30, 2018.
Segment FRP continues to be classified as discontinued operations pursuant to IFRS. This does not affect the operating reporting.
Operating EBT for Segment Metal Refining & Processing (MRP) amounted to € 112 million during the reporting period, down on the very good previous year (€ 202 million). The decline in operating EBT resulted from the influencing factors already mentioned.
Segment Flat Rolled Products (FRP) generated operating EBT of € -3 million in the first half of FY 2018/19 (previous year: € 4 million). The considerably lower result compared to the previous year is mainly due to a lower sales volume and less favorable conditions on the buying market.

5Aurubis · Interim Report First 6 Months 2018/19
Following the European Commission’s veto of the transaction to sell Segment FRP to Wieland-Werke AG on February 6, 2019, Aurubis is now reviewing other strategic options for Segment FRP.
At the start of the reporting period, the copper price was US$ 6,172/t (LME settlement). After a notable decline to US$ 5,801/t at the start of January, the copper price recovered to US$ 6,572/t on February 1, 2019, supported by reports that the trade conflict between China and the US was possibly cooling off, as well as positive economic data from China. After moving sideways in March, the copper price was quoted at US$ 6,485/t on March 31, 2019. The average price for Q2 2018/19 reached US$ 6,215/t (previous year: US$ 6,961/t). The average price in euros was € 5,473/t (previous year: € 5,664/t).
There was a good supply on the international copper concentrate market in the first six months of FY 2018/19. High output from mines came up against isolated, in some cases unplanned, smelter shutdowns. The copper price level served as an incentive for the mining industry to fully utilize its production capacity. Aurubis also benefited and was able to fully supply its production facilities with copper concentrates at all times.
Following a good copper scrap supply in Europe and the US in the first three months of FY 2018/19, the market continued to reflect a favorable development in Q2 of the fiscal year, recording a sufficient supply. This was positively influenced by higher metal prices, generally stable ongoing economic conditions, and the existing restrictions on imports of copper scrap from the US to China. In March, refining charges for copper scrap in Europe continued to rise. Aurubis utilized the good market situation and was able to fully supply its production facilities with copper scrap during the reporting period.
Demand on the global market for sulfuric acid was consistently high in the first half of 2018/19. The supply was very limited, a situation that was reinforced by isolated smelter shutdowns, especially in South America and Asia. This led to a high price level on the spot market during the reporting period. The market situation in Europe remained very stable.
The cathode market continued to record good demand in the first six months of 2018/19. While spot premiums in Europe were stable, the quotation in Shanghai was substantially lower than the very high level the research firm CRU reported for fall 2018.
Because of the earnings development in the first half of 2018/19 and weakened economic conditions, especially in the automotive sector, Aurubis reduced its full-year forecast for FY 2018/19. The Aurubis Group now expects significantly lower operating EBT and a significantly lower operating ROCE compared to the previous year.
In light of the half-year result, Executive Board Chairman Jürgen Schachler commented:
“We of course aren’t satisfied with the half-year result and the adjustment of our forecast – Aurubis is certainly capable of more. However, this year is also a transitional year for Aurubis: We are using the scheduled shutdowns to invest in our production and in environmental protection beyond what is legally required. Together with measures from the efficiency improvement program, we are therefore sustainably improving our facilities’ reliability and our competitiveness.”

6 Aurubis · Interim Report First 6 Months 2018/19
Consolidated Interim Management Report First 6 Months 2018/19
Results of Operations, Net Assets, and Financial PositionIn order to portray the Aurubis Group’s operating success independently of measurement influences for internal management purposes, the presentation of the results of operations, net assets, and financial position is supplemented by the results of operations and net assets explained on the basis of operating values.
With the signing of the term sheet with Wieland-Werke AG in spring 2018, Segment Flat Rolled Products (FRP) fulfilled the conditions to be recognized as discontinued operations in accordance with IFRS. The European Commission prohibited the transaction on February 6, 2019. Aurubis is now reviewing other strategic options for Segment FRP.
In this respect, the presentation and measurement rules specified in IFRS 5 must continue to be applied for Segment FRP. These include, among other things, a separate, aggregated disclosure of consolidated net income from discontinued operations in the consolidated income statement, as well as a separate, aggregated disclosure of assets and liabilities held for sale for the discontinued operations in the consolidated statement of financial position. Furthermore, additional disclosures must be made in the notes to the financial statements (see page 28). With respect to measurement in accordance with IFRS 5, among other things, any impact on income deriving from scheduled depreciation and amortization in Segment FRP, or from application of equity accounting for the purpose of consolidating the investment in the joint venture, Schwermetall Halbzeugwerk GmbH & Co. KG (Schwermetall), must be discontinued in the IFRS consolidated financial statements.
The Executive Board treats Segment FRP as an operating reporting segment and, consequently, the financial
reporting for operating purposes will remain unchanged until a possible sale of Segment FRP.
As a result, the accounting impacts deriving from IFRS 5 in the financial statements are reversed in the reconciliation between IFRS reporting and operating reporting.
As regards the reconciliation of the consolidated income statement, the items reported as discontinued activities are again shown separately. For purposes of measurement, the impacts on income deriving from scheduled depreciation and amortization of fixed assets, or from application of equity accounting for the purpose of consolidating the investment, are accounted for, as in the past. In order to demonstrate the Aurubis Group’s operating success, subsequent adjustments are also made to inventories and non-current assets.
In order to adjust the measurement impacts in assets resulting from the application of IAS 2, metal price fluctuations resulting from the application of the average cost method are eliminated in the same manner as any write-downs or appreciation in value for copper inventories at the reporting date. Furthermore, from FY 2010/11 onwards, fixed assets have been adjusted for effects deriving from purchase price allocations (PPAs), primarily relating to property, plant, and equipment.
As regards the reconciliation of the consolidated statement of financial position, assets and liabilities held for sale as discontinued operations are again disclosed in a disaggregated form and the measurement effects on the relevant items in the statement of financial position are recognized as they have been in the past. Subsequently, in order to demonstrate the Aurubis Group’s operating success, measurement impacts on inventories and fixed assets are also adjusted for.

7Aurubis · Interim Report First 6 Months 2018/19
Reconciliation of the consolidated income statement (in € million)
6M 2018/19 6M 2017/18
IFRS from con-
tinuing opera-tions
Adjustment effects
Opera-ting
IFRS from con-
tinuing opera-tions
Adjustment effects
Opera-ting
Discon-tinued opera-tions
Inven-tories PPA
Discon-tinued opera-tions
Inven-tories PPA
Revenues 5,082 578 0 0 5,660 5,161 609 0 0 5,770
Changes in inventories of finished goods and work in process
476 21 -62 0 435 238 30 -49 0 219
Own work capitalized 9 0 0 0 9 7 0 0 0 7
Other operating income 40 0 0 0 40 24 0 0 0 24
Cost of materials -5,117 -497 22 0 -5,592 -4,878 -521 1 0 -5,398
Gross profit 490 102 -40 0 552 552 118 -48 0 622
Personnel expenses -182 -67 0 0 -249 -175 -64 0 0 -239
Depreciation of property, plant, and equipment and amortization of intangible assets
-61 -7 0 1 -67 -59 -7 0 1 -65
Other operating expenses -105 -25 0 0 -130 -105 -24 0 0 -129
Operational result (EBIT) 142 3 -40 1 106 213 23 -48 1 189 Result from investments measured using the equity method
0 3 1 0 4 0 6 -2 0 4
Interest income 2 0 0 0 2 2 0 0 0 2
Interest expense -8 -1 0 0 -9 -8 -1 0 0 -9 Earnings before taxes (EBT) 136 5 -39 1 103 207 28 -50 1 186
Income taxes -33 -4 12 0 -25 -49 -7 11 0 -45
Consolidated net income 103 1 -27 1 78 158 21 -39 1 141
See page 6 for an explanation of the presentation and the adjustment effects.
Results of operations (operating)The following table shows how the operating result for the first six months of FY 2018/19 and for the comparative prior-year period have been determined.
Operating EBT in the first half-year amounts to € 103 million and is derived from continuing and discontinued operations of the IFRS result as follows:
Aurubis generated IFRS earnings before taxes of € 136 million from continuing operations in the first half-year (previous year: € 207 million). IFRS earnings before taxes from discontinued operations amount to € 5 million (previous year: € 28 million).
The accounting impacts of IFRS 5 were reversed to derive the operating result. Accordingly, scheduled depreciation and amortization (€ -7 million) and the
8 Aurubis · Interim Report First 6 Months 2018/19
recognition in income of the shares of Schwermetall consolidated using the equity method (€ 3 million) were taken into account in the reconciliation to the operating result, as in the past.
Moreover, to derive the operating result, the IFRS result was adjusted for inventory measurement effects of € -39 million (previous year: € -50 million). The position consists of the following: “Changes in inventories of finished goods and work in process,” “Cost of materials,” and “Result from investments measured using the equity method.”
Operating EBT was negatively influenced by:
» Significantly lower concentrate throughputs, coupled with lower treatment and refining charges for copper concentrates,
» Unplanned shutdowns already in Q1 2018/19 at our Hamburg, Pirdop, and Lünen sites with a negative effect of approximately € 25 million on earnings,
» Significantly lower refining charges for copper scrap compared to the previous year, with a good supply,
» Higher energy costs,» Weaker demand for flat rolled products..
Positive effects on operating EBT included:
» Higher sulfuric acid revenues due to considerably higher sales prices, despite lower output volumes resulting from the shutdowns,
» A robust, high level of sales of copper rod and shapes products,
» The recognition of a receivable of € 20 million from Wieland-Werke AG from the rejected sale of Segment Flat Rolled Products,
» Positive contributions from our efficiency improvement program.
The Group’s revenues decreased by € 110 million to € 5,660 million (previous year: € 5,770 million) during the reporting period. This development was primarily due to the lower concentrate throughput and the lower average copper price.
The inventory change of € 435 million (previous year: € 219 million) was due in particular to a build-up of copper and precious metal inventories.
In a manner corresponding to the development for revenues and inventory changes, the cost of materials increased from € 5,398 million in the previous year to € 5,592 million.
Own work capitalized increased by € 2 million in the first half-year, to € 9 million. The increase is mainly due to activities related to the Future Complex Metallurgy project.
Other operating income increased by € 16 million to € 40 million (previous year: € 24 million). This includes income from the recognition of a receivable in the amount of € 20 million from Wieland-Werke AG from the rejected sale of Segment FRP.
Gross profit amounted to € 552 million (previous year: € 622 million).
Personnel expenses rose from € 239 million in the previous year to € 249 million due to wage tariff agreement increases and a slightly higher number of employees. We particularly strengthened our personnel resources in order to address certain issues that will grow in importance in the future. These include areas such as research, development, innovation, technology, and the Future Complex Metallurgy project.
Depreciation and amortization of fixed assets and other operating expenses were both slightly above prior-year level.

9Aurubis · Interim Report First 6 Months 2018/19
The operational result before interest and taxes (EBIT) therefore amounted to € 106 million (previous year: € 189 million).
At € 7 million, net interest expense was at prior-year level.
After taking the financial result into account, operating earnings before taxes (EBT) were € 103 million (previous year: € 186 million).
Operating consolidated net income of € 78 million remained after tax (previous year: € 141 million). Operating earnings per share amounted to € 1.72 (previous year: € 3.13).
Results of operations (IFRS) from continuing operationsDue to the classification of Segment FRP as an operation intended for sale, the following values regarding the results of operations are exclusively related to continuing operations.
The Group’s revenues decreased by € 79 million to € 5,082 million (previous year: € 5,161 million) during the reporting period. This development was primarily due to the lower concentrate throughput and the lower average copper price.
The inventory change of € 476 million (previous year: € 238 million) was due in particular to a build-up of copper and precious metal inventories.
Own work capitalized increased by € 2 million in the first half-year, to € 9 million (previous year: € 7 million). The increase is mainly due to activities related to the Future Complex Metallurgy project.
In a manner corresponding to the development for revenues and inventory changes, the cost of materials
increased from € 4,878 million in the previous year to € 5,117 million.
Other operating income increased by € 16 million to € 40 million (previous year: € 24 million). This includes income from the recognition of a receivable in the amount of € 20 million from Wieland-Werke AG from the rejected sale of Segment FRP.
Gross profit amounted to € 490 million (previous year: € 552 million).
In addition to the effects on earnings described in the explanation of the operating results of operations, the change in gross profit was also due to metal price developments. The use of the average cost method leads to metal price valuations that are close to market prices. Metal price volatility therefore has direct effects on changes in inventories/the cost of materials and hence on the IFRS gross profit. The depiction of this volatility in the IFRS gross profit is not relevant to the cash flow and does not reflect Aurubis’ operating performance.
Personnel expenses rose from € 175 million in the previous year to € 182 million due to wage tariff agreement increases and a slightly higher number of employees. We particularly strengthened our personnel resources in order to address certain issues that will grow in importance in the future. These include areas such as research, development, innovation, technology, and the Future Complex Metallurgy project.
At € 61 million, depreciation and amortization of fixed assets was slightly above prior-year level (previous year: € 59 million).
Other operating expenses were nearly unchanged compared to the previous year.
10 Aurubis · Interim Report First 6 Months 2018/19
Earnings before interest and taxes (EBIT) therefore amounted to € 142 million (previous year: € 213 million).
At € 6 million, net interest expense was at prior-year level.
After taking the financial result into account, earnings before taxes were € 136 million (previous year: € 207 million).
Consolidated net income of € 103 million from continuing operations remained after tax (previous year: € 158 million). Earnings per share from continuing operations amounted to € 2.28 (previous year: € 3.49).
Net assets (operating)The table on page 11 shows the derivation of the operating statement of financial position as at March 31, 2019 and as at September 30, 2018.
Total assets increased from € 4,077 million as at September 30, 2018 to € 4,320 million as at March 31, 2019. This was due to the € 550 million increase in inventories, from € 1,549 million as at September 30, 2018 to € 2,099 million as at March 31, 2019. The increase was primarily in intermediate products to prepare for scheduled shutdowns, as well as in finished products. In contrast, cash and cash equivalents decreased significantly by € 450 million in this period, from € 479 million to € 29 million.
The Group’s equity fell by € 34 million, from € 2,261 million as at the end of the last fiscal year to € 2,227 million as at March 31, 2019. The decrease resulted from the dividend payment of € 70 million and the interest rate-related remeasurement of pension obligations amounting to € 40 million. The operating consolidated net income of € 78 million had an opposite effect.
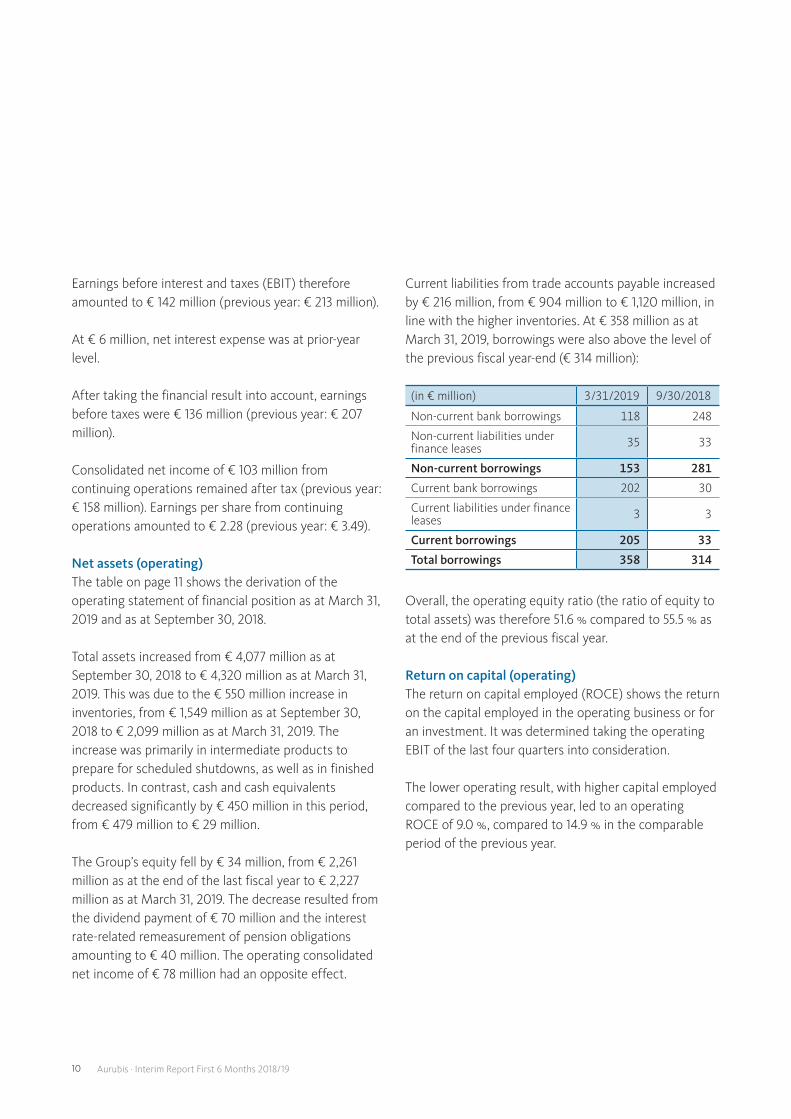
Current liabilities from trade accounts payable increased by € 216 million, from € 904 million to € 1,120 million, in line with the higher inventories. At € 358 million as at March 31, 2019, borrowings were also above the level of the previous fiscal year-end (€ 314 million):
(in € million) 3/31/2019 9/30/2018
Non-current bank borrowings 118 248
Non-current liabilities under finance leases 35 33
Non-current borrowings 153 281
Current bank borrowings 202 30
Current liabilities under finance leases 3 3
Current borrowings 205 33
Total borrowings 358 314
Overall, the operating equity ratio (the ratio of equity to total assets) was therefore 51.6 % compared to 55.5 % as at the end of the previous fiscal year.
Return on capital (operating)The return on capital employed (ROCE) shows the return on the capital employed in the operating business or for an investment. It was determined taking the operating EBIT of the last four quarters into consideration.
The lower operating result, with higher capital employed compared to the previous year, led to an operating ROCE of 9.0 %, compared to 14.9 % in the comparable period of the previous year.

11Aurubis · Interim Report First 6 Months 2018/19
Reconciliation of the consolidated statement of financial position (in € million)
3/31/2019 9/30/2018
IFRS
Adjustment effects
Opera-ting IFRS
Adjustment effects
Opera-ting
Discon-tinued opera-tions
Inven-tories PPA
Discon-tinued opera-tions
Inven-tories PPA
Assets
Fixed assets 1,364 169 -12 -30 1,491 1,354 174 -13 -32 1,483
Deferred tax assets 3 1 36 0 40 3 1 25 0 29 Non-current receivables and other assets
27 2 0 0 29 28 2 0 0 30
Inventories 2,240 305 -446 0 2,099 1,681 274 -406 0 1,549
Current receivables and other assets 504 128 0 0 632 385 122 0 0 507
Cash and cash equivalents 23 6 0 0 29 461 18 0 0 479
Assets held for sale 622 -622 0 0 0 590 -590 0 0 0
Total assets 4,783 -11 -422 -30 4,320 4,502 1 -394 -32 4,077
Equity and liabilities
Equity 2,570 -11 -308 -24 2,227 2,566 1 -281 -25 2,261
Deferred tax liabilities 184 12 -114 -6 76 188 16 -113 -7 84
Non-current provisions 297 32 0 0 329 254 34 0 0 288
Non-current liabilities 154 1 0 0 155 281 1 0 0 282
Current provisions 24 7 0 0 31 34 8 0 0 42
Current liabilities 1,379 123 0 0 1,502 1,017 103 0 0 1,120Liabilities deriving from assets held for sale
175 -175 0 0 0 162 -162 0 0 0
Total equity and liabilities 4,783 -11 -422 -30 4,320 4,502 1 -394 -32 4,077
See page 6 for an explanation of the presentation and the adjustment effects.

12 Aurubis · Interim Report First 6 Months 2018/19
(in € million) 3/31/2019 3/31/2018
Fixed assets excluding financial fixed assets and investments measured using the equity method
1,429 1,371
Inventories 2,099 1,778
Trade accounts receivable 483 503
Other receivables and assets 218 216
- Trade accounts payable -1,120 -996
- Provisions and other liabilities -346 -385
Capital employed as at the period end date 2,763 2,488
Earnings before taxes (EBT) 246 366
Financial result 2 5
Earnings before interest and taxes (EBIT)* 248 371
Return on capital employed (operating ROCE) 9.0% 14.9%
* rolling last 4 quarters
Net assets (IFRS) Due to the classification of Segment FRP as discontinued operations, the following values regarding net assets in the current year are mainly related to the continuing operations in the Group.
Total assets increased from € 4,502 million as at September 30, 2018 to € 4,783 million as at March 31, 2019. This was due to the € 559 million increase in inventories, from € 1,681 million as at September 30, 2018 to € 2,240 million as at March 31, 2019. The increase was primarily in intermediate products to prepare for scheduled shutdowns, as well as in finished products. In contrast, cash and cash equivalents decreased significantly by € 438 million in this period, from € 461 million to € 23 million.
The Group’s equity increased slightly by € 4 million, from € 2,566 million as at the end of the last fiscal year to € 2,570 million as at March 31, 2019. This was largely due to the consolidated net income of € 115 million from continuing and discontinued operations. The dividend
payment of € 70 million and the interest rate-related remeasurement of pension obligations amounting to € 40 million had an opposite effect.
Current liabilities from trade accounts payable increased by € 205 million, from € 837 million to € 1,042 million, in line with the higher inventories. At € 357 million as at March 31, 2019, borrowings were also above the level of the previous fiscal year-end (€ 314 million):
(in € million) 3/31/2019 9/30/2018
Non-current bank borrowings 118 248
Non-current liabilities under finance leases 35 33
Non-current borrowings 153 281
Current bank borrowings 201 30
Current liabilities under finance leases 3 3
Current borrowings 204 33
Total borrowings 357 314
Overall, the equity ratio was 53.7 % on March 31, 2019, compared to 57.0 % as at the end of the previous fiscal year.
Return on capital (IFRS)The operating result is used for control purposes within the Group. The operating ROCE is explained in the section “Return on capital (operating).”
Financial position and capital expenditureThe following comments include both continuing and discontinued operations.
At € -334 million as at March 31, 2019, the net cash flow was below the prior-year level (€ -232 million). This was due in particular to the considerable increase in intermediate products to prepare for scheduled shutdowns, as well as in finished products, as at the balance sheet date.

13Aurubis · Interim Report First 6 Months 2018/19
The cash outflow from investing activities totaled € 80 million (previous year: € 50 million). The higher investments in fixed assets in the fiscal year include higher payments for the Future Complex Metallurgy project and for the construction of a new Innovation and Training Center at the Hamburg site. Furthermore, the sale of investment property had a positive effect of about € 8 million on the cash flow from investment activities in the previous year.
After deducting the cash outflow from investing activities of € 80 million and dividend and interest payments of € 77 million from the net cash flow of € -334 million, the free cash flow amounts to € -491 million (previous year: € -354 million).
Cash and cash equivalents of € 29 million from continuing and discontinued operations were available to the Group as at March 31, 2019 (€ 479 million as at September 30, 2018).

14 Aurubis · Interim Report First 6 Months 2018/19
Segment Metal Refining & ProcessingSegment Metal Refining & Processing (MRP) processes complex metal concentrates, copper scrap, and metal-bearing recycling materials into metals of the highest quality. Among other items, copper cathodes are manufactured at the Hamburg (Germany), Pirdop (Bulgaria), Olen (Belgium), and Lünen (Germany) sites; these cathodes are processed further into rod and shapes at the Hamburg (Germany), Olen (Belgium), Emmerich (Germany), and Avellino (Italy) sites. The segment commands a broad product portfolio, which
results from the processing and optimal utilization of concentrates and recycling raw materials that have complex qualities. In addition to high-purity copper, this portfolio includes (among other metals) gold, silver, lead, nickel, tin, minor metals, and platinum group metals, as well as a number of other products such as sulfuric acid and iron silicate.
Segment MRP generated revenues of € 5,072 million during the reporting period (previous year: € 5,155 million). This decrease in revenues is primarily due to the lower concentrate throughput and the lower average copper price.
Segment Metal Refining & ProcessingQ2 6M
2018/19 2017/18 Change 2018/19 2017/18 Change
Revenues €m 2,736 2,562 7 % 5,072 5,155 -2 %Operating EBIT €m 55 110 -50 % 114 205 -44 %Operating EBT €m 54 109 -50 % 112 202 -45 %Operating ROCE (rolling EBIT for the last 4 quarters) % - - - 11.6 19.3 -
Capital employed €m - - - 2,310 2,052 13 %
Concentrate throughput 1,000 t 589 641 -8 % 1,181 1,295 -9 %
Hamburg 1,000 t 281 291 -3 % 550 588 -6 %Pirdop 1,000 t 308 350 -12 % 631 707 -11 %
Copper scrap/blister copper input 1,000 t 118 97 22 % 226 196 15 %
KRS throughput 1,000 t 60 58 3 % 118 138 -14 %
Sulfuric acid output 1,000 t 580 618 -6 % 1,120 1,251 -10 %
Hamburg 1,000 t 273 268 -2 % 513 541 -5 %
Pirdop 1,000 t 307 350 -12 % 607 710 -15 %
Cathode output 1,000 t 276 291 -5 % 551 586 -6 %
Hamburg 1,000 t 91 101 -10 % 181 203 -11 %
Lünen 1,000 t 45 49 -8 % 91 99 -8 %
Olen 1,000 t 85 85 0 % 169 171 -1 %
Pirdop 1,000 t 55 56 -2 % 110 113 -3 %
Rod output 1,000 t 229 209 10 % 407 390 4 %
Shapes output 1,000 t 51 55 -7 % 96 99 -3 %
Copper price (average) US$/t 6,215 6,961 -11 % 6,193 6,884 -10 %
€/t 5,473 5,664 -3 % 5,440 5,723 -5 %
Gold (average) US$/kg 41,924 42,761 -2 % 40,686 41,898 -3 %
€/kg 36,914 34,789 6 % 35,738 34,822 3 %
Silver (average) US$/kg 501 539 -7 % 484 539 -10 %€/kg 441 439 0 % 425 448 -5 %

15Aurubis · Interim Report First 6 Months 2018/19
Operating EBT for Segment MRP amounted to € 112 million during the reporting period, down significantly on the very good previous year (€ 202 million). A considerably lower concentrate throughput with lower treatment and refining charges for copper concentrates strained operating earnings. In particular, unplanned shutdowns in Q1 2018/19 at our Hamburg, Pirdop, and Lünen sites led to a negative effect of approximately € 25 million on earnings. Significantly lower refining charges for copper scrap compared to the previous year, coupled with a good supply, also weighed on the result, as did higher energy costs. Sulfuric acid revenues rose due to considerably higher sales prices, despite lower output volumes resulting from the shutdowns. Other positive factors included robust sales of copper rod and shapes products at a high level, and contributions from our efficiency improvement program.
Operating ROCE (taking the operating EBIT of the last four quarters into consideration) declined to 11.6 % (previous year: 19.3 %), mainly due to lower contributions to earnings and a build-up of inventories to prepare for scheduled maintenance shutdowns.
Raw materialsThere was a good supply of copper concentrates in the first six months of FY 2018/19. In Q2 as well, high output from mines came up against isolated, in some cases unplanned, smelter shutdowns. The copper price level served as an incentive for the mining industry to fully utilize its production capacity. Aurubis also benefited and was able to fully supply its production facilities with copper concentrates at all times.
A benchmark for the treatment and refining charge (TC/RC) for processing standard copper concentrates was established for 2019 at US$ 80.8/t and 8.08 cents/lb. Furthermore, the China Smelter Purchase Team (CSPT) set a buying floor of US$ 73/t and 7.3 cents/lb for Q2 2019, according to the news agency Reuters. This level is
below the current benchmark and the buying floor for Q1 2019 (US$ 92/t and 9.2 cents/lb). The decline indicates that the CSPT anticipates a tighter concentrate market in light of the announced build-up of Chinese smelter capacities this year. Because of our long-term supply strategy, however, our dependency on the spot market is marginal.
Following a good copper scrap supply in Europe and the US in the first three months of FY 2018/19, the market continued to reflect a favorable development in Q2 of the fiscal year, recording a sufficient supply. This was positively influenced by higher metal prices, generally stable ongoing economic conditions, and the existing restrictions on imports from the US to China. In March, refining charges for copper scrap in Europe continued to rise. Aurubis utilized the good market situation and was able to fully supply its production facilities with copper scrap during the reporting period.
The availability of complex recycling materials, including industrial residues and electrical and electronic scrap, remained stable despite intense competition for these materials. The current import restrictions in China positively influence the availability of complex recycling materials.
ProductionAfter unplanned shutdowns at our Hamburg and Pirdop sites led to a significantly lower throughput in Q1 2018/19, concentrate throughput in Q2 was also lower than the strong prior-year quarter due to smaller maintenance measures. Accordingly, concentrate throughput in the first half of FY 2018/19 was 1,181,000 t (previous year: 1,295,000 t).
Sulfuric acid output was significantly down on the prior-year level as a result of the lower concentrate throughput.

16 Aurubis · Interim Report First 6 Months 2018/19
The KRS throughput at the Lünen site was negatively influenced in the first half-year following an unplanned shutdown in Q1 2018/19. We carried out a scheduled maintenance shutdown in the KRS in mid-March 2019, as we did in the previous year.
At 407,000 t in the first half of 2018/19, rod output was slightly above the very good prior-year level (390,000 t).
Cathode output in Q2 2018/19 under previous year due to input materials
Aurubis Group cathode output (in 1,000 t)
288 294 293 296 291 290 285 274 276
Q216/17
Q316/17
Q416/17
Q117/18
Q217/18
Q317/18
Q417/18
Q118/19
Q218/19
Copper rod output considerably above very good prior-year quarter
Rod output (in 1,000 t)
192 186 178 181209 205
179 178
229
Q216/17
Q316/17
Q416/17
Q117/18
Q217/18
Q317/18
Q417/18
Q118/19
Q218/19
Shapes output below previous year with stable demand
Shapes output (in 1,000 t)
51 5245 44
55 5245 45
51
Q216/17
Q316/17
Q416/17
Q117/18
Q217/18
Q317/18
Q417/18
Q118/19
Q218/19
Concentrate throughput in Q2 2018/19 significantly below prior-year quarter
Aurubis Group concentrate throughput (in 1,000 t)
626 634 620 654 641 618 609 592 589
Q216/17
Q316/17
Q416/17
Q117/18
Q217/18
Q317/18
Q417/18
Q118/19
Q218/19
17Aurubis · Interim Report First 6 Months 2018/19
Product marketsFollowing robust demand for copper rod in Q1 2018/19, the level weakened slightly in Q2. Overall, our key European markets showed continued stable demand in the first six months of 2018/19.
Demand for high-purity shapes also remained stable during the reporting period, though it cooled slightly toward the end of Q2 in light of the general economic trend. A central reason for this is the restrained demand from the automotive sector.
The cathode market continued to record good demand in the first six months of 2018/19. While spot premiums in Europe were stable, the quotation in Shanghai was substantially lower than the very high level the research firm CRU reported for fall 2018. At US$ 96/t, the Aurubis copper premium for calendar year 2019 is US$ 10/t higher than the previous year. We were generally able to implement this premium for our products in the first half of 2018/19.
Demand on the global market for sulfuric acid was consistently high in the first half of 2018/19. The supply of sulfuric acid was limited, a situation that was reinforced by isolated smelter shutdowns, especially in South America and Asia. This led to a high price level on the spot market during the reporting period. The market situation in Europe remained very stable.
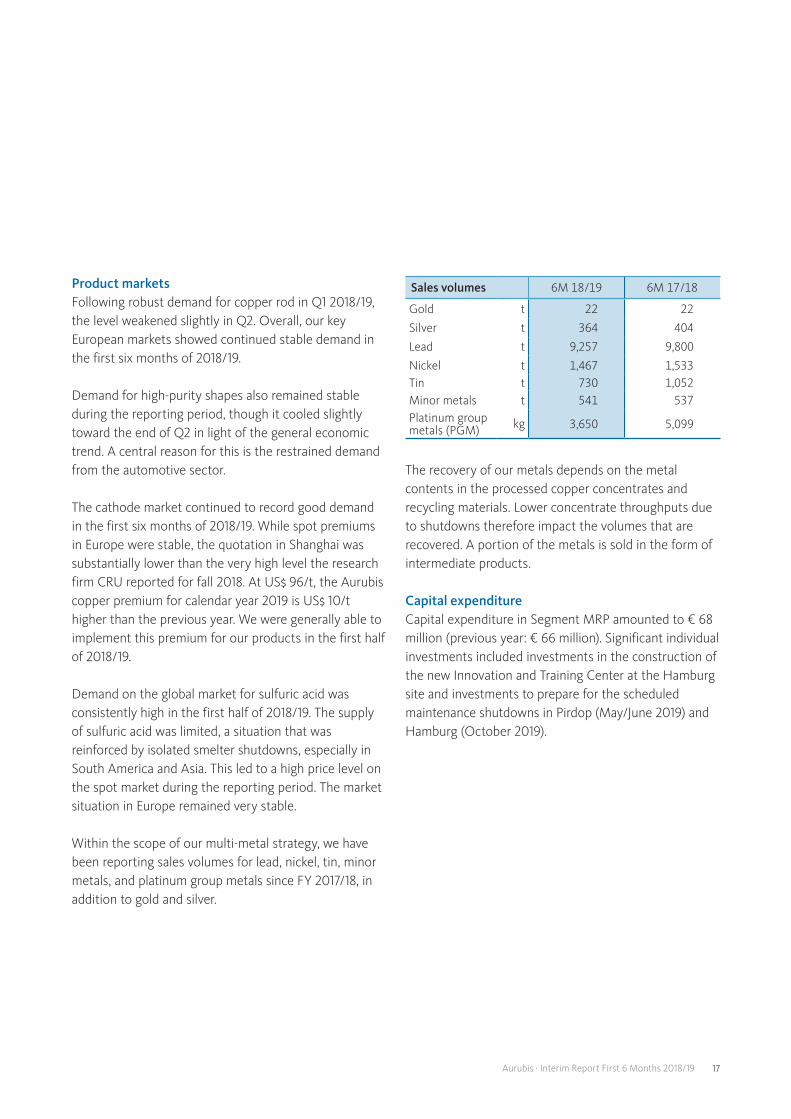
Within the scope of our multi-metal strategy, we have been reporting sales volumes for lead, nickel, tin, minor metals, and platinum group metals since FY 2017/18, in addition to gold and silver.
Sales volumes 6M 18/19 6M 17/18
Gold t 22 22
Silver t 364 404
Lead t 9,257 9,800
Nickel t 1,467 1,533Tin t 730 1,052Minor metals t 541 537Platinum group metals (PGM) kg 3,650 5,099
The recovery of our metals depends on the metal contents in the processed copper concentrates and recycling materials. Lower concentrate throughputs due to shutdowns therefore impact the volumes that are recovered. A portion of the metals is sold in the form of intermediate products.
Capital expenditureCapital expenditure in Segment MRP amounted to € 68 million (previous year: € 66 million). Significant individual investments included investments in the construction of the new Innovation and Training Center at the Hamburg site and investments to prepare for the scheduled maintenance shutdowns in Pirdop (May/June 2019) and Hamburg (October 2019).

18 Aurubis · Interim Report First 6 Months 2018/19
Segment Flat Rolled Products
In Segment Flat Rolled Products (FRP), copper and copper alloys – primarily brass, bronze, and high-performance alloys – are processed into flat rolled products and specialty wire. The main production sites are Stolberg (Germany), Pori (Finland), Zutphen (Netherlands), and Buffalo (USA). Furthermore, the segment also includes slitting and service centers in Birmingham (UK), Dolný Kubín (Slovakia), and Mortara (Italy), as well as sales offices worldwide.
At € 666 million, the segment’s revenues in the first half of 2018/19 were below the prior-year level (€ 710 million). The reason for the lower revenues was a reduced sales volume in particular.
Segment FRP generated operating earnings before taxes (EBT) of € -3 million in the first half of the reporting year (previous year: € 4 million). The considerably lower result compared to the previous year is mainly due to a lower sales volume and less favorable conditions on the buying market.
Operating ROCE (taking the operating EBIT of the last four quarters into consideration) was 3.2 % (previous year: 3.7 %).
Following the European Commission’s veto of the transaction to sell Segment FRP to Wieland-Werke AG on February 6, 2019, Aurubis is now reviewing other strategic options for Segment FRP.
Product marketsThe European market for flat rolled products cooled off significantly during the reporting period in light of
weakening economic conditions. Demand for connectors from the European automotive industry was impacted in particular. Individual sales segments in the US market also lagged behind expectations.
Raw materialsThe availability of input materials was good in the first half of 2018/19. Nevertheless, conditions weakened compared to the very good previous year.
ProductionOutput of flat rolled products and specialty wire decreased to 110,000 t due to demand (previous year: 116,000 t). All of the sites continued to work on implementing the programs to improve efficiency and to enhance productivity and quality.
Capital expenditureCapital expenditure in Segment FRP amounted to € 6 million (previous year: € 11 million). This was primarily used for replacement investments.
Flat rolled products and specialty wire output in Q2 2018/19 significantly below previous year due to demand
Flat rolled products and specialty wire output(in 1,000 t)
57 61 59 5561 62
57 53 57
Q216/17
Q316/17
Q416/17
Q117/18
Q217/18
Q317/18
Q417/18
Q118/19
Q218/19
Segment Flat Rolled ProductsQ2 6M
2018/19 2017/18 Change 2018/19 2017/18 Change
Revenues €m 349 384 -9 % 666 710 -6 %Operating EBIT €m -1 9 >-100 % -2 4 >-100 %Operating EBT €m -1 11 >-100 % -3 4 >-100 %Operating ROCE (rolling EBIT for the last 4 quarters) % - - - 3.2 3.7 -
Capital employed €m - - - 375 393 -5%Flat rolled products and specialty wire output 1,000 t 57 61 -7 % 110 116 -5 %

19Aurubis · Interim Report First 6 Months 2018/19
Corporate Governance
On February 6, 2019, the European Commission prohibited the sale of Segment FRP from Aurubis AG to Wieland-Werke AG. Aurubis AG subsequently stated that it would now be reviewing other strategic options for Segment FRP.
The shareholders participating in Aurubis AG’s Annual General Meeting on February 28, 2019 passed a resolu-tion on the dividend of € 1.55 per share recommended by the Executive Board and the Supervisory Board for FY 2017/18. The shareholders at Aurubis AG’s Annual General Meeting also elected Andrea Bauer to the Supervisory Board as a shareholder representative.
The shareholders appointed Deloitte GmbH Wirtschaftsprüfungsgesellschaft, Hamburg, as auditor and group auditor for FY 2018/19.
On April 16, 2019, the Aurubis AG Supervisory Board passed a resolution at an extraordinary meeting to already appoint Roland Harings to the Executive Board to serve as Deputy Executive Board Chairman effective May 20, 2019.
On April 26, 2019, Aurubis AG published that, according to estimates, it had generated operating EBT of € 63 million in Q2 2018/19 and reduced the forecast for the entire fiscal year. According to current estimates, Aurubis AG expects operating EBT to be significantly below the previous year, meaning a decrease of more than 15 % (operating EBT in 2017/18: € 329 million).
Employee representatives on the Supervisory Board Renate Hold-Yilmaz and Ralf Winterfeldt stepped down from their offices in late April. Subsequently, the Hamburg District Court’s Registration Office appointed Deniz Filiz Acar to replace Renate Hold-Yilmaz and Christian Ehrentraut to replace Ralf Winterfeldt as new Supervisory Board members.
Please also refer to the information published in the Annual Report 2017/18 and in the Quarterly Report First 3 Months 2018/19.
Risk and Opportunity ManagementOverall, the Aurubis Group’s raw material supply was good in the first half of FY 2018/19. We do not expect any significant changes on the copper concentrate markets and assume that the situation on the copper scrap market will remain generally stable this quarter.
We are closely following the current discussion regarding customs duties and trade restrictions, both on the purchasing and sales side.
The liquidity supply was secured. We covered trade accounts receivable through trade credit insurance to the greatest extent possible. No significant bad debts were recorded during the reporting period.
We limited risks deriving from the fluctuating euro/US dollar exchange rate by means of appropriate currency rate hedging transactions. We countered the influences deriving from fluctuating metal prices by deploying suitable metal price hedging transactions.
Please refer to the Annual Report 2017/18 for additional information.

20 Aurubis · Interim Report First 6 Months 2018/19
Outlook
Raw material marketsWe expect a good copper concentrate supply and satisfactory treatment and refining charges until the end of the fiscal year.
We expect the positive trend on the copper scrap market to continue. Our facilities are fully supplied at good conditions in Q3 2018/19. Nevertheless, downward metal price trends could lead to a reduction in the copper scrap supply and thus to lower refining charges.
Product marketsCopper productsFor the next few months, we expect a slightly weaker trend for copper rod due to lower demand from cable producers.
We expect robust demand for copper shapes, supported by higher demand from the industrial tube sector and for lower-oxygen and higher-alloyed materials. We expect significantly weaker demand from the flat rolled products sector.
Since fall 2018, demand for flat rolled products has decreased, particularly in the European automotive sector. This will likely continue in the second half of the fiscal year. Overall, for FY 2018/19, we expect the demand and sales situation to be significantly below the very good previous year.
Sulfuric acidSulfuric acid sales are dependent on short-term developments, making them difficult to forecast. The current insights for Q3 2018/19 signalize a stable situation with prices at a high level.
Copper productionBecause of scheduled and unscheduled shutdowns, we expect plant availability to be lower and thus the volume
of copper concentrates processed during the current fiscal year to be significantly lower than the previous year. Cathode output is also expected to be lower than prior-year output.
The following maintenance shutdowns are planned for the fiscal year.
In May and June 2019, we will carry out a 22-day legally mandatory maintenance shutdown at our site in Pirdop (Bulgaria). According to our current plans, this will have a roughly € 15 million impact on our operating EBT.
At our Lünen site, we will carry out a scheduled maintenance shutdown lasting 25 days in September 2019. According to our current plans, the shutdown will have a roughly € 3 million impact on our operating EBT.
Expected earningsThe quarterly results are subject to fluctuations. In addition to seasonal factors, both planned and unplanned shutdowns also play a role.
Despite the slightly reduced 2019 benchmark, we expect satisfactory treatment and refining charges for concentrates at Aurubis until the end of the fiscal year. With good ongoing output levels at mines, we will continue to be able to procure a sufficient supply of copper concentrates. Due to our core expertise in processing complex concentrates, we will achieve TC/RCs above the benchmark. Independently of the prices on the spot market, which are currently declining, we have already been able to secure a considerable part of the required copper concentrate volumes through long-term contracts.
For copper scrap, we also anticipate a satisfactory supply with a continued good level of refining charges in the next few months.

21Aurubis · Interim Report First 6 Months 2018/19
Aurubis set the copper premium at US$ 96/t for calendar year 2019 (previous year: US$ 86/t). For the most part, we expect to be able to implement this premium for our products.
We expect lower demand for copper rod for the entire year compared to the previous year due to weaker economic conditions. For copper shapes, we expect robust sales at the good prior-year level.
We anticipate a significantly weaker demand situation for flat rolled products for the fiscal year.
We count on a positive trend for sulfuric acid revenues compared to the previous year, which was already very good.
A significant portion of our revenues is based on the US dollar. We reduce the resulting risks with our hedging strategy.
We expect an additional € 60 million in project success from the efficiency improvement program this fiscal year compared to the base year 2014/15. Aurubis will continue optimizing all areas of the company with the efficiency improvement program.
Overall, we expect significantly lower operating EBT and a significantly lower operating ROCE for the Aurubis Group in fiscal year 2018/19 compared to the previous year.
In Segment Metal Refining & Processing, we expect significantly lower operating EBT and a significantly lower operating ROCE in fiscal year 2018/19 compared to the previous year.
In Segment Flat Rolled Products, we anticipate significantly lower operating EBT and a slightly lower operating ROCE in fiscal year 2018/19 compared to the previous year.
Qualified comparative forecast according to Aurubis’ definition for operating ROCE
ROCE deltaas a percentage
At prior-year level ± 0 to 1.0
Slight ± 1.1 to 4.0
Significant > ± 4.0
Change in operating EBT
At prior-year level ± 0 to 5.0 %
Moderate ± 5.1 to 15.0 %
Significant > ± 15.0 %
Qualified comparative forecast according to Aurubis’ definition for operating EBT
22 Aurubis · Interim Report First 6 Months 2018/19
Interim Consolidated Financial Statements First 6 Months 2018/19
Consolidated Income Statement(IFRS, in € thousand)
6M 2018/19 6M 2017/18
Revenues 5,081,975 5,160,609
Changes in inventories of finished goods and work in process 476,373 238,178
Own work capitalized 8,447 6,754
Other operating income 40,251 23,971
Cost of materials -5,117,541 -4,877,449
Gross profit 489,505 552,063
Personnel expenses -181,593 -175,485
Depreciation of property, plant, and equipment and amortization of intangible assets -61,487 -59,142
Other operating expenses -104,688 -104,559
Operational result (EBIT) 141,737 212,877
Interest income 1,771 1,403
Interest expense -7,230 -7,778
Other financial income 1 3
Other financial expenses 0 -12
Earnings before taxes (EBT) 136,279 206,493
Income taxes -33,730 -48,952
Consolidated net income from continuing operations 102,549 157,541
Consolidated net income from discontinued operations 12,440 20,514
Consolidated net income 114,989 178,055
Consolidated net income attributable to Aurubis AG shareholders 114,910 177,403
Consolidated net income attributable to non-controlling interests 79 652
Basic earnings per share (in €)
From continuing operations 2.28 3.49
From discontinued operations 0.28 0.46
Diluted earnings per share (in €)
From continuing operations 2.28 3.49
From discontinued operations 0.28 0.46
23Aurubis · Interim Report First 6 Months 2018/19
Consolidated Statement of Comprehensive Income(IFRS, in € thousand)
6M 2018/19 6M 2017/18
Consolidated net income 114,989 178,055
Items that will be reclassified to profit or loss in the future
Measurement at market of cash flow hedges -4,131 854
Changes deriving from translation of foreign currencies 421 -1,802
Income taxes 1,017 270
Share of other comprehensive income attributable to discontinued operations 1,241 -1,142
Items that will not be reclassified to profit or loss
Measurement at market of financial investments -12,609 2,307
Remeasurement of the net liability deriving from defined benefit obligations -39,991 -7,980
Income taxes 12,963 2,588
Other comprehensive income/loss -41,089 -4,905
Consolidated total comprehensive income 73,900 173,150
Consolidated total comprehensive income attributable to Aurubis AG shareholders 73,821 172,498
Consolidated total comprehensive income attributable to non-controlling interests 79 652

24 Aurubis · Interim Report First 6 Months 2018/19
Consolidated Statement of Financial Position(IFRS, in € thousand)
ASSETS 3/31/2019 9/30/2018
Intangible assets 123,275 123,049
Property, plant, and equipment 1,218,908 1,198,042
Financial fixed assets 21,641 32,929
Deferred tax assets 2,754 2,742
Non-current financial assets 26,141 27,930
Other non-current non-financial assets 634 764
Non-current assets 1,393,353 1,385,456
Inventories 2,240,062 1,680,698
Trade accounts receivable 380,561 274,501
Other current financial assets 72,464 71,419
Other current non-financial assets 51,305 39,850
Cash and cash equivalents 22,748 461,045
Assets held for sale 622,366 589,500
Current assets 3,389,506 3,117,013
Total assets 4,782,859 4,502,469

25Aurubis · Interim Report First 6 Months 2018/19
Consolidated Statement of Financial Position(IFRS, in € thousand)
EQUITY AND LIABILITIES 3/31/2019 9/30/2018
Subscribed capital 115,089 115,089
Additional paid-in capital 343,032 343,032
Generated Group equity 2,133,778 2,090,677
Accumulated other comprehensive income components -22,075 16,974
Equity attributable to shareholders of Aurubis AG 2,569,824 2,565,772
Non-controlling interests 635 556
Equity 2,570,459 2,566,328
Pension provisions and similar obligations 241,630 199,006
Other non-current provisions 55,226 55,575
Deferred tax liabilities 184,413 187,768
Non-current borrowings 152,684 280,864
Other non-current financial liabilities 900 68
Non-current liabilities 634,853 723,281
Current provisions 24,027 33,776
Trade accounts payable 1,041,847 836,748
Income tax liabilities 7,364 9,662
Current borrowings 203,243 32,812
Other current financial liabilities 104,819 113,950
Other current non-financial liabilities 21,111 23,840
Liabilities deriving from assets held for sale 175,136 162,072
Current liabilities 1,577,547 1,212,860
Total equity and liabilities 4,782,859 4,502,469

26 Aurubis · Interim Report First 6 Months 2018/19
Consolidated Cash Flow Statement(IFRS, in € thousand)
6M 2018/19 6M 2017/18
Earnings before taxes 152,812 233,381Depreciation and amortization of fixed assets 61,487 65,060Change in allowances on receivables and other assets 74 198Change in non-current provisions -1,373 2,010Net losses on disposal of fixed assets 52 194Measurement of derivatives 14,053 8,435Other non-cash items 2,097 2,936Expenses and income from the financial result -818 3,055Income taxes received/paid -32,635 -42,343Gross cash flow 195,749 272,926Change in receivables and other assets -144,426 -143,199Change in inventories (including measurement effects) -587,405 -444,268Change in current provisions -10,927 -7,783Change in liabilities (excluding financial liabilities) 213,288 90,343Cash outflow from operating activities (net cash flow) -333,721 -231,981Payments for investments in fixed assets -89,918 -66,569Proceeds from the disposal of fixed assets 776 612Proceeds from the sale of investment property 0 7,842Proceeds from the redemption of loans granted to third parties 0 6,529Interest received 1,789 1,424Dividends received 7,674 0Cash outflow from investing activities -79,679 -50,162Proceeds deriving from the take-up of financial liabilities 68,154 11,562Payments for the redemption of bonds and financial liabilities -28,630 -77,600Interest paid -6,515 -5,861Dividends paid -69,683 -66,275Cash outflow from financing activities -36,674 -138,174Net change in cash and cash equivalents -450,074 -420,317Changes resulting from movements in exchange rates 88 -151Cash and cash equivalents at beginning of period 479,223 570,569Cash and cash equivalents at end of period 29,237 150,101Less cash and cash equivalents from discontinued operations at end of period 6,489 17,663Cash and cash equivalents from continuing operations at end of period 22,748 132,438

27Aurubis · Interim Report First 6 Months 2018/19
Con
solid
ated
Sta
tem
ent o
f Cha
nges
in E
quit
y(IF
RS, i
n €
thou
sand
)
Acc
umul
ated
oth
er c
ompr
ehen
sive
inco
me
com
pone
nts
Subs
crib
ed
capi
tal
Add
ition
al
paid
-in
capi
tal
Gen
erat
ed
Gro
up
equi
ty
Mea
sure
-m
ent a
t m
arke
t of
cash
flow
he
dges
Mea
sure
-m
ent a
t m
arke
t of
finan
cial
in
vest
men
ts
Cur
renc
y tr
ansl
atio
n di
ffere
nces
Inco
me
taxe
s
Equi
ty
attr
ibut
able
to
Aur
ubis
AG
sha
re-
hold
ers
Non
-co
ntro
lling
in
tere
sts
Tota
l equ
ity
Bala
nce
as a
t 9/
30/2
017
115,
089
343,
032
1,87
0,57
319
,744
11,8
208,
745
-6,3
542,
362,
649
3,09
72,
365,
746
Div
iden
d pa
ymen
t0
0-6
5,18
70
00
0-6
5,18
7-1
,088
-66,
275
Con
solid
ated
tota
l co
mpr
ehen
sive
inco
me/
loss
00
172,
011
854
2,30
7-2
,944
270
172,
498
652
173,
150
of w
hich
con
solid
ated
ne
t inc
ome
00
177,
403
00
00
177,
403
652
178,
055
of w
hich
oth
er c
ompr
e-he
nsiv
e in
com
e/lo
ss0
0-5
,392
854
2,30
7-2
,944
270
-4,9
050
-4,9
05
Bala
nce
as a
t 3/
31/2
018
115,
089
343,
032
1,97
7,39
720
,598
14,1
275,
801
-6,0
842,
469,
960
2,66
12,
472,
621
Bala
nce
as a
t 9/
30/2
018
115,
089
343,
032
2,09
0,67
7-7
,051
15,2
309,
042
-247
2,56
5,77
255
62,
566,
328
Cha
nge
in a
ccou
ntin
g m
etho
ds0
024
,525
-395
-24,
593
00
-463
0-4
63
Bala
nce
as a
t 10
/1/2
018
115,
089
343,
032
2,11
5,20
2-7
,446
-9,3
639,
042
-247
2,56
5,30
955
62,
565,
865
Div
iden
d pa
ymen
t0
0-6
9,68
30
00
0-6
9,68
30
-69,
683
Acq
uisi
tion
of n
on-
cont
rolli
ng in
tere
sts
00
377
00
00
377
037
7
Con
solid
ated
tota
l co
mpr
ehen
sive
inco
me/
loss
00
87,8
82-4
,131
-12,
609
1,66
21,
017
73,8
2179
73,9
00
of w
hich
con
solid
ated
ne
t inc
ome
00
114,
910
00
00
114,
910
7911
4,98
9
of w
hich
oth
er c
ompr
e-he
nsiv
e in
com
e/lo
ss0
0-2
7,02
8-4
,131
-12,
609
1,66
21,
017
-41,
089
0-4
1,08
9
Bala
nce
as a
t 3/
31/2
019
115,
089
343,
032
2,13
3,77
8-1
1,57
7-2
1,97
210
,704
770
2,56
9,82
463
52,
570,
459

28 Aurubis · Interim Report First 6 Months 2018/19
Selected Notes to the Consolidated Financial StatementsGeneral principlesThis interim group report of Aurubis AG includes interim consolidated financial statements and a group management report in accordance with the regulations of the German Securities Trading Act. The interim consolidated financial statements have been prepared in accordance with International Financial Reporting Standards (IFRS) for interim reporting as applicable in the EU.
The accounting and measurement principles used in the financial statements as at September 30, 2018 have been applied without amendment, with the exception of accounting standards that are to be applied for the first time in the current fiscal year.
The interim consolidated financial statements and the interim group management report for the first six months of FY 2018/19 have not been reviewed by the auditors.
Changes in accounting and measurement methods due to new standards and interpretations Standards and interpretations applied for the first timeThe annual improvements to the IFRS cycle 2014-2016 adopted into European law by the European Union in February 2018 that are applicable for fiscal years starting on or after January 1, 2018 concern a number of small amendments and clarifications to IFRS. They do not affect the Aurubis Group.
The amendments to IFRS 2 (Share-based Payment) and to IFRIC 22 (Foreign Currency Transactions and Advance Consideration) that were adopted into European law by the European Union in February and March 2018 and that are applicable to fiscal years beginning on or after January 1, 2018 have not led to any significant impacts for the Aurubis Group.
IFRS 9 and IFRS 15IFRS 9 (Financial Instruments) and IFRS 15 (Revenue from Contracts with Customers) were applied retrospec tively for the first time on October 1, 2018, without changing the prior-year figures. The effects of the first application of IFRS 9 and IFRS 15 on the revenue reserves and other comprehensive income are presented cumula ti vely in the consolidated statement of changes in equity.
IFRS 9IFRS 9 amends the accounting requirements for the classification and measurement of financial assets, the impairment of financial assets, and for hedge accounting.
The classification and measurement of financial assets are determined based on the structure of the cash flows and the business model in use. In this connection, a financial asset is initially classified as either measured “at amortized cost,” “at fair value through other comprehensive income,” or “at fair value through profit and loss.”
After the assessment of the cash flows, the classification is based on the allocation of financial assets according to the business model. For this purpose, Aurubis determined which of them were held for the purpose of collecting contractual cash and cash equivalents (“held to collect”), which were “held to collect and sell,” and which could not be allocated to any of the two categories (“other”).
At the time of first application, there are changes in the measurement category for interests in affiliated companies and investments that were previously measured at acquisition cost and are now in the FV P&L category.
Furthermore, trade receivables held for sale within the context of factoring arrangements are classified as “held to collect and sell.” These receivables are therefore to be measured at market value (FV OCI).

29Aurubis · Interim Report First 6 Months 2018/19
Reconciliation of classification and measurement categories of financial instruments as at October 1, 2018 (in € thousand)
Category under IAS
39Measurement under IAS 39
Measurement category
under IFRS 9
Carrying amount
pursuant to IAS 39 as at 9/30/2018
Carrying amount
pursuant to IAS 9 as at 10/1/2018
Assets
Interests in affiliated companies AfS AC FV P&L 1,321 1,321
Investments AfS AC FV P&L 115 115
Fixed asset securities AfS FV OCI FV OCI 31,448 31,448
Other financial fixed assets
Other loans LaR AC AC 45 45
Trade accounts receivable LaR AC AC, FV OCI 274,501 274,401
Other receivables and financial assets
Receivables from related parties LaR AC AC 2,096 2,096
Other financial assets LaR, n/a AC AC, FV P&L, n/a 39,851 39,681
Derivative financial assets
Derivatives without a hedging relationship FAHfT FV P&L FV P&L 55,257 55,257Derivatives with a hedging relationship (hedge accounting) n/a FV OCI n/a 2,145 2,145
Cash and cash equivalents LaR AC AC 461,045 461,045
Liabilities
Bank borrowings FLAC AC AC 277,307 277,307
Liabilities under finance leases n/a n/a n/a 36,369 36,369
Trade accounts payable FLAC AC AC 836,748 836,748
Liabilities to related parties FLAC AC AC 1,136 1,136
Other non-derivative financial liabilities FLAC, n/a AC AC, n/a 76,638 76,638
Derivative financial liabilities
Derivatives without a hedging relationship FLHfT FV P&L FV P&L 27,179 27,179Derivatives with a hedging relationship (hedge accounting) n/a FV OCI n/a 9,065 9,065
Aurubis classifies equity instruments that are not classified as “held for trading” as “fair value through OCI” (FV OCI). The use of the option to measure investment securities at fair value through other comprehensive income (FV OCI) led to a corresponding increase of € 24.6 million in revenue reserves at the time of transition.
The impacts on the classification and measurement of financial assets at the time of first application are shown in the following table:

30 Aurubis · Interim Report First 6 Months 2018/19
For the classification of financial liabilities, there were no impacts under IFRS 9 compared to IAS 39.
The determination of any impairment and the creation of risk provisions changes from an incurred loss model to an expected credit loss model. The expected credit loss model is also applicable to all financial instruments that are either measured at amortized cost, such as bank balances, loans receivable, and other receivables, or at fair value through OCI. In this context, a risk provision is established for the entire term of the financial instrument at the time it is acquired. The general approach stipulates a three-stage process for determining risk provisions. Depending on the counterparty’s credit default risk, the model requires different levels of impairment assessment at these various stages. A simplified approach for the recognition of impairment losses is applied for trade receivables. In this approach, the expected credit losses are calculated using a so-called cohort model, which is based on the data of the past three fiscal years. Actual historical bad debt losses are applied to the outstanding receivables, taking into account forward-looking information.
For other financial assets, the expected credit loss is primarily determined at the time of their acquisition on the basis of credit default swaps for which losses are calculated that are expected from defaults in the next 12 months. In the case of a significant increase in the default risk, the credit losses expected over the asset’s respective term are considered.
The introduction of the expected credit loss model within the scope of IFRS 9 reduced trade accounts receivable and other financial assets by € 0.3 million at the time of transition.
The designation option for risk components in non-financial underlying transactions is regulated within the scope of hedge accounting. In addition, IFRS 9 eliminates
the quantitative limits for the effectiveness test. The requirements for documentation and disclosure are broadened.
Furthermore, there is an option to remove certain derivative components, such as the fair values of options, from the designation as being in a hedging relationship and to segregate the changes in fair values of these components by recognizing them directly in equity.
For hedge accounting, Aurubis is applying the requirements of IFRS 9 prospectively starting October 1, 2018. This does not apply to the requirement to delineate changes in the FV OCI of non-designated fair value components of options. The resulting conversion effect was € 0.4 million.
IFRS 15IFRS 15 regulates the point in time and amount at which revenues from customer contracts are to be recognized and the extent of the required disclosures in the notes to the financial statements. The new standard does not differentiate between different types of contracts and activities performed, but establishes uniform criteria for when a performance obligation is to be recognized as revenue. Accordingly, revenue is recognized when the customer obtains control of the agreed goods and services and can derive benefit from them. Revenues are measured at the amount of consideration expected to be received by the company. In this context, the determination of revenues is based on a five-stage model that must be applied to all contracts with customers.
At Aurubis, the change in accounting under IFRS 15 mainly affects the point in time at which revenue is recognized, this being dependent on the point in time when the authority to dispose of the goods or services is transferred. Revenues are generally recognized by

31Aurubis · Interim Report First 6 Months 2018/19
Aurubis at the time they are generated, as the performance obligations entered into primarily relate to the transfer of goods. The point in time of recognition is later in some cases under the new standard.
The transition to IFRS 15 took place retrospectively without a change in prior-year figures as at October 1, 2018. The conversion effects were therefore cumulatively recognized in the revenue reserves at the time of first application. Aurubis only applies IFRS 15 retrospectively to contracts that haven’t been fulfilled yet at the time of first application.
At the time of the transition, this resulted in a € 6.1 million decrease in trade accounts receivable and a € 5.8 million increase in inventories. After taking deferred taxes of € 0.2 million into account, the adjustments carried out on October 1, 2018 resulted in total in an € 0.5 million decrease in Group equity with no effect on profit or loss.
As at March 31, 2019, the application of IFRS 15 leads to a decrease in trade accounts receivable and an increase in inventories, both in the single-digit millions, compared to the requirements of IAS 18 that applied prior to the amendment.
Standards and interpretations not adopted early IFRS 16This standard regulates the accounting treatment for leases. IFRS 16 replaces the previously applicable IAS 17, as well as three leasing-related interpretations. The application of IFRS 16 is compulsory for all companies using IFRS and is generally valid for all leasing arrangements. IFRS 16 provides for a single accounting model for the lessee. Accordingly, right-of-use assets and liabilities deriving from leasing agreements must be recognized in the lessee’s statement of financial position except for those with a term of 12 months (or less) or
those that can be classified as low-value assets (optional).
For the lessor, the accounting model prescribed by IFRS 16 does not differ materially from the requirements of IAS 17. For accounting purposes, a distinction must still be made here between finance and operating leases.
Aurubis will first apply IFRS 16 in the fiscal year commencing October 1, 2019. For purposes of the transition to IFRS 16, we currently expect to apply the modified retrospective method. When IFRS 16 is first applied, the cumulative effect will be recognized in generated equity as a one-time adjustment in the opening balance sheet.
The modified retrospective method provides a number of other practical features to ease the transition in the accounting of existing leases. For example, the right-of-use assets can be recognized in the same amount as the lease liabilities or at the value that would result if the standard had always been applied.
Aurubis will utilize the exemption options for recognizing short-term leases and leases for which the underlying asset is of low value. Furthermore, at the time of first application, Aurubis will not redetermine whether a contract is a lease or contains a lease.
The impacts of the implementation of IFRS 16 on the Aurubis Group are currently being reviewed in detail. Based on current knowledge, we expect an increase in total assets in the mid-double-digit million range. Minimum lease payments from operating leases will lead to an increase in fixed assets under IFRS 16 due to the recognition of right-of-use assets. Likewise, borrowings will also increase due to the disclosure of the corresponding lease liabilities. In the consolidated statement of comprehensive income, amortization of
32 Aurubis · Interim Report First 6 Months 2018/19
right-of-use-assets and interest expense for borrowings will be disclosed instead of expenses for operating leases, as has been the case up to now. The lower operating expenses will tend to improve the cash inflow from operating activities in the cash flow statement, while the redemption of the lease liability and the interest payments will be reflected in the cash outflow from financing activities. Regarding a change in the key control parameters EBT and ROCE, we also expect only minimal impacts due to the application of IFRS 16.
Discontinued operations and assets held for sale The consolidated result from discontinued operations is reported in the consolidated income statement separately from expenditures and income from continued operations; prior-year figures are shown on a comparable basis. In the consolidated cash flow statement, discontinued operations are included in the cash inflows/outflows from operating, investing, and financing activities; prior-year figures are shown on a comparable basis. Furthermore, assets and debts held for sale are reported on in the consolidated statement of financial position in aggregated form.
Internal Group expenses and income are fully eliminated in the process of determining the consolidated result for both continuing and discontinued operations. The internal Group transactions are eliminated from an economic perspective, i.e., taking the Aurubis Group’s future trading relationships into account. The Group will maintain existing supply relationships with the discontinued business division after a possible sale of Segment FRP. Revenues of Aurubis AG and its subsidiaries deriving from deliveries to the discontinued business division were therefore fully eliminated there.
Consolidated net income from discontinued operations
(in € million) 6M 2018/19
6M 2017/18
Revenues 578 609
Changes in inventories of finished goods and work in process
21 30
Expenses -583 -612
Earnings before taxes (EBT) 16 27
Income taxes -4 -6
Consolidated net income from discontinued operations 12 21
Consolidated net income attributable to Aurubis AG shareholders from discontinued operations
12 21

33Aurubis · Interim Report First 6 Months 2018/19
Carrying amounts of the main groups of assets held for sale and related liabilities
ASSETS (in € million) 3/31/2019 9/30/2018
Fixed assets 180 173
Deferred tax assets 1 1
Non-current receivables and other assets 2 2
Inventories 305 274
Current receivables and other assets 128 122
Cash and cash equivalents 6 18
Assets held for sale 622 590
EQUITY AND LIABILITIES (in € million) 3/31/2019 9/30/2018
Deferred tax liabilities 12 16
Non-current provisions 32 34
Non-current liabilities 1 1
Current provisions 7 8
Current liabilities 123 103
Liabilities deriving from assets held for sale 175 162
Cash flow from discontinued operations
(in € million) 6M 2018/19
6M 2017/18
Cash outflow (inflow in the previous year) from operating activities (net cash flow)
-6 9
Cash outflow from investing activities -6 -10
Cash inflow from financing activities 0 2
Inventories in accordance with IFRSOn March 31, 2019, inventories relating to continuing operations were written down by € 3.2 million (September 30, 2018: € 29.9 million).
DividendA total of € 69,682,920.65 of Aurubis AG’s unappropriated earnings of € 134,828,004.87 in FY 2017/18 was used to pay a dividend of € 1.55 per share. An amount of € 65,145,084.22 was carried forward.
Significant events after the balance sheet date There were no significant events after the balance sheet date.

34 Aurubis · Interim Report First 6 Months 2018/19
Financial instrumentsThe following table categorizes the fair values of all Aurubis financial instruments in the Levels 1 to 3.
The levels indicate whether the fair value is a price that is quoted on an active market and is available to the company, as is the case for Level 1; is based on other observable factors, as is the case for Level 2; or is based on non-observable factors, as is the case for Level 3.
Fixed asset securities and derivatives are shown in Aurubis’ statement of financial position, as also
presented in the table, with their fair values. Bank borrowings are included in Aurubis’ statement of financial position at amortized cost and their fair values are presented in the table for informational purposes only. Additional information on the measurement methods and input parameters used can be obtained from Aurubis’ IFRS consolidated financial statements as at September 30, 2018.
No reclassifications between the individual levels were made in the first six months of FY 2018/19.
Aggregated by classes(in € thousand)
Fair value3/31/2019 Level 1 Level 2 Level 3
Interests in affiliated companies 1,696 0 0 1,696
Investments 1,034 0 0 1,034
Fixed asset securities 18,839 18,839 0 0
Trade accounts receivable 82,306 0 82,306 0
Other financial assets 1,600 0 1,600 0
Derivative financial assets
Derivatives without a hedging relationship 37,640 0 25,083 12,557
Derivatives with a hedging relationship 118 0 118 0
Assets 143,233 18,839 109,107 15,287
Bank borrowings 324,633 0 324,633 0
Derivative financial liabilities
Derivatives without a hedging relationship 22,396 0 22,396 0
Derivatives with a hedging relationship 10,821 0 10,821 0
Liabilities 357,850 0 357,850 0
Hierarchical classification of fair values of financial instruments
The following overview shows a reconciliation of the financial instruments measured at fair value and classified in Level 3:

35Aurubis · Interim Report First 6 Months 2018/19
Aggregated by classes(in € thousand) Balance as at
10/1/2018Sales/
purchases
Gains (+)/losses (-) recorded in
the income statement
Balance as at 3/31/2019
Gains (+)/losses (-) for derivatives held at the
reporting date
Interests in affiliated companies 1,321 375 0 1,696 0
Investments 115 919 0 1,034 0
Derivative assets without a hedging relationship 13,270 0 -713 12,557 -713
Reconciliation of financial instruments in Level 3
Gains and losses deriving from derivative financial instruments classified as Level 3 include part of an energy supply contract and are recognized in the income statement under “Cost of materials.”
The fair value of these derivatives is partially based on non-observable input parameters that are largely related to the price of electricity and coal. Measurement is carried out using the discounted cash flow method.
If the Aurubis Group had taken other possible suitable alternative measurement parameters as a basis for measuring the relevant financial instruments on March 31, 2019, the recorded fair value would have been € 11,301 thousand (previous year: € 10,180 thousand) higher in the case of an increase in the electricity price and a decrease in the coal price by 20 %, respectively, at the end of the term or € 7,517 thousand (previous year: € 8,542 thousand) lower in the case of a decrease in the electricity price and an increase in the coal price by 20 %, respectively, at the end of the term.
Consolidated Segment ReportingAurubis reporting is separated into two operational business segments, Metal Refining & Processing (MRP) and Flat Rolled Products (FRP). From an organizational perspective, Segment MRP includes the Commercial and Operations divisions. The Commercial division combines all market-relevant organizational units, i.e., raw material procurement and product sales. The Operations division is responsible for the production of all basic products and metals, as well as their further processing into other products such as rod and shapes.
Segment FRP is a discontinued business division that is to be reported separately on an aggregated basis in the consolidated income statement and in the consolidated statement of financial position in accordance with IFRS 5. The Executive Board continues to treat Segment FRP as an operating reporting segment and, consequently, will maintain the segment reporting as previously presented until a possible sale of Segment FRP.
As Segment FRP’s operating business activities are continuing unchanged and are being monitored and managed by the Aurubis Group’s Executive Board, this company division also fulfills the definition of a segment that must be reported on, even after its classification as a discontinued business division, and is accordingly presented separately for segment reporting purposes.

36 Aurubis · Interim Report First 6 Months 2018/19
The elimination of external sales, amounting to € 578,445 thousand and shown in the column “Effects from discontinued operations” (previous year: € 608,771 thousand), represents the external sales of Segment FRP less Segment FRP’s internal Group sales with Segment MRP that are fully eliminated in the discontinued business division, amounting to € 75,563 thousand (previous year: € 91,298 thousand).
A breakdown of the revenues by product group is provided in the following table.
(in € thousand)
Segment Metal Refining & Processing
Segment Flat Rolled Products Other Total Reconciliation/
consolidationEffects from discontinued
operationsGroup
(continuing operations)6M 6M 6M 6M 6M 6M 6M 6M 6M 6M 6M 6M 6M 6M
2018/19 2017/18 2018/19 2017/18 2018/19 2017/18 2018/19 2017/18 2018/19 2017/18 2018/19 2017/18 2018/19 2017/18operating operating operating operating operating operating operating operating IFRS IFRS IFRS IFRS IFRS IFRS
Revenues
Total revenues 5,071,548 5,155,313 665,553 710,002 10,921 5,805
Inter-segment revenue 75,563 91,298 11,529 9,912 510 530
Revenues with third parties 4,995,985 5,064,015 654,024 700,090 10,411 5,275 5,660,420 5,769,380 0 0 -578,445 -608,771 5,081,975 5,160,609
EBIT 113,995 205,349 -2,117 4,470 -5,806 -20,354 106,072 189,465 38,936 46,560 -3,271 -23,148 141,737 212,877
EBT 111,764 201,858 -3,235 4,094 -5,794 -20,299 102,735 185,653 38,409 48,339 -4,865 -27,499 136,279 206,493
ROCE (%) 11.6 19.3 3.2 3.7The division of the segments complies with the definition of segments in the Group.
(in € thousand)
Segment Metal Refining & Processing
Segment Flat Rolled Products Other Total
6M 6M 6M 6M 6M 6M 6M 6M2018/19 2017/18 2018/19 2017/18 2018/19 2017/18 2018/19 2017/18operating operating operating operating operating operating operating operating
Rod 2,096,961 2,148,468 0 0 0 0 2,096,961 2,148,468
Copper cathodes 1,093,407 1,141,294 1,150 5,606 0 0 1,094,557 1,146,900
Precious metals 1,158,265 1,115,592 0 0 0 0 1,158,265 1,115,592
Shapes 415,558 431,962 36,174 39,215 0 0 451,732 471,177
Strip, profiles, and shapes 88,517 87,249 574,153 608,119 0 0 662,670 695,368
Chemicals and other products 143,277 139,450 42,547 47,150 10,411 5,275 196,235 191,875
Total 4,995,985 5,064,015 654,024 700,090 10,411 5,275 5,660,420 5,769,380

37Aurubis · Interim Report First 6 Months 2018/19
(in € thousand)
Segment Metal Refining & Processing
Segment Flat Rolled Products Other Total Reconciliation/
consolidationEffects from discontinued
operationsGroup
(continuing operations)6M 6M 6M 6M 6M 6M 6M 6M 6M 6M 6M 6M 6M 6M
2018/19 2017/18 2018/19 2017/18 2018/19 2017/18 2018/19 2017/18 2018/19 2017/18 2018/19 2017/18 2018/19 2017/18operating operating operating operating operating operating operating operating IFRS IFRS IFRS IFRS IFRS IFRS
Revenues
Total revenues 5,071,548 5,155,313 665,553 710,002 10,921 5,805
Inter-segment revenue 75,563 91,298 11,529 9,912 510 530
Revenues with third parties 4,995,985 5,064,015 654,024 700,090 10,411 5,275 5,660,420 5,769,380 0 0 -578,445 -608,771 5,081,975 5,160,609
EBIT 113,995 205,349 -2,117 4,470 -5,806 -20,354 106,072 189,465 38,936 46,560 -3,271 -23,148 141,737 212,877
EBT 111,764 201,858 -3,235 4,094 -5,794 -20,299 102,735 185,653 38,409 48,339 -4,865 -27,499 136,279 206,493
ROCE (%) 11.6 19.3 3.2 3.7The division of the segments complies with the definition of segments in the Group.
(in € thousand)
Segment Metal Refining & Processing
Segment Flat Rolled Products Other Total
6M 6M 6M 6M 6M 6M 6M 6M2018/19 2017/18 2018/19 2017/18 2018/19 2017/18 2018/19 2017/18operating operating operating operating operating operating operating operating
Rod 2,096,961 2,148,468 0 0 0 0 2,096,961 2,148,468
Copper cathodes 1,093,407 1,141,294 1,150 5,606 0 0 1,094,557 1,146,900
Precious metals 1,158,265 1,115,592 0 0 0 0 1,158,265 1,115,592
Shapes 415,558 431,962 36,174 39,215 0 0 451,732 471,177
Strip, profiles, and shapes 88,517 87,249 574,153 608,119 0 0 662,670 695,368
Chemicals and other products 143,277 139,450 42,547 47,150 10,411 5,275 196,235 191,875
Total 4,995,985 5,064,015 654,024 700,090 10,411 5,275 5,660,420 5,769,380
38 Aurubis · Interim Report First 6 Months 2018/19
Responsibility Statement
To the best of our knowledge and pursuant to the applicable accounting principles, we confirm that the interim consolidated financial statements give a true and fair view of the net assets, financial position, and results of operations of the Group, and that the interim Group management report gives a fair representation of the business development, earnings, and the position of the Group, together with a description of the significant opportunities and risks associated with the expected development of the Group in the remainder of the fiscal year.
Hamburg, May 15, 2019
Aurubis AG Executive Board
Jürgen Schachler Rainer Verhoeven Dr. Thomas Bünger
Legal disclaimer:
Forward-looking statements
This information contains forward-looking statements based on current assumptions and forecasts. Various known and unknown risks, uncertainties, and other influencing factors could have the impact that the actual future results, financial position, or developments may differ from the estimates given here. We assume no liability to update forward-looking statements.

39Aurubis · Interim Report First 6 Months 2018/19
Dates and Contacts
Financial CalendarQuarterly Report First 9 Months 2018/19 August 8, 2019 Annual Report 2018/19 December 11, 2019
If you would like more information, please contact:Aurubis AG, Hovestrasse 50, 20539 Hamburg, Germany
Investor Relations Angela Seidler Elke Brinkmann Phone +49 40 7883-3178 Phone +49 40 7883-2379 E-mail [email protected] E-mail [email protected]
Christoph Tesch Phone +49 40 7883-2178 E-mail [email protected]