interim financial report third quarter 2014 - dsv/media/de/files/pms/141029... · dsv is a global...
TRANSCRIPT

DSV A/S, Hovedgaden 630, 2640 Hedehusene, Denmark, tel. +45 43203040, CVR No. 58233528, www.dsv.com. Global Transport and Log is tics
DSV is a global supplier of transport and logistics solutions. We have offices in more than 70 countries and an international network of partners and agents, making us a
truly global player that offers services worldwide. The effective, professional solutions provided by the company's 22,000 employees enabled DSV to record worldwide
revenue of 6 billion euro for 2013. www.dsv.com
Page 1 of 19
INTERIM FINANCIAL REPORT Third quarter 2014 Company Announ cement No. 568
29 October 2014
Selected financial a nd operating data for the period 1 January - 30 September 2014
(DKKm) Q3 2014 Q3 2013 YTD 2014 YTD 2013Net revenue 12,279 11,466 36,043 33,853 Gross profit 2,609 2,522 7,682 7,479 EBIT before special items 728 691 1,975 1,880 Operating margin 5.9% 6.0% 5.5% 5.6%Conversion ratio 27.9% 27.4% 25.7% 25.1%Profit before tax 653 570 1,440 1,584 Adjusted earnings for the period 512 490 1,378 1,307 Adjusted free cash flow - - 1,048 1,281
Diluted adjusted earnings per share of DKK 1 for the period 2.98 2.74 7.87 7.33
our momentum in the third quarter of the year. Delivering 5% growth in operating profit, the
best interim results yet hough affected by the usual impact of seasonality, activity levels remained high throughout the quarter and DSV gained market share in all business areas. The Air & Sea Division continues to deliver the highest growth rates and best results, whereas the Road Division is affected by price competition. With one quarter left of 2014, we expect to realise a full-year operating profit in the top half of the range we announced at the beginning of the
DSV maintains its full-year outlook for 2014 previously announced. However, operating profit before special items is expected to be in the range of DKK 2,600-2,700 million against the previous outlook of DKK 2,550-2,700 million. A separate company announcement about the launch of a new share buyback programme of DKK 300 million will be issued today.
Inqu iries rela ting to the Interim Financial Report may be addresse d to:
Jens Bjørn Andersen, CEO, tel. +45 43 20 30 40 Jens H. Lund, CFO, tel. +45 43 20 30 40 Flemming Ole Nielsen, Director Investor Relations, tel. +45 43 20 33 92 or by email to [email protected] This announcement is available on the Internet at www.dsv.com. The announcement has been prepared in Danish and in English. In the event of discrepancies, the Danish version shall apply. Yours sincerely, DSV A/S

Page2 of 19 INTERIM FINANCIAL REPORT DSV COMPANY ANNOUNCEMENT NO. 568 29 OCTOBER 2014
Financial high lights*
Q3 2014 Q3 2013 YTD 2014 YTD 2013
Inco me statement ( DKKm)
Net revenue 12,279 11,466 36,043 33,853
Gross profit 2,609 2,522 7,682 7,479
Operating profit before amortisation, depreciation and special items 856 830 2,364 2,276
Operating profit before special items (EBIT before special items) 728 691 1,975 1,880Special items, net - 42 300 67
Net financial expenses 75 79 235 229
Profit before tax 653 570 1,440 1,584Profit for the period 483 428 1,066 1,166
Adjusted earnings for the period 512 490 1,378 1,307
Balance sheet (DKKm)
DSV A/S shareholders' share of equity 6,200 5,878Non-controlling interests 29 29Balance sheet total 24,584 23,809
Equity 6,229 5,907
Net working capital 716 512Net interest-bearing debt 6,005 6,290
Invested capital including goodwill and customer relationships 12,326 12,305
Gross investment in property, plant and equipment 198 317
Cash flo ws (DKKm)
Operating activities 1,269 1,368Investing activities (235) (387)Free cash flow 1,034 981
Adjusted free cash flow 1,048 1,281Financing activities (excluding dividends distributed, share buybacks and sale of treasury shares)
54 (308)
Share buybacks (904) (605)Dividends distributed (270) (235)Cash flow for the period 58 (21)
Financial ratios (%)
Gross margin 21.2 22.0 21.3 22.1
Operating margin 5.9 6.0 5.5 5.6
Conversion ratio 27.9 27.4 25.7 25.1 Effective tax rate 26.0 24.9 26.0 26.4
ROIC before tax including goodwill and customer relationships 21.5 20.5
ROIC before tax excluding goodwill and customer relationships 73.4 69.9
Return on equity 24.4 27.9 Solvency ratio 25.2 24.7
Gearing ratio 1.9 2.1
Share ratios
Earnings per share of DKK 1 for the period 2.80 2.42 6.13 6.60
Diluted adjusted earnings per share of DKK 1 for the period 2.98 2.74 7.87 7.33 Diluted adjusted earnings per share of DKK 1 for the last 12 months 10.60 9.81
Number of shares issued at 30 September ('000) 177,000 180,000
Number of treasury shares at 30 September ('000) 5,846 4,460Average number of outstanding shares for the period ('000) 172,573 177,806 174,008 177,574
Average number of diluted shares outstanding for the period ('000) 171,466 178,551 175,160 178,303
Average number of shares for the last 12 months ('000) 174,295 178,016
Average number of diluted shares for the last 12 months ('000) 175,397 178,698Share price at 30 September (DKK) 166.00 156.40
Staff
Number of full-time employees at 30 September 22,955 22,302
*) For a definition of financial highlights, see p. 65 of the 2013 Annual Report.

Page3 of 19 INTERIM FINANCIAL REPORT DSV COMPANY ANNOUNCEMENT NO. 568 29 OCTOBER 2014
commentary The DSV Group continued the positive trend in the third quarter of 2014 and reported significant activity level increases in all divisions. Consolidated gross profit increased by 3.4% in Q3 2014 and operating profit before special items was 5.4% higher than the same period last year. The growth in gross profit and operating profit was in line with the previous quarters, with the Air & Sea Division showing the best development whereas the results of Road and Solutions are still affected by a highly competitive market.
Profit for the period Net revenue For the first nine months of 2014, DSV recorded revenue of DKK 36,043 million against DKK 33,853 million for the corresponding period of 2013. The organic growth was 5.7%. For Q3 2014, revenue amounted to DKK 12,279 million against DKK 11,466 million for the same period last year. The organic growth was 6.0%. NET REVENUE YTD 2014 (DKKm)
16,181(42%)
18,110(47%)
4,186(11%)
Air & Sea
Road
Solutions
Gross prof it Gross profit was up 2.7% and totalled DKK 7,682 million for the first nine months of 2014. The organic growth was 2.9%. For Q3 2014, gross profit amounted to DKK 2,609 million against DKK 2,522 million for the same period last year. The organic growth was 2.9%. Both net revenue and gross profit were positively affected by increasing freight volumes and acquirees. However, price competition also had a negative impact. GROSS PROFIT YTD 2014 (DKKm)
3,389(45%)
3,256(42%)
1,026(13%)
Air & Sea
Road
Solutions
Operating profit before special items increased by 5.4% and totalled DKK 728 million for Q3 2014

Page 4 of 19 INTERIM FINANCIAL REPORT DSV COMPANY ANNOUNCEMENT NO. 568 29 OCTOBER 2014
The Air & Sea Division contributed to the high gross profit, whereas Road delivered gross profit in line with Q3 2013 and Solutions reported a slight drop. Low exchange rates impacted negatively on gross profit by DKK 147 million, corresponding to 1.9%, in the first nine months of 2014. The negative currency translation effect mainly relates to the first six months of the year. The consolidated gross margin for the period came to 21.3% against 22.1% for the same period of 2013. Operating prof it before special i tems YTD 2014 (DKKm)
1,143(58%)
663(33%)
184(9%)
Air & Sea
Road
Solutions
Operating prof it befo re special i tems Operating profit before special items increased by 5.1% and totalled DKK 1,975 million for the first nine months of 2014. The organic growth was 5.8%. Conversion ratio was 25.7% against 25.1% for the same period last year. For Q3 2014, operating profit before special items amounted to DKK 728 million against DKK 691 million for the same period last year. The organic growth was 5.7%. Conversion ratio was 27.9% for Q3 2014 against 27.4% for the same period last year. The high conversion ratio is attributable to the Air & Sea Division, which managed to handle a considerable volume growth without a corresponding increase in costs. The conversion ratio of the Road Division was slightly down on the same period last year, mainly as a result of low average earnings per consignment. The Solutions Division reported a conversion ratio in line with last year, but was also affected by the low gross profit per order line.
The operating margin (before special items) came to 5.5% for the first nine months of 2014, which is in line with the same period last year. Low exchange rates impacted negatively on operating profit before special items by DKK 26 million, corresponding to 1.3%, in the first three quarters of the year. Similar to the gross profit, the impact from foreign currency translation mainly related to the first six months of 2014. Special i tems, net Special items netted DKK 300 million for the first nine months of 2014 against DKK 67 million for the same period of 2013. Special items for the period related to the streamlining and cost-
nts that
Centre in Poland and various operational and administrative restructuring initiatives on both group, regional and local level. The planned initiatives are expected to generate annual savings of approx. DKK 150 million. Effective tax ra te The effective tax rate was in line with expectations at 26.0% for the first nine months of 2014 compared to 26.4% for the same period of 2013. Prof it fo r the period Profit for the period was DKK 1,066 million for the nine months under review against DKK 1,166 million for the same period last year. The decline was mainly due to the expenses related to the Operational Excellence 2.0 programme. Diluted adjusted earnings per share Diluted adjusted earnings per share were DKK 7.87 for the first nine months of 2014, which was 7.4% higher than for the same period last year. The increase was attributable to the increase in adjusted earnings and the reduced average number of shares as a result of the share buybacks made. The 12-month figure to the end of September 2014 was DKK 10.60 per share compared to DKK 9.81 for the same period of 2013, corresponding to an increase of 8.1%.
GROWTH
(DKKm) Q3 2013
Currency translation
adjustments Acquisitions, netOrganicgrowth
Organic growth Q3 2014
Net revenue 11,466 (90) 208 695 6.0% 12,279Gross profit 2,522 (14) 28 73 2.9% 2,609EBIT before special items 691 (1) (1) 39 5.7% 728
YTD 2013 YTD 2014Net revenue 33,853 (636) 885 1,941 5.7% 36,043Gross profit 7,479 (147) 131 219 2.9% 7,682EBIT before special items 1,880 (26) 12 109 5.8% 1,975

Page 5 of 19 INTERIM FINANCIAL REPORT DSV COMPANY ANNOUNCEMENT NO. 568 29 OCTOBER 2014
Cash flows Working capital The Group's funds tied up in net working capital came to DKK 716 million at 30 September 2014 against DKK 512 million at 30 September 2013. Relative to estimated full-year revenue the net working capital amounted to 1.5% at 30 September 2014 against 1.1% at 30 September 2013. The high net working capital partly relates to the Air & Sea Division, which reported an increase in funds tied up in working capital as a result of high activity levels. The Group's funds tied up in net working capital came to DKK 561 million at 31 December 2013. Cash flow from operating activi ties Cash flow from operating activities came to DKK 1,269 million for the first nine months of 2014 against DKK 1,368 million for the same period of 2013. Cash flow from operating activities was negatively affected by the increase in funds tied up in net working capital, which was, however, offset to a certain extent by the high operating profit. Free cas h flow Free cash flow for the period came to DKK 1,034 million against DKK 981 million for the same period last year. Cash flow from investing activities was lower for the first nine months of 2014 than for the same period last year, which can mainly be explained by the high level of investments in subsidiaries in 2013. CASH FLOW STATEMENT (DKKm) YTD 2014 YTD 2013
EBITDA before special ite ms 2,364 2,276 Change in net working capital (472) (182)Adjustment, non-cash operating items 203 (93)Adjustment, other operating items (826) (633)
Cash flow from operating activities 1,269 1,368 Purchase and sale of intangibles, property, plant and equipment (261) (144)Acquisition and disposal of subsidiaries and activities (14) (265)Other 40 22 Cash flow from investing activities (235) (387)Free cash flow 1,034 981 Proceeds from and repayment of short-term and long-term debt - (281)Allocated to shareholders (1,174) (840)Exercised under share option scheme 144 146 Other transactions with shareholders 54 (27)
Cash flow from financing activities (9 76) (1,002)Cash flow for the period 58 (21)
Adjusted free cash flow 1,048 1,281
Capital all ocation
adjusted free cash flow for the nine-month period ended 30
through share buybacks (DKK 904 million) and dividend payments (DKK 270 million).
Capital s tructure and finances Equ ity
equity was DKK 6,200 million. At 31 December 2013, Group equity was DKK 6,218 million. Equity was mainly affected by the profit for the period, share buybacks and distribution of dividends. At 30 September 2014, the Company's portfolio of treasury shares amounted to 5,846,210 shares, corresponding to 3.30% of all 177,000,000 shares issued. At 29 October 2014, the
6,449,770 shares. DSV reduced its share capital on 14 April 2014 through the cancellation of 3,000,000 treasury shares, in accordance with the
The solvency ratio excluding non-controlling interests came to 25.2% at 30 September 2014. At 31 December 2013, the solvency ratio was 26.9%. DEVELOPMENT IN EQUITY (DKKm) YTD 2014 YTD 2013
Equity at 1 Janua ry 6,218 5,348 Net profit for the period 1,066 1,172 Dividends distributed (270) (235) Purchase of treasury shares (904) (605) Sale of treasury shares 144 146 Adjustments relating to hedging instruments 14 76 Tax on changes in equity (13) (39) Other adjustments, net (55) 15 Equity at 30 Septe mber 6,200 5,878
Net interest-bearing debt Net interest-bearing debt amounted to DKK 6,005 million at 30 September 2014 against DKK 5,949 million at 31 December 2013. At 30 September 2014, the financial gearing ratio was 1.9
gearing ratio (measured as net interest-bearing debt/EBITDA before special items) of approx. 2.0. The financial gearing ratio may exceed 2.0 in special situations in case of major acquisitions made by the Group. The long-term debt funding is structured as 50% bank loans and 50% corporate bonds. The duration of the Group's long-term loan and credit facilities was 4.7 years at 30 September 2014 against 4.2 years at 31 December 2013. In March 2014, DSV issued DKK 1,500 million worth of 8-year corporate bonds. The proceeds have been used to reduce the
-term bank loans.

Page 6 of 19 INTERIM FINANCIAL REPORT DSV COMPANY ANNOUNCEMENT NO. 568 29 OCTOBER 2014
Net financial ex penses Financial expenses netted DKK 235 million for the period against DKK 229 million for the same period of 2013.
Invested capital including good will a nd customer rela tionships The Group's invested capital including goodwill and customer relationships amounted to DKK 12,326 million at 30 September 2014 against DKK 12,281 million at 31 December 2013.
ROIC Return on invested capital including goodwill and customer relationships was 21.5% for the 12-month period ended 30 September 2014 against 20.5% for the 12-month period ended 30 September 2013.
Impact of seasonali ty Seasonality does not have any major impact on the activities of the Group.
Outlook fo r 2014 DSV maintains its full-year outlook for 2014 previously announced. However, operating profit before special items is expected to be in the range of DKK 2,600-2,700 million against the previous outlook of DKK 2,550-2,700 million. Consequently, the outlook is as follows: Gross profit is expected to be in the range of DKK 10,100-
10,500 million Operating profit before special items is expected to be in the
range of DKK 2,600-2,700 million Special items of approx. DKK 300 million are expected in
connection with the execution of the Operational Excellence 2.0 investment programme
Net financial expenses are expected to approximate DKK 300 million
The effective tax rate of DSV is expected to be 26% Free cash flow before any acquisition or divestment of
enterprises is expected to approximate DKK 1,600 million The outlook for the remainder of 2014 is based on the exchange rates at 31 October 2014 on the key currencies of the Group. DSV maintains its goal of gaining market share and growing faster than the market. The growth expectations for the individual markets remain unchanged relative to the adjusted forecast announced in the H1 2014 Interim Financial Report. MARKET GROWTH FORECAST FREIGHT VOLUMES, 2014 Growth Sea freight 3-5% growth Air freight 2-4% growth Road 1-3% growth Solutions 1-3% growth By their nature, the expectations stated above are uncertain and involve various risks. Critical factors may influence actual results. Such factors include, but are not limited to, unforeseen changes in economic and political conditions, changes in the demand for
acquisition and divestment of enterprises, and other material factors, including interest rate and exchange rate fluctuations. These factors may result in the actual development and results of the Group differing from the expectations set out in this Report.

Page 7 of 19 INTERIM FINANCIAL REPORT DSV COMPANY ANNOUNCEMENT NO. 568 29 OCTOBER 2014
DSV Air & Sea Activi ties DSV Air & Sea organises transportation of cargo by air and sea. The Division offers conventional freight services through its global network, supplemented by a Project Department offering special transport solutions. The Air & Sea Division reported 13.6% growth in EBIT before special items for Q3 2014 and continued the positive development of growth in freight volumes and improved productivity.
INCOME STATEMENT
(DKKm) Q3 2014 Q3 2013 YTD 2014 YTD 2013
Net revenue 5,672 5,171 16,181 14,897Direct costs 4,487 4,074 12,792 11,716Gross pro fit 1,185 1,097 3,389 3,181
Other external expenses 250 222 720 688Staff costs 474 466 1,446 1,405EBITDA before special ite ms 461 409 1,223 1,088
Amortisation and depreciation 11 12 35 37Amortisation of customer relationships 15 14 45 41EBIT before special items 435 383 1,143 1,010
KEY OPERATING DATA
Q3 2014 Q3 2013 YTD 2014 YTD 2013Gross margin (%) 20.9 21.2 20.9 21.4Conversion ratio (%) 36.7 34.9 33.7 31.8Operating margin (%) 7.7 7.4 7.1 6.8
Number of full-time employees at 30 September 6,654 6,374
Total invested capital (DKKm) 6,829 6,668Net working capital (DKKm) 1,271 1,108ROIC (%) 22.6 21.1
The Division reported an 8% increase in sea freight volumes and 14% in air freight for Q3 2014

Page 8 of 19 INTERIM FINANCIAL REPORT DSV COMPANY ANNOUNCEMENT NO. 568 29 OCTOBER 2014
Market development
Freight volume growth on Q3 2013
DSV
Q3 2014
Market*
Q3 2014
DSV
YTD
2014
Market*
YTD
2014
Sea freight TEUs 8% 3-5% 9% 3-5%
Air freight tonnes 14% 2-4% 12% 2-4%
*) Market growth rates are based on own estimates.
Delivering 8% growth in sea freight volumes (TEU) for Q3 2014 and 9% for the first nine months of the year the Division is estimated to have gained market share. Acquirees contributed approx. 1% to the volume growth for Q3 2014 and approx. 2% to the year-to-date growth. The Division achieved air freight volume growth of 14% for Q3 2014 and 12% for the first nine months of the year and is estimated to have gained market share also in this segment. Acquirees contributed approx. 1% to the volume growth for Q3 2014 and approx. 2% to the year-to-date growth.
Net revenue Net revenue was up 8.6% and totalled DKK 16,181 million for the first nine months of 2014. The organic growth was 7.4%. Revenue was up 9.7% in the third quarter of the year and totalled DKK 5,672 million. For Q3 2014, the organic growth was 7.5%. The high net revenue mainly owes to the growth in freight volumes in both sea and air freight. However, net revenue was also negatively affected by fierce competition in the main markets of the Division and low exchange rates, which impacted on the first six months of the year in particular.
Gross prof it Gross profit was up 6.5% and totalled DKK 3,389 million for the first nine months of 2014. The organic growth was 6.5%. Gross profit was up 8.0% in the third quarter of the year and totalled DKK 1,185 million. The organic growth was 6.5%.
Gross profit was positively affected by the growth in freight volumes, whereas gross profit per shipment declined for both sea freight and air freight compared to the same period last year. The low gross profit per shipment was mainly due to low exchange rates, in the first six months of the year in particular, and increased competition.
EBIT before special i tems EBIT before special items increased by 13.2% and totalled DKK 1,143 million for the first nine months of 2014. The organic growth was 13.3%. Conversion ratio was 33.7% against 31.8% for the same period last year. EBIT before special items increased by 13.6% in Q3 2014 and totalled DKK 435 million. The organic growth was 12.4%. Conversion ratio was 36.7% for Q3 2014 against 34.9% for the same period last year. The Division maintained the positive development of increasing productivity and improved conversion ratio in the period under review. The Division managed to achieve 10% freight volume growth while keeping overheads stable despite the integration of acquirees. The Division's operating margin for the nine-month period under review was 7.1% against 6.8% for the corresponding period of 2013.
At 2 July 2014, the Division acquired the remaining proportion of the shares in the DSV Swift Group of companies in Africa and the African companies have been consolidated as wholly-owned subsidiaries as from that date. The transaction had no significant impact on operating profit for Q3 2014.
Worki ng capital The Air & Sea Division's funds tied up in net working capital came to DKK 1,271 million at 30 September 2014 against DKK 1,108 million at 30 September 2013. The increase was partly due to the high activity level and a change in payment behaviour.
GROWTH
(DKKm) Q3 2013
Currency translation
adjustments Acquisitions, netOrganicgrowth
Organic growth Q3 2014
Net revenue 5,171 (25) 128 398 7.5% 5,672Gross profit 1,097 (7) 23 72 6.5% 1,185EBIT before special items 383 - 4 48 12.4% 435
YTD 2013 YTD 2014Net revenue 14,897 (380) 551 1,113 7.4% 16,181Gross profit 3,181 (90) 90 208 6.5% 3,389EBIT before special items 1,010 (25) 24 134 13.3% 1,143

Page 9 of 19 INTERIM FINANCIAL REPORT DSV COMPANY ANNOUNCEMENT NO. 568 29 OCTOBER 2014
AIR & SEA SEGMENT INFORMATION
(DKKm) YTD 2014 YTD 2013 YTD 2014 YTD 2013 YTD 2014 YTD 2013 YTD 2014 YTD 2013 YTD 2014 YTD 2013
EMEA 11,170 10,538 1,988 1,896 560 482 5.0 4.6 28.2 25.4APAC 3,777 3,456 707 687 276 273 7.3 7.9 39.0 39.7
Americas 3,340 2,711 680 577 338 276 10.1 10.2 49.7 47.8
Eliminations, etc. (2,106) (1,808) 14 21 (31) (21) - - - -
Total 16,181 14,897 3,389 3,181 1,143 1,010 7.1 6.8 33.7 31.8
Net revenue Gross profit EBIT before special items Operating margin Conversion ratio
AIR AND SEA SPLIT
(DKKm) Q3 2014 Q3 2013 YTD 2014 YTD 2013 Q3 2014 Q3 2013 YTD 2014 YTD 2013
Net revenue 3,426 3,157 9,677 8,960 2,246 2,014 6,504 5,937 Direct costs 2,734 2,507 7,696 7,092 1,753 1,567 5,096 4,624
Gross pro fit 692 650 1,981 1,868 493 447 1,408 1,313
Gross margin (%) 20.2 20.6 20.5 20.8 22.0 22.2 21.6 22.1Volume (TEUs/Tonnes) 215,673 200,465 627,687 577,089 73,044 64,308 209,807 187,187 Gross profit per TEU/Tonne 3,209 3,242 3,156 3,238 6,753 6,954 6,714 7,009
Air freightSea freight

Page 10 of 19 INTERIM FINANCIAL REPORT DSV COMPANY ANNOUNCEMENT NO. 568 29 OCTOBER 2014
DSV Road Activi ties With a complete European network, DSV Road is among the top three transport companies in Europe. The Division offers full load, part load and groupage services through a strong network of more than 200 terminals across Europe. The Road Division reported 5% growth in number of consignments, but a competitive market resulted in declining earnings per consignment and a 10% drop in EBIT before special items.
INCOME STATEMENT
(DKKm) Q3 2014 Q3 2013 YTD 2014 YTD 2013
Net revenue 5,984 5,686 18,110 17,152
Direct costs 4,923 4,614 14,854 13,911
Gross pro fit 1,061 1,072 3,256 3,241
Other external expenses 253 246 760 729Staff costs 553 544 1,735 1,697
EBITDA before special ite ms 255 282 761 815
Amortisation and depreciation 28 31 83 84Amortisation of customer relationships 5 5 15 14
EBIT before special items 222 246 663 717
KEY OPERATING DATA
Q3 2014 Q3 2013 YTD 2014 YTD 2013Gross margin (%) 17.7 18.9 18.0 18.9Conversion ratio (%) 20.9 22.9 20.4 22.1Operating margin (%) 3.7 4.3 3.7 4.2
Number of full-time employees at 30 September 9,389 9,433
Total invested capital (DKKm) 3,475 3,758Net working capital (DKKm) (502) (414)
ROIC (%) 24.6 24.2
The Division reported 5% growth in number of consignments for Q3 2014

Page 11 of 19 INTERIM FINANCIAL REPORT DSV COMPANY ANNOUNCEMENT NO. 568 29 OCTOBER 2014
Market development
Freight volume growth on Q3 2013
DSV
Q3 2014
Market*
Q3 2014
DSV
YTD
2014
Market*
YTD
2014
Consignments 5% 1-3% 4% 1-3%
*) Market growth rates are based on own estimates.
With an increase in the number of consignments of approx. 4% in the first nine months of the year and 5% for Q3 2014, Management estimates that the Road Division has gained market share in most markets. Acquirees are estimated to have contributed approx. 1% to the volume growth in the nine-month period under review.
Net revenue Net revenue was up 5.6% and totalled DKK 18,110 million for the first nine months of 2014. The organic growth was 5.0%. Revenue was up 5.2% in the third quarter of the year and totalled DKK 5,984 million. The organic growth was 4.9%. Net revenue was mainly influenced by the growth in number of consignments.
Gross prof it Gross profit was up 0.5% and totalled DKK 3,256 million for the first nine months of 2014. The organic growth was 0.3%. Gross profit dropped 1.0% in the third quarter of the year and totalled DKK 1,061 million. The Division's gross margin year-to-date was lower than last year at 18.0% for the nine-month period under review against 18.9% for the same period of 2013. The European road freight market is still a competitive market with fierce price competition, which is reflected in the low gross margin. However, Management estimates that the market situation has stabilised during the past quarter.
The low gross margin was to a certain extent attributable to a change in product mix, as part of the growth was achieved in areas with low average earnings per consignment. Both net revenue and gross profit were negatively affected by
negative currency effect was notable in the first six months of the year in particular.
EBIT before special i tems EBIT before special items dropped 7.5% and totalled DKK 663 million for the first nine months of 2014. Organic growth was a negative 5.4%. Conversion ratio was 20.4% against 22.1% for the same period last year. EBIT before special items dropped by 9.8% in Q3 2014 and totalled DKK 222 million. Conversion ratio was 20.9% for Q3 2014 against 22.9% for the same period last year. The dissatisfactory development in operating profit and conversion ratio was due to a slight increase in overheads while gross profit was largely unchanged from the same period last year. Other external expenses and staff costs were affected by the general increase in costs and the integration of Ontime Logistics, which involved an overall loss in 2014. The full effect of the cost-saving initiatives launched in connection with the Operational Excellence 2.0 programme did not materialise in the third quarter of 2014, but the initiatives will be fully implemented over the next one or two quarters. The Division's operating margin for the nine-month period under review was 3.7% against 4.2% for the same period last year.
Worki ng capital The Road Division's funds tied up in net working capital came to a negative DKK 502 million at 30 September 2014 compared to a negative DKK 414 million at 30 December 2013.
GROWTH
(DKKm) Q3 2013
Currency translation
adjustments Acquisitions, netOrganicgrowth
Organic growth Q3 2014
Net revenue 5,686 (60) 79 279 4.9% 5,984Gross profit 1,072 (5) 6 (12) (1.1%) 1,061EBIT before special items 246 (2) (4) (18) (7.5%) 222
YTD 2013 YTD 2014Net revenue 17,152 (245) 333 870 5.0% 18,110Gross profit 3,241 (34) 40 9 0.3% 3,256EBIT before special items 717 (3) (13) (38) (5.4%) 663

Page 12 of 19 INTERIM FINANCIAL REPORT DSV COMPANY ANNOUNCEMENT NO. 568 29 OCTOBER 2014
DSV Solutions
Activi ties DSV Solutions specialises in logistics solutions across the entire supply chain, including freight management, customs clearance, warehousing and distribution, information management and e-business support. For the third quarter of 2014, the Division reported EBIT before special items in line with 2013. The Solutions Division gained market share and achieved 5% growth in order lines in Q3, however price pressure resulted in a reduced gross profit per order line.
INCOME STATEMENT
(DKKm) Q3 2014 Q3 2013 YTD 2014 YTD 2013
Net revenue 1,441 1,374 4,186 4,090Direct costs 1,091 1,018 3,160 3,026Gross pro fit 350 356 1,026 1,064
Other external expenses 106 108 311 337Staff costs 133 132 413 411EBITDA before special ite ms 111 116 302 316
Amortisation and depreciation 32 37 92 98Amortisation of customer relationships 8 8 26 26EBIT before special items 71 71 184 192
KEY OPERATING DATA
Q3 2014 Q3 2013 YTD 2014 YTD 2013Gross margin (%) 24.3 25.9 24.5 26.0Conversion ratio (%) 20.3 19.9 17.9 18.0Operating margin (%) 4.9 5.2 4.4 4.7
Number of full-time employees at 30 September 6,246 6,009
Total invested capital (DKKm) 1,723 1,622Net working capital (DKKm) 191 36ROIC (%) 14.8 15.2
In Q3 2014, the
measured in order lines increased by approx. 5%
Page 13 of 19 INTERIM FINANCIAL REPORT DSV COMPANY ANNOUNCEMENT NO. 568 29 OCTOBER 2014
Market development
Activi ty growth on Q3 2013
DSV
Q3 2014
Market*
Q3 2014
DSV
YTD
2014
Market*
YTD
2014
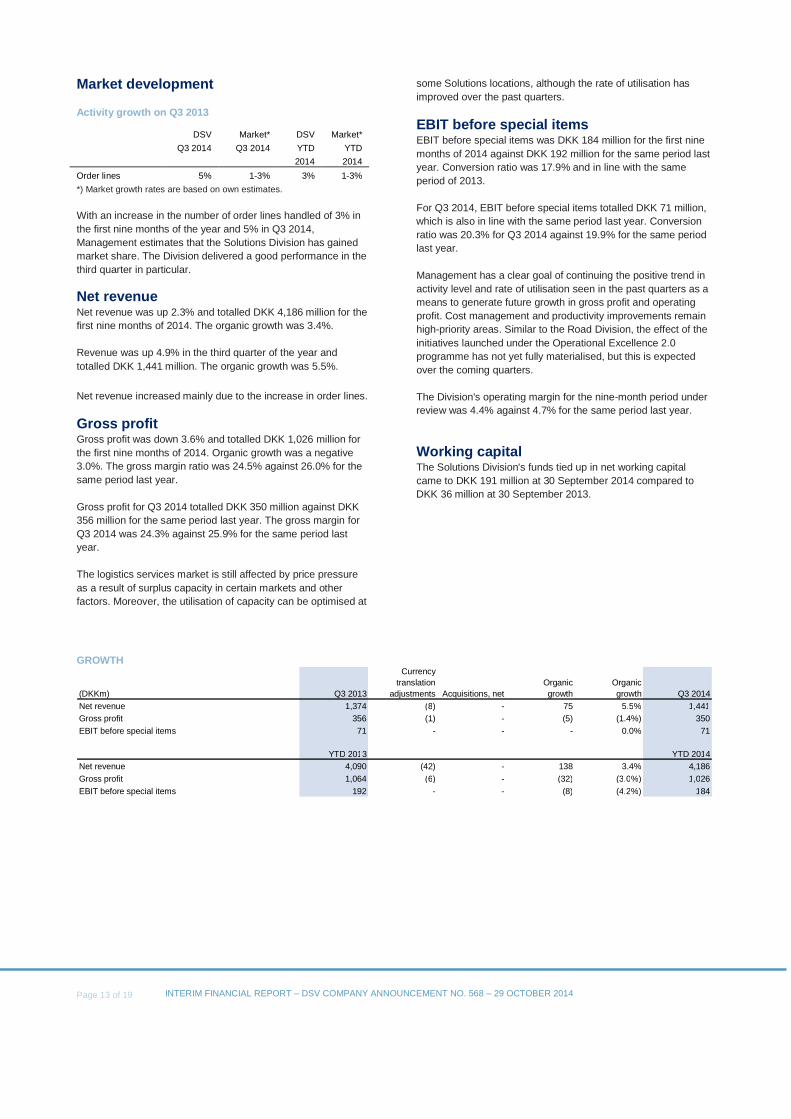
Order lines 5% 1-3% 3% 1-3%
*) Market growth rates are based on own estimates.
With an increase in the number of order lines handled of 3% in the first nine months of the year and 5% in Q3 2014, Management estimates that the Solutions Division has gained market share. The Division delivered a good performance in the third quarter in particular.
Net revenue Net revenue was up 2.3% and totalled DKK 4,186 million for the first nine months of 2014. The organic growth was 3.4%. Revenue was up 4.9% in the third quarter of the year and totalled DKK 1,441 million. The organic growth was 5.5%.
Net revenue increased mainly due to the increase in order lines.
Gross prof it Gross profit was down 3.6% and totalled DKK 1,026 million for the first nine months of 2014. Organic growth was a negative 3.0%. The gross margin ratio was 24.5% against 26.0% for the same period last year. Gross profit for Q3 2014 totalled DKK 350 million against DKK 356 million for the same period last year. The gross margin for Q3 2014 was 24.3% against 25.9% for the same period last year. The logistics services market is still affected by price pressure as a result of surplus capacity in certain markets and other factors. Moreover, the utilisation of capacity can be optimised at
some Solutions locations, although the rate of utilisation has improved over the past quarters.
EBIT before special i tems EBIT before special items was DKK 184 million for the first nine months of 2014 against DKK 192 million for the same period last year. Conversion ratio was 17.9% and in line with the same period of 2013. For Q3 2014, EBIT before special items totalled DKK 71 million, which is also in line with the same period last year. Conversion ratio was 20.3% for Q3 2014 against 19.9% for the same period last year. Management has a clear goal of continuing the positive trend in activity level and rate of utilisation seen in the past quarters as a means to generate future growth in gross profit and operating profit. Cost management and productivity improvements remain high-priority areas. Similar to the Road Division, the effect of the initiatives launched under the Operational Excellence 2.0 programme has not yet fully materialised, but this is expected over the coming quarters. The Division's operating margin for the nine-month period under review was 4.4% against 4.7% for the same period last year.
Worki ng capital The Solutions Division's funds tied up in net working capital came to DKK 191 million at 30 September 2014 compared to DKK 36 million at 30 September 2013.
GROWTH
(DKKm) Q3 2013
Currency translation
adjustments Acquisitions, netOrganicgrowth
Organic growth Q3 2014
Net revenue 1,374 (8) - 75 5.5% 1,441Gross profit 356 (1) - (5) (1.4%) 350EBIT before special items 71 - - - 0.0% 71
YTD 2013 YTD 2014Net revenue 4,090 (42) - 138 3.4% 4,186Gross profit 1,064 (6) - (32) (3.0%) 1,026EBIT before special items 192 - - (8) (4.2%) 184

Page 14 of 19 INTERIM FINANCIAL REPORT DSV COMPANY ANNOUNCEMENT NO. 568 29 OCTOBER 2014
Interim financial statements INCOME STATEMENT
(DKKm) Q3 2014 Q3 2013 YTD 2014 YTD 2013
Net revenue 12,279 11,466 36,043 33,853Direct costs 9,670 8,944 28,361 26,374
Gross pro fit 2,609 2,522 7,682 7,479
Other external expenses 517 489 1,526 1,513
Staff costs 1,236 1,203 3,792 3,690
Operating profit before a mortisation, depreciation and special items 856 830 2,364 2,276
Amortisation and depreciation of intangibles, property, plant and equipment 128 139 389 396
Operating profit before special items 728 691 1,975 1,880
Special items, net - 42 300 67 Financial expenses, net 75 79 235 229
Profit before tax 653 570 1,440 1,584
Tax on profit for the period 170 142 374 418Profit for the period 483 428 1,066 1,166
Profit for the period is attributable to:Shareholders of DSV A/S 483 430 1,066 1,172
Non-controlling interests - (2) - (6)
Earnings per share:Earnings per share of DKK 1 for the period (DKK) 2.80 2.42 6.13 6.60Diluted earnings per share of DKK 1 for the period (DKK) 2.82 2.41 6.09 6.57
Supplementary information:
Diluted adjusted earnings per share of DKK 1 for the period 2.98 2.74 7.87 7.33
Diluted adjusted earnings per share of DKK 1 for the last 12 months 10.60 9.81
STATEMENT OF COMPREHENSIVE INCOME (DKKm) Q3 2014 Q3 2013 YTD 2014 YTD 2013Profit for the period 483 428 1,066 1,166
Items that will be reclassified to income statement wh en certain conditions are met:Currency translation adjustments, foreign enterprises (70) 38 (92) (24)
Fair value adjustment relating to hedging instruments 20 21 55 50
Fair value adjustment relating to hedging instruments transferred to financial expenses (13) (4) (41) 26 Tax on items reclassified to income statement (1) (2) (1) (17)
Other comprehensive income, net of tax (64) 53 (79) 35
Total comprehensive income 419 481 987 1,201
Statement of comprehensive income is allocated to:Shareholders of DSV A/S 419 483 987 1,208 Non-controlling interests - (2) - (7)
Total 419 481 987 1,201

Page 15 of 19 INTERIM FINANCIAL REPORT DSV COMPANY ANNOUNCEMENT NO. 568 29 OCTOBER 2014
CASH FLOW STATEMENT (DKKm) YTD 2014 YTD 2013
Operating profit before amortisation, depreciation and special items 2,364 2,276
Adjustment, non-cash operating items etc.:Share-based payments 28 30 Change in provisions 175 (123) Cash flo w fro m operating activities before special items, change in net working capital and tax 2,567 2,183
Change in net working capital, excluding changes in provisions for corporation tax and current portion of provisions, etc.
(472) (182)
Special items (294) (67) Net financial expenses (225) (219) Corporation tax, paid (307) (347) Cash flow from operating activities 1,269 1,368
Purchase of intangible assets (149) (137) Purchase of property, plant and equipment (134) (318) Disposal of property, plant and equipment 22 311 Disposal of intangible assets - - Acquisition of subsidiaries and activities (14) (265) Disposal of subsidiaries and activities - - Change in other financial assets 40 22 Cash flow from investing activities (235) (387)
Free cash flow 1,034 981
Proceeds from and repayment of short-term and long-term debt 39 (250) Other financial liabilities incurred (39) (31) Shareholders:Dividends distributed (270) (235) Purchase of treasury shares (904) (605) Sale of treasury shares, exercise of share options 144 146 Other transactions with shareholders 54 (27) Cash flow from financing activities (976) (1,002)
Cash flow for the period 58 (21)
Cash and cash equivalents at 1 January 707 552 Cash flow for the period 58 (21) Currency translation adjustments (147) 96
Cash and cash equivalents at 30 September 618 627 The cash flow statement cannot be directly derived from the balance sheet and income statement.
Statement of adjusted free cash flowFree cash flow 1,034 981 Net acquisition of subsidiaries and activities 14 265 Normalisation of working capital in subsidiaries and activities acquired - 35 Adjusted free cash flow 1,048 1,281

Page 16 of 19 INTERIM FINANCIAL REPORT DSV COMPANY ANNOUNCEMENT NO. 568 29 OCTOBER 2014
BALANCE SHEET, ASSETS
(DKKm) 30.09.2014 30.09.2013 31.12.2013
Intangible assets 9,004 9,027 8,982
Property, plant and equipment 3,777 4,045 3,883Other receivables 115 133 147
Deferred tax asset 468 430 430
Total non-cu rrent assets 13,364 13,635 13,442
Trade receivables 8,538 7,955 7,469
Work in progress (services) 967 755 676
Other receivables 1,080 825 794 Cash and cash equivalents 618 627 707
Assets held for sale 17 12 12
Total current assets 11,220 10,174 9,658
Total assets 24,584 23,809 23,100
BALANC E SHEET, EQUITY AND LIABILITIES
(DKKm) 30.09.2014 30.09.2013 31.12.2013
Share capital 177 180 180Reserves 6,023 5,698 6,038
DSV A/S shareholders ' share o f equity 6,200 5,878 6,218Non-controlling interests 29 29 30
Total equity 6,229 5,907 6,248
Deferred tax 441 446 411
Pensions and similar obligations 1,025 1,061 1,034
Provisions 380 443 361Financial liabilities 5,552 6,033 6,066
Total non-current liabilities 7,398 7,983 7,872
Provisions 444 241 242
Financial liabilities 1,071 884 590Trade payables 4,840 4,398 4,537
Work in progress (services) 1,450 1,499 1,252
Other payables 2,817 2,628 2,115Corporation tax 335 269 244
Total current liabilities 10,957 9,919 8,980
Total liabilities 18,355 17,902 16,852
Total equity and liabilities 24,584 23,809 23,100

Page 17 of 19 INTERIM FINANCIAL REPORT DSV COMPANY ANNOUNCEMENT NO. 568 29 OCTOBER 2014
STATEMENT OF CHANGES IN EQUITY 1 JANUARY - 30 SEPTEMBER 2014
(DKKm) Share capitalTreasury
sharesHedging reserve
Translation reserve
Retained earnings
DSV A/S shareholders'
share of equity
Non-controlling
interests Total equity
Equity at 1 January 2014 180 (5) (38) (44) 6,125 6,218 30 6,248
Profit for the period - - - - 1,066 1,066 - 1,066
Currency translation adjustments, foreign enterprises
- - - (92) - (92) - (92)
Fair value adjustments relating to hedging instruments
- - 55 - - 55 - 55
Fair value adjustments relating to hedging instruments transferred to financial expenses
- - (41) - - (41) - (41)
Tax on other comprehensive income - - (1) - - (1) - (1) Other comprehensive income, net of tax - - 13 (92) - (79) - (79)
Total comprehensive income for the period - - 13 (92) 1,066 987 - 987
Transactions with owners:Share-based payments - - - - 28 28 - 28 Dividends distributed - - - - (270) (270) - (270) Purchase and sale of treasury shares, net - (4) - - (756) (760) - (760) Capital reduction (3) 3 - - - - - - Dividends on treasury shares - - - - 8 8 - 8 Other adjustments - - - - 1 1 (1) - Tax on transactions with owners - - - - (12) (12) - (12) Total transactions with owners (3) (1) - - (1,001) (1,005) (1) (1,006)
Equity at 30 September 2014 177 (6) (25) (136) 6,190 6,200 29 6,229
STATEMENT OF CHANGES IN EQUITY 1 JANUARY - 30 SEPTEMBER 2013
(DKKm) Share capitalTreasury
sharesHedging reserve
Translation reserve
Retained earnings
DSV A/S shareholders'
share of equity
Non-controlling
interests Total equity
Equity at 1 January 2013 188 (10) (107) 16 5,261 5,348 37 5,385
Profit for the period - - - - 1,172 1,172 (6) 1,166
Currency translation adjustments, foreign enterprises
- - - (23) - (23) (1) (24)
Fair value adjustments relating to hedging instruments
- - 50 - - 50 - 50
Fair value adjustments relating to hedging instruments transferred to financial expenses
- - 26 - - 26 - 26
Tax on other comprehensive income - - (17) - - (17) - (17) Other comprehensive income, net of tax - - 59 (23) - 36 (1) 35
Total comprehensive income for the period
- - 59 (23) 1,172 1,208 (7) 1,201
Transactions with owners:Share-based payments - - - - 30 30 - 30 Dividends distributed - - - - (235) (235) - (235) Purchase and sale of treasury shares, net - (4) - - (455) (459) - (459) Capital reduction (8) 8 - - - - - - Dividends on treasury shares - - - - 12 12 - 12 Other adjustments - - - - (4) (4) (1) (5) Tax on transactions with owners - - - - (22) (22) - (22) Total transactions with owners (8) 4 - - (674) (678) (1) (679)
Equi ty at 30 September 2013 180 (6) (48) (7) 5,759 5,878 29 5,907

Page 18 of 19 INTERIM FINANCIAL REPORT DSV COMPANY ANNOUNCEMENT NO. 568 29 OCTOBER 2014
Notes NOTE 1 ACCOUNTING POLICIES
pean Union and Danish disclosure requirements for listed companies. Except as stated below, the accounting policies applied are consistent with those applied in the 2013 consolidated financial statements. The 2013 consolidated financial statements provide a full description of the accounting policies applied. Changes in accoun ting po licies DSV A/S has implemented the standards and interpretations effective as from 1 January 2014. None of the changes are expected to affect
Certain reclassifications have been made to the income statement which are not critical and which have not affected operating profit before special items or profit for the period. NOTE 2 ACCOUNTING ESTIMATES AND JUDGEMENTS For the preparation of the Interim Financial Report, Management makes various accounting estimates and judgements that affect the application of accounting policies and the recognition of assets, liabilities and income and expense items. Actual operating results may deviate from such estimates. Critical accounting estimates and judgements are consistent with those applied in the 2013 consolidated financial statements. NOTE 3 SEGMENT INFORMATION
Condensed income statement
(DKKm) YTD 2014 YTD 2013 YTD 2014 YTD 2013 YTD 2014 YTD 2013 YTD 2014 YTD 2013 YTD 2014 YTD 2013
Revenue 16,181 14,897 18,110 17,152 4,186 4,090 625 531 39,102 36,670
Intercompany revenue (709) (619) (1,529) (1,480) (257) (225) (564) (493) (3,059) (2,817)
Net revenue 15,472 14,278 16,581 15,672 3,929 3,865 61 38 36,043 33,853
Gross profit 3,389 3,181 3,256 3,241 1,026 1,064 11 (7) 7,682 7,479
Other external expenses 720 688 760 729 311 337 (265) (241) 1,526 1,513
Staff costs 1,446 1,405 1,735 1,697 413 411 198 177 3,792 3,690Amortisation and depreciation of intangibles, property, plant and equipment
80 78 98 98 118 124 93 96 389 396
EBIT before special ite ms 1,143 1,010 663 717 184 192 (15) (39) 1,975 1,880
Total assets 14,422 13,912 10,651 11,167 3,901 3,641 (4,390) (4,911) 24,584 23,809
Total liabilities 10,464 10,695 7,913 7,315 3,658 3,416 (3,680) (3,524) 18,355 17,902
Air & Sea Road TotalSolutions
Other activities, non-allocated items and
eliminations

Page 19 of 19 INTERIM FINANCIAL REPORT DSV COMPANY ANNOUNCEMENT NO. 568 29 OCTOBER 2014
Statement by the Executive Board and the Board of Directors The Board of Directors and the Executive Board have today considered and adopted the Interim Financial Report of DSV A/S for the nine-month period ended 30 September 2014. The Interim Financial Report, which has not been audited or reviewed by the Company auditor, has been prepared in accordance with IAS
rim financial reports of listed companies. In our opinion, the Interim Financial Report gives a true and fair view of the DSV Group's assets, equity, liabilities and financial position at 30 September 2014 and of the results of the Group's activities and the cash flow for the nine-month period ended 30 September 2014. We also find that the Management's commentary provides a fair statement of developments in the activities and financial situation of the Group, financial results for the period, the general financial position of the Group and a description of the major risks and elements of uncertainty faced by the Group. Hedehusene, 29 October 2014
Executive Board: Jens Bjørn Andersen Jens H. Lund CEO CFO
Board of Direc tors: Kurt K. Larsen Erik B. Pedersen Annette Sadolin Chairman Deputy Chairman Birgit W. Nørgaard Thomas Plenborg Robert Steen Kledal