interferometry: principles and applications of two-beam ... bulletin... · 2 interferometry:...
TRANSCRIPT
1
TECHNICAL BULLETIN
INTERFEROMETRY PRINCIPLES AND APPLICATIONS OF TWO-BEAM AND MULTIPLE-
BEAM INTERFEROMETRY
By Prof Hiroshi Komatsu Institute for Materials Research
Tohuku University Sendai Japan
2
INTERFEROMETRY PRINCIPLES AND APPLICATIONS OF TWO-BEAM AND MULTIPLE-BEAM
INTERFEROMETRY
By Prof Hiroshi Komatsu Institute for Materials Research
Tohoku University Sendai Japan Applications of optical interference have already been studied for several hundred years The principles of interferometry are well established and varied types of interferometric apparatus have been devised Moreover even now new measurement techniques employing interference phenomena are under development Interferometric apparatus although comparatively simple and easy to operate permits high precision measurement and is therefore in wide use The present exposition will be principally concerned with the use of two-beam and multiple-beam interferometry for the measurement of minute differences in elevation on material surfaces as illustrated by practical examples Explanations of basic principles will be limited to those aspects necessary for the use of interferometry more details may be found in textbooks of optics or in Nikon Technical Bulletin No 4 entitled ldquoFundamentals of Opticsrdquo by Yutaka Takenaka Those readers who wish to delve into more specialized aspects of interferometry may consult the three textbooks by Tolansky cited at the end of the present Bulletin
3
CONTENTS
TWO-BEAM INTERFEROMETRY 4 NEWTONrsquoS RINGS 4
APPLICATIONS OF CONTACT METHOD 6
MICHELSON INTERFEROMETER 8
NONCONTACT INTERFEROMETRIC INSTRUMENTS 9
(1) Watson interference objective9 (2) Linnik interferometer10 (3) Mirau interference objective 10 (4) Nikon low magnification interference objective 11
POINTS REQUIRING ATTENTION IN APPLICATIONS OF INTERFEROMETRY 12
MEASURING DIFFERENCES OF ELEVATION13
ABSOLUTE LEVEL DIFFERENCES AND LIMITS OF MEASUREMENT 15
MULTIPLE-BEAM 17
INTERFEROMETRY 17 CHARACTERISTICS OF MULTIPLE-BEAM INTERFERENCE PATTERNS17
CONDITIONS FOR HIGH PRECISION MEASUREMENT 18
OPTICAL SYSTEMS FOR MULTIPLE-BEAM INTERFEROMETRY 19
PREPARATION OF SPECIMEN 20
(1) Cleaning of specimen and reference plate 20 (2) Vacuum deposition 21
PRACTICAL APPLICATIONS OF MULTIPLE-BEAM INTERFEROMETRY 21
CONCLUSION 25
REFERENCES 25
4
PART I TWO-BEAM INTERFEROMETRY PRINCIPLES AND APPLICATIONS
Among the various forms of interferometry two-beam interferometry is especially simple and straightforward in principle as well as practice and is therefore used in a broad range of applications This method will be described below with principal reference to applications devised for the measurement of topography of material surfaces
NEWTONrsquoS RINGS The interference phenomenon which one first encounters in high school physics is that of Newtonrsquos rings which constitute the localized concentric interference fringes observed in the neighbourhood of the point of contact when a plano-convex lens with a large radius of curvature is placed on a flat glass plate These interference rings were first studied by Isaac Newton Interference phenomena cannot be explained by merely regarding light as composed of rays which propagate along straight lines as is assumed in geometrical optics Subsequent to Newton Young proceeding from the viewpoint of wave optics explained Newtonrsquos rings as a light interference phenomenon That is light is a wave motion possessing crests and valleys if crests are superimposed upon crests and valleys upon valleys then the waves will be mutually reinforced whereas if crests are superimposed upon valleys then the two will mutually cancel Consequently an alternately bright and dark interference fringes will arise
The distance corresponding to one period of the light wave say between one crest and the next one is called 1 wavelength and is conventionally denoted by λ Newtonrsquos rings successively appear as the air gap between the glass plate and the lens surface increases by half a wavelength Therefore if one uses incident light of different wavelengths corresponding say to red and green then the interval between successive rings will be wider for red light than for green
Figure 1(a) shows the Newtonrsquos rings formed when an evaporating dish of diameter 10cm was placed on a slide glass on the stage of an inverted microscope photographed from below with reflected light The order of the interference fringes counted from the dark disk at the centre in the pattern is denoted by N (N = 0 1 2 hellip) When dealing with optical interference it is important to note that the light waves are superimposed in the medium through which the light propagates (ie considering interference in terms of optical distance) If the gap between the lens and the glass plate is in a vacuum or in air then the refractive index (n) of the medium is 1 On the other hand if this gap is filled with water then n=1333 thus when traversing this medium the velocity of the light is diminished hence the wavelength is essentially shortened and therefore the distances between successive rings are reduced Conversely this fact can be utilized for the purpose of measuring the refractive index of the medium
5
If the angle of incidence of the light waves is denoted by oslash and the thickness is (ie distance) between the glass plate and the lens by t then interference fringes will appear when the condition
N λ = 2nt cososlash
is satisfied In the case illustrated by Figure 1 the angle of incidence oslash = 0 cososlash = 1 (as would always be the case for perpendicular incidence) and therefore the above relation becomes
N λ = 2nt
hence we obtain
t= Nn λ2
Thus in a vacuum or in air since n = 1 the relation reduces to
t= N λ2
where N = 1 2 3 hellip can be any positive integer Thus each time the thickness of the gap changes by λ2 (ie by half a wavelength) an interference fringe appears
Now let us examine Figure 1(a) once again The interference fringes appear like contour lines on the surface of the evaporating dish at intervals corresponding to height differences of half a wavelength This is equivalent to the contour lines formed by Newtonrsquos interference fringes at intervals of half a wavelength on the surface of an object
In the case of a map the sea level constitutes the reference plane while in the case of the interference fringes the glass plate is the reference In optical interferometry this reference plate is known as the reference plate (or reference mirror) Also this type of interference pattern is known as ldquofringes of equal thicknessrdquo
Figure 2 illustrates the relation between the spacing of the interference fringes and the angle of the air wedge formed by a reference plate (reference mirror) and the surface of the specimen In this case from the above discussion the interference fringes are obviously not circular like Newtonrsquos rings but form straight lines
6
As the angle increases the spacing between the interference fringes diminishes
Figure 3 shows the intensity distribution of the interference fringes of the Newtonrsquos rings in Figure 1 (a) measured with a microphotometer We see here broad contour lines In a topographic map the finer the contour lines the more delicate the details which can be represented Similarly the breadth of the interference fringes governs the precision obtainable in the interferometric measurement of the irregularities of a surface The present method has the disadvantage that the specimen must be placed in contact with the reference plate (reference mirror)
APPLICATIONS OF CONTACT METHOD
Figure 4 (a) shows a natural diamond with edges 08mm in length examined by the Newtonrsquos rings method which was illustrated above for the case of a lens The specimen was illuminated with light of wavelength λ=546nm (green) obtained by means of a multilayer filter Using this simple method half wavelength (273nm) contour lines can be visualized on the specimen Since the horizontal distances are known immediately from the magnification or the scale the angle of inclination of the surface can be calculated Furthermore it is possible to obtain the cross-sections which will appear when the diamond is cut in various directions Since light of accurately known wavelength is used height can be measured with extremely high precision The protuberance of this diamond surface is 12 λ high ie approximately 65 μm and the inclination of the surface is measured approximately 1ordm 16
7
Figure 4 (b) shows the microstructure of the surface ignoring quantitative measurement This sort of image can be obtained if the angle of the wedge indicated in Figure 2 is close to zero This has the effect of broadening the interference fringe of the zeroth order which then covers the entire field of view If the wedge angle is completely reduced to zero the surfaces of the crystal and the reference plate become completely parallel This method of broadening a single interference fringe to attain high contrast is known as the high dispersion method and permits the visualization of height differences as small as 2 nm
The high dispersion method utilizes the fact that a single interference fringe actually possesses a continuous intensity distribution in terms of the air gap as shown in Figure 5 Corresponding to an infinitesimal height difference dt the intensity within a single interference fringe changes by dI as depicted in Figure 5 by using the portion of curve with a relatively large value of dIdt one can observe detailed surface structure with high sensitivity
Moreover in this method halos of the kind seen in phase contrast microscopy do not occur and the entire surface can be visualized with high contrast from any direction The disadvantage of this method is extreme sensitivity to mechanical vibration and consequent difficulty in maintaining the same contrast over an extended period of time
Figure 6 shows etch pits on a (111) surface on a diamond after etching by an oxidant a high dispersion fringe was visualized by two-beam interference The image clearly shows two types of etch pits flat bottomed and point bottomed The flat-bottomed pits are extremely shallow with depths of about one fourth of a wavelength (137nm) or less On the other hand calculating from the number of interference fringes the deepest point-bottomed pits are about 3 wavelengths (164 μm) deep Also the interference fringes on the rim of the crystal (on the right-hand edge of the picture) show that the edge of the crystal has been rounded by the action of dissolution Moreover since the length of the sides of the pits can be measures the gradient of the
8
pits can be calculated The inclination of the deepest pit in the direction from a vertex to the centre is approximately 8ordm 50 Thus the slope of the pits as determined quantitatively are in fact considerably more gentle than would appear from casual inspection Figure 6 illustrates an example where both observation and measurement can be made with a single photomicrograph
We have now seen examples of surface microstructure resulting from crystal growth and dissolution visualized by two-beam interferometry Finally let us consider an example of a fracture surface produced by physical destruction Figure 7 shows a two-beam interferometric photomicrograph of the cleavage plane produced in a diamond by a giant pulse laser with the two sides of the plane matched for comparison The fact that the two sides are not completely identical indicates that some fragments albeit minute were lost when the crystal was cleaved A triangular depression appears at the centre of the left-hand margin of the photograph this is the point where the laser beam was focused by the lens The traces on the surface show that the light instantaneously traversed the diamond and was partially reflected at the opposite wall the depression in the centre of the photograph was produced when this reflection occurred Also one can discern that the fracture was initiated within the crystal at a point about 100 μm from the reflecting surface
So called ldquofractographyrdquo consists in examining fracture surfaces by light or scanning electron microscopy and analyzing the fracture mechanism on the basis of the observed patterns In this analysis two-beam interferometry can be applied to obtain quantitative information concerning the topographic irregularities of the fracture
surface and the stream-like configuration known as the ldquoriver patternrdquo
MICHELSON INTERFEROMETER
All the interference patterns described above are created by methods whereby the surface of the specimen is placed nearly in contact with the reference disk However in the case of specimens such as semiconductors which are extremely sensitive to contamination or soft and easily deformed specimens it is desirable to form an interference pattern without contact One such method consists in using a Michelson type interferometer This device has several variants
The principle of the Michelson interferometer as illustrated by Figure 8 is quite simple The essential points are as follows A beam emitted by the light source (L) is split into two beams of nearly equal
9
intensity by a half mirror (A) one of these beams being directed onto a flat reference mirror (M2) and the other onto the specimen surface (M1) The light produced by reflection of these two beams is then made to interfere Viewed at point E interference occurs between the image M2 of the reference mirror and the image of the specimen surface M1 Since the light waves reflected by M1 and M2 originate from the splitting of a beam emitted by the same light source these waves are mutually coherent and consequently a two-beam interference pattern is obtained The object C inserted between A and M2 is a glass plate of the same composition and thickness as A Owing to the presence of this plate the two divided light beams arrive at E after propagating through the same optical distance (ie refractive index x thickness)
Note that in this type of interferometer A and M1 are separated by and appreciable distance thus an interference pattern is obtained without contact
NONCONTACT INTERFEROMETRIC INSTRUMENTS
A two-beam interferometer functions by dividing originally coherent light into two beams of equal intensity directing one beam onto the reference mirror and the other onto the specimen and measuring the optical path difference (ie difference in optical distances) between the resulting two reflected light waves In order to implement this method various types of instruments have been devised employing several devices to split the light wave and to provide the appropriate optical paths
(1) Watson interference objective
This instrument manufactured by the Watson Company (Great Britain) is a compact variant of the Michelson interferometer designed to be installed on a microscope The construction of the instrument is shown in Figure 9 As one sees by comparing this drawing with the schematic illustration in Figure 8 an objective lens is interposed close to the half mirror permitting the measurement of minute specimens
In this interferometer the inclination of the reference mirror with respect to the optical axis is equivalent to using a reference plate which is not parallel to the surface of the specimen and thus creating an air wedge as indicated in Figure 2 The greater the inclination of the reference mirror relative to the specimen surface the narrower the spacing between the interference fringes The direction of the individual interference fringes is the same as the direction of the line of intersection of the planes M1 and M2rsquo Shifting the reference mirror in the left or right direction has the effect of varying the distance between the specimen surface M1 and the image M2rsquo is
10
shifted away from M1 by a distance of half a wavelength the respective orders of the interference fringes are changed by 1 A shift through one fourth of a wavelength inverts the pattern by transforming bright fringes to dark fringes and vice versa
(2) Linnik interferometer
This instrument is designed for the purpose of using a high magnification objective lens in order to apply the interference technique to the observation of minute details The principle employed is just that of the Michelson interferometer Figure 10 shows the basic arrangement comprising a light source L a collimator C a prism D and Eyepiece E uniform objective lenses O and Orsquo with completely
identical optical distances a specimen surface S which gives rise to an image F and a reference mirror M which gives rise to a reflection image Mrsquo Since uniform objective lenses are difficult to manufacture only a small number of such instruments have been marketed
(3) Mirau interference objective
This is an interference objective with comparatively high magnification (10x 20x or 40x) used in instruments produced by the Nikon Corporation The principle of the device as
11
illustrated in Figure 11 consists in placing a reflection reference mirror in the centre of the objective lens and interposing a half mirror between the objective lens and the specimen These components are so arranged that an interference pattern will appear if the system is focused upon the specimen If the specimen (S) is inclined localized interference fringes will appear as previously explained in the description of two-beam interferometry Of course non-contact measurements can be performed with this instrument
(4) Nikon low magnification interference objective
Figure 12 shows the design of the new type of low magnification interference objective (TI 25x and 5x) recently developed by Nikon The use of a low magnification objective has two advantages First the working distance is comparatively long (111mm for the 25x objective and 9mm for the 5x objective) Secondly a wide field of view can be observed with a large depth of focus The outstanding feature of this interference objective is the fact that the centre of the reference mirror lies on the optical axis of the objective lens
In order to realize this feature the reference mirror is located on the plane surface of a hemisphere The angle of the mirror is adjusted by means of two screws behind the hemisphere Bright field observation can also be performed immediately by inserting a light-blocking shield in front of the mirror
In actual use since the centre of the reference mirror coincides with the optical axis the interference pattern immediately appears a the centre of the field of view When using the above-mentioned Watson interferometer or Mirau objective displaying the interference pattern at the centre of the field of view often requires troublesome manipulation and this tends to prevent more widespread use of interferometry Also since the present lens is suitable for the number of field of view up to 20 and the maximum diameter of the actual field is equal to the number of field of view divided by the magnification specimens of diameters up to about 8mm (for magnification 25x) or 4mm (for magnification 5x) can be interferometrically measured by a single observation
12
If graduations are inscribed on the reference mirror then the scale can be conveniently recorded on the photomicrograph In the Watson interferometer special illumination is required for the interference objective but this is not necessary for the Nikon TI or Mirau instruments the same light path is used for bright field observation and interferometric measurement
POINTS REQUIRING ATTENTION IN APPLICATIONS OF INTERFEROMETRY
In the preceding discussion several examples of practical two-beam interferometry have been described referring to a conventional classification into contact and non-contact methods However there is actually no essential difference in the nature of the interference fringes between these two methods and obviously both low and high spread patterns are obtainable by either method The non-contact method clearly possesses a wide range of applicability In the contact method the order of the interference fringes increases from the zeroth first and second etc in a unidirectional manner since the reference surface and the specimen are separated by a wedge-like air gap On the other hand in the non-contact method the intersections between the images of the reference mirror and the specimen form the fringes of zeroth order on both sides of which first order second order and higher order fringes appear This sort of pattern is shown in Figure 13 (b) which was deliberately taken without a filter using white light and therefore the orders of the fringes are readily distinguished A zeroth order dark fringe is visible in the centre of the field flanked on both sides by higher order fringes The orders of the
fringes are easily recognized if one observes the red fringes Up to six orders of red fringes appear on the right side and up to five orders of red fringes on the left side of the zeroth order fringe
If this pattern were photographed with monochromatic light the interference pattern would be displayed with almost the same contrast but the continuity of the
13
fringes would become obscure at the sides of abrupt changes in level Consequently in any type of interferometry the continuity of the fringes should first be ascertained with white light in order to avoid substantial errors Identification of the orders of interference fringes under monochromatic light is particularly difficult when using high grade interference filters with narrow half-band width
Precision of measurement is improved by creating finer interference fringes Formerly light sources such as low pressure sodium lamps were used for this purpose Now however high grade interference filters are available and therefore halogen lamps are often used in combination with interference filters In such case two points should be noted First unlike the use of sodium light the maximum transmitted wavelength usually varies to some extent according to the particular interference filter being used Therefore it is most important to precisely ascertain the characteristic wavelength of the filter Secondly the filter must be inserted perpendicular to the optical axis since even a slight obliquity will cause a shift toward shorter wavelengths
MEASURING DIFFERENCES OF ELEVATION
The measurement of vertical surface irregularities and topography using contour lines has already been discussed and illustrated in Figures 4 and 6 Here we shall describe an example wherein such irregularities are measured using tree interference fringes Figure 14 shows differential interference (a) and two-beam interference (b) photomicrographs of the edge of a razor blade which permit the
determination of the roughness of the mechanically finished surface
Here also the relation between the reference mirror and the specimen is similar in principle to the case of Figure 2 the interference fringes successfully appear as the height changes by half a wavelength Suppose that corresponding to an abrasion groove of depth t in Figure 14 interference fringes appear as shown in Figure 15 If the photomicrograph is enlarged then both d and l can be measured Using these values
14
the depth t can be calculated from the formula
t = dl λ2
The spacing of interference fringes shown in Figure 14 is somewhat narrow which could make measurement difficult Using the same specimen suppose that the dispersion of the interference fringes is altered Figure 16 shows the spiral growth of magnetoplumbite (a hexagonal ferrite) with the angles of the hexagonal spiral displaying a zigzag form The dispersion in Figure 16(b) is small and the shifts in the interference fringes are not evident except at the thickest steps but nevertheless the orders of the fringes can be enumerated If the dispersion is increased to the extent of Figure 16(c) then the characteristics of the irregularities at the thin as well as the thick steps become visible The fringes at the
centre of the image are particularly interesting Since the pattern is due to spiral growth the fringes should uniformly shift in the same direction but here the individual fringes are not only rectilinear but also display a minute transverse oscillatory pattern This can be interpreted as indicating a cross section of the form illustrated in Figure 17 The levels indicated by the broken lines represent the spiral steps formed immediately after the growth of the crystal the successive level differences being of the order of 12nm This is due to the crystal undergoing quasi-two dimensional dissolution resulting in the present cross-section represented by the crosshatching in Figure 17 analogous to the ridges now remaining in the Colorado plateau after a period of erosion In the present case the ridges are of the order of 60nm in height When the dispersion is
15
increased still further as in Figure 16(d) the image becomes more suitable for qualitative observation than for measurement Steps are well visualized although only at the sites where the interference fringes have expanded On the other hand when this specimen is viewed by bright field microscopy only the thickest steps are visualized
The point to be noted when measuring such steps is first of all that the interference fringes should be adjusted so as to run perpendicular to the steps which are to be measured which facilitates the subsequent procedure Also if colour photographs cannot be taken the specimen should first be observed with white light and the continuity of the interference fringes must be confirmed in order to facilitate subsequent measurement
When using a high dispersion a single interference fringe becomes relatively broad and therefore steps can be measured by comparing the width of the fringes themselves In such cases the width of the light and dark fringes becomes nearly equal as shown for example in Figure 16(c) In other words a single broad interference fringe in itself represents a level difference of 14
ABSOLUTE LEVEL DIFFERENCES AND LIMITS OF MEASUREMENT
In both Figures 4(a) and 6 triangular contour lines appeared but were interpreted ab initio as representing elevations in one case and depressions in the other However this distinction is by no means self-evident and was decided only on the basis of the a prior assumption that crystal growth results in elevations while etching results in depressions Thus one is faced with the problem of how to perceive the absolute distinction between depression and elevation If the level differences are relatively large then these can be distinguished by adjusting the focus of the objective but if the level differences are of the order of the wavelength of the light used in the observation then this cannot be done One possible method however is the use of a phase-contrast microscope By interchanging positive and negative phase-contrast one can reverse the contrast of the halo appearing at the high side of a step and thus definitely distinguish between high and low However this can in fact be accomplished by two-beam interferometry even without a phase-contrast microscope Using white light to examine the surface of a convex object the interference fringes are arrayed in increasing order from the vicinity of the reference plate (reference mirror) toward the periphery of the object As shown in Figure 13(b) the order of the fringes can be determined from their colour arrangement Conversely in the case of a concave object the order of the fringes increases from the periphery toward the centre That is it suffices to perform the measurements while bearing in mind the sequence of colours in the interference fringes and the size of the air gap
16
The limit of measurement of level differences depends upon the extent to which the breadth of the interference fringes (ie the skirts of the intensity peak) can be defined If measurement down to 110 of a fringe can be performed then the limit of measurement should be of the order of λ10 or roughly 25nm
Details can be found at H Komatsu ldquoOptical Characterization of Crystal Surfacesrdquo in ldquoCrystal Growth of Electronic Materialsrdquo edited by E Kaldis (North-Holland) 1985 p 359-370
17
PART II
MULTIPLE-BEAM
INTERFEROMETRY
PRINCIPLES AND APPLICATIONS
CHARACTERISTICS OF MULTIPLE-BEAM INTERFERENCE PATTERNS
The method of multiple-beam interferometry consists in situating two surfaces of high reflectivity in close proximity and using a lens to converge beams which have undergone multiple-reflection between the surfaces The case where the two opposed surfaces are parallel is utilized in Fabry-Perot interferometer If the two planes are not parallel then interference fringes appear localized in the wedge space The situation is essentially the same as that encountered in the wedge space in two-beam interferometry However in multiple-beam interferometry the breadth of the interference fringes becomes extremely narrow That is the contour lines on the ldquomaprdquo become narrow and precision of measurement of surface topography improves accordingly When the optimal conditions are satisfied the breadth of the fringes in multiple-beam interferometry is of the order of 150 of the corresponding breadth in the two-beam method and hence the precision is improved by a factor of about 50 Since as mentioned above the limit of measurement of level differences in two-beam interferometry is about 25nm the limit of measurement in multiple-beam interferometry is therefore of the order of 05nm (5 Angstroms)
As shown in Figure 19 when the incident light enters the wedge space multiple-reflection within the opposing surfaces occurs The beams arriving at point X in the figure include the unreflected beam 1 the twice-reflected beam 2 the fourfold reflected beam 3 etc At each reflection the intensity drops in accordance with the reflectivity of the surface and therefore the quantity of light of multiple-beams finally collected by the lens is governed by the reflectivity The greater the number of multiple reflections of the beams contributing to the interference the finer and sharper the fringes Figure 2 show the relation between the breadth of the interference fringes and the reflectivity for the case where the reflectivities of the specimen surface and the reference plate
18
(reference mirror) are identical Thus the reflectivity determines the breadth of the interference fringes
A comparison between the intensity distributions of two-beam interference fringes and multiple-beam interference fringes corresponding to 90 reflectivity is shown in Figure 21(a) The two-beam interference fringes are of the form (cosq)2 and the breadth of the ridges and valleys is nearly the same On the other hand as shown in Figure 21(b) the multiple beam-interference fringes display a sharply peaked intensity distribution As in the case of two-beam interferometry successive interference fringes appear localized at every level change of half a wavelength However since the fringes are narrow information concerning the regions between the fringes
tends to become unavailable
CONDITIONS FOR HIGH PRECISION MEASUREMENT
Proceeding from the Airy formula for multiple reflection between parallel plane surfaces Tolansky performed a detailed analysis of the intensity distribution of the multiple-interference fringes appearing in a wedge space and from the results of this study deduced the conditions for obtaining the highest measurement precision as summarized by the following five points
(1) Coating the surface of the reference plate with a film of high reflectivity and low absorption
(2) Coating the specimen with a uniform film of high reflectivity faithfully conforming with the original topography of the specimen
(3) Making the distance between the two surfaces (t in Figure 19) as small as possible ie at most 10μm and preferably of the order of the wavelength of the light
(4) Collimating the incident light beam to a parallelism within 3ordm
(5) Making the incident light as closely perpendicular to the reference plate as possible
Conditions (4) and (5) are comparatively easy to satisfy provided (3) is satisfied In other words the surfaces of the reference plate and the specimen should be brought into close proximity reducing as far as possible the distance t in Figure 19 and the surface of reference mirror should be coated with silver vapour deposition or multi-layer film of low absorption
19
OPTICAL SYSTEMS FOR MULTIPLE-BEAM INTERFEROMETRY
The basic function of optical systems for multiple-beam interferometry is merely to permit observation of the interference pattern appearing in the wedge space formed by two surfaces Observation of the fringes produced by reflection can be performed with a microscope in two possible ways Figure 22 shows an optical system appropriate for the measurement of film thicknesses etc using a low power objective lens Since the working distance of the low power objective is relatively long a half mirror can be inserted between the objective and the specimen Also the low power objective possesses the advantage of a large depth of focus which permits observation over a wide field of view
However a high magnification objective lens is necessary for measurement of the minute topography and relief features of the specimen Then since the working distance is reduced to less than 1mm an optical system of the type depicted in Figure
23 must be used This is the optical system of an ordinary reflecting microscope It is ideal to converge the light at the rear focal point of the objective so that the light beam is directed perpendicularly to the specimen surface Commercially available objective lenses are tolerably suitable for this purpose
Low pressure mercury lamp of the type used for spectroscopy was formerly employed as light source in such interferometric system Using this type of lamp sharp spectral lines can be obtained moreover the spectral arrangement of colours can be used to identify the sequential order of the interference fringes The disadvantage of these lamps is dimness
Recently however bright halogen lamps combined with interference filters have come into general use for this purpose With achromatic objectives 546 green monochromatic light is the least expensive type of illumination and also provides excellent results
20
PREPARATION OF SPECIMEN
(1) Cleaning of specimen and reference plate
Adequate preparation of the specimen is essential in order to obtain the highest precision in multiple-beam interferometry Since level differences of atomic dimensions are to be measured contaminants must be removed from the surface Therefore the surface should be thoroughly cleaned except for cases where the surface is mechanically weak or the specimen is chemically unstable This also applies to cleaning of the reference flat Commercially marketed multiple-beam interferometric sets provide a selection of multilayer optical flat with various reflectivities matched to the reflectivity of specimens (cleaning of these plates may erode the coating and therefore requires great care) This also permits the formation of multiple-beam interference fringes but nevertheless as illustrated in Figure 20 the sharpness of the fringes depends upon the reflectivities of the
specimen and the reference plate therefore imparting a high reflectivity to both surfaces is the most effective means of ensuring the formation of a distinct pattern
Especially small specimens should be cleaned after first being mounted on a slide glass with Canada balsam etc Chemically and mechanically robust materials such as glass and quartz should be cleaned by the following procedure
Apply a small quantity of a suitable surfactant (such as a detergent of the type used for kitchen utensils) to a wad of absorbent cotton and remove the dirt from the specimen by vigorous scrubbing Ultrasonic cleaning is also suitable for this purpose However grease is not easily removed without scrubbing
Wet a wad of absorbent cotton with hydrogen peroxide and clean in the same manner as described in
Next clean the specimen in the same manner with distilled water
21
Wipe the surface thoroughly with dry absorbent cotton until the fog disappears instantly after breathing onto the surface
(2) Vacuum deposition
Specimens with low reflectivity should be coated with a material such as aluminum silver or gold by vacuum deposition Silver is particularly easy to apply and is also of high reflectivity
A vacuum-deposited silver film of thickness 50-100nm is appropriate Coating should be performed by rapid vapour deposition so as to be completed in 20 to 30 seconds In order to accomplish this a sufficient quantity of silver is placed in a vapour deposition boat and a shutter is interposed between the specimen and the boat After the silver is white hot the shutter is opened and then closed providing a simple means of controlling the thickness of the coating by varying the shutter time In this setup the distance between the specimen and the boat should be 20-30cm or more
If the thickness of the silver film is roughly 50-100nm then the film will appear bluish-violet when viewed against a bright light source If the film is excessively thick then the surface will behave like a mirror and will not transmit light
The quality of the silver film on the reference plate can be evaluated as follows If the silvered surfaces of two such plates are opposed and subtend a wedge as in Figure 24 and a bright light source is viewed through the wedge then a sequence of similar images of the light source will appear If one counts the number of these images then the presence of 25 or more indicates a satisfactory vapour-deposited film with a reflectance of at least 90 As a rough criterion the more slowly the colour of the images shifts from blue to red the better the quality of the film
Vapour-deposited silver films can be easily removed with organic solvents (alcohol benzene xylene acetone etc) Hydrogen peroxide is suitable for removing vapour-deposited silver films from mounted crystal specimens without affecting the balsam mounting Used photographic plates etc may be employed as optical flats In many commercial products reflectivity is increased by a multilayer coating and a comparatively hard coating is applied to the surface of the reference flat Silver vapour deposited reference flats are discarded after use but plates with multilayer coatings can be used repeatedly However if surfaces are even slightly scratched or otherwise damaged then the plates cannot be used for interferometry
PRACTICAL APPLICATIONS OF MULTIPLE-BEAM INTERFEROMETRY
When surface topography is measured by multiple-beam interferometry then the specimen and the reference plate make contact at some point Hence this method is not appropriate for specimens which are sensitive to contamination or for
22
very soft specimens Moreover specimens which for some reason cannot be coated with silver are not suitable
As already mentioned in the above discussion of conditions for sharpness of interference fringes the closest possible proximity of the specimen and the reference plate is essential In order to realize this the specimen and reference flat are clamped in a jig with three screws and one must adjust while observing the interference fringes through a microscope As in the case of two-beam interferometry the pattern must be adjusted so that the fringes appear perpendicular to the step to be measured and the dispersion of the fringes is also adjusted Measurement can be performed if at least three fringes appear in the view field
The continuity of the interference fringes can be ascertained from the colour arrangement of the fringes formed under illumination by white light as in two-beam interferometry For example suppose that the interference pattern is observed using a 546nm filter with a low pressure mercury lamp of the type used for spectroscopy and that a shift of the fringes appears as shown in Figure 25(a) Obviously the upper and low rows of fringes have been mutually displaced by a step on the surface but the original manner of continuity of the fringes is not evident If the monochromatic filter is removed interference fringes with a yellow and orange spectral fringes appear and the proper connection of the fringes can be ascertained by comparing the arrangement of the coloured fringes In Figure 25(b) B-Brsquo represents a sequence of interference fringes of the same order while in Figure 25(c) the fact that B-Crsquo represents interference fringes of the same order is also obvious by inspection of the arrangement of the coloured fringes
The method of measuring the level difference from the amount of shift displayed by the fringes is similar to that described in the preceding discussion of two-beam interferometry and illustrated in Figure 15 However in the case of multiple-beam interferometry the spacing of the interference fringes is not necessarily equidistant and therefore height is calculated by the following method In Figure 25(b) for example the height h of a step can be determined by the following formula
Likewise in the case of Figure 25(c) the appropriate formula is
23
Figure 26 shows a multiple-beam interferometric photomicrograph of the pits called trigons in a natural diamond The larger depressions are 10-20nm in depth while those of the smaller ones are of the order of 2-4nm Figure 27 shows a multiple-beam interference pattern formed with transmitted light which can be observed in this case since the diamond itself transmits light Transmitted multiple-beam interference
shows bright fringes This contrasts with the opaque specimens which show dark fringes Light transmitted in specimens which possess double refractive indices forms exceedingly complicated interference patterns and therefore such specimens are not suitable for measurement by means of transmitted light In such cases reliable measurement of topographic irregularities can still be obtained by interference of reflected light
24
As already mentioned in connection with two-beam interferometry high dispersion interference permits the utilization of intensity variations due to extremely minute differences in height This is illustrated by the example of the trigons of a natural diamond shown in Figure 28 The surface shown here is almost the same as that shown in Figure 26 but in Figure 26 the surface of the specimen and the reference plate subtend a wedge so that a few number of interference fringes are formed However in the present case the two surfaces are positioned almost in parallel thereby spreading single fringe over a large area to facilitate detailed observation The contrast displayed by minute level changes can be enhanced to an even greater extent that is possible in the case of two-beam interferometry As shown in Figure 29 an elevation difference dt gives rise to an intensity difference dI The gradient of the intensity distribution of a multiple-beam interference fringe is far more abrupt than that of a two-beam interference fringe and the contrast due to minute level variations displays correspondingly greater sensitivity
25
Figure 30 shows a hexagonal ferrite crystal (magnetoplumbite) This is the same crystal as shown in Figure 16 Here Figure 30(a) is a portion of the multiple-beam interference pattern photographed at high magnification Figure 30(b) is a phase-contrast photomicrograph of the same portion superimposed upon an interference pattern In this manner level differences can be displayed quantitatively on a single photograph moreover one can compensate for the loss of information on the intermediate regions between fringes which results from excessive spacing between the fringes in the multiple-beam interference pattern
CONCLUSION The examples given constitute just a mere fragment of the vast field of applications of interferometry However the author hopes that these examples have served to illustrate the fact that the application of interferometry to various material phenomena such as synthesis dissolution fracture deformation and film formation permits the acquisition of information which would be difficult to obtain by other means To summarize interferometry is an extremely simple and high precision method and therefore can be used constantly with the same convenience as an ordinary ruler on onersquos desk In fact a conventional microscope can immediately be converted into an interferometer at any time by merely mounting an attachment
REFERENCES
S Tolansky Multiple-beam Interferometry of Surfaces and Films (Oxford Clarendon Press 1948)
S Tolansky An Introduction to Interferometry (Longmans 1955)
S Tolansky Multiple-beam Interference Microscopy of Metals (Academic Press 1970)
26
Nikon Instruments Inc 1300 Walt Whitman Road Melville NY 11747-3064 USA Phone 1-800-52-NIKON Fax 631-547-4033 Email nikoninstrumentsnikoninstrumentscom Web wwwnikoninstrumentscom Reprint of document originally printed in Japan (1991)
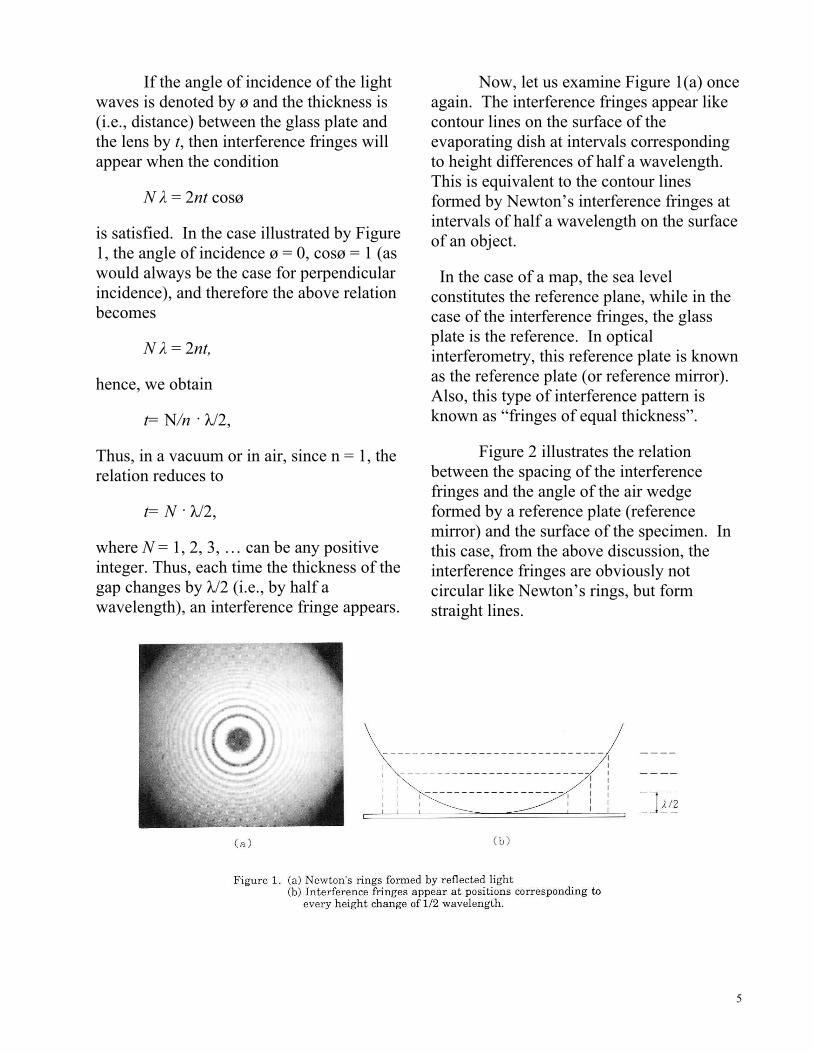
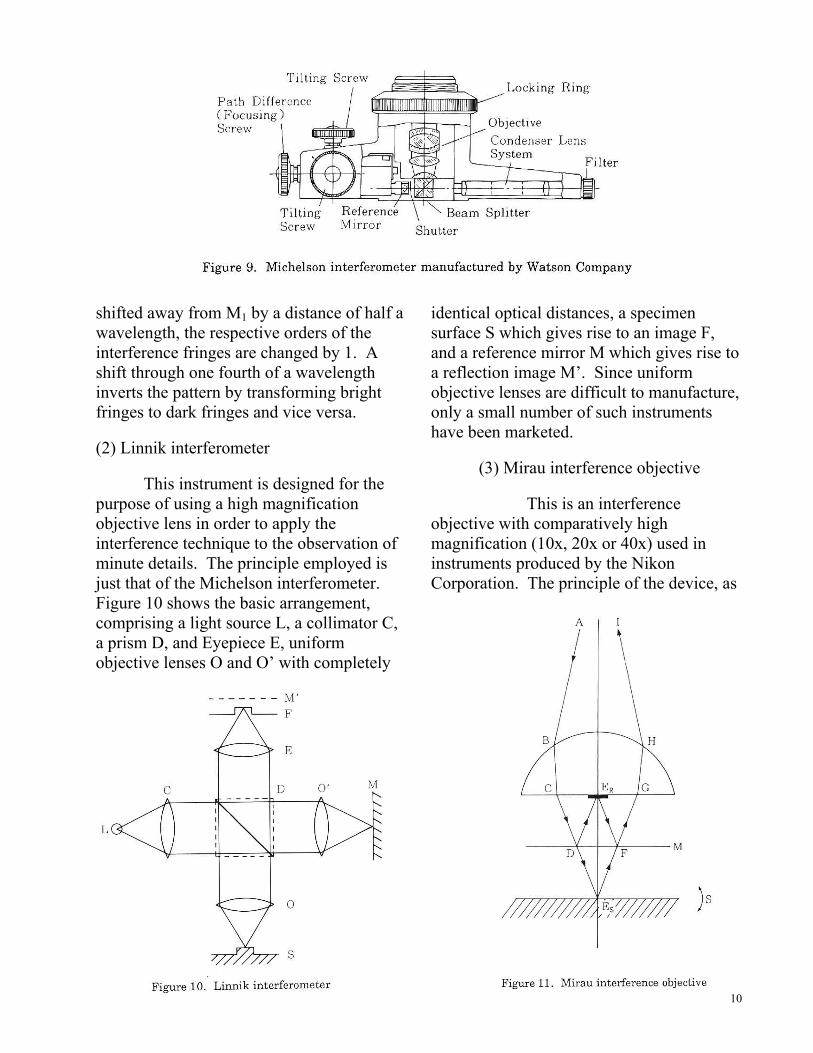
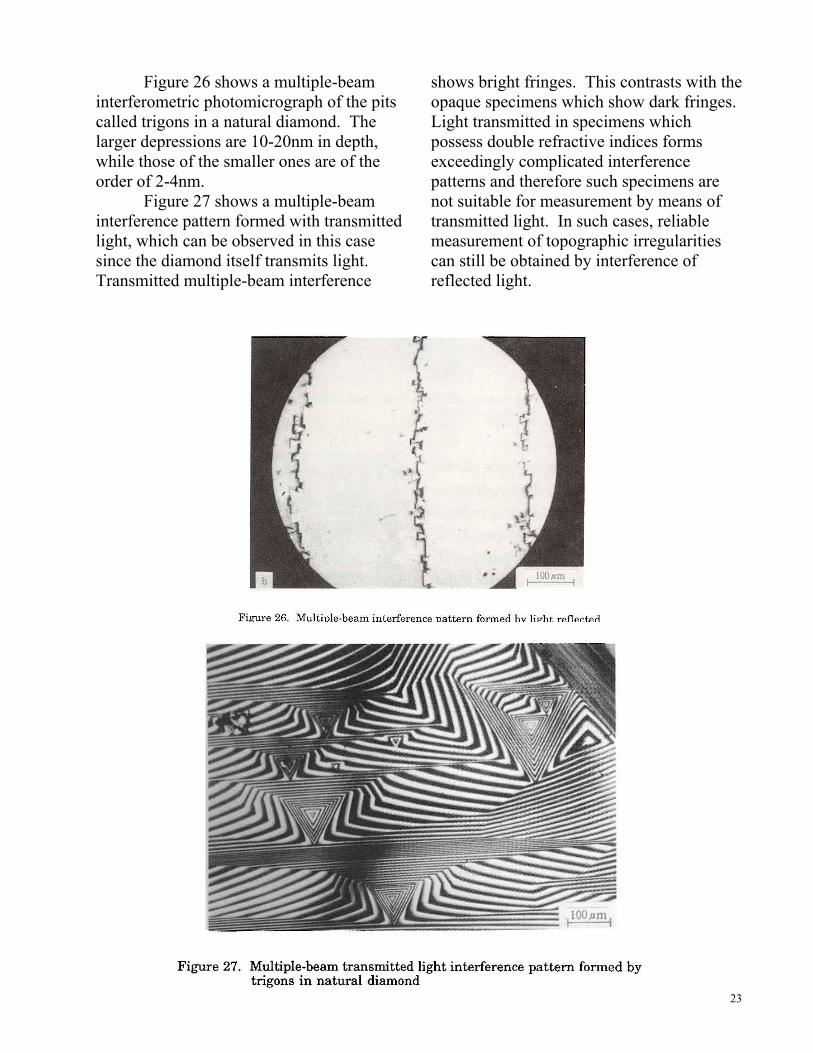
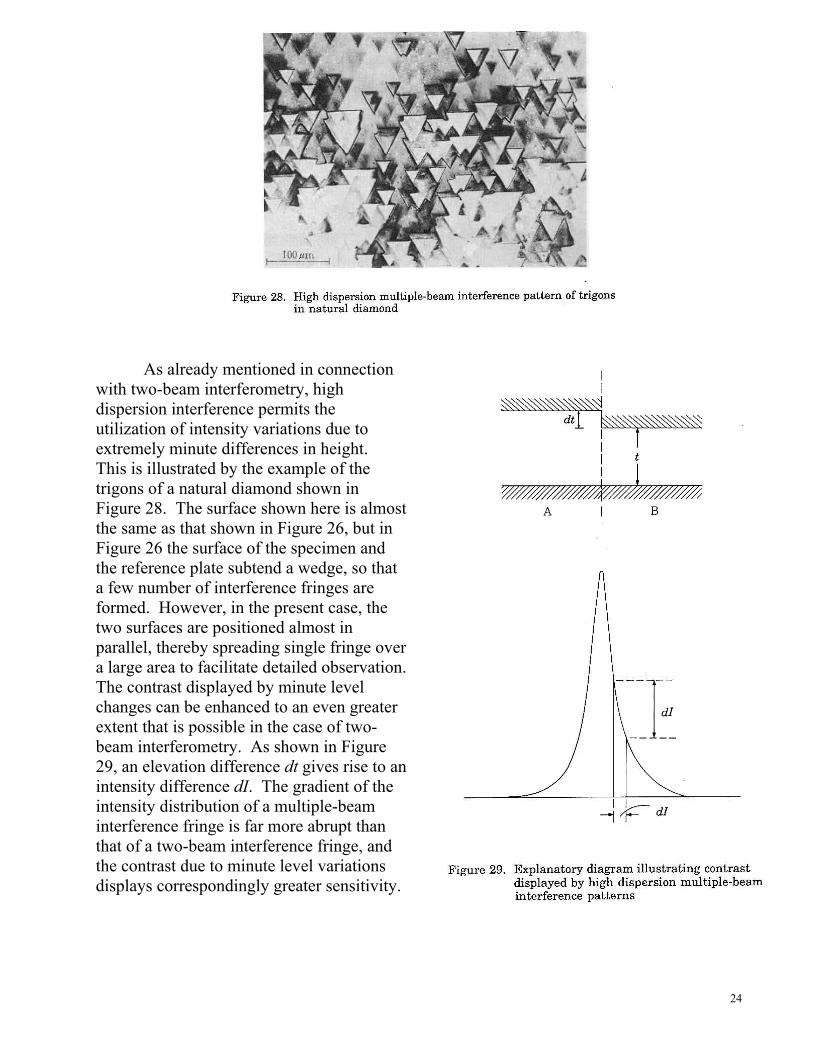
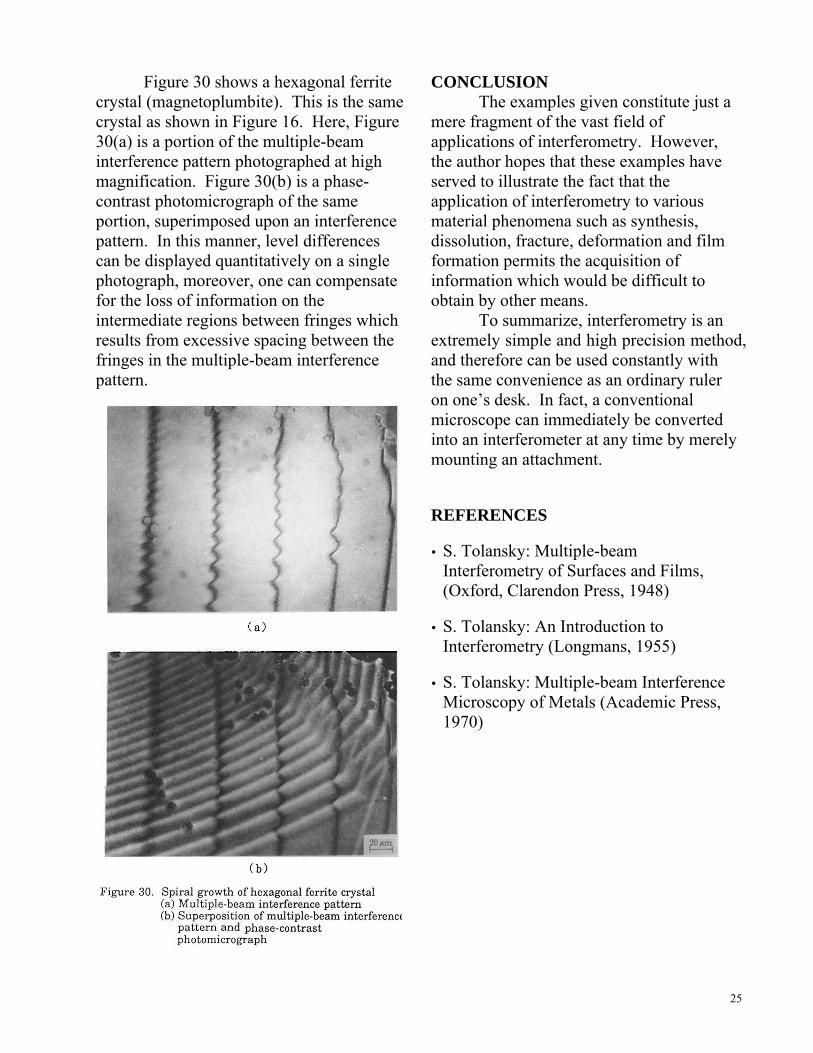

26
Nikon Instruments Inc 1300 Walt Whitman Road Melville NY 11747-3064 USA Phone 1-800-52-NIKON Fax 631-547-4033 Email nikoninstrumentsnikoninstrumentscom Web wwwnikoninstrumentscom Reprint of document originally printed in Japan (1991)