interesting things about alcohol and other drugs that you may have missed - march 2015
TRANSCRIPT

15 things about alcohol and other drugs you may have missedMarch 2015
Andrew BrownDirector of Policy, Influence and EngagementDrugScope
@andrewbrown365

National take home naloxone schemes should aim to issue 20 times as many kits as there are opiate-related deaths per annum; and at least nine times as many.
Meaning there needs to be a minimum of 9,000 (and ideally 20,000) naloxone-kits issued annually across England.Sources: http://informahealthcare.com/doi/abs/10.3109/09687637.2014.981509, http://www.mrc-bsu.cam.ac.uk/take-home-naloxone-and-naloxone-on-release-reduce-opioid-related-deaths/, http://www.nta.nhs.uk/uploads/whyinvest2final.pdf, https://www.gov.uk/government/uploads/system/uploads/attachment_data/file/119120/consideration-of-naloxone.pdf
In 2011 the cost of deaths related to drug
misuse was
£2.4bn
The estimated cost of providing 20,000 take home naloxone kits is £600k

Numbers of people with drug and alcohol problems claiming sickness benefits
Jan-10 Jan-11 Jan-12 Jan-13 Jan-140
20,000
40,000
60,000
80,000
100,000
120,000
IB/SDA Alcohol Misuse IB/SDA Drug Misuse ESA Alcohol Misuse ESA Drug Misuse
Source: https://www.gov.uk/government/publications/statistics-on-ibsda-and-esa-claimants-obesity-alcohol-or-drug-misuse-severe-stress

Number of people starting drug or alcohol treatment under community and suspended sentence orders in England & Wales in 2013
Drug Treatment Alcohol Treatment
9,122
5,886
4,510
2,601
Community Orders Suspended Sentence Orders
Source: https://www.gov.uk/government/uploads/system/uploads/attachment_data/file/399389/impact-of-short-custodial-sentences-on-reoffending.PDF

1% 11%
6%
68%
12% 0%1%0%0%
Offenders found guilty of drug offences at all courts, England and Wales, 2012 to
2013
Importation and ExportationProductionSupplyPossessionPossession with intent to supplyIncitement to supplyPermitting premises to be used for illegal purposesVienna Convention offencesMiscellaneous offences
N = 115,112
1%
3%
14%
17%
65%
Proportion of offenders sentenced to immediate custody for the possession of drugs in England and Wales, 12 months ending March 2014, by the number of
previous convictions
No previous convictions
One previous conviction
Between two and five previous convictions
Between six and 10 previous convictions
More than 10 previous convictions
N = 1,242
Source: http://www.theyworkforyou.com/wrans/?id=2015-01-29.222733.h&s=drugs#g222733.r0
Source: http://www.parliament.uk/business/publications/written-questions-answers-statements/written-question/Commons/2014-09-09/208713/
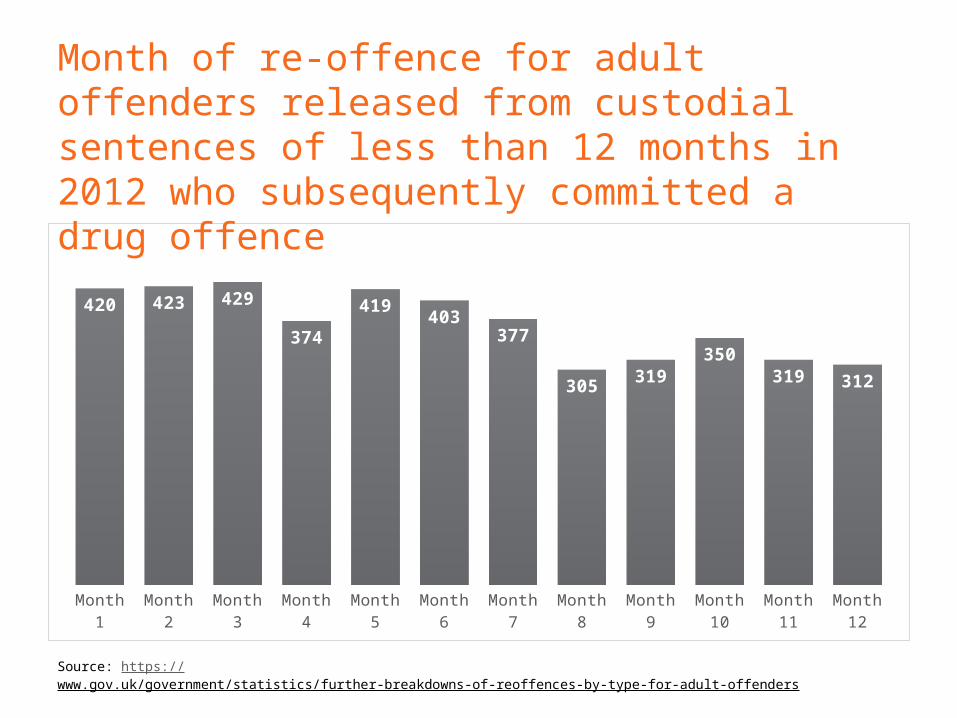
Month 1 Month 2 Month 3 Month 4 Month 5 Month 6 Month 7 Month 8 Month 9 Month 10 Month 11 Month 12
420 423 429
374
419403
377
305 319350
319 312
Month of re-offence for adult offenders released from custodial sentences of less than 12 months in 2012 who subsequently committed a drug offence
Source: https://www.gov.uk/government/statistics/further-breakdowns-of-reoffences-by-type-for-adult-offenders

Age-standardised alcohol-related death rates in the UK, per 100,000 of population
19941996
19982000
20022004
20062008
20102012
12.2
13.514.4
15.917.0
17.617.9
19.519.821.020.721.021.421.0
21.7
20.320.720.319.119.1
6.37.0 7.3
7.9 8.2 8.6 8.7 9.2 9.4 9.6 9.8 9.8 10.310.210.3 9.9 9.7 9.7 9.4 9.1
Males Females
Source: http://www.ons.gov.uk/ons/rel/subnational-health4/alcohol-related-deaths-in-the-united-kingdom/2013/stb---alcohol-related-deaths-in-the-united-kingdom--registered-in-2013.html
Rate per 100,000 population0
5
10
15
20
25
30
35
40
45
2.1
24.7
40
24.2
15 - 34 years 35 - 54 years55 - 74 years > 75 years

Alcohol-related violent incidents in England and Wales in 2013/14
Source: http://www.ons.gov.uk/ons/rel/crime-stats/crime-statistics/focus-on-violent-crime-and-sexual-offences--2013-14/sty-facts-about-alcohol-related-violence.html

As a proportion of all drivers who have taken drugs in the last 12 months how many have driven when they think they have been affected by their drug use?
11%
89%
At least onceNot at all
Source: https://www.gov.uk/government/statistics/reported-road-casualties-in-great-britain-provisional-estimates-involving-illegal-alcohol-levels-2013
Every day/almost every day
A few times a week
Once or twice a week
Once or twice a month
Once every couple of months
Once or twice in the last 12 months
0.0 1.0 2.0 3.0 4.0 5.0 6.0
0.8
0.3
0.9
2.1
1.8
5.4
Drug driving

Estimated number of reported drink drive accidents in Great Britain
2000 2001 2002 2003 2004 2005 2006 2007 2008 2009 2010 2011 2012 20130
2,000
4,000
6,000
8,000
10,000
12,000
14,000
Fatal Serious Slight
Source: https://www.gov.uk/government/statistics/reported-road-casualties-in-great-britain-provisional-estimates-involving-illegal-alcohol-levels-2013

2 0 1 1 - 1 2 2 0 1 2 - 1 3 2 0 1 3 - 1 4 -
1,000
2,000
3,000
4,000
5,000
6,000
7,000
3,665
5,898 6,073
Source: http://www.parliament.uk/business/publications/written-questions-answers-statements/written-question/Commons/2015-02-09/223902/
“Border Force classified seized drugs as having no commercial value when they were due for destruction, and notified the weight and type of goods to the driver of the contracted security company who transported the goods to incinerators. These consignments would have significant value to organised criminal groups, who might view them as an easy target. While Border Force had taken some steps to mitigate this risk, we remain concerned that the steps taken were insufficient. We therefore believe that managers at the highest level should be made aware of the risks that this practice represents, to determine whether they are content with the current disposal arrangements.”
Independent Chief Inspector of Borders and Immigration
The number of drug seizures by Border Force has gone up by 66% between 2011-12 and 2013-14
Source: http://icinspector.independent.gov.uk/wp-content/uploads/2014/12/Queens-Warehouse-Inspection-Report-FINAL-WEB.pdf

Early Intervention Foundation estimate of costs of ‘late intervention’ by outcome
Youth substance misuse hospital ad-missions
Child alcohol hospital admissions
16-17 year olds who are NEET
Child self-harm hospital admissions
Child injury hospital admissions
Child Protection Plans
Persistent absentees
Child mental health hospital admissions
Children in specialist substance misuse services
Permanent school exclusions
Young people in the YJS
Children in Need
Anti-social behaviour incidents
18-24 year olds who are NEET
Domestic violence cases
Looked After Children
£- £1,000 £2,000 £3,000 £4,000 £5,000 £6,000 £3 £9 £30 £40 £140
£280 £420 £440 £440 £450 £474 £570
£960 £3,690
£4,060 £5,150
Annual spend (£m, 2014–15 prices)
£ millions
“We use ‘Late Intervention’ as an umbrella term for a range of acute or statutory services that are required when children and young people experience significant difficulties in life, as well other support they may draw upon such as welfare benefits. This report provides initial estimates of the annual cost to the taxpayer of such Late Intervention. As an annual estimate it only captures the immediate fiscal costs, not longer-term impacts.”
Source: http://www.eif.org.uk/wp-content/uploads/2015/02/SPENDING-ON-LATE-INTERVENTION.pdf

Number of offenders sentenced to immediate custody for the possession of (a) class A, (b) class B and (c) class C drugs offence in England and Wales, 12 months ending March 2014, by the number of previous convictions Class A Class B Class C
7 7 012 22
2
7497
2
94109
9
398
366
43
No previous convictionsOne previous convictionBetween two and five previous convictionsBetween six and 10 previous convictionsMore than 10 previous convictions
Source: http://www.parliament.uk/business/publications/written-questions-answers-statements/written-question/Commons/2014-09-09/208713/

There were about 250 recorded incidents of NPS being thrown into prison in 2014
Compared with 36 in 2013
Source: http://www.theyworkforyou.com/debates/?id=2015-02-23a.92.2#g110.0

Freedom of Information request to police services
2 0 1 0 2 0 1 1 2 0 1 2 2 0 1 3 2 0 1 40
500
1000
1500
2000
2500
3000
3500
4000
56 128
368
1356
3652“For each of the last most recent four years for which figures are available, how many incidents have been recorded where the term ‘legal high’ has been logged?”
Source: http://www.centreforsocialjustice.org.uk/UserStorage/pdf/Press%20Releases%202015/CSJ-press-release---legal-highs---06.02.15.pdf

Percentage change in recorded crime by offence type between 2009/10 and 2013/14
Violence against
the person
Sexu
al offence
s
Robbery
Theft offences
Criminal d
amage and arson
Drug offences
Possessi
on of weapons o
ffences
Public order o
ffences
Miscella
neous crim
es against
society
-9%
21%
-23%
-13%
-37%
-16%
-28% -29%
-13%
Source: https://www.gov.uk/government/statistics/crime-outcomes-in-england-and-wales-2013-to-2014

Join DrugScope
From frontline drug and alcohol workers and organisations, to commissioners and funding agencies, DrugScope is the national membership organisation for the drug and alcohol field and is the UK’s leading independent centre of expertise on alcohol, drugs and their use.
For the latest treatment updates, policy, best practice and sector-wide news, join Drugscope today!
http://www.drugscope.org.uk/membership/join