intercomparison measurements in the field of … · intercomparison measurements in the field of...
TRANSCRIPT

INTERCOMPARISON MEASUREMENTS IN THE FIELD OF GAS FLOW
AND VOLUME
Providing comparisons of the test stations for verification of
the gas meters in the flow range (from 4 up to 160) m3/h.
The transfer device was a rotary gas meter Delta S-Flow, size G100
COOMET PROJECT № 412/UA/07
CIPM-MRA Supplementary Comparison COOMET.M.FF-S3 Denys Seredyuk (Ukraine), Stefan Makovnik (Slovakia), Yuriy Tonkonoguy (Lithuania), Sergey
Rainchik (Russia)
Final report

Final report
Project COOMET № 412/UA/07 Page 2 from 39
Contents
1 Introduction
2 The transfer device
3 Comparison conditions
3.1 The test points and the procedure of measurements
3.2 Calculation of the results
4 The test stations of the participating laboratories and the received results
4.1 Ukraine
4.2 Slovakia
4.3 Lithuania
4.4 Russia
5 The stability of the transfer device and participating laboratoriesdependence
5.1 Participating laboratories dependence
6 Determination of the reference value for each flow point and results of
measurements in the participating laboratories
6.1 Description of the method
6.2 The results of the comparison
6.3 Comparison analysis
7 Conclusions
Abstract
The national metrology institutes of Ukraine, Slovakia, Lithuania, and Russia
conducted a comparison in gas flow from 4 m3/h to 160 m
3/h using a positive
displacement flow meter as the transfer device. The participants’ flow standards are
described. The uncertainty contributed to the comparison by the transfer device
(0.13 %) was assessed by calibrations performed in the pilot laboratory at the
beginning and end of the comparison. The standardized degrees of equivalence
between each participant’s results and the comparison reference values were less
than unity except for one flow measurement at one lab where it was 1.07,
demonstrating agreement within uncertainty expectations between the participants.

Final report
Project COOMET № 412/UA/07 Page 3 from 39
1. Introduction
The aim of the project is a comparison in the field of gas flow in the
participating laboratories participating in the working group TK 1.4 of the
metrological organization COOMET for establishing the degree of equivalence of
national standards and evaluation of calibration and measurement capabilities of
laboratories of national metrology institutes in the field of consumption.
COOMET project 412/UA/07 was begun in 2007. The comparisons were
realized in the flow range (from 4 up to 160) m3/h. The transfer device was a rotary
gas meter Delta S-Flow, size G100. The measurement results are presented in the
document “COOMET project 412/UA/07”.
Four laboratories were involved in the comparison (GP IFCSMC Ivano-
Frankovsk, Ukraine (coordinator of comparisons); SMU Bratislava, Slovakia; LEI
Kaunas, Lithuania; FGUP VNIIR Kazan, Russia).
Every laboratory-participant used its procedure of calibration during the
measurements,. The comparison was realized according to the “Recommendations
on comparisons of the standards of the national metrological institutes of
COOMET” and the BIPM directive on realization of key comparisons. In Table 1, a
time schedule of measurements in individual participating participating
laboratoriesis indicated.
Table 1 Time schedule and participants
Country Laboratory
Address of the
place of
comparison
The declared
level
of
comparison
The date of
the
measurement
The
responsible
Ukraine
National Research
& Metrological
Laboratory
GP IFCSMC
Vovchynetska St.,
127
Ivano-Frankovsk
from
4 to 160 m3/h
15.05. –
26.05.2009 y.
Denys
Seredyuk
Slovakia
SMU
Slovak Institute of
Metrology
SMU
Karloveská 63
842 55 Bratislava
from
4 to 160 m3/h
02.06. –
16.06.2009 y.
Stefan
Makovnik
Lithuania
Lithuanian Energy
Institute
Research and
Testing
Laboratory
LEI
3 Breslaujos str.
LT – 44403
Kaunas - 35
from
4 to 160 m3/h
01.07. –
15.07.2009 y.
Yuriy
Tonkonoguy
Russia FGUP VNIIR
FGUP VNIIR
Vtoraya
Aziyskaya
7a, 420029 Kazan
from
4 to 160 m3/h
03.08. –
17.08.2009 y.
Sergey
Rainchik
Ukraine
National Research
& Metrological
Laboratory
GP IFSM
Vovchynetska St.,
127
from
4 to 160 m3/h
01.09. –
15.09.2009 y.
Denys
Seredyuk

Final report
Project COOMET № 412/UA/07 Page 4 from 39
Ivano-Frankovsk
2. The transfer standard
A Delta S-Flow gas meter, size G100 and DN 50, the serial number of the gas
meter was 8785901001, produced by the company “Actaris Gaszahlerbau Gmbh”,
Karlsruhe, Germany was chosen as the transfer device.
The Delta S-Flow gas meter is a rotary meter with two three-blade rotors, each
blade of which is placed at an angle of 120 degrees relative to each other and shifted
by 60 degrees in length. This design completely avoids the resonance phenomena
which are characteristic for the rotary meters with conventional two 8-shaped rotors.
The flow meter works in the flow range of 4 to 160 m3/h. The appearance and
design are indicated in Fig. 1. Its characteristic dimensions are given in Table 2. A
500 mm long DN 50 entering pipeline with the length 500 mm was transported
along with the transfer device. On the output side should have been pipeline with the
length 400 mm with ball valve DN50.
Mandatory condition for a normal functioning of the meter is strictly
horizontal meters operating position on the test equipment. Tests are carried out
without lubrication of meter bearings by oil.
Thermometer for the measurement of the gas temperature was mounted in the
inlet pipe sleeve. Working pressure on the transfer device was measured from the
output "P" of the meter. Output of the pulses is provided from the high-yield "Hf1"
of the meter. Nominal conversion coefficient of the meter was 12390.19 pulses/m3.
Fig. 1. The appearance and design of the Delta S-Flow G100 transfer device.

Final report
Project COOMET № 412/UA/07 Page 5 from 39
Fig. 2. The characteristic dimensions of the Delta S-Flow G100 meter.
Table 2 Dimensions of transfer device.
Dimensions
of transfer
device
Dimensions [mm]
DN D F A B C
140 182 171 224 158 382
3. Comparison conditions
The pulse emitter A1S with the pulse number 12390,19 pulses/m3 was used
for the tests.
The calibration should had been performed in the laboratory where the
temperature was from 19,56°C up to 22,55°C. No oil lubrication was used.
3.1 The test points and the procedure of measurements
Comparison measurements were made at the following ten points of flow: 4
m3/h, 5 m
3/h, 8 m
3/h, 12 m
3/h, 25 m
3/h, 40 m
3/h, 50 m
3/h, 60 m
3/h, 70 m
3/h, 90 m
3/h,
100 m3/h, 120 m
3/h, 140 m
3/h and 160 m
3/h.
The test was repeated at least 3 times in direction from Qmax to Qmin at each
flow and then the mean of the values in table 3 were calculated. The flow had to be
in the interval ± 3% of the required value.

Final report
Project COOMET № 412/UA/07 Page 6 from 39
Table 3 The presentation of measurement results.
3.2 Calculation of the results
The result of measurements is the measurement error “er”, which is expressed
by the difference of the data of the volume of the transfer device “VM” and the
reference value of the flow volume of the measurement means “VE”. The
relative error of the measurement, which is expressed in percent, is the part of the
measurement error “er” and the real value of the flow volume of the reference
measurement means “VE” multiplied by 100. Such, we have the equation:
100M Er
E
V Ve
V (1)
4. Test stations of the participating laboratories and the received results
4.1 Ukraine
GP «Ivano-Frankivskstandartmetrologia» performs calibration work using the
national standard of the unit of gas volume and volume flow (of bell type) DETU
03-01-96, the range of volume flows of 4 to 200 m3/h, uncertainty U = 0,10 % (k=2).
Flow in
the meter
Absolute
pressure in
the meter
Temperature
in the meter
Pressure
loss of the
meter
Error of
the meter
er
Uncertainty
of the error
U (k=2)
[m3.h
-1] [Pa] [°C] [Pa] [%] [%]
160
140
120
100
90
70
60
50
40
25
12
8
5
4

Final report
Project COOMET № 412/UA/07 Page 7 from 39
The principle of operation of the standard is based on the measurement of the time
interval, during which the known with high precision volume of gas is displaced
with the simultaneous measurements of gas temperature and pressure.
The gas volume, which has passed through the gas meter that is under test, is
determined on the base of the equation of gas state:
where VК – gas control volume, which is reproduced by the standard;
р, р0 – the absolute pressure at the tested meter input and under the bell
respectively;
Т, Т0 – the temperature of the measuring environment in the tested meter and
under the bell respectively.
The volume, which has been measured by the meter, is determined by the
following:
where N – the number of pulses, which are read from the meter;
KNOM – nominal value of the meter conversion ratio, pulses/m3.
The meter error is calculated by the following:
Fig. 3. The National gas flow standard ДЕТУ 03-01-96

Final report
Project COOMET № 412/UA/07 Page 8 from 39
Fig. 4. Schematic of bell prover
STANDARD CONFIGURATION
1 – blower;
2 – tank;
3 – buoyancy effect (Archimedean force) compensator (cam);
4 – displacer;
5 – bell;
6 – linear bell displacement transducer;
7 – scale;
8 – sealing liquid (low vapor pressure mineral oil);
9 – meter under test;
10 – data gathering and handling system.

Final report
Project COOMET № 412/UA/07 Page 9 from 39
Table 4 Test results – Ukraine (before dispatch)
Table 5 Test results – Ukraine (after dispatch)
Flow in
the meter
Absolute
pressure in
the meter
Temperature
in the meter
Pressure
loss of the
meter
Error of
the meter
er
Uncertainty
of the error
U (k=2)
[m3.h
-1] [Pa] [°C] [Pa] [%] [%]
160,88 99913 19,79 550 0,23 0,12
140,50 100345 19,75 450 0,18 0,12
120,56 100674 19,74 350 0,13 0,12
100,41 100975 19,78 250 0,08 0,12
89,76 101106 19,73 210 0,05 0,12
69,77 101325 19,75 130 0,00 0,12
60,06 101408 19,80 110 -0,02 0,12
50,01 101488 19,81 80 -0,04 0,12
40,07 101557 19,81 50 -0,07 0,12
24,96 101637 19,79 25 -0,12 0,12
11,97 101674 19,71 8 -0,21 0,12
8,06 101675 19,72 5 -0,28 0,12
4,98 101680 19,73 3 -0,4 0,12
4,00 101682 19,72 2 -0,47 0,12
Flow in
the meter
Absolute
pressure in
the meter
Temperature
in the meter
Pressure
loss of the
meter
Error of
the meter
er
Uncertainty
of the error
U (k=2)
[m3.h
-1] [Pa] [°C] [Pa] [%] [%]
159,91 100239 20,62 548 0,39 0,12
139,90 100631 20,68 451 0,31 0,12
120,96 100971 20,64 349 0,21 0,12
99,91 101287 20,69 252 0,11 0,12
89,98 101418 20,64 210 0,07 0,12
70,22 101639 20,66 131 -0,05 0,12
60,10 101734 20,73 112 -0,16 0,12
49,95 101816 20,69 79 -0,16 0,12
40,19 101877 20,67 51 -0,18 0,12
24,90 101958 20,64 22 -0,19 0,12
12,07 101992 20,63 9 -0,26 0,12
8,01 101996 20,63 5 -0,29 0,12
5,05 101997 20,64 3 -0,4 0,12
4,05 101937 20,65 2 -0,42 0,12

Final report
Project COOMET № 412/UA/07 Page 10 from 39
4.2 Slovakia
The comparison measurement was realized in the Gas Flow Laboratory, in the
Flow Centre of Slovak Institute of Metrology in Bratislava, in October, 21st and 23
rd,
2009. The transfer device was a new type of rotary gas meter DELTA S-FLOW, size
G65, DN 50, produced by ACTARIS Gaszahlerbau Gmbh, Karsruhe, Germany.
Serial number of the gas meter is 8785901001.
Tests were performed using two flow standards. The first equipment was the
Bell prover. The measurements were made in the flow range (4 to 70) m3/h. Serial
number of the Bell prover is 334/1999. The Bell prover is one part of the Slovak
National standard of gas flow with the registration number 035/2007. The expanded
uncertainty of the primary standard - Bell prover is U = 0,12% (k =2).
The second equipment was the secondary standard equipment TEZKD-2,
serial number 322/1999. The measurements were made in the flow range (90 to 120)
m3/h. The expanded uncertainty of the standard equipment TEZKD-2 is U= 0,16%
(k = 2).
The critical nozzles of the test equipment TEZKD-2 are gas flow standards.
The critical nozzles are traceable to the Slovak national standard of gas flow.
The comparison measurement was realized according to the SMU working
procedure No. 18/230/2004, Version 2 (the name of the working procedure is:
“Working procedure for calibration of gas meters and flow with the primary
standard - Bell prover”), and according to the SMU working procedure No.
13/230/2001, Version 2 (the name of the working procedure is: “Working procedure
for calibration, validation and testing for type approval of gas meters by test
equipment with critical nozzles”).
You can see both test equipments participated in this project in the picture.

Final report
Project COOMET № 412/UA/07 Page 11 from 39
Fig. 5. Gas flow standards.
Fig. 6. Schematic of gas flow standard.
STANDARD CONFIGURATION
1 – algal frame
2 – bell
3 - high level of oil

Final report
Project COOMET № 412/UA/07 Page 12 from 39
4 - transverse holder
5 - optical ruler
6 - spiral of Archimedes
7 - cylinder-stabilizer
8 - ventilator
9 - sensor of top dead center
10 – sensor of bottom dead center
11 - pressure sensor
12 - temperature sensor
13 - temperature sensor
14 - counterweight
15 - vacuum pump
16 - critical nozzle
17 - valve controller
18 - tested SR
19 - clock
Table 6 Test results – Slovakia
Flow in
the meter
Absolute
pressure in
the meter
Temperature
in the meter
Pressure
loss of the
meter
Error of
the meter
er
Uncertainty
of the error
U (k=2)
[m3.h
-1] [Pa] [°C] [Pa] [%] [%]
119,71 97949 19,92 323 -0,05 0,24
100,99 98116 19,96 240 -0,08 0,20
88,91 98181 19,95 189 -0,01 0,24
71,08 98255 20,02 132 0,00 0,15
59,16 98275 20,03 98 -0,04 0,15
49,99 98278 20,05 73 -0,07 0,14
40,20 98290 20,04 50 -0,08 0,14
25,08 98305 20,12 23 -0,07 0,14
12,15 98322 20,13 8 -0,10 0,14
8,11 98354 20,16 5 -0,18 0,15
5,17 98373 20,17 3 -0,30 0,15
4,03 98386 20,18 2 -0,36 0,14

Final report
Project COOMET № 412/UA/07 Page 13 from 39
4.3 Lithuania
Place of the test:
Heat equipment research and testing laboratory of Lithuanian energy institute,
3 Breslaujos str. LT-44403 Kaunas-35, Lithuania.
The test method:
The rotor gas meter G160 was calibrated by the method of comparison of the
meter’s readings with readings of a reference gas meter. The calibration was carried
out according to the document KM-2E/3-МР01:2004 «Air (gases) volume and flow
rate meters, (1 – 9700) m3/h. Methods of calibration».
The test at each flow was repeated 3 times and then the means were
calculated. The deviation of real flow values did not exceed ± 3% of the required
values.
The tests were carried out without lubrication of the turbine bearings.
The test facility:
The standard facility No. 2Е/3 with reference gas meters was used for calibration.
The main characteristics of the facility: measurement range is (1 – 9700) m3/h, the
best measurement capability in the range of flow rate (1 – 1600) m3/h is ± 0,25 %.
The general view of the facility is presented at Fig.7.
Fig. 7. Appearance of the gas flow standard.
Round tubes of diameter DN50 were used as straight pipes. The length of
upstream straight pipe was L1=1,8 m (12 DN), downstream – L2=1 m (6,6 DN). The
schematic of the facility is presented at Fig.8.
Final report
Project COOMET № 412/UA/07 Page 14 from 39
6 7 5 8 9 10 13
22 20
T5
T4
T6
T1
T2
T3
T4
T7
T8
ESk4
ESk6
ESk5
ESk1
ESk2
2 измерит. линия
1 вентилятор
2 вентилятор
18
1 измерит. линия
3
17 23 21
4
16
1 2 11
19 15 14
12345
n imp
12345
n imp
12345
n imp
12345
t
12345
12345
n imp
q m3/h 12345
12345
p
θ,
PC
12
f
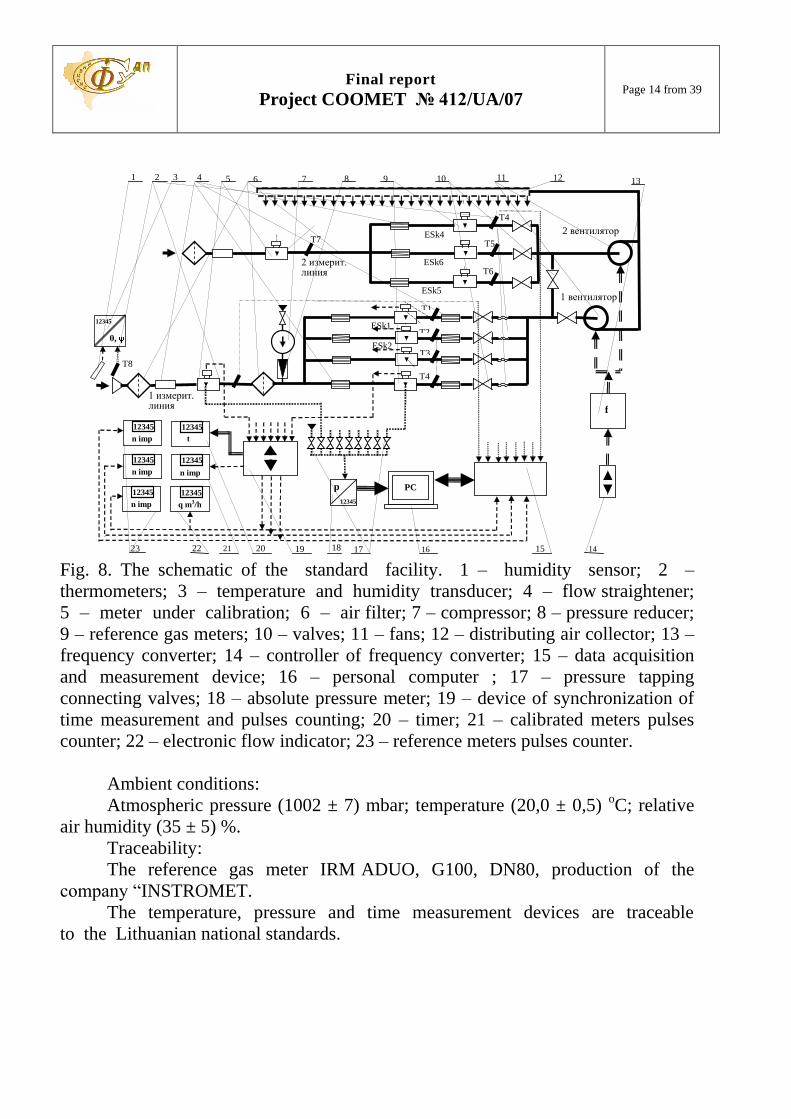
Fig. 8. The schematic of the standard facility. 1 – humidity sensor; 2 –
thermometers; 3 – temperature and humidity transducer; 4 – flow straightener;
5 – meter under calibration; 6 – air filter; 7 – compressor; 8 – pressure reducer;
9 – reference gas meters; 10 – valves; 11 – fans; 12 – distributing air collector; 13 –
frequency converter; 14 – controller of frequency converter; 15 – data acquisition
and measurement device; 16 – personal computer ; 17 – pressure tapping
connecting valves; 18 – absolute pressure meter; 19 – device of synchronization of
time measurement and pulses counting; 20 – timer; 21 – calibrated meters pulses
counter; 22 – electronic flow indicator; 23 – reference meters pulses counter.
Ambient conditions:
Atmospheric pressure (1002 ± 7) mbar; temperature (20,0 ± 0,5) oC; relative
air humidity (35 ± 5) %.
Traceability:
The reference gas meter IRM ADUO, G100, DN80, production of the
company “INSTROMET.
The temperature, pressure and time measurement devices are traceable
to the Lithuanian national standards.

Final report
Project COOMET № 412/UA/07 Page 15 from 39
Table 7 Test results – Lithuania
4.4 Russia
Place of the test:
All-Russian Scientific Research Institute of Flowrate Measurement (VNIIR)
7a, str. 2 Azinskaya, 420029, Kazan, Russia.
Flow range of measurement: (from 4 up to 160) m3/h
Condition of measurement:
Testing medium: air
Temperature: (20 ± 2) oC
Humidity: (68 up to 72) %
Pressure: (748 up to 752) mm Hg; (99,72 up to 100,26) kPa
The test facility:
The nozzle test rig standard for industrial gas meters was used for the
calibration of the rotor meter G100.
Measurements were performed on a standard facility ЭУ-2, which is part of
the state primary standard units of volume and mass flow of gas ГЭТ 118-06.
The main means of measuring flow in the facility are critical nozzles. Flow of
the facility is from 2 m3/h up to 10000 m
3/h. Places of the nozzles setting - 9, total
exchangeable nozzles -30. Expanded uncertainty of the standard facility U = 0,2 %
(k = 2).
Standard facility ЭУ-2 is linked to the initial reference facility ЭУ-1 gravimetric
type state primary standard units of volume and mass flow of gas ГЭТ 118-06, on
which the critical nozzles are calibrated.
Flow in
the meter
Absolute
pressure in
the meter
Temperature
in the meter
Pressure
loss of the
meter
Error of
the meter
er
Uncertainty
of the error
U (k=2)
[m3.h
-1] [Pa] [°C] [Pa] [%] [%]
90,1 99554 20,0 207 0,35 0,27
70,1 99830 20,0 134 0,25 0,27
60,1 99904 20,0 106 0,17 0,27
50,1 100044 20,0 78 0,15 0,27
40,2 100084 19,9 51 0,12 0,27
25,2 100104 20,1 23 0,05 0,27
12,1 100191 20,2 6,9 -0,01 0,29
8,0 100257 20,3 3,5 -0,09 0,29
5,0 100216 20,2 1,9 -0,19 0,29
4,1 100210 20,2 1,5 -0,28 0,29

Final report
Project COOMET № 412/UA/07 Page 16 from 39
During the measurements the following conditions were performed:
1. Consumption was installed smoothly, eliminating the possibility of air
strike on the meter.
2. In the measurements of the reference flow value the air temperature,
humidity, atmospheric pressure, and pressure loss on the counter were taken
into account.
3. When introducing the amendments to the pressure difference in calibrated
and reference tool as a difference was taken ½ of the pressure loss on the
meter.
4. Pulses with a calibrated meter were taken at least 3 times for each
measurement.
5. Time during which the pulses were recorded was no less than 100 seconds.
The scheme of the nozzle test rig standard is presented at followed Fig. 9.
.
Fig. 9. The schematic of the nozzle test rig standard:
1 - critical nozzles; 2 – valves; 3 - vacuum pumps; 4 - calibrated meter; 5 – meter of
the pressure loss on the gas meter; 6 - barometric pressure meter; 7 – thermometer; 8
- moisture meter; 9 – computer; 10 - vacuum gauge.

Final report
Project COOMET № 412/UA/07 Page 17 from 39
Fig. 10. Appearance of the gas flow standard.
Final report
Project COOMET № 412/UA/07 Page 18 from 39
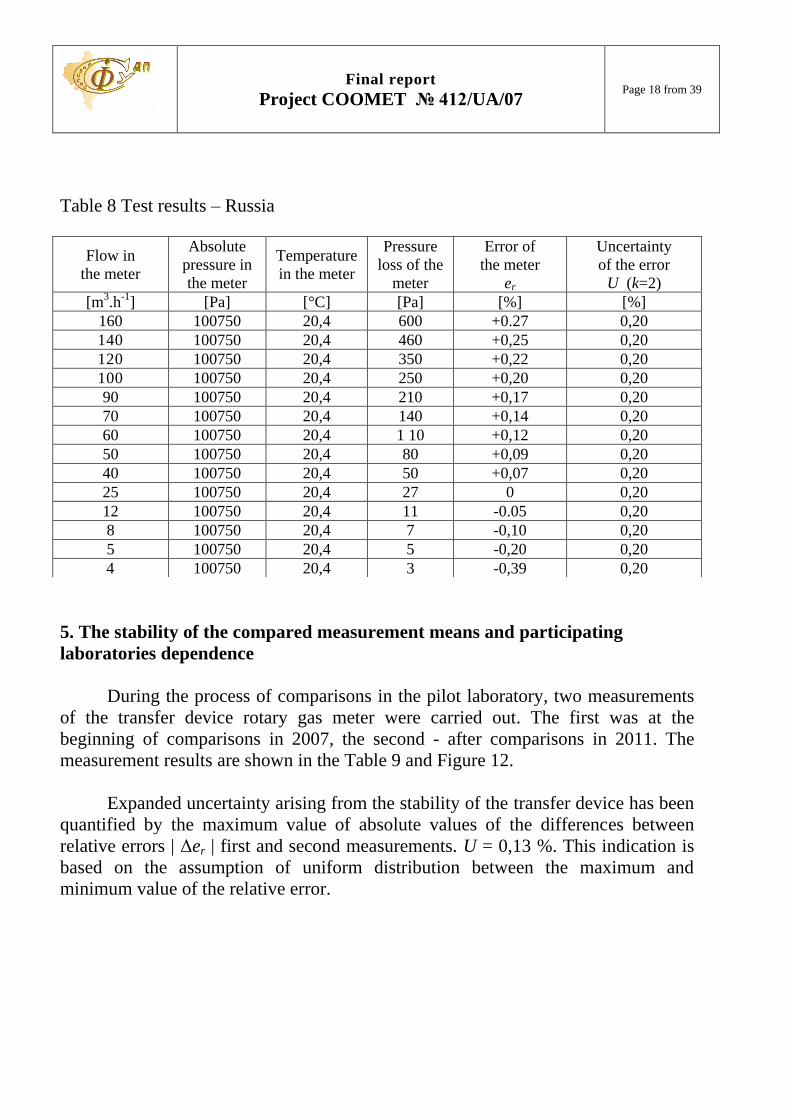
Table 8 Test results – Russia
5. The stability of the compared measurement means and participating
laboratories dependence
During the process of comparisons in the pilot laboratory, two measurements
of the transfer device rotary gas meter were carried out. The first was at the
beginning of comparisons in 2007, the second - after comparisons in 2011. The
measurement results are shown in the Table 9 and Figure 12.
Expanded uncertainty arising from the stability of the transfer device has been
quantified by the maximum value of absolute values of the differences between
relative errors | Δer | first and second measurements. U = 0,13 %. This indication is
based on the assumption of uniform distribution between the maximum and
minimum value of the relative error.
Flow in
the meter
Absolute
pressure in
the meter
Temperature
in the meter
Pressure
loss of the
meter
Error of
the meter
er
Uncertainty
of the error
U (k=2)
[m3.h
-1] [Pa] [°C] [Pa] [%] [%]
160 100750 20,4 600 +0.27 0,20
140 100750 20,4 460 +0,25 0,20
120 100750 20,4 350 +0,22 0,20
100 100750 20,4 250 +0,20 0,20
90 100750 20,4 210 +0,17 0,20
70 100750 20,4 140 +0,14 0,20
60 100750 20,4 1 10 +0,12 0,20
50 100750 20,4 80 +0,09 0,20
40 100750 20,4 50 +0,07 0,20
25 100750 20,4 27 0 0,20
12 100750 20,4 11 -0.05 0,20
8 100750 20,4 7 -0,10 0,20
5 100750 20,4 5 -0,20 0,20
4 100750 20,4 3 -0,39 0,20

Final report
Project COOMET № 412/UA/07 Page 19 from 39
Table 9 The results of measurements in the pilot laboratory
Flow in
the meter
Error of
the meter
er in 2007
Error of
the meter
er in 2010
Uncertainty
of the error
U (k=2)
[m3.h
-1] [%] [%] [%]
160 0,23 0,39 0,09
140 0,18 0,31 0,08
120 0,13 0,21 0,05
100 0,08 0,11 0,02
90 0,05 0,07 0,01
70 0,00 -0,05 0,03
60 -0,02 -0,16 0,08
50 -0,04 -0,16 0,07
40 -0,07 -0,18 0,06
25 -0,12 -0,19 0,04
12 -0,21 -0,26 0,03
8 -0,28 -0,29 0,01
5 -0,4 -0,4 0,00
4 -0,47 -0,42 0,01
-0,60
-0,40
-0,20
0,00
0,20
0,40
0,60
2 12 22 32 42 52 62 72 82 92 102 112 122 132 142 152 162
Ukraine (after dispatch) Ukraine (before dispatch)
Fig. 11. Stability of the transfer device.
m3/h
Error, %

Final report
Project COOMET № 412/UA/07 Page 20 from 39
5.1 Participating laboratories dependence
Three independent laboratories participated in this comparison: Ukraine (IF
CSMS), Slovakia (SMU) and Russia (VNIIR). These laboratories participated in
establishing the initial flow KCRV (key comparison reference value) for each test
point. Lithuania (LEI) is a dependent laboratory of the Federal Physical and
Technical Institute (PTB), Germany.
6. Determination of the reference value for each flow set point and results of
measurements in the participating laboratories
6.1 Description of the method
The reference value was determined at each flow separately. The method of
determination of CRV in each flow rate corresponds to the procedure A presented by
M. G. Cox.
6.1.1 Determination of the reference value and its uncertainty
The reference value y was calculated as the weighted mean error
(WME) according to the following equation:
1 2
2 2 2
1 2
2 2 2
1 2
......
1 1 1......
n
x x xn
x x xn
xx x
u u uy
u u u
(2)
where: x1, x2, … xn - error values, which were measured in the participating
independent laboratories 1, 2, …n.
ux1, ux2, …uxn - combined standard uncertainties connected with the values of
errors, which were measured at the independent laboratories 1, 2, ...n, including also
the uncertainty of the transfer device due to calibration stability.
The combined standard uncertainty of measurement at the individual
participating laboratories ux1, ux2,…uxn was calculated according to the following
equation taking into account the uncertainty of the transfer device due to calibration
stability: 2 2
_
2 2
xi lab tmxi
U Uu (3)
where: Uxi_lab - expanded uncertainty (k=2), calculated at i-th laboratory and given in
the results of measurements at i-th laboratory.
Utm – evaluation of the measurement expanded uncertainty of the transfer
device due to calibration stability.

Final report
Project COOMET № 412/UA/07 Page 21 from 39
The combined standard uncertainty of the CRV was calculated using the
following equation:
2 2 2 2
1 2
1 1 1 1......
y x x xnu u u u (4)
The expanded uncertainty of the CRV Uy is given by following equation:
2y yU u (5)
“Chi-test” was used for determination of the admissible scatter of results of
participating laboratories for determination of CRV. Some independent laboratories
contribute their measured values of error and uncertainty of measurement into
determination of χ2obs value. χ
2obs square is calculated according to the following
equation: 22 2
2 1 2
2 2 2
1 2
( )( ) ( )...... n
obs
x x xn
x yx y x y
u u u (6)
The degree of freedom ν in this case was determined according to the
equation:
1n (7)
where n - the number of the evaluated laboratories.
The independent participating laboratories must correspond to the following
condition for realization of the reference value:
CHIINV(0,05;ν) > 2
obs (8)
If such condition is not followed, the reference value is calculated without the
data of the laboratory, which has the highest value of parameter χ. This procedure is
repeated until the condition is satisfied. Value of ν, obtained in this way, is accepted
as CRV - xref, and value U(ν) is accepted as the expanded uncertainty of the
measurement, which related to CRV as U(xref).
Function “CHIINV(0,05;ν)” is calculated by the standard method by means of
tabulated editor MS Excel.
6.1.2 Calculation of the difference di between the laboratory value and CRV
and its uncertainty U(di) and the normalized degree of equivalence Ei
Parameter di value is necessary for calculation of the comparison result, which
is the degree of equivalence Ei. The difference calculation is made according to the
following equation:
i refdi x x (9)
It is necessary to calculate the uncertainty of the difference di., for calculation
of the degree of equivalence. At application of the law of the uncertainty expansion
the expression of the required parameter follows from the equation:
1 2
1 2
2
1 12 2 21 2 1 21 22
1 21 2 2
2
( )
cov( ) ( )2 cov
( )covx x
x x
u xx x x xu u u
x xx x u
x
(10)

Final report
Project COOMET № 412/UA/07 Page 22 from 39
It is clear that the standard uncertainty of measurement, which is obtained
from the interferences at CRV determination between two dependent inputs, is
created by the sum of squares of the standard uncertainties, which correspond
to the individual introduced quantities minus twice their covariance.
Therefore we have to look at the different cases in this comparison:
A) Differences to the CRV
A1) Independent laboratories with contribution to the CRV.
The value of covariance is identical to the value of the measurement
uncertainty related to CRV for the independent laboratories participants, which
took part in CRV determination, and also for the independent laboratories
participants. So, value u(di) is written according to the following equation: 2 2 2 2 2( ) 2xi xref xref xi xrefu di u u u u u (11)
A2) Independent laboratories without contribution to the CRV.
The independent laboratories participants, which were excluded from CRV
determination, do not have interference, so value u(di) is written according to the
following equation: 2 2( ) xi xrefu di u u (12)
A3) Laboratories with traceability to a laboratory contributing to the CRV.
In this case we have covariance between the laboratory and the CRV because
the laboratory is linked to the CRV via the source of traceability. Although we have
no detailed information about it, we can determine a conservative estimation of an
upper limit of this covariance. The upper limit is determined for the theoretical case
if we have no additional stochastic influence in the traceability of the lab from its
source (which is the laboratory contributing to the CRV). Then the results of the
laboratory considered here would be strongly correlated with the results of the
laboratory contributing to the CRV (correlation coefficient = 1) and there would be
the same covariance to the CRV as in case A1. In any case of additional uncertainty
caused stochastically the correlation and consequently the covariance is smaller.
The expanded uncertainty is calculated according to the equation:
( ) ( ) 2 ( )U di k u di u di (13)
The basis for estimation of a laboratory’s successful participation in a
comparison is the parameter of the normalized degree of equivalence (DoE) Ei.
It is calculated according to the following equation:
( )
diEi
U di (14)
At this the used value of uncertainty U(di) is liable to the above said
conditions.
The expression Ei ≤ 1 is the criterion for estimation of the participating
laboratory’s success. The normalized degree of equivalence to the CRV is
determined for the results of every laboratory according to the following evaluation:

Final report
Project COOMET № 412/UA/07 Page 23 from 39
- the results of the laboratory are passed, if Ei ≤ 1
- the results of the laboratory are failed, if Ei > 1,2
- such estimation signals on the serious problems of the laboratory, which
must be analyzed and removed for proper functioning of the laboratory
- the so-called warning level is established for values Ei in the interval 1
< Ei ≤ 1,2, which signals to the participating laboratory to drawbacks of
the less serious character, but it is the cause for taking corrective measures.
Such warning levels are the cause due to which we must take into account the
significance of the uncertainties calculation (for the laboratory results, and also for
CRV). They are usually established for the level of trustworthiness of 95%. The
interval to Ei < 1,5 is used for such “warnings” in some comparisons. In this
comparison, the lower value 1,2 was chosen, which reflects the predominance of
non-stochastic “elements” of uncertainty in comparison with stochastic “elements”.
(The reproducibility is usually much better than the general uncertainty of the
laboratory).
6.2 The results of the comparisons
Table 10 The measurements results at flow rate value of 160 m3/h
Country Error of the
meter x, %
Uncertainty
U(k=2) di U(di) Ei xref xref + Uxref xref - Uxref
Ukraine 0,23 0,17 -0,016 0,109 0,14 0,25 0,382 0,109
Russia 0,27 0,22 0,024 0,171 0,14 0,25 0,382 0,109
COOMET No. 412/UA/07, Delta-S-Flow S/N: 8785901001, flow rate 160 m3/h
-1,00
-0,80
-0,60
-0,40
-0,20
0,00
0,20
0,40
0,60
0,80
1,00
Ukra
ine
Ru
ssia
Country
Err
or
of
the m
ete
r (%
)
Error of the meter x
Key reference value xref
Expanded uncertainty of the key reference value Uxref
Fig. 12. The measurements results (flow of 160 m
3/h)
Table 11 The measurements results at flow rate value of 140 m3/h

Final report
Project COOMET № 412/UA/07 Page 24 from 39
Country Error of the
meter x, %
Uncertainty
U(k=2) di U(di) Ei xref xref + Uxref xref - Uxref
Ukraine 0,18 0,17 0,008 0,109 0,07 0,17 0,309 0,035
Russia 0,25 0,22 0,078 0,171 0,45 0,17 0,309 0,035
COOMET No. 412/UA/07, Delta-S-Flow S/N: 8785901001, flow rate 140 m3/h
-1,00
-0,80
-0,60
-0,40
-0,20
0,00
0,20
0,40
0,60
0,80
1,00
Ukra
ine
Ru
ssia
Country
Err
or
of
the m
ete
r (%
)
Error of the meter x
Key reference value xref
Expanded uncertainty of the key reference value Uxref
Fig. 13. The measurements results (flow of 140 m
3/h)
Table 12 The measurements results at flow rate value of 120 m3/h
Country Error of the
meter x, %
Uncertainty
U(k=2) di U(di) Ei xref xref + Uxref xref - Uxref
Ukraine 0,13 0,17 0,013 0,127 0,10 0,12 0,238 -0,003
Slovakia -0,05 0,26 -0,167 0,226 0,74 0,12 0,238 -0,003
Russia 0,22 0,22 0,103 0,183 0,56 0,12 0,238 -0,003

Final report
Project COOMET № 412/UA/07 Page 25 from 39
COOMET No. 412/UA/07, Delta-S-Flow S/N: 8785901001, flow rate 120 m3/h
-1,00
-0,80
-0,60
-0,40
-0,20
0,00
0,20
0,40
0,60
0,80
1,00
Ukra
ine
Slo
vakia
Ru
ssia
Country
Err
or
of
the m
ete
r (%
)
Error of the meter x
Key reference value xref
Expanded uncertainty of the key reference value Uxref
Fig. 14. The measurements results (flow of 120 m
3/h)
Table 13 The measurements results at flow rate value of 100 m3/h
Country Error of the
meter x, %
Uncertainty
U(k=2) di U(di) Ei xref xref + Uxref xref - Uxref
Ukraine 0,08 0,17 0,011 0,131 0,09 0,07 0,185 -0,047
Slovakia -0,08 0,22 -0,149 0,186 0,80 0,07 0,185 -0,047
Russia 0,20 0,22 0,131 0,186 0,70 0,07 0,185 -0,047
COOMET No. 412/UA/07, Delta-S-Flow S/N: 8785901001, flow rate 100 m3/h
-1,00
-0,80
-0,60
-0,40
-0,20
0,00
0,20
0,40
0,60
0,80
1,00
Ukra
ine
Slo
vakia
Ru
ssia
Country
Err
or
of
the m
ete
r (%
)
Error of the meter x
Key reference value xref
Expanded uncertainty of the key reference value Uxref
Fig.15. The measurements results (flow of 100 m
3/h)
Table 14 The measurements results at flow value of 90 m3/h

Final report
Project COOMET № 412/UA/07 Page 26 from 39
Country Error of the
meter x, %
Uncertainty
U(k=2) di U(di) Ei xref xref + Uxref xref - Uxref
Ukraine 0,05 0,17 -0,023 0,127 0,18 0,07 0,194 -0,048
Slovakia -0,01 0,26 -0,083 0,226 0,37 0,07 0,194 -0,048
Lithuania 0,35 0,28 0,277 0,258 1,07 0,07 0,194 -0,048
Russia 0,17 0,22 0,097 0,183 0,53 0,07 0,194 -0,048
COOMET No. 412/UA/07, Delta-S-Flow S/N: 8785901001, flow rate 90 m3/h
-1,00
-0,80
-0,60
-0,40
-0,20
0,00
0,20
0,40
0,60
0,80
1,00
Ukra
ine
Slo
vakia
Lit
hu
an
ia
Ru
ssia
Country
Err
or
of
the m
ete
r (%
)
Error of the meter x
Key reference value xref
Expanded uncertainty of the key reference value Uxref
Fig. 16. The measurements results (flow of 90 m3/h)
Table 15 The measurements results at flow rate value of 70 m3/h
Country Error of the
meter x, %
Uncertainty
U(k=2) di U(di) Ei xref xref + Uxref xref - Uxref
Ukraine 0,00 0,17 -0,034 0,138 0,25 0,03 0,142 -0,074
Slovakia 0,00 0,17 -0,034 0,138 0,25 0,03 0,142 -0,074
Lithuania 0,25 0,28 0,216 0,263 0,82 0,03 0,142 -0,074
Russia 0,14 0,22 0,106 0,191 0,56 0,03 0,142 -0,074

Final report
Project COOMET № 412/UA/07 Page 27 from 39
COOMET No. 412/UA/07, Delta-S-Flow S/N: 8785901001, flow rate 70 m3/h
-1,00
-0,80
-0,60
-0,40
-0,20
0,00
0,20
0,40
0,60
0,80
1,00
Ukra
ine
Slo
vakia
Lit
hu
an
ia
Ru
ssia
Country
Err
or
of
the m
ete
r (%
)
Error of the meter x
Key reference value xref
Expanded uncertainty of the key reference value Uxref
Fig.17. The measurements results (flow of 70 m
3/h)
Table 16 The measurements results at flow rate value of 60 m3/h
Country Error of the
meter x, %
Uncertainty
U(k=2) di U(di) Ei xref xref + Uxref xref - Uxref
Ukraine -0,02 0,17 -0,026 0,138 0,19 0,01 0,114 -0,102
Slovakia -0,04 0,17 -0,046 0,138 0,34 0,01 0,114 -0,102
Lithuania 0,17 0,28 0,164 0,263 0,62 0,01 0,114 -0,102
Russia 0,12 0,22 0,114 0,191 0,60 0,01 0,114 -0,102
COOMET No. 412/UA/07, Delta-S-Flow S/N: 8785901001, flow rate 60 m3/h
-1,00
-0,80
-0,60
-0,40
-0,20
0,00
0,20
0,40
0,60
0,80
1,00
Ukra
ine
Slo
vakia
Lit
hu
an
ia
Ru
ssia
Country
Err
or
of
the m
ete
r (%
)
Error of the meter x
Key reference value xref
Expanded uncertainty of the key reference value Uxref
Fig. 18. The measurements results (flow of 60 m
3/h)

Final report
Project COOMET № 412/UA/07 Page 28 from 39
Table 17 The measurements results at flow rate value of 50 m3/h
Country Error of the
meter x, %
Uncertainty
U(k=2) di U(di) Ei xref xref + Uxref xref - Uxref
Ukraine -0,04 0,17 -0,018 0,139 0,13 -0,02 0,084 -0,128
Slovakia -0,07 0,17 -0,048 0,129 0,37 -0,02 0,084 -0,128
Lithuania 0,15 0,28 0,172 0,264 0,65 -0,02 0,084 -0,128
Russia 0,09 0,22 0,112 0,192 0,58 -0,02 0,084 -0,128
COOMET No. 412/UA/07, Delta-S-Flow S/N: 8785901001, flow rate 50 m3/h
-1,00
-0,80
-0,60
-0,40
-0,20
0,00
0,20
0,40
0,60
0,80
1,00
Ukra
ine
Slo
vakia
Lit
hu
an
ia
Ru
ssia
Country
Err
or
of
the m
ete
r (%
)
Error of the meter x
Key reference value xref
Expanded uncertainty of the key reference value Uxref
Fig. 19. The measurements results (flow of 50 m
3/h)
Table 18 The measurements results at flow rate value of 40 m3/h
Country Error of the
meter x, %
Uncertainty
U(k=2) di U(di) Ei xref xref + Uxref xref - Uxref
Ukraine -0,07 0,17 -0,028 0,139 0,20 -0,04 0,064 -0,147
Slovakia -0,08 0,17 -0,038 0,129 0,30 -0,04 0,064 -0,147
Lithuania 0,12 0,28 0,162 0,264 0,61 -0,04 0,064 -0,147
Russia 0,07 0,22 0,112 0,192 0,58 -0,04 0,064 -0,147

Final report
Project COOMET № 412/UA/07 Page 29 from 39
COOMET No. 412/UA/07, Delta-S-Flow S/N: 8785901001, flow rate 40 m3/h
-1,00
-0,80
-0,60
-0,40
-0,20
0,00
0,20
0,40
0,60
0,80
1,00
Ukra
ine
Slo
vakia
Lit
hu
an
ia
Ru
ssia
Country
Err
or
of
the m
ete
r (%
)
Error of the meter x
Key reference value xref
Expanded uncertainty of the key reference value Uxref
Fig. 20. The measurements results (flow of 40 m
3/h)
Table 19 The measurements results at flow rate value of 25 m3/h
Country Error of the
meter x, %
Uncertainty
U(k=2) di U(di) Ei xref xref + Uxref xref - Uxref
Ukraine -0,12 0,17 -0,048 0,139 0,34 -0,07 0,034 -0,178
Slovakia -0,07 0,17 0,002 0,129 0,02 -0,07 0,034 -0,178
Lithuania 0,05 0,28 0,122 0,264 0,46 -0,07 0,034 -0,178
Russia 0,00 0,22 0,072 0,192 0,37 -0,07 0,034 -0,178
COOMET No. 412/UA/07, Delta-S-Flow S/N: 8785901001, flow rate 25 m3/h
-1,00
-0,80
-0,60
-0,40
-0,20
0,00
0,20
0,40
0,60
0,80
1,00
Ukra
ine
Slo
vakia
Lit
hu
an
ia
Ru
ssia
Country
Err
or
of
the m
ete
r (%
)
Error of the meter x
Key reference value xref
Expanded uncertainty of the key reference value Uxref
Fig. 21. The measurements results (flow of 25 m
3/h)

Final report
Project COOMET № 412/UA/07 Page 30 from 39
Table 20 The measurements results at flow rate value of 12 m3/h
Country Error of the
meter x, %
Uncertainty
U(k=2) di U(di) Ei xref xref + Uxref xref - Uxref
Ukraine -0,21 0,17 -0,081 0,139 0,58 -0,13 -0,023 -0,234
Slovakia -0,10 0,17 0,029 0,129 0,22 -0,13 -0,023 -0,234
Lithuania -0,01 0,30 0,119 0,285 0,42 -0,13 -0,023 -0,234
Russia -0,05 0,22 0,079 0,192 0,41 -0,13 -0,023 -0,234
COOMET No. 412/UA/07, Delta-S-Flow S/N: 8785901001, flow rate 12 m3/h
-1,00
-0,80
-0,60
-0,40
-0,20
0,00
0,20
0,40
0,60
0,80
1,00
Ukra
ine
Slo
vakia
Lit
hu
an
ia
Ru
ssia
Country
Err
or
of
the m
ete
r (%
)
Error of the meter x
Key reference value xref
Expanded uncertainty of the key reference value Uxref
Fig. 22. The measurements results (flow of 12 m
3/h)
Table 21 The measurements results at flow rate value of 8 m3/h
Country Error of the
meter x, %
Uncertainty
U(k=2) di U(di) Ei xref xref + Uxref xref - Uxref
Ukraine -0,28 0,17 -0,081 0,138 0,59 -0,20 -0,091 -0,306
Slovakia -0,18 0,17 0,019 0,138 0,14 -0,20 -0,091 -0,306
Lithuania -0,09 0,30 0,109 0,284 0,38 -0,20 -0,091 -0,306
Russia -0,10 0,22 0,099 0,191 0,52 -0,20 -0,091 -0,306

Final report
Project COOMET № 412/UA/07 Page 31 from 39
COOMET No. 412/UA/07, Delta-S-Flow S/N: 8785901001, flow rate 8 m3/h
-1,00
-0,80
-0,60
-0,40
-0,20
0,00
0,20
0,40
0,60
0,80
1,00
Ukra
ine
Slo
vakia
Lit
hu
an
ia
Ru
ssia
Country
Err
or
of
the m
ete
r (%
)
Error of the meter x
Key reference value xref
Expanded uncertainty of the key reference value Uxref
Fig. 23. The measurements results (flow of 8 m
3/h)
Table 22 The measurements results at flow rate value of 5 m3/h
Country Error of the
meter x, %
Uncertainty
U(k=2) di U(di) Ei xref xref + Uxref xref - Uxref
Ukraine -0,40 0,17 -0,086 0,138 0,63 -0,31 -0,206 -0,422
Slovakia -0,30 0,17 0,014 0,138 0,10 -0,31 -0,206 -0,422
Lithuania -0,19 0,30 0,124 0,284 0,44 -0,31 -0,206 -0,422
Russia -0,20 0,22 0,114 0,191 0,60 -0,31 -0,206 -0,422
COOMET No. 412/UA/07, Delta-S-Flow S/N: 8785901001, flow rate 5 m3/h
-1,00
-0,80
-0,60
-0,40
-0,20
0,00
0,20
0,40
0,60
0,80
1,00
Ukra
ine
Slo
vakia
Lit
hu
an
ia
Ru
ssia
Country
Err
or
of
the m
ete
r (%
)
Error of the meter x
Key reference value xref
Expanded uncertainty of the key reference value Uxref
Fig. 24. The measurements results (flow of 5 m
3/h)

Final report
Project COOMET № 412/UA/07 Page 32 from 39
Table 23 The measurements results at flow rate value of 4 m3/h
Country Error of the
meter x, %
Uncertainty
U(k=2) di U(di) Ei xref xref + Uxref xref - Uxref
Ukraine -0,47 0,17 -0,063 0,139 0,45 -0,41 -0,301 -0,513
Slovakia -0,36 0,17 0,047 0,129 0,37 -0,41 -0,301 -0,513
Lithuania -0,28 0,30 0,127 0,285 0,45 -0,41 -0,301 -0,513
Russia -0,39 0,22 0,017 0,192 0,09 -0,41 -0,301 -0,513
COOMET No. 412/UA/07, Delta-S-Flow S/N: 8785901001, flow rate 4 m3/h
-1,00
-0,80
-0,60
-0,40
-0,20
0,00
0,20
0,40
0,60
0,80
1,00
Ukra
ine
Slo
vakia
Lit
hu
an
ia
Ru
ssia
Country
Err
or
of
the m
ete
r (%
)
Error of the meter x
Key reference value xref
Expanded uncertainty of the key reference value Uxref
Fig. 25. The measurements results (flow of 4 m
3/h)

Final report
Project COOMET № 412/UA/07 Page 33 from 39
6.3 Comparisons analysis
6.3.1 Ukraine
flow
in the
meter
error of the
meter
uncertainty
of the error
U(k=2)
reference
value y
(KCRV)
uncertainty
of the
reference
value
U(k=2)
di Ei result consistency
check
160,00 0,23 0,17 0,25 0,14 -0,02 0,14 passed inside
140,00 0,18 0,17 0,21 0,14 -0,03 0,25 passed inside
120,00 0,13 0,17 0,12 0,12 0,01 0,10 passed inside
100,00 0,08 0,17 0,07 0,12 0,01 0,09 passed inside
90,00 0,05 0,17 0,07 0,12 -0,02 0,18 passed inside
70,00 0,00 0,17 0,03 0,11 -0,03 0,25 passed inside
60,00 -0,02 0,17 0,01 0,11 -0,03 0,19 passed inside
50,00 -0,04 0,17 -0,02 0,11 -0,02 0,13 passed inside
40,00 -0,07 0,17 -0,04 0,11 -0,03 0,20 passed inside
25,00 -0,12 0,17 -0,07 0,11 -0,05 0,34 passed inside
12,00 -0,21 0,17 -0,13 0,11 -0,08 0,58 passed inside
8,00 -0,28 0,17 -0,20 0,11 -0,08 0,59 passed inside
5,00 -0,40 0,17 -0,31 0,11 -0,09 0,63 passed inside
4,00 -0,47 0,17 -0,41 0,11 -0,06 0,45 passed inside
Mean -0,04 0,29 passed

Final report
Project COOMET № 412/UA/07 Page 34 from 39
Ukraine - COOMET Project No 412/UA/07, Delta-S-Flow S/N
8785901001
-0,60
-0,40
-0,20
0,00
0,20
0,40
0,60
0 20 40 60 80 100 120 140 160 180
Flow rate (m3/h)
error of the meter
reference value y (KCRV)
Err
or
of
the m
ete
r (%
)
Fig. 26. The results of the comparisons in Ukraine.
6.3.2 Slovakia
flow
in the
meter
error of the
meter
uncertainty
of the error
U(k=2)
reference
value y
(KCRV)
uncertaint
y
of the
reference
value
U(k=2)
di Ei result consistency
check
120,00 -0,05 0,26 0,12 0,12 -0,17 0,74 passed inside
100,00 -0,08 0,22 0,07 0,12 -0,15 0,80 passed inside
90,00 -0,01 0,26 0,07 0,12 -0,08 0,37 passed inside
70,00 0,00 0,17 0,03 0,11 -0,03 0,25 passed inside
60,00 -0,04 0,17 0,01 0,11 -0,05 0,34 passed inside
50,00 -0,07 0,17 -0,02 0,11 -0,05 0,37 passed inside
40,00 -0,08 0,17 -0,04 0,11 -0,04 0,30 passed inside
25,00 -0,07 0,17 -0,07 0,11 0,00 0,02 passed inside
12,00 -0,10 0,17 -0,13 0,11 0,03 0,22 passed inside
8,00 -0,18 0,17 -0,20 0,11 0,02 0,14 passed inside
5,00 -0,30 0,17 -0,31 0,11 0,01 0,10 passed inside
4,00 -0,36 0,17 -0,41 0,11 0,05 0,37 passed inside
Mean -0,04 0,33 passed

Final report
Project COOMET № 412/UA/07 Page 35 from 39
Slovakia - COOMET Project No 412/UA/07, Delta-S-Flow S/N
8785901001
-0,60
-0,40
-0,20
0,00
0,20
0,40
0,60
0 20 40 60 80 100 120 140
Flow rate (m3/h)
error of the meter
reference value y (KCRV)
Err
or
of
the m
ete
r (%
)
Fig. 27. The results of the comparisons in Slovakia.
6.3.3 Lithuania
flow
in the
meter
error of the
meter
uncertainty
of the error
U(k=2)
reference
value y
(KCRV)
uncertainty
of the
reference
value
U(k=2)
di Ei result consistency
check
90,00 0,35 0,28 0,07 0,12 0,28 1,07 warning inside
70,00 0,25 0,28 0,03 0,11 0,22 0,82 passed inside
60,00 0,17 0,28 0,01 0,11 0,16 0,62 passed inside
50,00 0,15 0,28 -0,02 0,11 0,17 0,65 passed inside
40,00 0,12 0,28 -0,04 0,11 0,16 0,61 passed inside
25,00 0,05 0,28 -0,07 0,11 0,12 0,46 passed inside
12,00 -0,01 0,30 -0,13 0,11 0,12 0,42 passed inside
8,00 -0,09 0,30 -0,20 0,11 0,11 0,38 passed inside
5,00 -0,19 0,30 -0,31 0,11 0,12 0,44 passed inside
4,00 -0,28 0,30 -0,41 0,11 0,13 0,45 passed inside
Mean 0,16 0,59 passed

Final report
Project COOMET № 412/UA/07 Page 36 from 39
Lithuania - COOMET Project No 412/UA/07, Delta-S-Flow S/N
8785901001
-0,60
-0,40
-0,20
0,00
0,20
0,40
0,60
0,80
1,00
0 10 20 30 40 50 60 70 80 90 100
Flow rate (m3/h)
error of the meter
reference value y (KCRV)
Err
or
of
the m
ete
r (%
)
Fig. 28. The results of the comparisons in Lithuania.
6.3.4 Russia
flow
in the
meter
error of the
meter
uncertainty
of the error
U(k=2)
reference
value y
(KCRV)
uncertaint
y
of the
refrence
value
U(k=2)
di Ei result consistency
check
160,00 0,27 0,22 0,25 0,14 0,02 0,14 passed inside
140,00 0,25 0,22 0,21 0,14 0,04 0,25 passed inside
120,00 0,22 0,22 0,12 0,12 0,10 0,56 passed inside
100,00 0,20 0,22 0,07 0,12 0,13 0,70 passed inside
90,00 0,17 0,22 0,07 0,12 0,10 0,53 passed inside
70,00 0,14 0,22 0,03 0,11 0,11 0,56 passed inside
60,00 0,12 0,22 0,01 0,11 0,11 0,60 passed inside
50,00 0,09 0,22 -0,02 0,11 0,11 0,58 passed inside
40,00 0,07 0,22 -0,04 0,11 0,11 0,58 passed inside
25,00 0,00 0,22 -0,07 0,11 0,07 0,37 passed inside
12,00 -0,05 0,22 -0,13 0,11 0,08 0,41 passed inside
8,00 -0,10 0,22 -0,20 0,11 0,10 0,52 passed inside

Final report
Project COOMET № 412/UA/07 Page 37 from 39
5,00 -0,20 0,22 -0,31 0,11 0,11 0,60 passed inside
4,00 -0,39 0,22 -0,41 0,11 0,02 0,09 passed inside
Mean 0,09 0,46 passed
Russia - COOMET Project No. 412/UA/07, Delta-S-Flow S/N
8785901001
-0,60
-0,40
-0,20
0,00
0,20
0,40
0,60
0 20 40 60 80 100 120 140 160 180
Flow rate (m3/h)
error of the meter
reference value y (KCRV)
Err
or
of
the m
ete
r (%
)
Fig. 29. The results of the comparisons in Russia.
7. Conclusions
For a more detailed depiction of relations among the participating laboratories,
we prepared outcomes of comparison measurements, which bring an information on
quality of metrology assurance and uniformity of measurements in the region of
operation of participating laboratories.
Table 24 The initial data obtained during experimental studies
Flow rate in
the meter
(m3/h)
Ukraine
(%)
Slovakia
(%)
Russia
(%)
Сomparison
reference
value
(%)
Uncertainty
of the
reference value
U(k=2)
160 0,23 0,27 0,25 0,14
140 0,18 0,25 0,21 0,14
120 0,13 -0,05 0,22 0,12 0,12
100 0,08 -0,08 0,2 0,07 0,12
90 0,05 -0,01 0,17 0,07 0,12
Final report
Project COOMET № 412/UA/07 Page 38 from 39
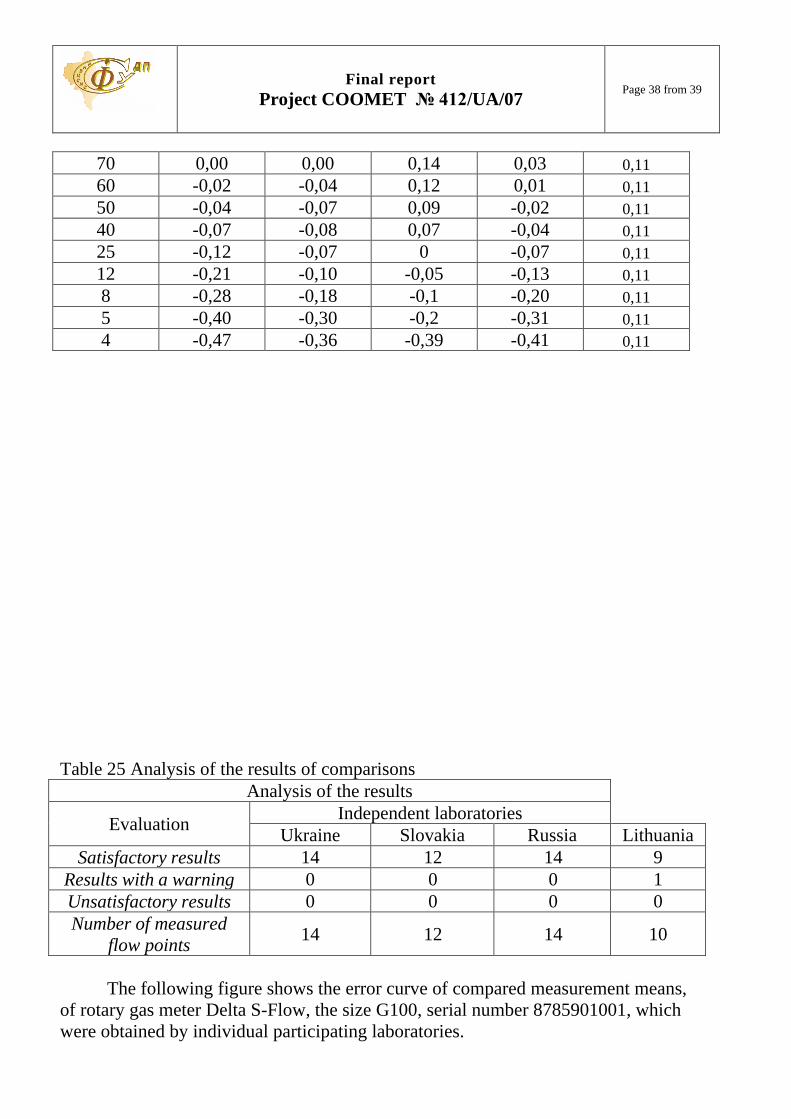
Table 25 Analysis of the results of comparisons
Analysis of the results
Evaluation Independent laboratories
Ukraine Slovakia Russia Lithuania
Satisfactory results 14 12 14 9
Results with a warning 0 0 0 1
Unsatisfactory results 0 0 0 0
Number of measured flow points
14 12 14 10
The following figure shows the error curve of compared measurement means,
of rotary gas meter Delta S-Flow, the size G100, serial number 8785901001, which
were obtained by individual participating laboratories.
70 0,00 0,00 0,14 0,03 0,11
60 -0,02 -0,04 0,12 0,01 0,11
50 -0,04 -0,07 0,09 -0,02 0,11
40 -0,07 -0,08 0,07 -0,04 0,11
25 -0,12 -0,07 0 -0,07 0,11
12 -0,21 -0,10 -0,05 -0,13 0,11
8 -0,28 -0,18 -0,1 -0,20 0,11
5 -0,40 -0,30 -0,2 -0,31 0,11
4 -0,47 -0,36 -0,39 -0,41 0,11

Final report
Project COOMET № 412/UA/07 Page 39 from 39
COOMET Project No. 412/UA/07, Delta-S-Flow G100 S/N 8785901001
-1,00
-0,80
-0,60
-0,40
-0,20
0,00
0,20
0,40
0,60
0,80
1,00
0 20 40 60 80 100 120 140 160 180
Flow rate (m3/h)
Ukraine
Slovak Republic
Lithuania
Russia
reference value
Err
or
of
the m
ete
r (%
)
Fig. 30. Results of comparison.