intercensal population count and labour force …...178 in 2011. 5. the absolute size of the labour...
TRANSCRIPT

MONTSERRAT STATISTICS DEPARTMENT LABOUR FORCE CENSUS
Intercensal Population Count and Labour Force Survey 2018
Key Findings Report
Montserrat Statistics Department 6/12/19 Montserrat, West Indies

MONTSERRAT STATISTICS DEPARTMENT LABOUR FORCE CENSUS RESULTS
1 | P a g e
Contents
Preface .......................................................................................................................... 2
Executive Summary ................................................................................................ 3
Background and Objectives ................................................................................ 6
Methodology .............................................................................................................. 7
Key Findings: 2018 Census and Labour Force Survey ........................... 8
Key Results .............................................................................................................. 8
1. Population and Demographic Indicators: ....................................... 8
2. Housing Characteristics ....................................................................... 12
3. Education .................................................................................................... 23
4. Migration ..................................................................................................... 27
5. Economic Activity ................................................................................... 30

MONTSERRAT STATISTICS DEPARTMENT LABOUR FORCE CENSUS RESULTS
2 | P a g e
Preface
There can be no doubt that effective planning and governance require a diverse set of data. The recently conducted Intercensal Count and Labour Force Survey (ICC/LFS) of Montserrat is one of the leading sources of accurate and reliable data on a variety of socioeconomic and demographic indicators. The main fieldwork for this exercise was carried out in the last three (3) months of 2018 by the Statistics Department of Montserrat (SDM) of the Ministry of Finance and Economic Management (MOFEM). Some technical support was provided by the Organization of Eastern Caribbean States (OECS) and the Project for the Regional Advancement of Statistics in the Caribbean (PRASC). Some financial support was generously provided by the United Nations Children Fund (UNICEF).
This exercise provides a goldmine of data that will prove extremely useful for Researchers, Policy Makers, Planners and other individuals, seeking statistically sound data that can be used to enhance evidence-based decision, program and policy formulation, more in-depth analysis and forecasting regarding development issues. The database generated by this exercise will fill a serious data gap for Montserrat and it is hoped that this is only the beginning of the building of comprehensive databases for the country that are indispensable in planning for the development of Montserrat.
The SDM is pleased to produce key results from this exercise in such a short turn-around-time, thanks largely to the use of the Computer Assisted Personal Interviews (CAPI) methodology of Survey Solutions of the World Bank. Sincerest thanks are also in order for the very good cooperation offered by the field staff – both Enumerators and Supervisors – as well as the dedication shown by the technical staff of the SDM. Sincerest thanks also go out to the development partners – notably, the United Kingdom’s Department for International Development (DFID), the Caribbean Development Bank (CDB)/OECS’ Enhanced Country Poverty Assessment (E-CPA) project, PRASC and UNICEF for providing technical and financial support to make the exercise a success.

MONTSERRAT STATISTICS DEPARTMENT LABOUR FORCE CENSUS RESULTS
3 | P a g e
Executive Summary
The current report on the Intercensal Population Count and Labour Force Survey (ICC/LFS) of Montserrat is a summary of the major findings of this exercise. A more comprehensive and detailed report is scheduled to be prepared and released in the last quarter of this calendar year. The ICC/LFS was conducted by the Statistics Department of Montserrat, during the Months of September to December, 2018. It was a combined activity (a Census count and Labour Force Survey) involving the gathering of key socio-economic and demographic data about Montserrat. Census Day was September 22 and the reference week for the labour force component was the week of September 16-22, 2018.
This country-wide exercise provides a rich source of recent statistical data that will enhance evidence-based planning for the development of Montserrat. It provided a platform for training of staff as well as building a pool of field personnel whose expertise will be essential in conducting future household surveys. It also provided an opportunity to prepare for the 2020 round of decennial Population and Housing Censuses which for Montserrat will be conducted in 2021.
Sixty (60) Enumerators and six (6) Field Supervisors were trained to carry out the fieldwork of this exercise. Data collection was done using computer tablets, after the field staff were trained in the Computer Assisted Personal Interviews (CAPI) methodology. The World Bank, Survey Solutions version of CAPI was used.

MONTSERRAT STATISTICS DEPARTMENT LABOUR FORCE CENSUS RESULTS
4 | P a g e
Main Findings
Population and Demographic Characteristics
1. The total enumerated population size – both institutional and non-institutional - of Montserrat as at September 22, 2018 was 4,649 persons – 2,289 males and 2,360 females. Comparative figures for 2011 were: 4,922 persons, 2,546 males and 2,376 females respectively.
2. The Overall Sex Ratio changed from 1.07 in 2011 to 0.97 in 2018. 3. 41% of households in Montserrat were headed by females in 2018. In 2011,
this figure was 38%. 4. In 2011, the median age of the population was 37.7 years. In 2018, this
increased to 40 years.
Housing and Sanitation
1. As in 2011, houses made of Concrete/Concrete Blocks in 2018 accounted for the largest share (75.2%) of the housing stock in Montserrat – 71.0% in 2011.
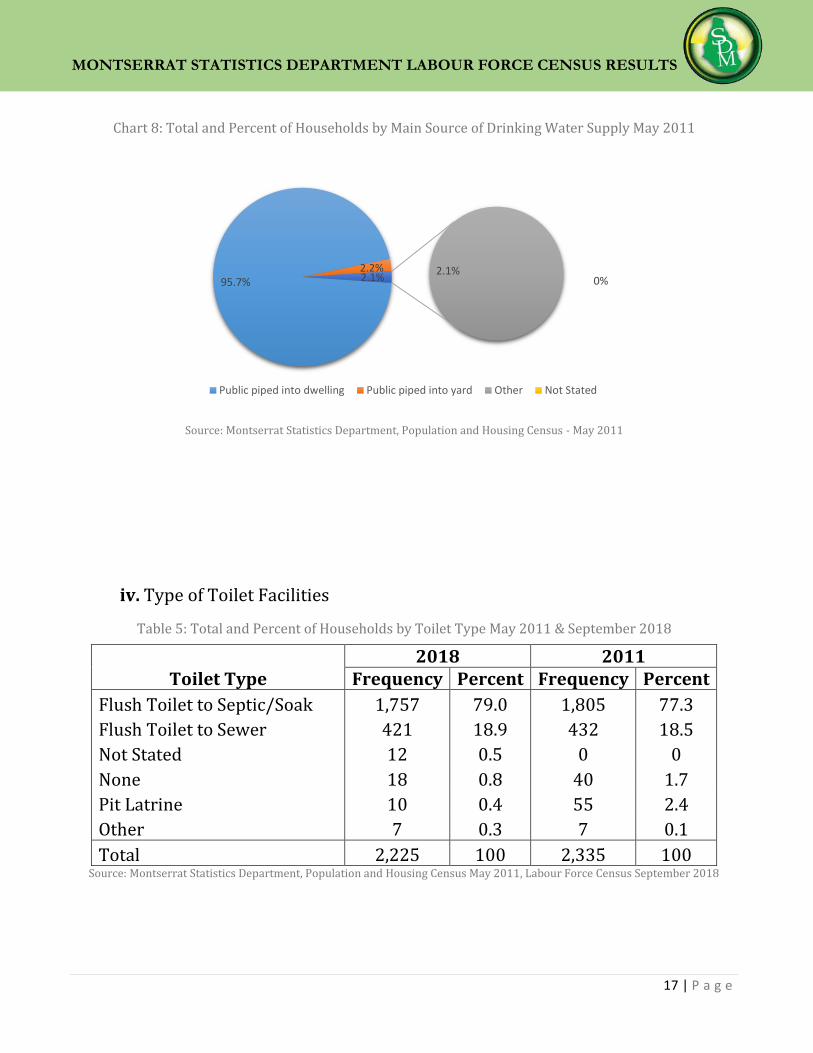
2. The main source of Drinking Water in Montserrat is Publicly Piped into the Dwellings. In 2011, 95.7% of households used this source and in 2018 it increased to 97.7%.
3. In 2018, 36% of householders owned their dwelling unit outright and another 18.2% had a mortgage. Comparative figures for 2011 were 36.7% and 15.8% respectively.
4. 97.9% of households in 2018 used either Flush Toilets to Septic Tank or to Sewer. In 2011, the corresponding figure was 95.8%.
5. In 2018, 98.3% of households used Public Electricity as their main source of lighting. In 2011, the corresponding figure was 97.3%.
6. Ownership of a Refrigerator in 2018 was 95.3% and 91.7% in 2011; and use of Mobile Telephone increased from 82.3% in 2011 to 90.2% in 2018; ownership of a computer or laptop also increased slightly from 49.7% to 51.8% of households and internet access leaped from 41.3% in 2011 to 68% in 2018.

MONTSERRAT STATISTICS DEPARTMENT LABOUR FORCE CENSUS RESULTS
5 | P a g e
Education
1. Of the population 15 years and over of Montserrat in 2018, 1.5% had completed no formal level of Education. This figure was 1.3% in 2011.
2. 15.7% of the population 15 years and over had completed Primary level of formal education only. In 2011 the comparative figure was 22.8%.
3. In 2018, of the population 20 years and over, 31.2% completed Secondary level of education only, whereas this figure was 24.7% in 2011.
4. Of those 25 years and over in 2018, 20.7% had completed tertiary level of education compared with 17.2% in 2011.
International Migration
1. In 2018, 63% of the population of Montserrat were Montserratians citizens and in 2011 this figure was 72%.
2. 56.2% of the Montserratian population were born in Montserrat in 2018, whereas the comparable figure for 2011 was 61.1%.
Economic Activity
1. The Dependency Ratio for the country in 2018 was 51 persons for every 100 persons. In 2011 it was 50 persons for every 100 persons.
2. Labour Force Participation Rate increased from 85.1% in 2011 to 89.4% in 2018.
3. The absolute number of persons Employed in 2018 was 2,527 compared with 2,540 in 2011.
4. The absolute number of persons Unemployed in 2018 was 176 compared with 178 in 2011.
5. The absolute size of the Labour Force in 2018 was 2,703 and 2,718 in 2011. 6. In 2018, the Unemployment Rate for the total population was 6.5% and the
comparative figure for 2011 was 6.6%. Among the male population it was 7.2% in 2018 compare to 8.6% in 2011. Among females, it was 5.8% in 2018 and 4.1% in 2011.
7. Youth (age 15 to 24 years) Unemployment Rate in 2018 was 11.8% compared to 16.9% in 2011.

MONTSERRAT STATISTICS DEPARTMENT LABOUR FORCE CENSUS RESULTS
6 | P a g e
Background and Objectives
The Montserrat Intercensal Population Count and Labour Force Survey (ICC/LFS) was conducted in September to December, 2018 by the Statistics Department of Montserrat (SDM) of the Ministry of Finance and Economic Management of Montserrat W.I. This countrywide exercise marks the first major data collection activity since the decennial Population and Housing Census (PHC) of 2011. The definition used in 2011 of a “Usual Resident” was retained for the Census of 2018. A Usual Resident is defined as any person who resides or intends to reside in Montserrat for six (6) months or more. The main objectives of the ICC/LFS are to: a) provide an intercensal count of the population of Montserrat, together with key socioeconomic and demographic indicators, thereby establishing a credible database for development planning and monitoring of the prevailing socioeconomic conditions of the people and country; b) build the capacity of the technical staff of the SDM in data collection through Censuses and Surveys; and c) develop a pool of experienced data collectors who can assist in the collection of data in future surveys. The main objective of this report is to facilitate the timely dissemination and use of key results from the ICC/LFS prior to the release of full tables and the final report which will contain detailed information on all findings by various demographic, social and economic characteristics. The final report is expected to be released by the end of 2019.

MONTSERRAT STATISTICS DEPARTMENT LABOUR FORCE CENSUS RESULTS
7 | P a g e
Methodology
The fieldwork for the ICC/LFS of Montserrat was largely carried out during the months of September to December 2018. September 22, 2018 was the designated "Census Day". Hence, all population data collected in this exercise are referenced to the situation as at September 22, 2018. With respect to the Labour Force Survey and in accordance with the ILO recommendations, the reference period for the Labour Force data from this exercise was the week ending September 22, 2018. The combined ICC/LFS questionnaire used was customized for Montserrat and was based on the OECS harmonized questionnaires in Survey Solutions CAPI. The latter was the platform used to collect the data using tablets. The available geographic maps for all Enumeration Areas (EA) of the country were also used in the exercise and each EA was assigned to one of the six teams of enumerators who were employed to conduct the canvassing and interviews in each area. Every ‘Usual Resident’ of Montserrat, defined as a person living in the country for six (6) months or more – or intending to do so – was canvassed and enumerated, including the population living in institutions as well as the Homeless population. It should be noted that even though the institutional population and the Homeless were also enumerated, they are not included in the final database for tabulations, since only a head count and the sex of these persons were collected. This is in accordance with the international recommendations of the United Nations.

MONTSERRAT STATISTICS DEPARTMENT LABOUR FORCE CENSUS RESULTS
8 | P a g e
KEY FINDINGS: 2018 CENSUS AND LABOUR FORCE SURVEY
Key Results
1. Population and Demographic Indicators:
i. The Total enumerated population as at Census Day is 4,649 persons [4,566
+83 (the institutional population) = 4,649] (The total enumerated population is
the sum of the non-institutional i.e. the usual residents living as households and the
institutional population i.e. the usual residents living in institutions such as the prison, Old
Folks Homes etc. PLUS the homeless population. The comparative figure for 2011 was
4,922 persons)
ii. The disaggregation by sex is 2,289 Males and 2,360 Females (Comparable
figures for 2011 are 2,546 Males and 2,376 Females)
iii. Population by broad age groups: Following the international recommendations, all
results shown below and in our upcoming reports will be based on the non-institutional population
which was a total of 4,566 persons. For obvious reasons, this ‘Tabulable’ population, as some
experts call it, forms the main database upon which all census reports are usually based. The
comparative figure for 2011 is 4,775 persons – 2,466 males and 2,309 females.
Age group 0 – 14: Total0-14yrs 853 (18.7% of Total Population), 413
Males and 440 Females (For 2011, corresponding figures are Total 964 (20%), Males 489 and Females
475)
Age group 15 – 64: Total15-64yrs 3,025 (66.3%), Males 1,479 and
Females 1,546. (For 2011, corresponding figures are Total 3,193 (67%), Males
1,664 and Females 1,529)
Age group 65+: Total65+yrs 688 (15%), 364 Males and 324 Females (For 2011, corresponding figures are Total 618 (13%), Males 313 and Females
305)

MONTSERRAT STATISTICS DEPARTMENT LABOUR FORCE CENSUS RESULTS
9 | P a g e
Age group 80+: Total80+yrs 142 (3%), 60 Males and 82 Females (For
2011, corresponding figures are Total 159 (3%), Males 64 and Females 95)
iv. Human (Overall) Sex Ratio is 0.97 (The Human or Overall Sex Ratio of a population is defined as the ratio of males to females.
The ratio for 2011 from Census 2011 was 1.07)
v. Household Headship
This indicator is important to follow for several reasons. One major reason is that, in the context of developing countries, households that are headed by females may be more vulnerable due to the fact that females may be less able to access resources in these countries. If the household head is female and responsible for the household, since economic opportunities are less favourable to females than to males in these societies, household vulnerability becomes obvious. The 2018 Census shows that 41% of households were headed by females. The comparative figure for 2011 was 38% showing an increase.
vi. Median Age of the Population
The Median Age of the population divides the population into two (2) equal
groups. Half of the population is older and the other half younger than the
Median Age. An increasing Median Age is a key indicator of the extent of
aging of the population, which can have serious implications for the health
and other social services of a country. In 2018, the Median Age of
Montserrat’s population was 40 years which increased from 37.7 years in
2011.

MONTSERRAT STATISTICS DEPARTMENT LABOUR FORCE CENSUS RESULTS
10 | P a g e
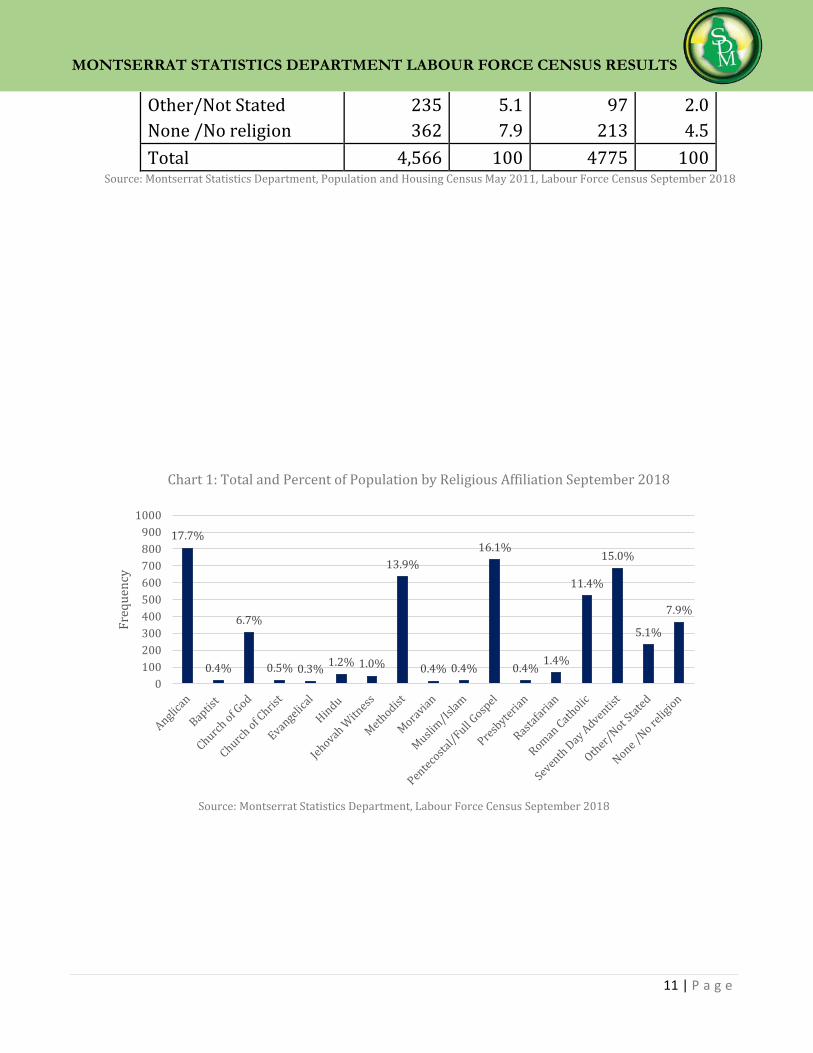
vii. Religious Affiliation:
The tables and charts below show the pattern of religious affiliations in
Montserrat between the past two censuses of 2011 and 2018. It is clear that
Anglican, the largest religious denomination in 2011, maintained its rank in
2018. In 2011, the Pentecostal/Full Gospel faith ranked second and also
retained this position in 2018. The table also shows that the Seventh Day
Adventist faith grew from its 13.9% share in 2011 to a share of 15% in
2018, making it the third largest religious denomination in Montserrat in
2018. Another noteworthy point is that the percentage share of the persons
who reported ‘None/No Religion’ increased from 4.5% of the population in
2011 to 7.9% in 2018.
Table 1: Total and Percent of Population by Religious Affiliation May 2011 & September 2018
Religion
2018 2011
Frequency Percent Frequency Percent
Anglican 806 17.7 933 19.5
Baptist 20 0.4 14 0.3
Church of God 305 6.7 370 7.7
Church of Christ 21 0.5 44 0.9
Evangelical 15 0.3 138 2.9
Hindu 56 1.2 62 1.3
Jehovah Witness 47 1.0 30 0.6
Methodist 635 13.9 758 15.9
Moravian 17 0.4 3 0.1
Muslim/Islam 19 0.4 8 0.2 Pentecostal/Full Gospel
736 16.1 787 16.5
Presbyterian 19 0.4 5 0.1
Rastafarian 66 1.4 56 1.2
Roman Catholic 522 11.4 595 12.5
Seventh Day Adventist 685 15.0 662 13.9
MONTSERRAT STATISTICS DEPARTMENT LABOUR FORCE CENSUS RESULTS
11 | P a g e
Other/Not Stated 235 5.1 97 2.0
None /No religion 362 7.9 213 4.5
Total 4,566 100 4775 100 Source: Montserrat Statistics Department, Population and Housing Census May 2011, Labour Force Census September 2018
Chart 1: Total and Percent of Population by Religious Affiliation September 2018
Source: Montserrat Statistics Department, Labour Force Census September 2018
17.7%
0.4%
6.7%
0.5% 0.3%1.2% 1.0%
13.9%
0.4% 0.4%
16.1%
0.4%1.4%
11.4%
15.0%
5.1%
7.9%
0
100
200
300
400
500
600
700
800
900
1000
Fre
qu
ency

MONTSERRAT STATISTICS DEPARTMENT LABOUR FORCE CENSUS RESULTS
12 | P a g e
Chart 2: Total and Percent of Population by Religious Affiliation May 2011
Source: Montserrat Statistics Department, Population and Housing Census – May 2011
2. Housing Characteristics
The type of housing, the construction materials used for the outer walls, type of
Toilet facilities, Lighting, access to potable water - together with other related
housing conditions of the population are very powerful indicators of the standard of
living of the people. This section presents a snapshot of some of these key
characteristics and comparative tables are presented for the situation in 2011,
according to the 2011 Census. Some notable features in these tables are: the
percentage of dwelling units that are part of a private house increased from 1.4% in
2011 to 5.4% in 2018; in 2018 more households live in dwellings whose outer
walls are a combination of wood and galvanize (0.5% in 2011 to 2.6% in 2018);
for the main source of Drinking Water, the much larger Other/Not Stated in 2018
could signal the need for some intervention; the 1.6% for the combined Not
Stated/None/Other categories in 2018 to the question about Toilet Facilities is also
of concern; also, for the Source of Lighting question, the less than 2% of households
who did not state or stated another source other than the conventional means of
lighting may also be of some concern; finally, internet access increased steeply from
19.5%
0.3%
7.7%
0.9%
2.9%1.3% 0.6%
15.9%
0.1% 0.2%
16.5%
0.1%1.2%
12.5%13.9%
2.0%
4.5%
0
100
200
300
400
500
600
700
800
900
1000
Fre
qu
ency

MONTSERRAT STATISTICS DEPARTMENT LABOUR FORCE CENSUS RESULTS
13 | P a g e
41% in 2011 to 68% in 2018 and access to mobile telephone has increased from
82% to 90% in the same period.
i. Household Population by Type of Dwelling Total Population only
Table 2: Total and Percent of Households by Type of Dwelling September 2018
Source: Montserrat Statistics Department, Population and Housing Census May 2011, Labour Force Census September 2018
Chart 3: Percentage of Households by Type of Dwelling September 2018
Source: Montserrat Statistics Department, Labour Force Census September 2018
68.9
16.9
6.5 5.4
1.3 1.4
Undivided Private House Flat/Apartment/Condominium
Double House/Duplex Part of Private House
Combined Business and Dwelling Other
Dwelling Type 2018 2011
Frequency Percent Frequency Percent
Undivided Private House 1,532 68.9 1,697 72.7
Flat/Apartment/Condominium 369 16.6 367 15.7
Double House/Duplex 144 6.5 173 7.4
Part of Private House 121 5.4 32 1.4
Combined Business and Dwelling 28 1.3 62 2.7
Other 31 1.4 4 0.2
Total 2,225 100 2,335 100

MONTSERRAT STATISTICS DEPARTMENT LABOUR FORCE CENSUS RESULTS
14 | P a g e
Chart 4: Percentage of Households by Type of Dwelling May 2011
Source: Montserrat Statistics Department, Population and Housing Census – May 2011
ii. Type of Construction Material for Outer Walls
Table 3: Total and Percent of Households by Type of Construction Material for Outer Walls
2011 & 2018
Source: Montserrat Statistics Department, Population and Housing Census May 2011, Labour Force Census September 2018
72.7
1.4
15.7
7.4
2.7 0.2
Undivided Private House Part of a Private House
Flat/apartment/condominium Double house/Duplex
Combined Business and Dwelling Other
Construction Material 2018 2011
Frequency Percent Frequency Percent
Concrete/Concrete Blocks 1,673 75.2 1,657 71.0
Wood/Timber 273 12.3 476 20.4
Wood & Concrete 166 7.5 175 7.5
Wood & Galvanize 57 2.6 11 0.5
Other 56 2.0 16 0.7
Total 2,225 100 2,335 100

MONTSERRAT STATISTICS DEPARTMENT LABOUR FORCE CENSUS RESULTS
15 | P a g e
Chart 5: Percentage of Households by Type of Construction Material for Outer Walls September 2018
Source: Montserrat Statistics Department, Labour Force Census September 2018
Chart 6: Percentage of Households by Type of Construction Material for Outer Walls May 2011
Source: Montserrat Statistics Department, Population and Housing Census – May 2011
75.2
12.3
7.5
2.62.5
Concrete/Concrete Blocks Wood/Timber Wood & Concrete Wood & Galvanize Other
71.0
20.4
7.5
0.5 0.7
Concrete/Concrete Blocks Wood/Timber Wood & Concrete Wood & Galvanize Other

MONTSERRAT STATISTICS DEPARTMENT LABOUR FORCE CENSUS RESULTS
16 | P a g e
iii. Main Source of Drinking Water
Table 4: Total and Percent of Households by Main Source of Drinking Water Supply May 2011 &
September 2018
Main Source of Drinking Water
2018 2011 Frequency Percent Frequency Percent
Public piped into dwelling 2,173 97.7 2,234 95.7
Public piped into yard 23 1.00 51 2.2
Other 16 0.72 49 2.1
Not stated 13 0.58 0 0
Total 2,225 100 2,335 100 Source: Montserrat Statistics Department, Population and Housing Census May 2011, Labour Force Census September
2018
Chart 7: Total Percent of Households by Main Source of Drinking Water Supply September 2018
Source: Montserrat Statistics Department, Labour Force Census September 2018
97.7
1
0.72
0.58
Public piped into dwelling Public piped into yard Other Not stated
MONTSERRAT STATISTICS DEPARTMENT LABOUR FORCE CENSUS RESULTS
17 | P a g e
Chart 8: Total and Percent of Households by Main Source of Drinking Water Supply May 2011
Source: Montserrat Statistics Department, Population and Housing Census - May 2011
iv. Type of Toilet Facilities
Table 5: Total and Percent of Households by Toilet Type May 2011 & September 2018
Source: Montserrat Statistics Department, Population and Housing Census May 2011, Labour Force Census September 2018
95.7%2.2% 2.1%
0%2.1%
Public piped into dwelling Public piped into yard Other Not Stated
Toilet Type 2018 2011
Frequency Percent Frequency Percent
Flush Toilet to Septic/Soak 1,757 79.0 1,805 77.3
Flush Toilet to Sewer 421 18.9 432 18.5
Not Stated 12 0.5 0 0
None 18 0.8 40 1.7
Pit Latrine 10 0.4 55 2.4
Other 7 0.3 7 0.1
Total 2,225 100 2,335 100

MONTSERRAT STATISTICS DEPARTMENT LABOUR FORCE CENSUS RESULTS
18 | P a g e
Chart 9: Total and Percent of Households by Toilet Type September 2018
Source: Montserrat Statistics Department, Labour Force Census September 2018
Chart 10: Total and Percent of Households by Toilet Type May 2011
Source: Montserrat Statistics Department, Population and Housing Census – May 2011
0
200
400
600
800
1000
1200
1400
1600
1800
Flush toiletlinked to
septic/ soak
Flush toiletlinked to
sewer
Not Stated None Pit-latrine Other
79.0%
18.9%
0.5% 0.8% 0.4% 0.3%
0
200
400
600
800
1000
1200
1400
1600
1800
2000
Flush toiletlinked to septic
Flush toiletlinked to sewer
Not stated None Pit Latrine
77.3%
18.5%
0% 1.7% 2.4%

MONTSERRAT STATISTICS DEPARTMENT LABOUR FORCE CENSUS RESULTS
19 | P a g e
v. Main Source of Lighting
Table 6: Total and Percent of Households by Electricity Type May 2011 & September 2018
Source: Montserrat Statistics Department, Population and Housing Census May 2011, Labour Force Census September 2018
Chart 11: Total and Percent of Households by Electricity Type Sep - Nov
2018
Source: Montserrat Statistics Department, Labour Force Census September 2018
98.3%
1.2%
0.5%
0 500 1000 1500 2000 2500
Electricity-Public
None/Not Stated
Other
Electricity-Public None/Not Stated Other
Frequency 2187 27 11
Electricity Type 2018 2011
Frequency Percent Frequency Percent
Electricity-Public 2,187 98.3 2,273 97.3
None/Not Stated 27 1.2 9 0.4
Other 11 0.5 53 2.3
Total 2,225 100 2,335 100

MONTSERRAT STATISTICS DEPARTMENT LABOUR FORCE CENSUS RESULTS
20 | P a g e
Chart 12: Total and Percent of Households by Electricity Type - May 2011
Source: Montserrat Statistics Department, Population and Housing Census – May 2011
vi. Dwelling Unit Owned, Rented or Leased
Table 7: Total and Percent of Households by Ownership Type May 2011 & September 2018
Type of Ownership of Dwelling
2018 2011 Frequency Percent Frequency Percent
Owned (Outright) 800 36 856 36.7 Owned (Mortgage) 405 18.2 370 15.8 Rented Private 704 31.6 652 27.9 Rent Free 140 6.3 186 8 Rented Government 91 4.1 258 11 Other 85 3.8 13 0.6 Total 2,225 100 2335 100
Source: Montserrat Statistics Department, Population and Housing Census May 2011, Labour Force Census
September 2018
97.3%
0.4%
2.3%
0 500 1000 1500 2000 2500
Electricity-Public
None/Not Stated
Other
Electricity-Public None/Not Stated Other
Frequency 2273 9 53

MONTSERRAT STATISTICS DEPARTMENT LABOUR FORCE CENSUS RESULTS
21 | P a g e
Chart 13: Total and Percent of Households by Ownership Type September 2018
Source: Montserrat Statistics Department, Labour Force Census September 2018
Chart 14: Total and Percent of Households by Ownership Type May 2011
Source: Montserrat Statistics Department, Population and Housing Census – May 2011
36.0%
18.2%
31.6%
6.3%4.1% 3.8%
0%
5%
10%
15%
20%
25%
30%
35%
40%
Owned(Outright)
Owned(Mortgage)
Rented Private Rent Free RentedGovernment
Other
36.7%
15.8%
27.9%
8.0%
11.0%
0.6%
0%
5%
10%
15%
20%
25%
30%
35%
40%
Owned(Outright)
Owned(Mortgage)
Rented Private Rent Free RentedGovernment
Other

MONTSERRAT STATISTICS DEPARTMENT LABOUR FORCE CENSUS RESULTS
22 | P a g e
vii. Ownership/Access to Household Durables:
Table 8: Total and Percent of Households by Ownership/Access to Household Durables May 2011 & September 2018
Type of Household
Appliance/Device
2018 2011
Frequency Percent Frequency Percent
Refrigerator 2121 95.3 2141 91.7
Electric/Gas Stove 2098 94.3 2223 95.2
Washing Machine 1650 74.2 1504 64.4
Mobile Telephone 2006 90.2 1922 82.3
Computer/Laptop 1152 51.8 1161 49.7
Internet Access 1513 68 964 41.3
Radio 1580 71 2023 86.6
Source: Montserrat Statistics Department, Population and Housing Census May 2011, Labour Force Census 2018
Chart 15: Percentage of Households by Ownership/Access to Household Durables
May 2011 and September 2018
Source: Montserrat Statistics Department, Population and Housing Census May 2011, Labour Force Census September 2018
91.7%95.2%
64.4%
82.3%
49.7%
41.3%
86.6%
95.3% 94.3%
74.2%
90.2%
51.8%
68% 71%
0
20
40
60
80
100
120
Refrigerator Electric/Gas Stove Washing Machine Mobile Telephone Computer/Laptop Internet Access Radio

MONTSERRAT STATISTICS DEPARTMENT LABOUR FORCE CENSUS RESULTS
23 | P a g e
321.6%
181.0%
Figures for 2011
Males Females
Total: 50 (1.3%)
3. Education
The indicators below provide an overview of achievements in Education at the
various formal levels and are disaggregated by sex. As far as possible, comparative
figures for 2011 are quoted alongside the 2018 indicators.
i. Population who have not completed any level of formal Education (of the
15+ years)
Table 9: Total and percentage who have not completed any level of formal Education (of the 15+ years).
Year Total % Males % Females %
2018 55 1.5 29 1.6 26 1.4
2011 50 1.3 32 1.6 18 1.0 Source: Montserrat Statistics Department, Population and Housing Census May 2011, Labour Force Census September 2018
Chart 16: Total and percentage who have not completed any level of formal Education (of the 15+
years)
Source: Montserrat Statistics Department, Population and Housing Census May 2011, Labour Force Census September 2018
291.6%
261.4%
Figures for 2018
Males Females
Total: 55 (1.5%)

MONTSERRAT STATISTICS DEPARTMENT LABOUR FORCE CENSUS RESULTS
24 | P a g e
32917.9%
25313.5%
Figures for 2018
Males Females
Total: 583 (15.7%)
50125.3%
36920.01%
Figures for 2011
Males Females
Total: 870 (22.83%)
For both census years, the data show that there is hardly any difference in the percentage of the population 15 years and over who did not complete any formal level of education – 1.5% in 2018 and 1.3% in 2011. There is also hardly any differences between the sexes with respect to this indicator.
ii. Population who have completed Primary level of Education ONLY (of the
15+ years and over)
Table 10: Total and percentage of who have completed Primary level of Education ONLY (of the 15+
years).
Year Total % Males % Females %
2018 582 15.7 329 17.9 253 13.5
2011 870 22.8 501 25.3 369 20.1 Source: Montserrat Statistics Department, Population and Housing Census May 2011, Labour Force Census September 2018
Chart 17: Total and percentage of who have completed Primary level of Education ONLY (of the 15+
years).
Source: Montserrat Statistics Department, Population and Housing Census May 2011, Labour Force Census September 2018

MONTSERRAT STATISTICS DEPARTMENT LABOUR FORCE CENSUS RESULTS
25 | P a g e
45825.5%
40423.8%
Figures for 2011
Males Females
Total: 862 (24.66%)
The table and graphs above show that in 2011, 22.8% of the population 15 years and over had completed only Primary Level of Education. In 2018, this indicator dropped to 15.7% which shows a marked improvement over 2011. A similar pattern is shown for each of the sexes.
iii. Population who have completed Secondary level of Education ONLY (of the
20+ years and over)
Table 11: Total and percentage who have completed Secondary level of Education ONLY (of the 20+ years
and over).
Year Total % Males % Females %
2018 1076 31.2 572 33.4 504 29.1
2011 862 24.7 458 25.5 404 23.8 Source: Montserrat Statistics Department, Population and Housing Census May 2011, Labour Force Census September 2018
Chart 18: Total and percentage of who have completed Secondary level of Education ONLY (of the 20+
years and over).
Source: Montserrat Statistics Department, Population and Housing Census May 2011, Labour Force Census September 2018
57233.4%
504 29.1%
Figures for 2018
Males Females
Total: 1076 (32.3%)

MONTSERRAT STATISTICS DEPARTMENT LABOUR FORCE CENSUS RESULTS
26 | P a g e
With respect to completion of secondary education, the table and graphs show an increase in the completion rate in 2018 (31.2%) compared to 24.7% in 2011. For both census years, more males than females completed this level of education.
iv. Population who have completed University level of Education (of the 25+
years and over)
Table 12: Total and percentage of who have completed University level of Education (of the 25+ years and
over)
Year Total % Males % Females %
2018 661 20.7 262 16.7 399 24.5
2011 554 17.2 229 14.5 325 19.7 Source: Montserrat Statistics Department, Population and Housing Census May 2011, Labour Force Census September 2018
Chart 19: Total and percentage who have completed University level of Education (of the 25+ years and
over)
Source: Montserrat Statistics Department, Population and Housing Census May 2011, Labour Force Census September 2018
26216.7%
39924.5%
Figures for 2018
Male Female
22914.5%
32519.7%
Figures for 2011
Male Female

MONTSERRAT STATISTICS DEPARTMENT LABOUR FORCE CENSUS RESULTS
27 | P a g e
The table and graphs show an improvement in the completion of University level
education between 2011 and 2018. In 2011, 17.2% of the population had completed
University whereas in 2018 this figure increased to almost 21% of the population.
The data also show that in both years, more females than males completed this high
level of education.
4. Migration
i. Population by Citizenship:
The tables below show a marked change in Citizenship in Montserrat between 2011 and 2018. Whereas 72% of the population in 2011 were citizens, this figure dropped to 63% in 2018.
Table 13: Absolute Numbers by Citizenship: Census 2011 and 2018
Year Total Males Females
Citizens Non-Citizens Citizens Non-Citizens Citizens Non-Citizens
2018 2,859 1,707 1,461 795 1,398 912
2011 3,448 1,327 1,840 626 1,608 701 Source: Montserrat Statistics Department, Population and Housing Census May 2011, Labour Force Census September
2018
Table 13: Percentage Breakdown of Citizens: Census 2011 and 2018
Year Total Males Females
Citizens Non-Citizens Citizens Non-Citizens Citizens Non-Citizens
2018 63% 37% 65% 35% 61% 39%
2011 72% 28% 75% 25% 70% 30% Source: Montserrat Statistics Department, Population and Housing Census May 2011, Labour Force Census September
2018

MONTSERRAT STATISTICS DEPARTMENT LABOUR FORCE CENSUS RESULTS
28 | P a g e
ii. Total Population by Major country of Birth:
The table and graph below present information on the distribution of the population by local and foreign born for census years 2011 and 2018. For both years, persons born in Guyana, Jamaica, the United Kingdom and Dominica, in that order, account for the largest shares of the foreign born population.
Table 14: Total and Percent of Population by Major Country of Birth – May 2011 & September 2018
Country of Birth 2018 2011
Actuals % Actuals %
Montserrat 2564 56.2 2915 61.1
Guyana 490 10.7 597 12.5
Jamaica 377 8.3 254 5.3
United Kingdom 166 3.6 151 3.2
Dominica 157 3.4 139 2.9
Dominican Republic 148 3.2 136 2.8
Antigua and Barbuda 117 2.6 119 2.5
Haiti 100 2.2 31 0.7
United States of America 81 1.8 87 1.8
Saint Kitts and Nevis 72 1.6 69 1.4
Others/Not Stated 294 6.4 277 5.8
Total 4,566 100 4,775 100 Source: Montserrat Statistics Department, Population and Housing Census May 2011, Labour Force Census September 2018

MONTSERRAT STATISTICS DEPARTMENT LABOUR FORCE CENSUS RESULTS
29 | P a g e
Chart 20: Total and Percent of Population by Major Country of Birth: September 2018
Source: Montserrat Statistics Department, Population and Housing Census – September 2018
Chart 21: Total and Percent of Population by Major Country of Birth: May 2011
Source: Montserrat Statistics Department, Population and Housing Census May 2011
56.2%
10.7%8.3%
3.6%% 3.4% 3.2% 2.6% 2.2% 1.8% 1.6%6.4%
0
500
1000
1500
2000
2500
3000
61.1%
12.5%
5.3% 3.2% 2.9% 2.8% 2.5% 0.7% 1.8% 1.4%5.8%
0
500
1000
1500
2000
2500
3000
3500

MONTSERRAT STATISTICS DEPARTMENT LABOUR FORCE CENSUS RESULTS
30 | P a g e
5. Economic Activity
The following set of indicators in this report relate to recent Economic Activity for the population of Montserrat. Some of the highlights here include: a growing Participation Rate but an accompanying growing Dependency Rate; the absolute number of Employed persons have dropped slightly in 2018 from its level in 2011; similarly, the absolute number of the Unemployed has also decreased; the Unemployment Rate was 6.5% from the Census in 2018 compared with 6.6% from the 2011 Census. The figures also show that Youth Unemployment declined from its level of 16.9% in 2011 to 11.8% in 2018. Employment by Industry is also presented in the table below both for 2011 and 2018. The 2018 data show a larger percentage of the Employed (5%) are engaged in Agriculture, Hunting, Forestry and Fishing than it was in 2011 (2.2%)

MONTSERRAT STATISTICS DEPARTMENT LABOUR FORCE CENSUS RESULTS
31 | P a g e
i. Employment by Industrial Sector (%):
Table 15: Number Employed by Industry Group and Percentage Census 2018 and 2011
Industry Group 2018 2011
Frequency % Frequency %
Agriculture, Hunting, Forestry & Fishing 114 5 58 2.2
Mining & Quarrying 40 2 29 1.1
Manufacturing 42 2 102 3.9
Electricity Gas Water Supply 79 3 77 2.9
Construction 243 10 388 14.9
Wholesale & Retail Trade 286 11 292 11.2
Hotels & Restaurants 145 6 109 4.2
Transport Storage and Communication 145 6 179 6.9
Financial Intermediation 86 3 69 2.6
Real Estate Renting & Business Activities 72 3 86 3.3
Public Administration & Defense Compulsory Social Security 617 24 649 24.9
Education 164 6 132 5.1
Health & Social Work 209 8 221 8.5
Other Community Social and Personal Service Activities 144 6 73 2.8
Activities of Private households as employers of Undifferentiated 110 4 138 5.3
Not Stated/Don’t Know 31 1 4 0.2
Total 2,527 100 2,606 100 Source: Montserrat Statistics Department, Population and Housing Census May 2011, Labour Force Census September 2018

MONTSERRAT STATISTICS DEPARTMENT LABOUR FORCE CENSUS RESULTS
32 | P a g e
Chart 22: Number Employed by Industry Group Census 2018 and 2011
Source: Montserrat Statistics Department, Population and Housing Census May 2011, Labour Force Census September 2018
ii. Working Age Population (WAP): The WAP is internationally defined as
those persons aged 15-64 years old. The WAP for Montserrat in 2018 and 2011 are given in numbers and accompanying graph below. There has been no significant change in the size or percentage share of the WAP over the two census years.
114
40
42
79
243
286
145
145
86
72
617
164
209
144
110
31
58
29
102
77
388
292
109
179
69
86
649
132
221
73
138
4
0 100 200 300 400 500 600 700
Agriculture Hunting & Forestry & Fishing
Mining & Quarrying
Manufacturing
Electricity Gas Water Supply
Construction
Wholesale & Retail Trade
Hotels & Restaurants
Transport Storage and Communication
Financial Intermediation
Real Estate Renting & Business Activities
Public Administration & Defense Compulsory Social…
Education
Health & Social Work
Other Community Social and Personal Service Activities
Activities of Private households as employers of…
Not Stated/Don’t Know
2011 2018

MONTSERRAT STATISTICS DEPARTMENT LABOUR FORCE CENSUS RESULTS
33 | P a g e
Table 16: Total and Percentage of Working Age Population by Sex
Year Total % Males % Females %
2018 3,025 66 1,479 66 1,546 67
2011 3,193 67 1,664 67 1,529 66 Source: Montserrat Statistics Department, Population and Housing Census May 2011, Labour Force Census September 2018
iii. The basic indicator of Employment is the proportion of the WAP who are
employed. The 2018 data for Montserrat shows that this indicator was
81.3%. The comparative figure for 2011 was 80%.
iv. Overall Dependency Ratio: The Dependency Ratio is defined as the sum of those persons 0-14 years plus those 65+ years divided by the total WAP and then multiplied by 100. For Montserrat in 2018, this was almost 51 and was 50 in 2011. This means that, in 2018, there were about 51 persons in the dependent ages for every 100 in the working ages
v. Employed Population: The standard international definition of the
Employed includes all those who reported doing any form of work for pay or profit for at least one hour during a fixed reference period, usually a week. It also includes all those who had a business or those who were away from their job but were receiving a pay or profit during the reference period. For Montserrat and for the reference week of September 16 to September 22, 2018 the following results were obtained for the Employed:
Table 17: Number of Employed Population by Sex
Year Total Males Females
2018 2527 1251 1276
2011 2,540 1,357 1,183 Source: Montserrat Statistics Department, Population and Housing Census May 2011, Labour Force Census September 2018

MONTSERRAT STATISTICS DEPARTMENT LABOUR FORCE CENSUS RESULTS
34 | P a g e
Chart 23: Portion of Working Age Population Employed 2011 vs 2018
Source: Montserrat Statistics Department, Population and Housing Census May 2011, Labour Force Census September 2018
Chart 24: Employed Population by Total and Sex 2011 vs 2018
Source: Montserrat Statistics Department, Population and Housing Census May 2011, Labour Force Census September 2018
80%(2540÷3242)
83%(2527÷3025)
2011 2018
135712511183 1276
2540 2527
0
500
1000
1500
2000
2500
3000
2011 2018
Nu
mb
er
Em
plo
ye
d
Years
Male Female Total

MONTSERRAT STATISTICS DEPARTMENT LABOUR FORCE CENSUS RESULTS
35 | P a g e
vi. Unemployed Population: Following the standard international definition, the Unemployed Population are those persons who reported that they were EITHER ‘Looking for Work’ Or ‘Wanted Work’ and were available to work during the reference period. The results for the 2018 and 2011 censuses are as follows:
Table 18: Unemployed Population by Sex 2011 vs 2018
Year Total Males Females
2018 176 97 79
2011 178 128 50 Source: Montserrat Statistics Department, Population and Housing Census May 2011, Labour Force Census September 2018
Chart 25: Unemployed Population by Total and Sex 2011 vs 2018
Source: Montserrat Statistics Department, Population and Housing Census May 2011, Labour Force Census September 2018
128
97
50
79
178 176
0
20
40
60
80
100
120
140
160
180
200
2011 2018
Nu
mb
er
Years
Male Female Total

MONTSERRAT STATISTICS DEPARTMENT LABOUR FORCE CENSUS RESULTS
36 | P a g e
Chart 26: Overall Dependency Ratio 2011 vs 2018
Source: Montserrat Statistics Department, Population and Housing Census May 2011, Labour Force Census September 2018
vii. The Labour Force in a population comprises those who are working (the Employed) and those who are seeking work (the Unemployed). The Labour Force measures the extent of Economic Activity. The total size of the Labour Force for 2018 and 2011 is presented in the table below. It is clear that the labour force did not grow in size, in absolute terms, between the two census years. However, as a percentage of the WAP, it did increase between the period (see Labour Force Participation Rate below)
Table 19: Labour Force by Sex
Year Total Males Females
2018 2,703 1,348 1,355
2011 2,718 1,485 1,233 Source: Montserrat Statistics Department, Population and Housing Census May 2011, Labour Force Census September 2018
50%
51%
2011 2018

MONTSERRAT STATISTICS DEPARTMENT LABOUR FORCE CENSUS RESULTS
37 | P a g e
viii. Labour Force Participation Rate is defined as the Total Labour Force as a percent of the WAP. The Labour Force Participation Rate for 2018 was therefore 89.4%. The comparative figure for 2011 is 85.1%.
Chart 27: Labour Force Participation Rate
Source: Montserrat Statistics Department, Population and Housing Census May 2011, Labour Force Census September 2018
ix. Unemployment Rate: The total Unemployed as a percent of the total Labour Force multiplied by 100 (to convert to percent) defines the Unemployment Rate. Hence, the rates for 2018 and 2011 are as follows:
Table 20: Unemployment Percentage by Sex
Year Total Males Females
2018 6.5% 7.2% 5.8%
2011 6.6% 8.6% 4.1% Source: Montserrat Statistics Department, Population and Housing Census May 2011, Labour Force Census September 2018
85.1%
89.4%
2011 2018

MONTSERRAT STATISTICS DEPARTMENT LABOUR FORCE CENSUS RESULTS
38 | P a g e
Chart 28: Unemployment Percentage by Sex
Source: Montserrat Statistics Department, Population and Housing Census May 2011, Labour Force Census September 2018
x. Unemployment Rate for Youths: The United Nations defines Youths as
those persons within the ages of 15 to 24 years. Hence, Youth
Unemployment for Montserrat was:
Table 21: Unemployment Percentage by Sex for Youths
Year Total Males Females
2018 11.8% 9.9% 14.1%
2011 16.9% 17.8% 15.6% Source: Montserrat Statistics Department, Population and Housing Census May 2011, Labour Force Census September 2018
8.6%
7.2%
4.1%
5.8%
6.6% 6.5%
0.0%
1.0%
2.0%
3.0%
4.0%
5.0%
6.0%
7.0%
8.0%
9.0%
10.0%
2011 2018
Pe
rce
nt
Years
Male Female Total

MONTSERRAT STATISTICS DEPARTMENT LABOUR FORCE CENSUS RESULTS
39 | P a g e
Chart 29: Unemployment Percentage by Sex for Youths
Source: Montserrat Statistics Department, Population and Housing Census May 2011, Labour Force Census September 2018
0.0%
5.0%
10.0%
15.0%
20.0%
2011 2018
17.8%
9.9%
15.6%14.1%
16.9%
11.8%P
erc
en
t
Years
Male Female Total