interactive visualization for the design, prototyping and ... · the case study •large scale...
TRANSCRIPT
Interactive Visualization for the Design,
Prototyping and Development of Research
Software
EPSRC RSE Fellow
In Research Computing and Imaging
Joanna Leng ([email protected])
The University of Warwick
Monday 17th June 2019

Stands for:
Research Software Engineer
New page on Wikipedia
• https://en.wikipedia.org/wiki/Research_software_engineering
• Research software engineering is the use of software engineering practices in research applications. The term started to be used in United Kingdom in 2012[1][2], when it was needed to define the type of software development needed in research. This focuses on reproducibility, reusability, and accuracy of data analysis and applications created for research.
What is an RSE?

• Set up the case study• Software development models• The visualization pipeline/model• A model for the evolution of research software• Python features that affect interactivity in
research software• The architecture of the visualization pipeline• Details of the case study• Importance of interactive visualization in
research software development• Information on RSEs
Talk Contents

Software not complete – a working case study Michelle Peckham and Alistair Curd are biologists at the
University of Leeds who develop and use novel imaging techniques. For example, Direct Stochastical Optical Reconstruction Microscopy
(dSTORM) is an emerging high-precision technique, for which new data analysis methods are needed, especially for 3D data and they are developing pattern analysis for this type of data.
Have inherited and developed Python 2 scripts that form a ‘messy’ software stack. Their script is called perpl.
These scripts need to be turned into an easy-to-use tool for researchers in their lab and for publication.
The Case Study

• Large scale activity• Generally top down, heavy on
administrative roles such as requirements capture and testing that responds to the legal needs of the client’s contract
• Fits the legal requirements and framework of the industry that uses the software application
• Uses methodologies and procedures for example the water fall model
Traditional Software Engineering

Diagram copied from http://en.wikipedia.org/wiki/Waterfall_model
The Waterfall Model
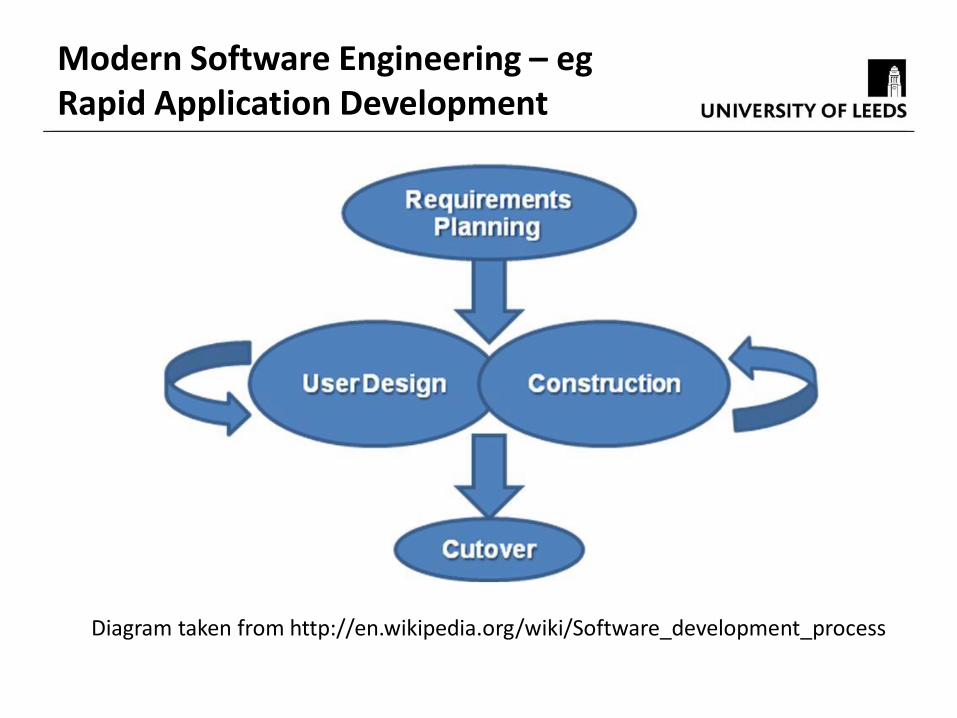
Modern Software Engineering – eg Rapid Application Development
Diagram taken from http://en.wikipedia.org/wiki/Software_development_process

Rapid Methods Need Craftsmanship
Practice makes perfect
Skills are application area specific
Skills are programming language specific
Methods and processes are adaptive so they can respond to client and the market
Communication between programmers and clients are important so less administration is needed
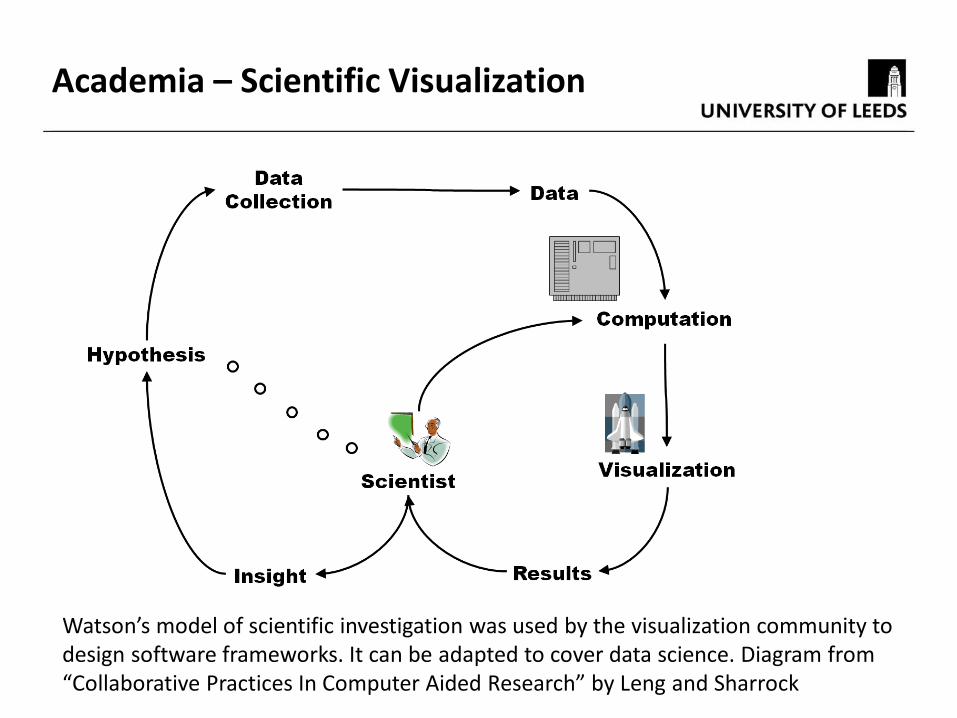
Academia – Scientific Visualization
Watson’s model of scientific investigation was used by the visualization community to design software frameworks. It can be adapted to cover data science. Diagram from “Collaborative Practices In Computer Aided Research” by Leng and Sharrock
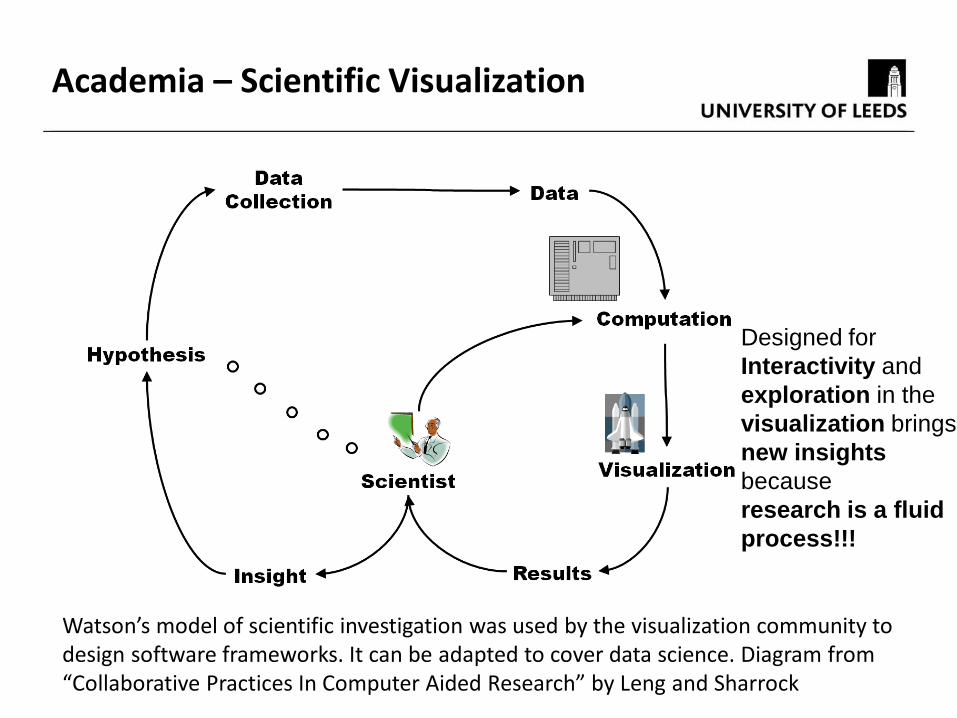
Academia – Scientific Visualization
Watson’s model of scientific investigation was used by the visualization community to design software frameworks. It can be adapted to cover data science. Diagram from “Collaborative Practices In Computer Aided Research” by Leng and Sharrock
Designed for
Interactivity and
exploration in the
visualization brings
new insights
because
research is a fluid
process!!!
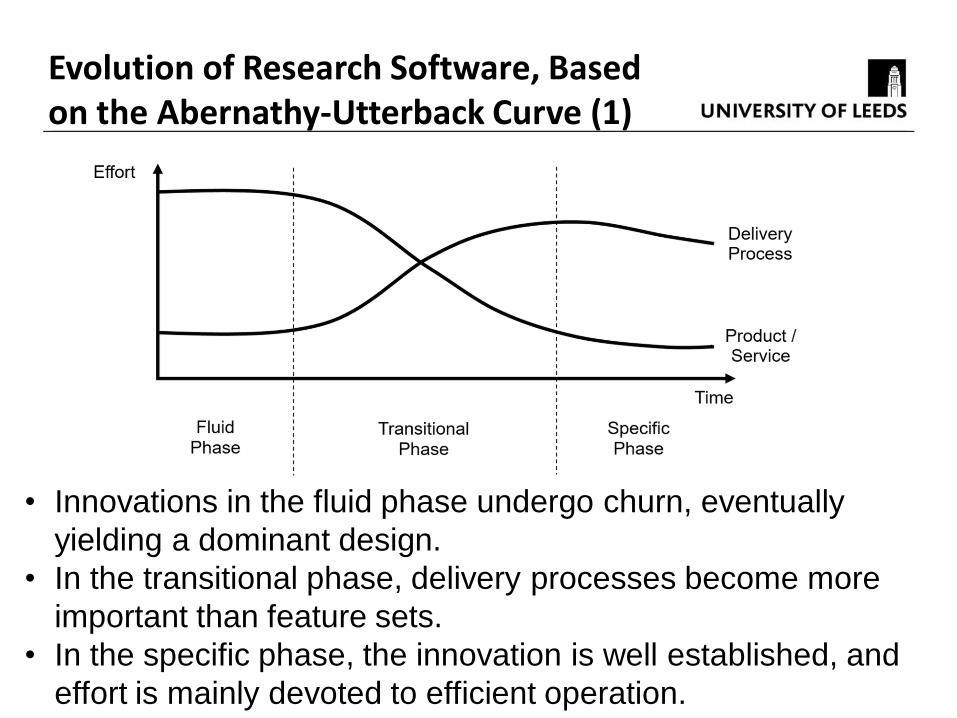
Evolution of Research Software, Based on the Abernathy-Utterback Curve (1)
• Innovations in the fluid phase undergo churn, eventually
yielding a dominant design.
• In the transitional phase, delivery processes become more
important than feature sets.
• In the specific phase, the innovation is well established, and
effort is mainly devoted to efficient operation.
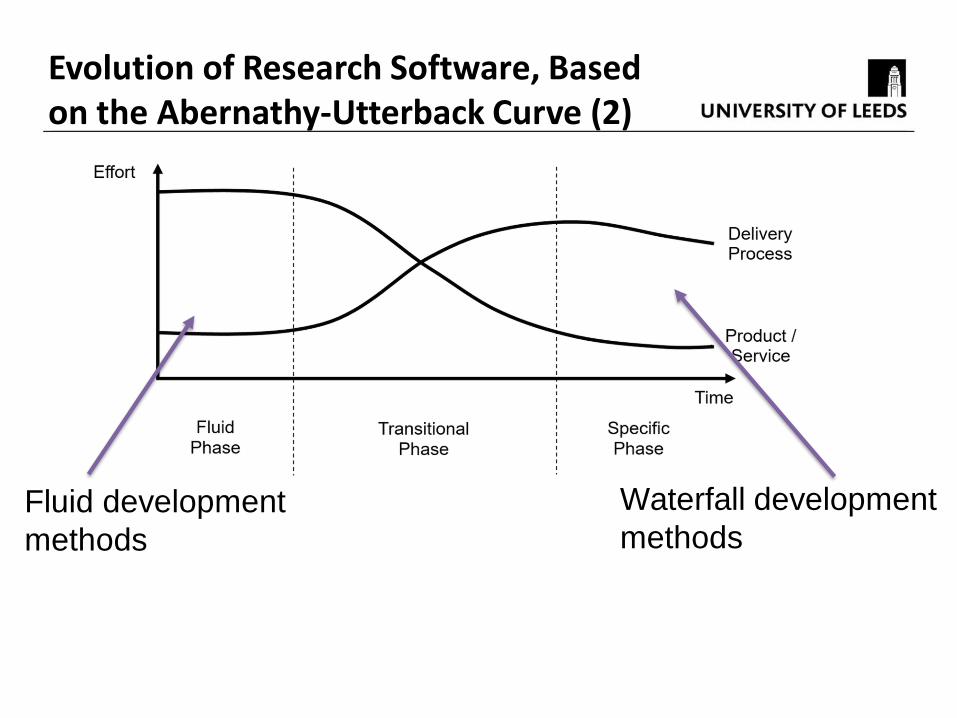
Evolution of Research Software, Based on the Abernathy-Utterback Curve (2)
Fluid development
methods
Waterfall development
methods

Evolution of Research Software, Based on the Abernathy-Utterback Curve (3)
Fluid development
methods
Waterfall development
methods
Seeing the waterfall as traditional and fluid as modern
is WRONG! They are suited to different parts of the
innovation pathway.

Python
Is an increasingly popular programming language in academia.
Is an interpreted programming language so you can test syntax on the command line. More interactive and exploratory than complied languages: Ipython and Jupyter note books have been ground
breaking offering new types of interactivity and sharing but are not always easy to convert into software run in batch mode.
The Spyder IDE as has interactive shell; good for interaction bad for secure software
Major differences between version 2 and 3 inhibit the adoption of version 3 in academia

Command Line Interfaces (CLI) vs Graphical User Interfaces (GUI)
There are large debates about which is better CLI or GUI. They can be very heated.
Generally as software becomes more complex it is easier to use a GUI however this reduces the options available and means it will not run in batch mode so…..
While some people prefer to use software via the command line (CLI) for some tasks others prefer to use a Graphical User Interface (GUI)
It is much harder to develop software that executes through a GUI than through the command line.

Consider the Visualization Pipeline
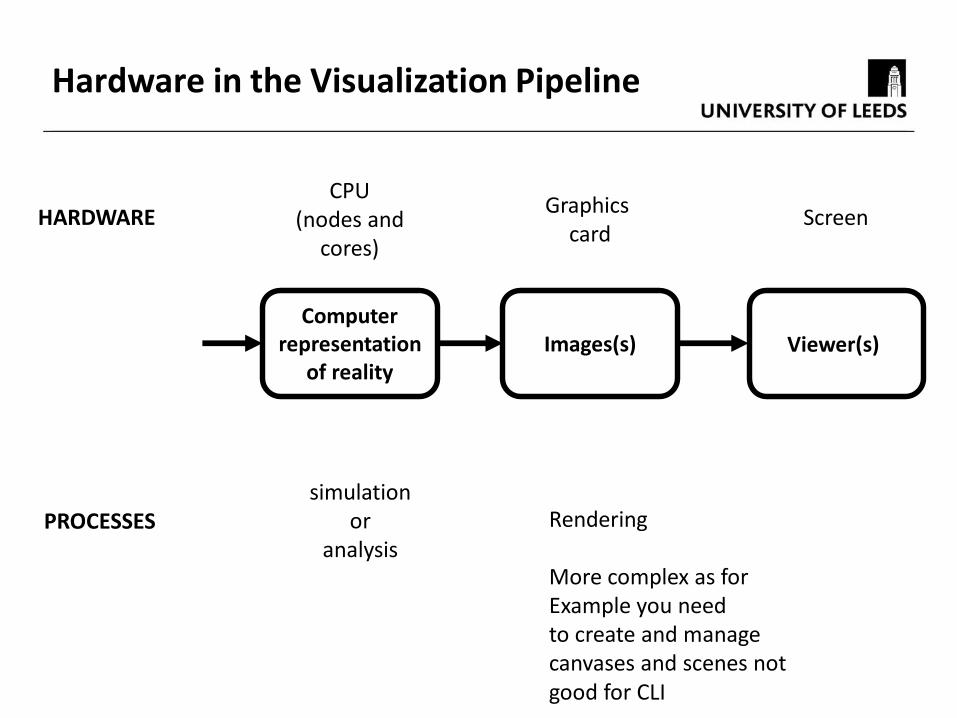
Hardware in the Visualization Pipeline
Computer representation
of realityImages(s) Viewer(s)i
CPU(nodes and
cores)
Graphics card
Screen
simulationor
analysis
Rendering
More complex as for Example you needto create and manage canvases and scenes notgood for CLI
HARDWARE
PROCESSES
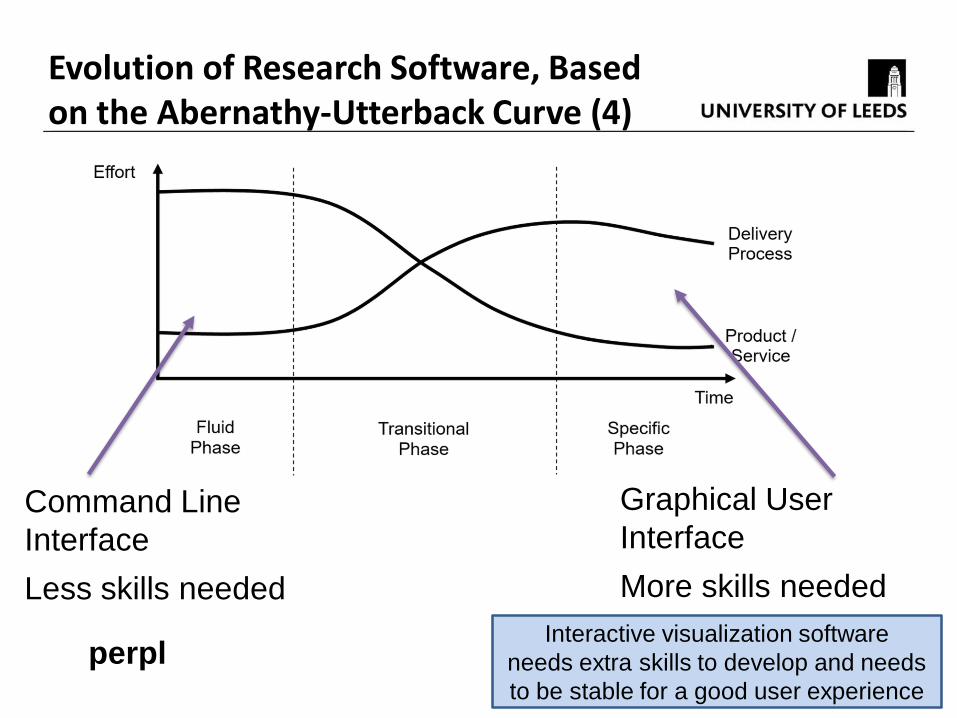
Evolution of Research Software, Based on the Abernathy-Utterback Curve (4)
Command Line
Interface
Graphical User
Interface
Less skills needed More skills needed
perplInteractive visualization software
needs extra skills to develop and needs
to be stable for a good user experience

Perpl
Developed in python 2 The original developer is skilled in
developing algorithms for dSTORM but is not a software engineer
His skills are suited to a Command Line Interface but wants to develop a GUI for ease-of-use
This is at odds with his skills, career path and this being a new area of innovation that requires flexability.

Perpl – from the Command Line
Mainly a command line utility but with a a GUI for file browsing and reading
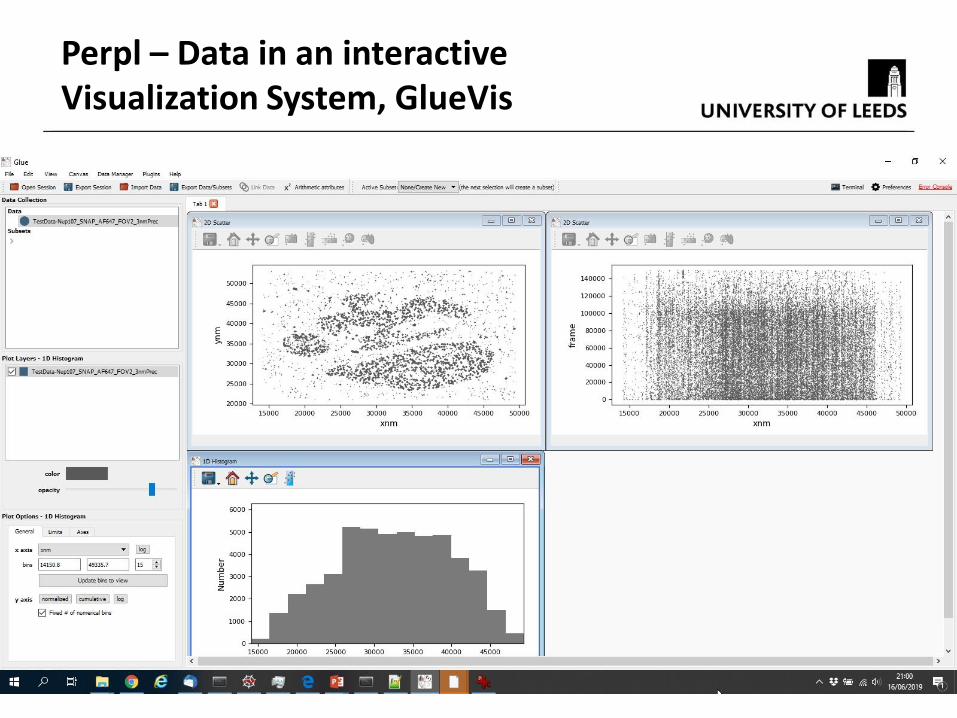
Perpl – Data in an interactive Visualization System, GlueVis
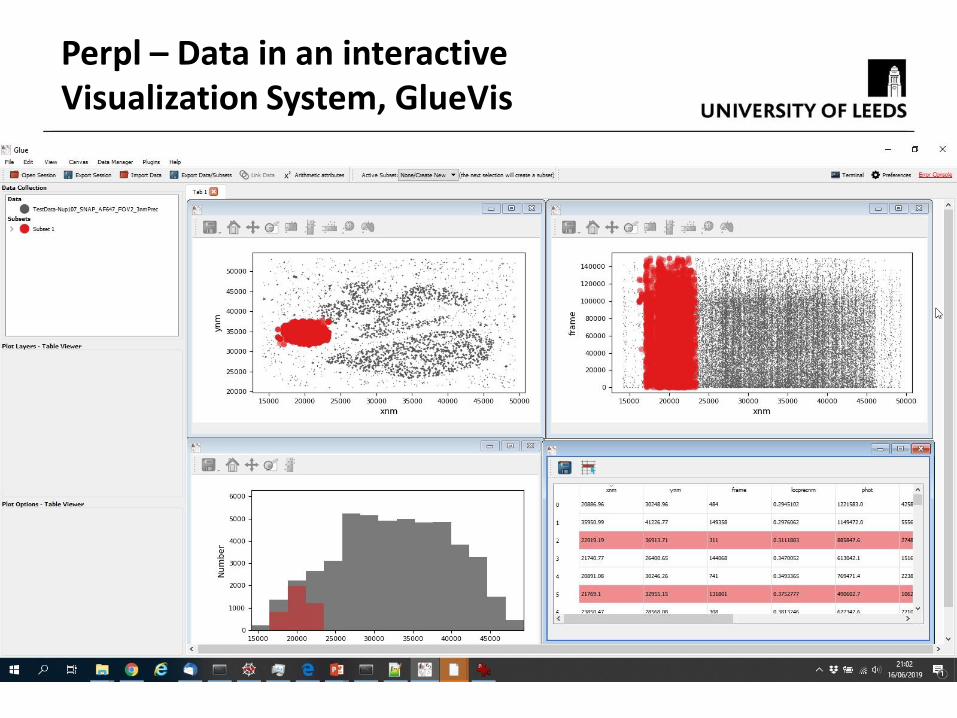
Perpl – Data in an interactive Visualization System, GlueVis

Perpl – Redesigned
GlueVis allows interactive visualization to a point but does not have the everything needed.
ImageJ is the standard application in this area but the python stack and the workflow does not easily translate into it. ImageJ uses Java and is designed for image array data but we have point data.
Reasonable effort is needed to get this working in either ImageJ or GlueVis
Now when the script runs a html report is created with graphs that we identified in GlueVis

Perpl – 3 Orthogonal Views

Perpl – 3 Orthogonal Zoom Views

Perpl – Histograms
Perpl – The Future
Need a new function where we compare the image data to simulated data.
The visualization and user interface design of this function will depend on the scientific needs and we will have to keep the design and development flexible until we have fully explored the scientific correctness of what is needed.

General Purpose Interactive Visualization Systems in Research Software Development
Allows the data to be explored without specialist knowledge of graphics or visualization.
Opens up a conversation with the research team to design the visualizations and the software architecture.
If the interactive visualization system does not have all the required functions you may be able to add modules and prototype within that system.
Once there is a prototype the research team can develop and optimize the final research software and workflow to their research problem inside or outside the interactive visualization package.

• Mailing List has 61 members: http://lists.leeds.ac.uk/mailman/listinfo/rse-network
• Twitter: @RSELeeds
• Committee has 6 people
• Next meeting is “The Benefits of Having an RSE Team” by Alun Ashton a senior RSE from Diamond Light Source
RSE Leeds Network

• The RSE Association
• http://rse.ac.uk/join-us/• Mailing list, slack channel
• RSE conference
• Software Sustainability Institute
• https://www.software.ac.uk/• Mailing list
• Collaborations Workshop
• Software Carpentry Foundation
• https://software-carpentry.org/• Mailing list and git repositories
Other RSE resources
• http://womeninhpc.org/• The is a newsletter and mailing list
• Raising Awareness of Women in HPC through Research; Raising the Profile of Women in HPC by Networking; Increasing the Visibility of Women in HPC through Events
• They run a variety of events at the main HPC conferences eg ISC and Supercomputing
Women in HPC