interactive visual alignment of medieval text versionsstjaenicke/iteal.pdf · interactive visual...
TRANSCRIPT
Interactive Visual Alignment of Medieval Text VersionsStefan Janicke∗
Image and Signal Processing Group, Institute for Computer Science, Leipzig University, Germany
David Joseph Wrisley†
Digital Humanities, New York University Abu Dhabi, United Arab Emirates
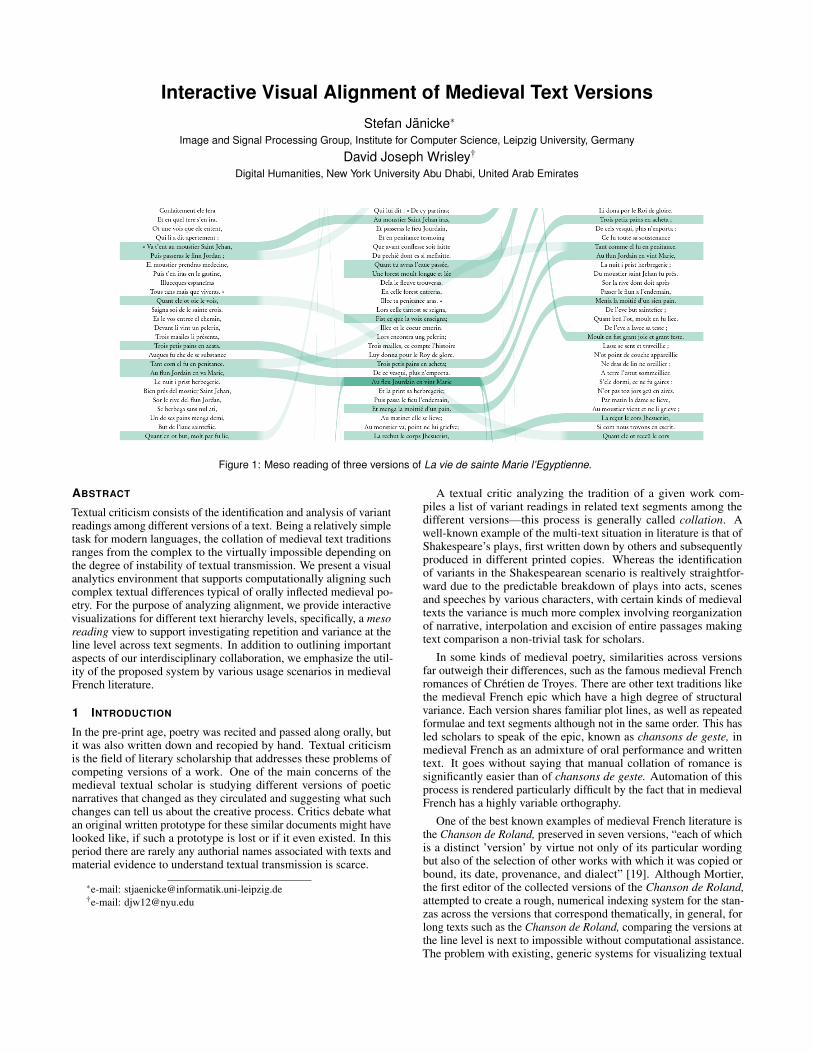
Figure 1: Meso reading of three versions of La vie de sainte Marie l’Egyptienne.
ABSTRACT
Textual criticism consists of the identification and analysis of variantreadings among different versions of a text. Being a relatively simpletask for modern languages, the collation of medieval text traditionsranges from the complex to the virtually impossible depending onthe degree of instability of textual transmission. We present a visualanalytics environment that supports computationally aligning suchcomplex textual differences typical of orally inflected medieval po-etry. For the purpose of analyzing alignment, we provide interactivevisualizations for different text hierarchy levels, specifically, a mesoreading view to support investigating repetition and variance at theline level across text segments. In addition to outlining importantaspects of our interdisciplinary collaboration, we emphasize the util-ity of the proposed system by various usage scenarios in medievalFrench literature.
1 INTRODUCTION
In the pre-print age, poetry was recited and passed along orally, butit was also written down and recopied by hand. Textual criticismis the field of literary scholarship that addresses these problems ofcompeting versions of a work. One of the main concerns of themedieval textual scholar is studying different versions of poeticnarratives that changed as they circulated and suggesting what suchchanges can tell us about the creative process. Critics debate whatan original written prototype for these similar documents might havelooked like, if such a prototype is lost or if it even existed. In thisperiod there are rarely any authorial names associated with texts andmaterial evidence to understand textual transmission is scarce.
∗e-mail: [email protected]†e-mail: [email protected]
A textual critic analyzing the tradition of a given work com-piles a list of variant readings in related text segments among thedifferent versions—this process is generally called collation. Awell-known example of the multi-text situation in literature is that ofShakespeare’s plays, first written down by others and subsequentlyproduced in different printed copies. Whereas the identificationof variants in the Shakespearean scenario is realtively straightfor-ward due to the predictable breakdown of plays into acts, scenesand speeches by various characters, with certain kinds of medievaltexts the variance is much more complex involving reorganizationof narrative, interpolation and excision of entire passages makingtext comparison a non-trivial task for scholars.
In some kinds of medieval poetry, similarities across versionsfar outweigh their differences, such as the famous medieval Frenchromances of Chretien de Troyes. There are other text traditions likethe medieval French epic which have a high degree of structuralvariance. Each version shares familiar plot lines, as well as repeatedformulae and text segments although not in the same order. This hasled scholars to speak of the epic, known as chansons de geste, inmedieval French as an admixture of oral performance and writtentext. It goes without saying that manual collation of romance issignificantly easier than of chansons de geste. Automation of thisprocess is rendered particularly difficult by the fact that in medievalFrench has a highly variable orthography.
One of the best known examples of medieval French literature isthe Chanson de Roland, preserved in seven versions, “each of whichis a distinct ’version’ by virtue not only of its particular wordingbut also of the selection of other works with which it was copied orbound, its date, provenance, and dialect” [19]. Although Mortier,the first editor of the collected versions of the Chanson de Roland,attempted to create a rough, numerical indexing system for the stan-zas across the versions that correspond thematically, in general, forlong texts such as the Chanson de Roland, comparing the versions atthe line level is next to impossible without computational assistance.The problem with existing, generic systems for visualizing textual
versions is that they are designed for texts that are mostly similarlike Chretien de Troyes’ romance. The textual record provides us,however, with many different, complex textual scenarios.
In order to fill this gap, the authors of this paper—a computerscientist and a medieval literary historian—came together and collab-orated on the development of a visual analytics system that supportsthe task of exploring the textual complexity of medieval orally-inflected poetry. The potential importance of such a system wasdiscussed in our paper at the annual digital humanities conference2016 [37]. To begin with, we developed a series of prototypes forcomputation alignment of highly variant text versions, and workedout best practices for visually conveying this variance. The gainedinsights ensured that the visual analytics system proposed in thepresent paper provides the medievalist with a full set of functions toexplore textual variance in depth on a number of different genres. Insummary, our contributions to the visualization community are:
• A visual analytics text alignment approach: In addition toa novel, parameter-driven approach to align highly unstabletext versions, we outline a visual analytics process that sup-ports the literary scholar in tweaking parameters for iterativeimprovement of the computational alignment while keepingits changes visually traceable.
• Multi-level alignment visualization: We present different vi-sualizations that allow for analyzing textual alignments ondifferent text hierarchy levels (whole text, lines, words). In par-ticular, we address the problem of a multi-level visualizationof textual transposition [32].
• Meso reading: Beyond the polarization of close and distantreading visualizations, we introduce an intermediate perspec-tive for texts exhibiting complex variance. Meso reading al-lows to read texts in parallel, while the interdependenciesamong text versions beyond the level of the line are shown.
We emphasize the utility of our visual analytics alignment systemfor the complex textual record of the sort that medievalists study, byoutlining a set of usage scenarios across various genres in which aline to line correspondence of similarly structured texts is not theorganizing principle of the texts. In a storytelling style, we showhow each textual scenario exemplifies how the proposed system sup-ports a multifaceted visual analysis of computationally determinedalignments, how it can be used to create a persistent comparison oftext versions and how it allows the literary scholar to characterize thestyle of variation of a given textual tradition according to the visualpatterns that s/he finds in it. In addition, we report experiences of ourinterdisciplinary work, including evaluative aspects and limitationsdue to the nature of humanities data.
2 RELATED WORK
Our work, which takes its inspiration from medieval literary historyand a deep understanding of problems related to the textual transmis-sion of sources, is situated in the domain of the digital humanities.One of the more important aspects of the digital humanities is tosupport research questions on texts or objects of the historical humanrecord with computational means and to visualize the results. Anexhaustive overview of visualization techniques to support the closeand distant reading of text is given in a recently published surveypaper [31]. None of these techniques allow us fully to visualize thecomplexity of medieval textual variance. In the following, we take alook at text visualization methods most related to our work.
2.1 Text Visualizations for the Digital HumanitiesText as data type has been the basis for numerous innovative visual-izations, an overview being given by Kucher et al. [44]. Some textvisualization techniques have been designed for, or are applicable to,
digital humanities research scenarios. The focus can be a specificliterary text or an entire text collection, where visualization providesan abstract view conveying characteristic features of the given tex-tual data. An example for single text analysis might be fingerprintmatrices [39] that illustrate the behavior of certain text feature valueson various hierarchy levels of the text. The fingerprinting approachcan be further used to highlight semantic text features such as chang-ing relationships between characters in a text [49]. In order to servecorpus-linguistic research, the Text Variation Explorer provides vari-ous text statistical views to support visually exploration of the mostinteresting fragment size (analysis window) for a given text [55]. TheVarifocalReader also provides different visual interfaces as viewsonto different hierarchy levels of a given text [43]—pictogramsto highlight occurring text patterns, tag cloud summaries for textsections, and two close reading views (digital version and scan).Machine learning techniques and search mechanisms are applied toextract entities, concepts and other artifacts from the text in question.Vuillemot et al. [59] designed a system consisting of various visualinterfaces for dynamic exploration of a single literary text: The Mak-ing of Americans by Gertrude Stein. Tag clouds and self-organizinggraphs are used to explore character networks, to review vocabu-lary, and to filter by part of speech. Another technique applicableto digital humanities data is DocuBurst, a visualization that showshierarchical summaries of a text in circular patterns [14]. A numberof visual analytics approaches support the discovery of texts in acorpus that are related to a given problem statement. For example,Overview was designed to help investigative journalists find articleson specific subjects [10]. Texts are hierarchically clustered based oncontent similarity, and the system can be used for systematic search,summarization and annotation purposes, and for close reading oftext documents. The visual analytics system presented by Heimerlet al. [25] uses interactively trained classifiers for document retrievalon large text collections. Koch et al. [42] designed a system withmultiple views to browse a large collection of patents. A rathertypical use case for the digital humanities is outlined by Correll etal. [16]. Given a large text collection, a text analysis environmenthelps to detect statistical patterns in the corpus interactively, andpassages in texts can be displayed by relevance according to a user’spreferences. VisArgue is a framework that provides visual analyt-ics methods to support research on deliberative communication inpolitical sciences by highlighting deliberative patterns in politicaldiscourses over time, speakers, and debates [18]. The text collectionin our project consists of different versions of medieval French lit-erary texts, for which we designed a visual analytics environmentto generate and improve alignments of related verse lines using aninteractive visual interface.
2.2 Visualization of Text Editions
Discovering and aligning related patterns among different textsources are typical tasks in digital humanities applications wherevisualizations aid analyzing such patterns. Some works focus on thedetection and visual analysis of re-used text passages. Riehmannet al. [51] combined a stream graph and heat map representationsto browse through plagiarized text passages in PhD theses. Abdul-Rahman et al. [3] use 2D pixelmaps to illustrate different text re-usestructures in order to communicate perfect text re-use patterns, in-sertions, deletions as well as transpositions. Janicke et al. [34]introduce a grid-based heat map to highlight texts that share sys-tematic or repetitive patterns. Besides these rather generic forms oftext re-use, many research questions in textual criticism focus ona comparative analysis of different versions of a text. Usually, twoversions are placed side by side and related text passages are visuallylinked [27]; an example from journalism is the News Auditor [7].Versioning Machine [1] and JuxtaCommons [62] are standard digitalhumanities tools for this task. Other approaches operate on morethan two versions and provide several visual interfaces to analyze
textual variation. ShakerVis offers a parallel coordinates view and adot plot view to illustrate the similarity of sections in various Ger-man translations of Shakespeare’s Othello [20]. Asokarajan et al. [6]use a pixel-based visualization to support the explorative analysisof variation in classical Latin texts. Janicke et al. [33] present adistant reading approach to analyze dissimilarity among 24 EnglishBible translations. Based on the hierarchical structure of the Bible,heat maps show variations on book, chapter and verse level. Inthe latter case, an alignment on sentence or phrase level is given.Then, directed graphs—so called Variant Graphs—can be used toexamine word-level differences. For example, the Word Tree alignsall sentences of a source text that share the same beginning in theform of a tree [61]. An extension of this idea is the WordGraphthat visualizes the commonness of phrases containing one or morepredefined terms [50]. TRAViz is a layout tailored to visualize char-acteristic features of Variant Graphs in order to support the analysisof orthographic and synonymous variations as well as word-leveltranspositions among multiple versions of a text [35]. A comparableapproach is presented by Silvia et al. [56] who apply a storylinemetaphor to Variant Graphs. The system presented in this paper pro-vides three different simultaneous views on juxtaposed text versions,(1) a distant reading bar view showing global alignment structures,(2) a meso reading view showing local alignment structures amongverse lines of multiple versions, and (3) a close reading pop-up viewshowing word-level alignments in the form of Variant Graphs. Wediscuss the importance of this intermediate form of meso reading inmore detail in Section 3 below.
2.3 Close Reading VisualizationsThe importance of close readings for digital humanities scholar-ship in order to build trust in explorative system environments asa form of verification of distant reading hypotheses is discussedin [32]. Usually, close readings preserve the structure and seman-tics of the text that can still be read on screen, and visualizationis used to enhance the close reading experience with additional in-formation. Goffin et al. [22] suggest the design and placement ofso-called word-scale visualizations—small glyphs that impart ad-ditional information about fragments of the text in question. Forexample, small bar charts show the variants of observed words, orthe background color of a word can be used to encode OCR cer-tainty. AnnotateVis [12] instead mimics the traditional close readingprocess using computational means. The text is placed in the centerand the screen margins to the left and to the right are used to positionvarious types of annotations (notes, images, audios, videos, distantreadings). Some close reading visualizations are designed to aidinvestigating certain features of texts, e.g., sound in poems. The toolPoemage [45] provides two close reading views for that purpose, (1)a poem view that shows possible phonetic features of words, and (2)a path view that sketches phonetic patterns occurring in the text. Acomparable tool is the Poem Viewer [2], which uses visual attributesto encode phonetic units as well as phonetic and semantic relation-ships in a poem. Highlighting words in texts is a very basic form ofvisualizing annotations; guidelines for an appropriate implementa-tion of this approach are given by Strobelt et al. [58]. For example,Serendip applies this method [5]. After topic modeling is performedon a large text collection, the words of a text in close reading modeare colored according to the determined topical relationships. Also,statistical information collected by crowdsourcing can be illustratedthis way [60].
3 DEFINING MESO READING
Our implemented visual analytics system can be situated withinrecent discussions in literary studies after the digital turn. The in-crease in computational approaches to analyzing text have sparkeddebates about the scale and precision with which the literary scholaroperates. The term distant reading, has emerged within literary
circles, probably in convenient contradistinction to more traditional,human-centered slow interpretation done on a limited number oftexts known as close reading. In the context of visualization, themore abstract and data-oriented a visualization is the more it is saidto be distant. Close reading visualizations provide micro views,enriching plain text with additional information yet keeping thetext available for the human reader, whereas distant reading visu-alizations leverage text structure and semantics, providing macroviews that emphasize statistical features of a text corpus, but usuallyeclipsing the text itself [32].
Literary criticism has come to recognize that close and distantapproaches are combinable and perhaps exist more as a contin-uum than a binary, or more as complementary than an exclusivemethodology [38, 53]. Generally, this continuum exists in a numberof visualization scenarios that implement the Visual Information-Seeking Mantra [54]: “overview first, zoom and filter, then details-on-demand.” Overview stands for the macro view and details-on-demand for the micro view. Zoom and filter mechanisms span thein-between continuum providing manifold perpectives on the ob-served data for different zoom levels. By now, such a continuumfor visualizing text does not exist—either a (single) text is readableor textual summary is visualized. In order to support the visualanalysis of intertextual relationships, we assert that a third spaceof critic-centered text visualization is required for complex textualscenarios that we call meso reading. By meso reading we mean avisual strategy that ensures that distant patterns are discernable andpassages of text are legible at the same time and within the samevisual field for the human reader in order to assess the validity andimportance of the pattern in context. In meso reading visualizations,the text and statistical features about the text occur together, pro-viding the human reader with an interpretative frame. In our textvisualization scenario, the meso reading view was required to assertthe relative importance (or falsity) of computed alignments.
4 OUR RESEARCH ON TEXTUAL VARIANCE
Our research is situated within a humanistic tradition of studying thetransmission of texts via the multiple changes they undergo. Insteadof restoring texts as nearly as possible to their original form [41], oreven positing the existence of an Ur-text, we collect and compare asmany of the versions of a specific work that are extant in the histori-cal record. We do not know if these versions were copied verbatimfrom written texts, written down from memory or improvised basedon some form of oral performance.
Comparing versions of a text The task of the textual critic isto observe all the changes in a text through its transmission. Texteditors have favored very different theoretical approaches to ”estab-lishing the text,” or what in common parlance was making a criticaledition. Some have preferred the identification and comparison ofdifferent text versions aiming to reconstruct the archetype (the Lach-mannian school) and others have chosen what was considered to bethe best text, building their edition around one preferred manuscript(the Bedierist school). When a text was transmitted orally beforebeing committed to writing, or even when it existed in writing, butauthors continued to reinvent the work poetically, extant versionsvary strongly. Our system allows the critic to explore different levelsof text reuse and to hypothesize about the “movement” of texts.
Mouvance Swiss medievalist Paul Zumthor used the term mou-vance to designate the high degree of instability in medieval texttraditions, and to describe the mixture of textual, literary elementsof written works with oral, performative ones resulting in highlyvariant readings and reworkings [63]. One famous example thatexhibits a significant degree of textual and performative mouvanceis the epic poem the Chanson de Roland, known to be transmitted insix major versions and three fragments, the first version dating fromthe early twelfth century. In order to discover related text fragmentsamong these versions, the medievalist faces two major obstacles.
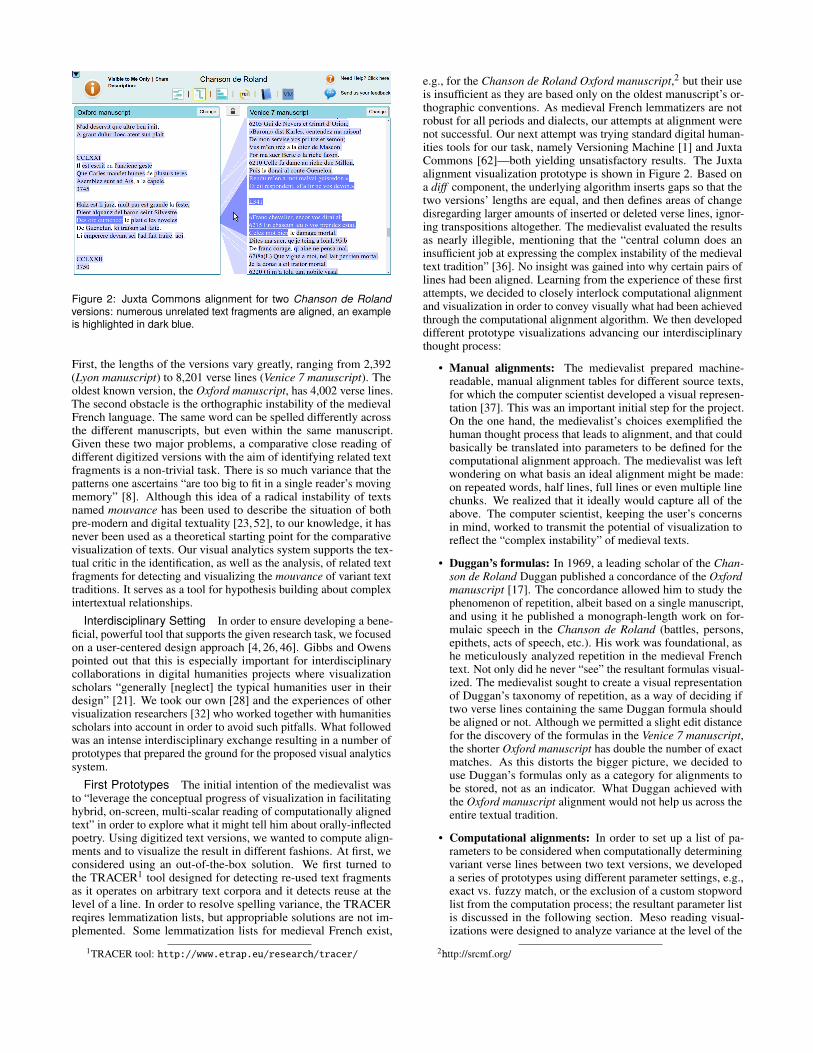
Figure 2: Juxta Commons alignment for two Chanson de Rolandversions: numerous unrelated text fragments are aligned, an exampleis highlighted in dark blue.
First, the lengths of the versions vary greatly, ranging from 2,392(Lyon manuscript) to 8,201 verse lines (Venice 7 manuscript). Theoldest known version, the Oxford manuscript, has 4,002 verse lines.The second obstacle is the orthographic instability of the medievalFrench language. The same word can be spelled differently acrossthe different manuscripts, but even within the same manuscript.Given these two major problems, a comparative close reading ofdifferent digitized versions with the aim of identifying related textfragments is a non-trivial task. There is so much variance that thepatterns one ascertains “are too big to fit in a single reader’s movingmemory” [8]. Although this idea of a radical instability of textsnamed mouvance has been used to describe the situation of bothpre-modern and digital textuality [23, 52], to our knowledge, it hasnever been used as a theoretical starting point for the comparativevisualization of texts. Our visual analytics system supports the tex-tual critic in the identification, as well as the analysis, of related textfragments for detecting and visualizing the mouvance of variant texttraditions. It serves as a tool for hypothesis building about complexintertextual relationships.
Interdisciplinary Setting In order to ensure developing a bene-ficial, powerful tool that supports the given research task, we focusedon a user-centered design approach [4, 26, 46]. Gibbs and Owenspointed out that this is especially important for interdisciplinarycollaborations in digital humanities projects where visualizationscholars “generally [neglect] the typical humanities user in theirdesign” [21]. We took our own [28] and the experiences of othervisualization researchers [32] who worked together with humanitiesscholars into account in order to avoid such pitfalls. What followedwas an intense interdisciplinary exchange resulting in a number ofprototypes that prepared the ground for the proposed visual analyticssystem.
First Prototypes The initial intention of the medievalist wasto “leverage the conceptual progress of visualization in facilitatinghybrid, on-screen, multi-scalar reading of computationally alignedtext” in order to explore what it might tell him about orally-inflectedpoetry. Using digitized text versions, we wanted to compute align-ments and to visualize the result in different fashions. At first, weconsidered using an out-of-the-box solution. We first turned tothe TRACER1 tool designed for detecting re-used text fragmentsas it operates on arbitrary text corpora and it detects reuse at thelevel of a line. In order to resolve spelling variance, the TRACERreqires lemmatization lists, but appropriable solutions are not im-plemented. Some lemmatization lists for medieval French exist,
1TRACER tool: http://www.etrap.eu/research/tracer/
e.g., for the Chanson de Roland Oxford manuscript,2 but their useis insufficient as they are based only on the oldest manuscript’s or-thographic conventions. As medieval French lemmatizers are notrobust for all periods and dialects, our attempts at alignment werenot successful. Our next attempt was trying standard digital human-ities tools for our task, namely Versioning Machine [1] and JuxtaCommons [62]—both yielding unsatisfactory results. The Juxtaalignment visualization prototype is shown in Figure 2. Based ona diff component, the underlying algorithm inserts gaps so that thetwo versions’ lengths are equal, and then defines areas of changedisregarding larger amounts of inserted or deleted verse lines, ignor-ing transpositions altogether. The medievalist evaluated the resultsas nearly illegible, mentioning that the “central column does aninsufficient job at expressing the complex instability of the medievaltext tradition” [36]. No insight was gained into why certain pairs oflines had been aligned. Learning from the experience of these firstattempts, we decided to closely interlock computational alignmentand visualization in order to convey visually what had been achievedthrough the computational alignment algorithm. We then developeddifferent prototype visualizations advancing our interdisciplinarythought process:
• Manual alignments: The medievalist prepared machine-readable, manual alignment tables for different source texts,for which the computer scientist developed a visual represen-tation [37]. This was an important initial step for the project.On the one hand, the medievalist’s choices exemplified thehuman thought process that leads to alignment, and that couldbasically be translated into parameters to be defined for thecomputational alignment approach. The medievalist was leftwondering on what basis an ideal alignment might be made:on repeated words, half lines, full lines or even multiple linechunks. We realized that it ideally would capture all of theabove. The computer scientist, keeping the user’s concernsin mind, worked to transmit the potential of visualization toreflect the “complex instability” of medieval texts.
• Duggan’s formulas: In 1969, a leading scholar of the Chan-son de Roland Duggan published a concordance of the Oxfordmanuscript [17]. The concordance allowed him to study thephenomenon of repetition, albeit based on a single manuscript,and using it he published a monograph-length work on for-mulaic speech in the Chanson de Roland (battles, persons,epithets, acts of speech, etc.). His work was foundational, ashe meticulously analyzed repetition in the medieval Frenchtext. Not only did he never “see” the resultant formulas visual-ized. The medievalist sought to create a visual representationof Duggan’s taxonomy of repetition, as a way of deciding iftwo verse lines containing the same Duggan formula shouldbe aligned or not. Although we permitted a slight edit distancefor the discovery of the formulas in the Venice 7 manuscript,the shorter Oxford manuscript has double the number of exactmatches. As this distorts the bigger picture, we decided touse Duggan’s formulas only as a category for alignments tobe stored, not as an indicator. What Duggan achieved withthe Oxford manuscript alignment would not help us across theentire textual tradition.
• Computational alignments: In order to set up a list of pa-rameters to be considered when computationally determiningvariant verse lines between two text versions, we developeda series of prototypes using different parameter settings, e.g.,exact vs. fuzzy match, or the exclusion of a custom stopwordlist from the computation process; the resultant parameter listis discussed in the following section. Meso reading visual-izations were designed to analyze variance at the level of the
2http://srcmf.org/
line, but when exploring results using the prototypes, the me-dievalist expressed an interest to analyze alignment patternson different text hierarchy levels.
List of Requirements Discussing the various prototype imple-mentations were of mutual benefit to both scholars’ thought pro-cesses. On the one hand, the computer scientist was able to seize theproperties of variance that yield relevant alignment results, and todesign and evaluate visual metaphors for reflecting textual similarity.On the other hand, the medievalist came to appreciate the potentialof computational alignment and visualization, and both their benefitsand limitations. With these insights in mind, we derived a list ofmajor system requirements to meet the needs of the medievalistanalyzing variance among medieval French text versions:
i. Dynamic parameter setting: The medievalist mentioned theneed for “multiple visuals” both to grasp how the alignmentchanges with different parameters, and to single out their indi-vidual influence on the result. The final list of parameters tobe adjusted for the computational alignment are explained indetail in Section 5.3.
ii. Multi-level visualization of textual variance: In order tomeet the medievalist’s desire to analyze “both stability andvariance among the text versions” on different text hierarchylevels, we provide a distant reading view to explore the entiretyof computationally gained alignments on the document level, ameso reading view to inspect patterns on line level, and a closereading view for word level alignment. The views and theirlinkage are discussed in Section 5.4.
iii. Visual analytics approach: In order to realize to “visuallysolidify mouvance,” we implemented a visual analytics sys-tem that allows dynamic manipulation of parameters, updatesthe visual representation of the alignment according to thesechanges, and provides a mechanism to make individual align-ments persistent—thereby recording the properties of truepositives, but also considering alignments rated as false posi-tives. Detailed information about the presented visual analyticssystem can be found in Section 5.5.
5 INTERACTIVE VISUAL TEXT ALIGNMENT
According to the taxonomy of text analysis tasks provided bythe Visual Text Analysis Process typical for digital humanitiesprojects [32] our work falls into the subcategory text version com-parison of the main category similar patterns. Our main goal wasto design a system that provides a novel workflow to align highlyvariant medieval text versions.
5.1 Text SourcesOur usage scenarios (see Section 6) narrate visual text alignmentprocedures for medieval French text traditions. All texts—attachedwith a dating important for medievalists to hypothesize possible linesof transmission—were given as plain text files in a line-separatedformat. In a preprocessing step, special characters are removed. Inaddition, we removed diacritics since they are not original to me-dieval writing, but rather editorial additions. As editorial conventionsin assigning such diacritics fluctuate, considering diacritics compli-cates the discovery of variant spellings necessary for the alignmentalgorithm.
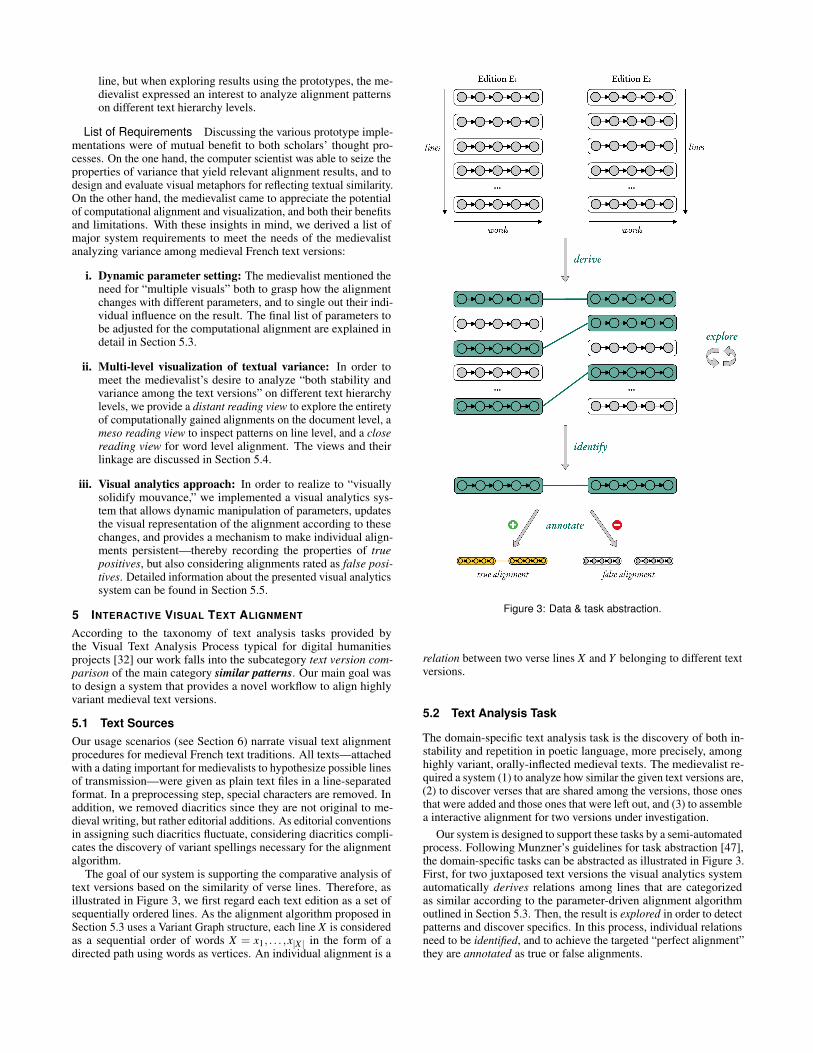
The goal of our system is supporting the comparative analysis oftext versions based on the similarity of verse lines. Therefore, asillustrated in Figure 3, we first regard each text edition as a set ofsequentially ordered lines. As the alignment algorithm proposed inSection 5.3 uses a Variant Graph structure, each line X is consideredas a sequential order of words X = x1, . . . ,x|X | in the form of adirected path using words as vertices. An individual alignment is a
Figure 3: Data & task abstraction.
relation between two verse lines X and Y belonging to different textversions.
5.2 Text Analysis Task
The domain-specific text analysis task is the discovery of both in-stability and repetition in poetic language, more precisely, amonghighly variant, orally-inflected medieval texts. The medievalist re-quired a system (1) to analyze how similar the given text versions are,(2) to discover verses that are shared among the versions, those onesthat were added and those ones that were left out, and (3) to assemblea interactive alignment for two versions under investigation.
Our system is designed to support these tasks by a semi-automatedprocess. Following Munzner’s guidelines for task abstraction [47],the domain-specific tasks can be abstracted as illustrated in Figure 3.First, for two juxtaposed text versions the visual analytics systemautomatically derives relations among lines that are categorizedas similar according to the parameter-driven alignment algorithmoutlined in Section 5.3. Then, the result is explored in order to detectpatterns and discover specifics. In this process, individual relationsneed to be identified, and to achieve the targeted “perfect alignment”they are annotated as true or false alignments.
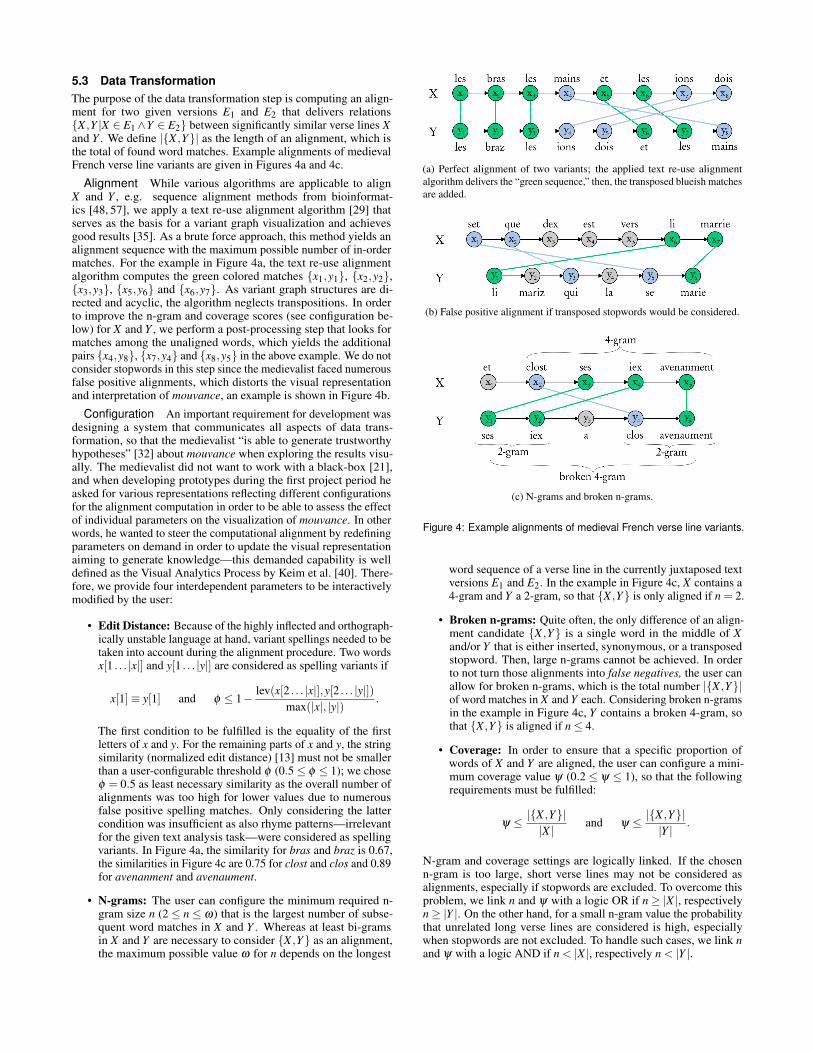
5.3 Data TransformationThe purpose of the data transformation step is computing an align-ment for two given versions E1 and E2 that delivers relations{X ,Y |X ∈ E1∧Y ∈ E2} between significantly similar verse lines Xand Y . We define |{X ,Y}| as the length of an alignment, which isthe total of found word matches. Example alignments of medievalFrench verse line variants are given in Figures 4a and 4c.
Alignment While various algorithms are applicable to alignX and Y , e.g. sequence alignment methods from bioinformat-ics [48, 57], we apply a text re-use alignment algorithm [29] thatserves as the basis for a variant graph visualization and achievesgood results [35]. As a brute force approach, this method yields analignment sequence with the maximum possible number of in-ordermatches. For the example in Figure 4a, the text re-use alignmentalgorithm computes the green colored matches {x1,y1}, {x2,y2},{x3,y3}, {x5,y6} and {x6,y7}. As variant graph structures are di-rected and acyclic, the algorithm neglects transpositions. In orderto improve the n-gram and coverage scores (see configuration be-low) for X and Y , we perform a post-processing step that looks formatches among the unaligned words, which yields the additionalpairs {x4,y8}, {x7,y4} and {x8,y5} in the above example. We do notconsider stopwords in this step since the medievalist faced numerousfalse positive alignments, which distorts the visual representationand interpretation of mouvance, an example is shown in Figure 4b.
Configuration An important requirement for development wasdesigning a system that communicates all aspects of data trans-formation, so that the medievalist “is able to generate trustworthyhypotheses” [32] about mouvance when exploring the results visu-ally. The medievalist did not want to work with a black-box [21],and when developing prototypes during the first project period heasked for various representations reflecting different configurationsfor the alignment computation in order to be able to assess the effectof individual parameters on the visualization of mouvance. In otherwords, he wanted to steer the computational alignment by redefiningparameters on demand in order to update the visual representationaiming to generate knowledge—this demanded capability is welldefined as the Visual Analytics Process by Keim et al. [40]. There-fore, we provide four interdependent parameters to be interactivelymodified by the user:
• Edit Distance: Because of the highly inflected and orthograph-ically unstable language at hand, variant spellings needed to betaken into account during the alignment procedure. Two wordsx[1 . . . |x|] and y[1 . . . |y|] are considered as spelling variants if
x[1]≡ y[1] and φ ≤ 1− lev(x[2 . . . |x|],y[2 . . . |y|])max(|x|, |y|)
.
The first condition to be fulfilled is the equality of the firstletters of x and y. For the remaining parts of x and y, the stringsimilarity (normalized edit distance) [13] must not be smallerthan a user-configurable threshold φ (0.5≤ φ ≤ 1); we choseφ = 0.5 as least necessary similarity as the overall number ofalignments was too high for lower values due to numerousfalse positive spelling matches. Only considering the lattercondition was insufficient as also rhyme patterns—irrelevantfor the given text analysis task—were considered as spellingvariants. In Figure 4a, the similarity for bras and braz is 0.67,the similarities in Figure 4c are 0.75 for clost and clos and 0.89for avenanment and avenaument.
• N-grams: The user can configure the minimum required n-gram size n (2 ≤ n ≤ ω) that is the largest number of subse-quent word matches in X and Y . Whereas at least bi-gramsin X and Y are necessary to consider {X ,Y} as an alignment,the maximum possible value ω for n depends on the longest
(a) Perfect alignment of two variants; the applied text re-use alignmentalgorithm delivers the “green sequence,” then, the transposed blueish matchesare added.
(b) False positive alignment if transposed stopwords would be considered.
(c) N-grams and broken n-grams.
Figure 4: Example alignments of medieval French verse line variants.
word sequence of a verse line in the currently juxtaposed textversions E1 and E2. In the example in Figure 4c, X contains a4-gram and Y a 2-gram, so that {X ,Y} is only aligned if n = 2.
• Broken n-grams: Quite often, the only difference of an align-ment candidate {X ,Y} is a single word in the middle of Xand/or Y that is either inserted, synonymous, or a transposedstopword. Then, large n-grams cannot be achieved. In orderto not turn those alignments into false negatives, the user canallow for broken n-grams, which is the total number |{X ,Y}|of word matches in X and Y each. Considering broken n-gramsin the example in Figure 4c, Y contains a broken 4-gram, sothat {X ,Y} is aligned if n≤ 4.
• Coverage: In order to ensure that a specific proportion ofwords of X and Y are aligned, the user can configure a mini-mum coverage value ψ (0.2 ≤ ψ ≤ 1), so that the followingrequirements must be fulfilled:
ψ ≤ |{X ,Y}||X |
and ψ ≤ |{X ,Y}||Y |
.
N-gram and coverage settings are logically linked. If the chosenn-gram is too large, short verse lines may not be considered asalignments, especially if stopwords are excluded. To overcome thisproblem, we link n and ψ with a logic OR if n≥ |X |, respectivelyn≥ |Y |. On the other hand, for a small n-gram value the probabilitythat unrelated long verse lines are considered is high, especiallywhen stopwords are not excluded. To handle such cases, we link nand ψ with a logic AND if n < |X |, respectively n < |Y |.
Complexity The computational effort of the alignment algo-rithm can be assessed by Θ(|E1| · |E2| · k), with |E1| verse lines inE1, and |E2| verse lines in E2. For example, the juxtaposition of theOxford manuscript (4,002 verse lines) with the Venice 7 manuscript(8,201 verse lines) of the Chanson de Roland requires 32,820,402alignment computations. The value of k, dependent on |X | and |Y |,stands for the average effort undertaken for the alignment of the twoverse lines X and Y . Re-configuring the string similarity threshold φ
requires re-computing the entire alignment as it may significantlychange. In order to facilitate an efficient work with a responsivesystem, alignment sets are pre-computed for all possible φ -values.Such an alignment set contains all aligned verse line tuples sharingat least a 2-gram and having a minimum coverage of ψ = 0.2. In theabove mentioned Chanson de Roland scenario, we receive 226,129alignment tuples for the minimum string similarity φ = 0.5, and theremaining effort is narrowed down to filtering out those tuples thatdo not reach the necessary minima for n and/or ψ .
5.4 Visual Text Analysis
While two versions are typically compared in a juxtaposing view [1,62], we extend the dimensionality to an arbitrary number of ver-sions limited first and foremost by the screen’s width. To support amulti-level visual analysis of the gained computational alignment(s),we provide views for three different texts hierarchy levels: wholetext versions, verse lines and words. On all levels, our design facili-tates discovering transposed text fragments [32] integral to a textualscholar’s work. Examples for all views can be found in Figure 6.
Distant Reading To produce a rough overview of alignmentpatterns throughout the observed text versions, we draw a miniaturerepresentation for each version in the form of a vertical bar reflectingits number of verse lines in contrast to the other shown versions.Computed alignments are drawn as polylines along the vertical barsso that alignment patterns are made visible. For example, multiplesubsequent parallel polylines indicate aligned paragraphs whereastransposed text fragments lead to polyline crossings. Via mouseclick on a vertical bar, the user jumps to a desired section of thecorresponding version, which also updates the meso reading view.
Meso Reading According to the Visual Text Analysis Pro-cess [32], applied visualization techniques are grouped into closeand distant readings. As we have explained above, there is a “readinglevel” between these two scales of visualization that we call mesoreading. Since multiple texts are displayed, in what textual scholarscall synoptic views, the visualization is able to convey more complexpatterns of textual relationship across versions that are impossible tobe visualized in a single text view. A meso reading might be said toconnect multiple close readings all the while transmitting informa-tion that lies beyond the scope of a close reading. It might also besaid that meso reading serves as a zoomed version of the distant read-ing visualization. Here, we use the intuitivity of stream graphs [11]to connect aligned verse lines among different versions. Seen as themost important component of our system to visualize mouvance, themeso reading needs to be legibile, comprehensible and interactive.Semi-transparent streams ensure that crossing streams (transposedverse lines) visually separate from each other. Furthermore, repet-itive aligned verse lines (e.g., those containing a Duggan formula)stick out due to more saturated background colors. When two ver-sions are juxtaposed, tiny previews of the word level alignments areshown next to each line that is part of at least one alignment tuplein the form of heat maps reserving a small rectangle for each wordof the line. Stopwords are indicated with an “S,” and the words thatcontribute to the alignment are colored (again, saturation highlightsthe frequency of reused words). For a more detailed inspection of anindividual alignment, clicking on a stream opens a popup windowfor close reading at the level of a particular line.
Close Reading Next to plain text, the close reading view pro-vides word level alignments for the corresponding verse lines in theform of two Variant Graph visualizations [35]. The first graph isdrawn without applying an edit distance measure, the second graphis built according to the current string similarity configuration. Themedievalist wanted both graphs to be juxtaposed in order to getan immediate justification for the computed alignment of variantspellings. The second graph is interactive, so that the alignment struc-ture can be modified, e.g., variants of a word that were not aligned bythe computational process can be manually aligned. Within the closereading view, individual alignments can be confirmed—optionally,an alignment category can be set, e.g., Duggan formula, perfectmatch, frontal hemistich)—, so that it gets persistently stored in thebackend. Furthermore, an equivalency table for spelling variants isgenerated in the background according to the merged nodes (identi-fied spelling variants) of the second variant graph. On the one hand,we use the equivalency table for future alignment computations as itsupersedes the necessity of a lemmatization list. On the other hand,this leads to a sustainable benefit for medievalists requiring such adictionary.
Multi-version View When computational alignments are stored,usually, the medievalist focuses on only two text versions whichare clearly presented in a juxtaposed view. But, observing andconfirming more than two versions at once (cf. [15, 30]) quickensthe comparison task. Initially, we order the text versions so that thenumber of streams crossing unrelated texts in the meso reading viewis minimal. When such crossings yet occur, we render them with ahigh transparency. Furthermore, versions can be ordered accordingto the given datings, so that mouvance can be visualized as a functionof time, and possible lines of influence can be hypothesized. Figure 1shows the alignment of three juxtaposed versions of La vie de sainteMarie l’Egyptienne.
5.5 Visual Text Alignment WorkflowThough the Visual Text Analysis Process [32] does not explicitlydiscuss the necessity of iterative interaction with the data, theirtransformation and visual representations in order to gain insight—due to the fact that complex systems are often seen as “black boxes”by humanities scholars impeding their adoption [21], the value ofvisualization is often only the capacity to serve as evidence in digitalhumanities inquiry—, the Visual Text Analysis Process model stilladmits the implementation of a visual analytics feedback loop [40].
Alignment Workflow After selecting two text versions to bejuxtaposed, a typical workflow of the medievalist starts with aninitially suggested parameter setting derived from the features ofthe already stored alignments S for the juxtaposed versions. Forexample, we define the initial coverage value ψs as
ψs = min{X ,Y}∈S
(min
(|{X ,Y}||X |
,|{X ,Y}||Y |
))
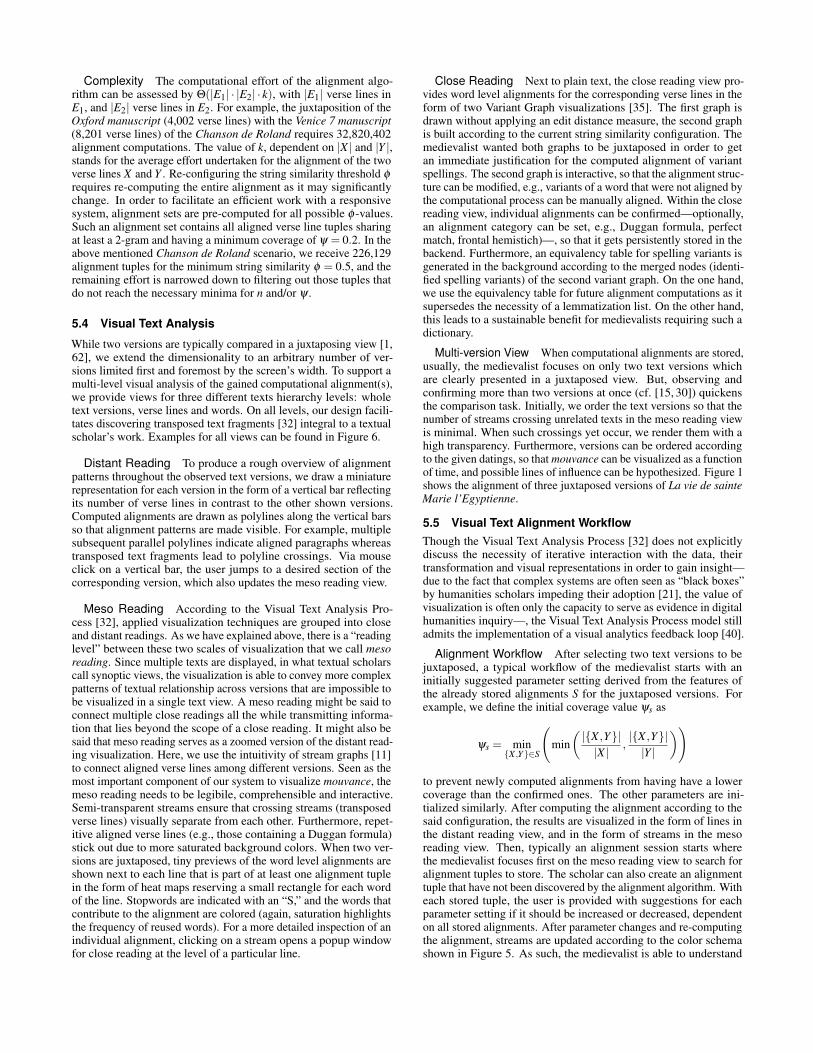
to prevent newly computed alignments from having have a lowercoverage than the confirmed ones. The other parameters are ini-tialized similarly. After computing the alignment according to thesaid configuration, the results are visualized in the form of lines inthe distant reading view, and in the form of streams in the mesoreading view. Then, typically an alignment session starts wherethe medievalist focuses first on the meso reading view to search foralignment tuples to store. The scholar can also create an alignmenttuple that have not been discovered by the alignment algorithm. Witheach stored tuple, the user is provided with suggestions for eachparameter setting if it should be increased or decreased, dependenton all stored alignments. After parameter changes and re-computingthe alignment, streams are updated according to the color schemashown in Figure 5. As such, the medievalist is able to understand
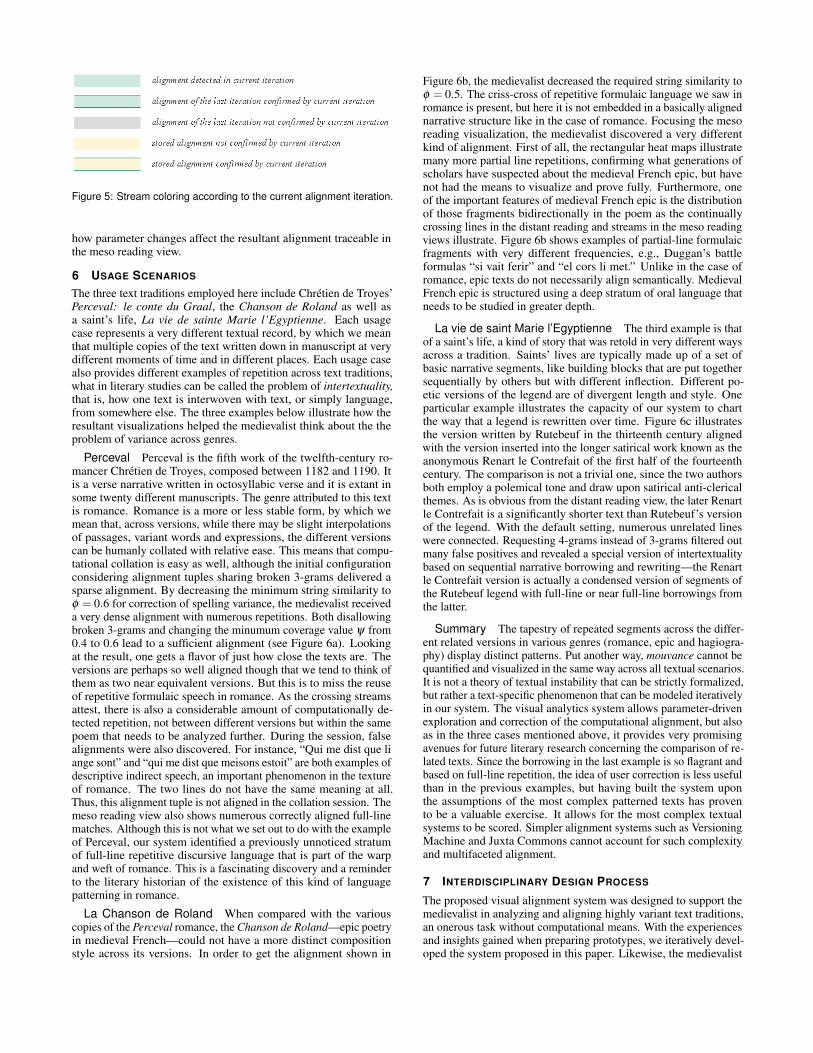
Figure 5: Stream coloring according to the current alignment iteration.
how parameter changes affect the resultant alignment traceable inthe meso reading view.
6 USAGE SCENARIOS
The three text traditions employed here include Chretien de Troyes’Perceval: le conte du Graal, the Chanson de Roland as well asa saint’s life, La vie de sainte Marie l’Egyptienne. Each usagecase represents a very different textual record, by which we meanthat multiple copies of the text written down in manuscript at verydifferent moments of time and in different places. Each usage casealso provides different examples of repetition across text traditions,what in literary studies can be called the problem of intertextuality,that is, how one text is interwoven with text, or simply language,from somewhere else. The three examples below illustrate how theresultant visualizations helped the medievalist think about the theproblem of variance across genres.
Perceval Perceval is the fifth work of the twelfth-century ro-mancer Chretien de Troyes, composed between 1182 and 1190. Itis a verse narrative written in octosyllabic verse and it is extant insome twenty different manuscripts. The genre attributed to this textis romance. Romance is a more or less stable form, by which wemean that, across versions, while there may be slight interpolationsof passages, variant words and expressions, the different versionscan be humanly collated with relative ease. This means that compu-tational collation is easy as well, although the initial configurationconsidering alignment tuples sharing broken 3-grams delivered asparse alignment. By decreasing the minimum string similarity toφ = 0.6 for correction of spelling variance, the medievalist receiveda very dense alignment with numerous repetitions. Both disallowingbroken 3-grams and changing the minumum coverage value ψ from0.4 to 0.6 lead to a sufficient alignment (see Figure 6a). Lookingat the result, one gets a flavor of just how close the texts are. Theversions are perhaps so well aligned though that we tend to think ofthem as two near equivalent versions. But this is to miss the reuseof repetitive formulaic speech in romance. As the crossing streamsattest, there is also a considerable amount of computationally de-tected repetition, not between different versions but within the samepoem that needs to be analyzed further. During the session, falsealignments were also discovered. For instance, “Qui me dist que liange sont” and “qui me dist que meisons estoit” are both examples ofdescriptive indirect speech, an important phenomenon in the textureof romance. The two lines do not have the same meaning at all.Thus, this alignment tuple is not aligned in the collation session. Themeso reading view also shows numerous correctly aligned full-linematches. Although this is not what we set out to do with the exampleof Perceval, our system identified a previously unnoticed stratumof full-line repetitive discursive language that is part of the warpand weft of romance. This is a fascinating discovery and a reminderto the literary historian of the existence of this kind of languagepatterning in romance.
La Chanson de Roland When compared with the variouscopies of the Perceval romance, the Chanson de Roland—epic poetryin medieval French—could not have a more distinct compositionstyle across its versions. In order to get the alignment shown in
Figure 6b, the medievalist decreased the required string similarity toφ = 0.5. The criss-cross of repetitive formulaic language we saw inromance is present, but here it is not embedded in a basically alignednarrative structure like in the case of romance. Focusing the mesoreading visualization, the medievalist discovered a very differentkind of alignment. First of all, the rectangular heat maps illustratemany more partial line repetitions, confirming what generations ofscholars have suspected about the medieval French epic, but havenot had the means to visualize and prove fully. Furthermore, oneof the important features of medieval French epic is the distributionof those fragments bidirectionally in the poem as the continuallycrossing lines in the distant reading and streams in the meso readingviews illustrate. Figure 6b shows examples of partial-line formulaicfragments with very different frequencies, e.g., Duggan’s battleformulas “si vait ferir” and “el cors li met.” Unlike in the case ofromance, epic texts do not necessarily align semantically. MedievalFrench epic is structured using a deep stratum of oral language thatneeds to be studied in greater depth.
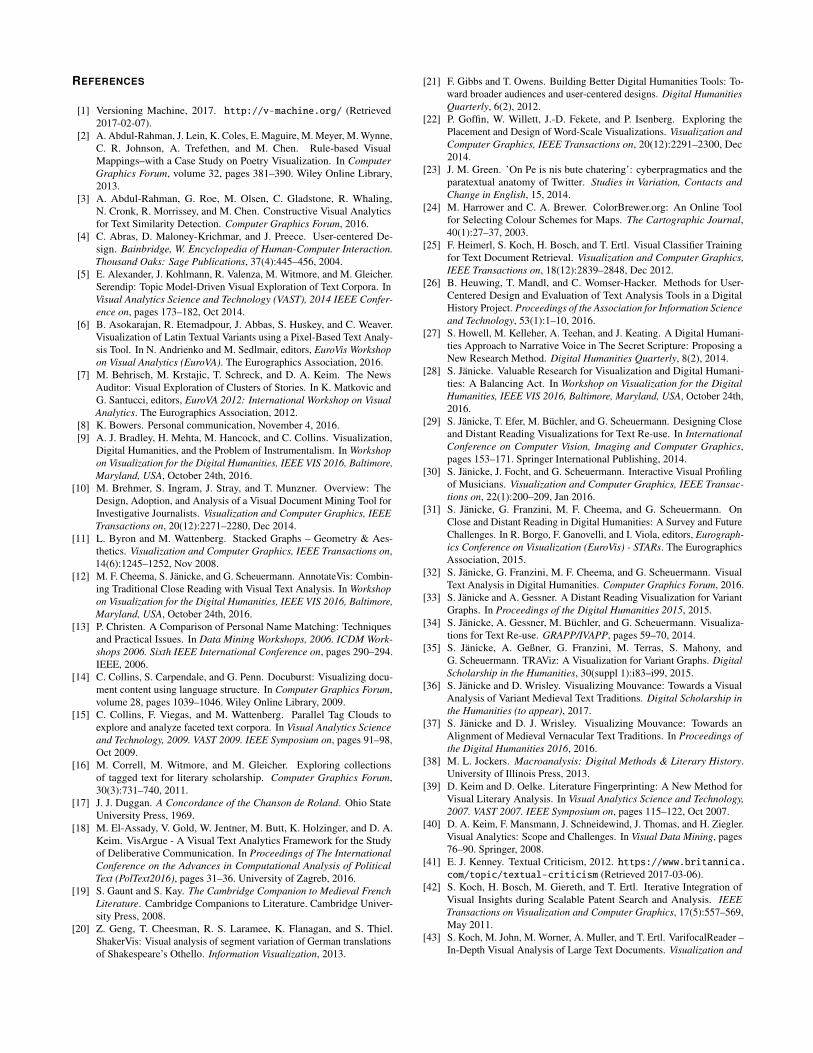
La vie de saint Marie l’Egyptienne The third example is thatof a saint’s life, a kind of story that was retold in very different waysacross a tradition. Saints’ lives are typically made up of a set ofbasic narrative segments, like building blocks that are put togethersequentially by others but with different inflection. Different po-etic versions of the legend are of divergent length and style. Oneparticular example illustrates the capacity of our system to chartthe way that a legend is rewritten over time. Figure 6c illustratesthe version written by Rutebeuf in the thirteenth century alignedwith the version inserted into the longer satirical work known as theanonymous Renart le Contrefait of the first half of the fourteenthcentury. The comparison is not a trivial one, since the two authorsboth employ a polemical tone and draw upon satirical anti-clericalthemes. As is obvious from the distant reading view, the later Renartle Contrefait is a significantly shorter text than Rutebeuf’s versionof the legend. With the default setting, numerous unrelated lineswere connected. Requesting 4-grams instead of 3-grams filtered outmany false positives and revealed a special version of intertextualitybased on sequential narrative borrowing and rewriting—the Renartle Contrefait version is actually a condensed version of segments ofthe Rutebeuf legend with full-line or near full-line borrowings fromthe latter.
Summary The tapestry of repeated segments across the differ-ent related versions in various genres (romance, epic and hagiogra-phy) display distinct patterns. Put another way, mouvance cannot bequantified and visualized in the same way across all textual scenarios.It is not a theory of textual instability that can be strictly formalized,but rather a text-specific phenomenon that can be modeled iterativelyin our system. The visual analytics system allows parameter-drivenexploration and correction of the computational alignment, but alsoas in the three cases mentioned above, it provides very promisingavenues for future literary research concerning the comparison of re-lated texts. Since the borrowing in the last example is so flagrant andbased on full-line repetition, the idea of user correction is less usefulthan in the previous examples, but having built the system uponthe assumptions of the most complex patterned texts has provento be a valuable exercise. It allows for the most complex textualsystems to be scored. Simpler alignment systems such as VersioningMachine and Juxta Commons cannot account for such complexityand multifaceted alignment.
7 INTERDISCIPLINARY DESIGN PROCESS
The proposed visual alignment system was designed to support themedievalist in analyzing and aligning highly variant text traditions,an onerous task without computational means. With the experiencesand insights gained when preparing prototypes, we iteratively devel-oped the system proposed in this paper. Likewise, the medievalist
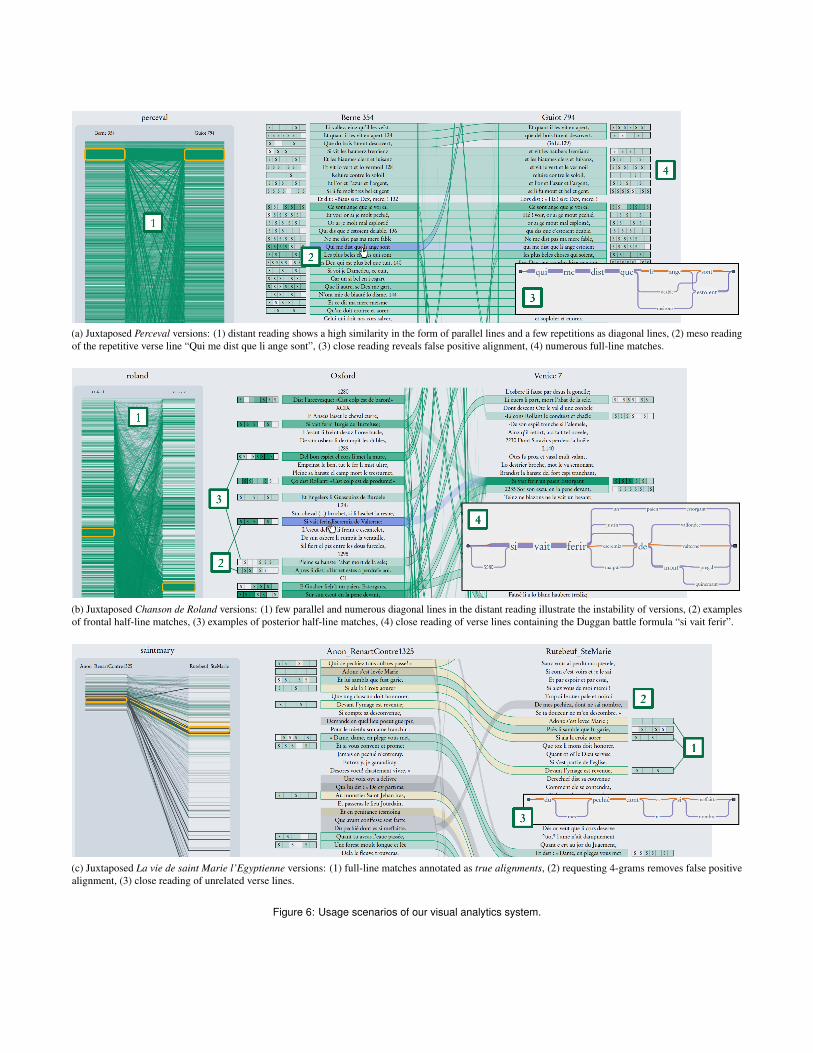
(a) Juxtaposed Perceval versions: (1) distant reading shows a high similarity in the form of parallel lines and a few repetitions as diagonal lines, (2) meso readingof the repetitive verse line “Qui me dist que li ange sont”, (3) close reading reveals false positive alignment, (4) numerous full-line matches.
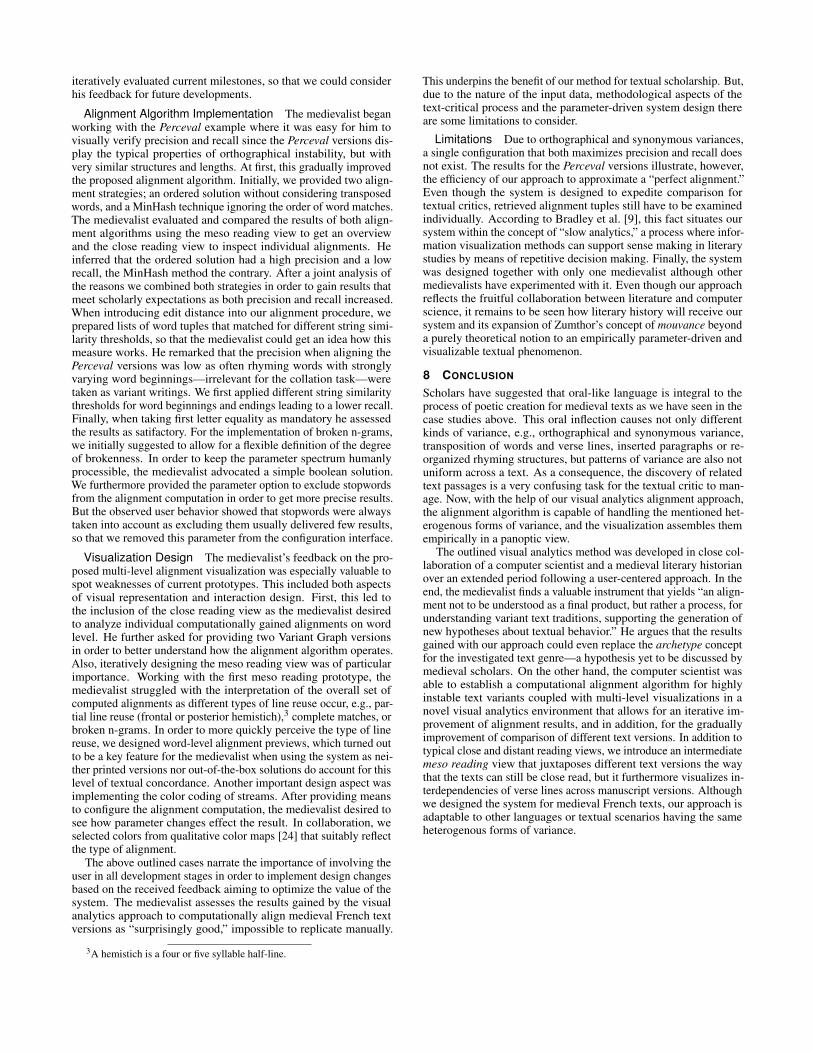
(b) Juxtaposed Chanson de Roland versions: (1) few parallel and numerous diagonal lines in the distant reading illustrate the instability of versions, (2) examplesof frontal half-line matches, (3) examples of posterior half-line matches, (4) close reading of verse lines containing the Duggan battle formula “si vait ferir”.
(c) Juxtaposed La vie de saint Marie l’Egyptienne versions: (1) full-line matches annotated as true alignments, (2) requesting 4-grams removes false positivealignment, (3) close reading of unrelated verse lines.
Figure 6: Usage scenarios of our visual analytics system.
iteratively evaluated current milestones, so that we could considerhis feedback for future developments.
Alignment Algorithm Implementation The medievalist beganworking with the Perceval example where it was easy for him tovisually verify precision and recall since the Perceval versions dis-play the typical properties of orthographical instability, but withvery similar structures and lengths. At first, this gradually improvedthe proposed alignment algorithm. Initially, we provided two align-ment strategies; an ordered solution without considering transposedwords, and a MinHash technique ignoring the order of word matches.The medievalist evaluated and compared the results of both align-ment algorithms using the meso reading view to get an overviewand the close reading view to inspect individual alignments. Heinferred that the ordered solution had a high precision and a lowrecall, the MinHash method the contrary. After a joint analysis ofthe reasons we combined both strategies in order to gain results thatmeet scholarly expectations as both precision and recall increased.When introducing edit distance into our alignment procedure, weprepared lists of word tuples that matched for different string simi-larity thresholds, so that the medievalist could get an idea how thismeasure works. He remarked that the precision when aligning thePerceval versions was low as often rhyming words with stronglyvarying word beginnings—irrelevant for the collation task—weretaken as variant writings. We first applied different string similaritythresholds for word beginnings and endings leading to a lower recall.Finally, when taking first letter equality as mandatory he assessedthe results as satifactory. For the implementation of broken n-grams,we initially suggested to allow for a flexible definition of the degreeof brokenness. In order to keep the parameter spectrum humanlyprocessible, the medievalist advocated a simple boolean solution.We furthermore provided the parameter option to exclude stopwordsfrom the alignment computation in order to get more precise results.But the observed user behavior showed that stopwords were alwaystaken into account as excluding them usually delivered few results,so that we removed this parameter from the configuration interface.
Visualization Design The medievalist’s feedback on the pro-posed multi-level alignment visualization was especially valuable tospot weaknesses of current prototypes. This included both aspectsof visual representation and interaction design. First, this led tothe inclusion of the close reading view as the medievalist desiredto analyze individual computationally gained alignments on wordlevel. He further asked for providing two Variant Graph versionsin order to better understand how the alignment algorithm operates.Also, iteratively designing the meso reading view was of particularimportance. Working with the first meso reading prototype, themedievalist struggled with the interpretation of the overall set ofcomputed alignments as different types of line reuse occur, e.g., par-tial line reuse (frontal or posterior hemistich),3 complete matches, orbroken n-grams. In order to more quickly perceive the type of linereuse, we designed word-level alignment previews, which turned outto be a key feature for the medievalist when using the system as nei-ther printed versions nor out-of-the-box solutions do account for thislevel of textual concordance. Another important design aspect wasimplementing the color coding of streams. After providing meansto configure the alignment computation, the medievalist desired tosee how parameter changes effect the result. In collaboration, weselected colors from qualitative color maps [24] that suitably reflectthe type of alignment.
The above outlined cases narrate the importance of involving theuser in all development stages in order to implement design changesbased on the received feedback aiming to optimize the value of thesystem. The medievalist assesses the results gained by the visualanalytics approach to computationally align medieval French textversions as “surprisingly good,” impossible to replicate manually.
3A hemistich is a four or five syllable half-line.
This underpins the benefit of our method for textual scholarship. But,due to the nature of the input data, methodological aspects of thetext-critical process and the parameter-driven system design thereare some limitations to consider.
Limitations Due to orthographical and synonymous variances,a single configuration that both maximizes precision and recall doesnot exist. The results for the Perceval versions illustrate, however,the efficiency of our approach to approximate a “perfect alignment.”Even though the system is designed to expedite comparison fortextual critics, retrieved alignment tuples still have to be examinedindividually. According to Bradley et al. [9], this fact situates oursystem within the concept of “slow analytics,” a process where infor-mation visualization methods can support sense making in literarystudies by means of repetitive decision making. Finally, the systemwas designed together with only one medievalist although othermedievalists have experimented with it. Even though our approachreflects the fruitful collaboration between literature and computerscience, it remains to be seen how literary history will receive oursystem and its expansion of Zumthor’s concept of mouvance beyonda purely theoretical notion to an empirically parameter-driven andvisualizable textual phenomenon.
8 CONCLUSION
Scholars have suggested that oral-like language is integral to theprocess of poetic creation for medieval texts as we have seen in thecase studies above. This oral inflection causes not only differentkinds of variance, e.g., orthographical and synonymous variance,transposition of words and verse lines, inserted paragraphs or re-organized rhyming structures, but patterns of variance are also notuniform across a text. As a consequence, the discovery of relatedtext passages is a very confusing task for the textual critic to man-age. Now, with the help of our visual analytics alignment approach,the alignment algorithm is capable of handling the mentioned het-erogenous forms of variance, and the visualization assembles themempirically in a panoptic view.
The outlined visual analytics method was developed in close col-laboration of a computer scientist and a medieval literary historianover an extended period following a user-centered approach. In theend, the medievalist finds a valuable instrument that yields “an align-ment not to be understood as a final product, but rather a process, forunderstanding variant text traditions, supporting the generation ofnew hypotheses about textual behavior.” He argues that the resultsgained with our approach could even replace the archetype conceptfor the investigated text genre—a hypothesis yet to be discussed bymedieval scholars. On the other hand, the computer scientist wasable to establish a computational alignment algorithm for highlyinstable text variants coupled with multi-level visualizations in anovel visual analytics environment that allows for an iterative im-provement of alignment results, and in addition, for the graduallyimprovement of comparison of different text versions. In addition totypical close and distant reading views, we introduce an intermediatemeso reading view that juxtaposes different text versions the waythat the texts can still be close read, but it furthermore visualizes in-terdependencies of verse lines across manuscript versions. Althoughwe designed the system for medieval French texts, our approach isadaptable to other languages or textual scenarios having the sameheterogenous forms of variance.
REFERENCES
[1] Versioning Machine, 2017. http://v-machine.org/ (Retrieved2017-02-07).
[2] A. Abdul-Rahman, J. Lein, K. Coles, E. Maguire, M. Meyer, M. Wynne,C. R. Johnson, A. Trefethen, and M. Chen. Rule-based VisualMappings–with a Case Study on Poetry Visualization. In ComputerGraphics Forum, volume 32, pages 381–390. Wiley Online Library,2013.
[3] A. Abdul-Rahman, G. Roe, M. Olsen, C. Gladstone, R. Whaling,N. Cronk, R. Morrissey, and M. Chen. Constructive Visual Analyticsfor Text Similarity Detection. Computer Graphics Forum, 2016.
[4] C. Abras, D. Maloney-Krichmar, and J. Preece. User-centered De-sign. Bainbridge, W. Encyclopedia of Human-Computer Interaction.Thousand Oaks: Sage Publications, 37(4):445–456, 2004.
[5] E. Alexander, J. Kohlmann, R. Valenza, M. Witmore, and M. Gleicher.Serendip: Topic Model-Driven Visual Exploration of Text Corpora. InVisual Analytics Science and Technology (VAST), 2014 IEEE Confer-ence on, pages 173–182, Oct 2014.
[6] B. Asokarajan, R. Etemadpour, J. Abbas, S. Huskey, and C. Weaver.Visualization of Latin Textual Variants using a Pixel-Based Text Analy-sis Tool. In N. Andrienko and M. Sedlmair, editors, EuroVis Workshopon Visual Analytics (EuroVA). The Eurographics Association, 2016.
[7] M. Behrisch, M. Krstajic, T. Schreck, and D. A. Keim. The NewsAuditor: Visual Exploration of Clusters of Stories. In K. Matkovic andG. Santucci, editors, EuroVA 2012: International Workshop on VisualAnalytics. The Eurographics Association, 2012.
[8] K. Bowers. Personal communication, November 4, 2016.[9] A. J. Bradley, H. Mehta, M. Hancock, and C. Collins. Visualization,
Digital Humanities, and the Problem of Instrumentalism. In Workshopon Visualization for the Digital Humanities, IEEE VIS 2016, Baltimore,Maryland, USA, October 24th, 2016.
[10] M. Brehmer, S. Ingram, J. Stray, and T. Munzner. Overview: TheDesign, Adoption, and Analysis of a Visual Document Mining Tool forInvestigative Journalists. Visualization and Computer Graphics, IEEETransactions on, 20(12):2271–2280, Dec 2014.
[11] L. Byron and M. Wattenberg. Stacked Graphs – Geometry & Aes-thetics. Visualization and Computer Graphics, IEEE Transactions on,14(6):1245–1252, Nov 2008.
[12] M. F. Cheema, S. Janicke, and G. Scheuermann. AnnotateVis: Combin-ing Traditional Close Reading with Visual Text Analysis. In Workshopon Visualization for the Digital Humanities, IEEE VIS 2016, Baltimore,Maryland, USA, October 24th, 2016.
[13] P. Christen. A Comparison of Personal Name Matching: Techniquesand Practical Issues. In Data Mining Workshops, 2006. ICDM Work-shops 2006. Sixth IEEE International Conference on, pages 290–294.IEEE, 2006.
[14] C. Collins, S. Carpendale, and G. Penn. Docuburst: Visualizing docu-ment content using language structure. In Computer Graphics Forum,volume 28, pages 1039–1046. Wiley Online Library, 2009.
[15] C. Collins, F. Viegas, and M. Wattenberg. Parallel Tag Clouds toexplore and analyze faceted text corpora. In Visual Analytics Scienceand Technology, 2009. VAST 2009. IEEE Symposium on, pages 91–98,Oct 2009.
[16] M. Correll, M. Witmore, and M. Gleicher. Exploring collectionsof tagged text for literary scholarship. Computer Graphics Forum,30(3):731–740, 2011.
[17] J. J. Duggan. A Concordance of the Chanson de Roland. Ohio StateUniversity Press, 1969.
[18] M. El-Assady, V. Gold, W. Jentner, M. Butt, K. Holzinger, and D. A.Keim. VisArgue - A Visual Text Analytics Framework for the Studyof Deliberative Communication. In Proceedings of The InternationalConference on the Advances in Computational Analysis of PoliticalText (PolText2016), pages 31–36. University of Zagreb, 2016.
[19] S. Gaunt and S. Kay. The Cambridge Companion to Medieval FrenchLiterature. Cambridge Companions to Literature. Cambridge Univer-sity Press, 2008.
[20] Z. Geng, T. Cheesman, R. S. Laramee, K. Flanagan, and S. Thiel.ShakerVis: Visual analysis of segment variation of German translationsof Shakespeare’s Othello. Information Visualization, 2013.
[21] F. Gibbs and T. Owens. Building Better Digital Humanities Tools: To-ward broader audiences and user-centered designs. Digital HumanitiesQuarterly, 6(2), 2012.
[22] P. Goffin, W. Willett, J.-D. Fekete, and P. Isenberg. Exploring thePlacement and Design of Word-Scale Visualizations. Visualization andComputer Graphics, IEEE Transactions on, 20(12):2291–2300, Dec2014.
[23] J. M. Green. ’On Pe is nis bute chatering’: cyberpragmatics and theparatextual anatomy of Twitter. Studies in Variation, Contacts andChange in English, 15, 2014.
[24] M. Harrower and C. A. Brewer. ColorBrewer.org: An Online Toolfor Selecting Colour Schemes for Maps. The Cartographic Journal,40(1):27–37, 2003.
[25] F. Heimerl, S. Koch, H. Bosch, and T. Ertl. Visual Classifier Trainingfor Text Document Retrieval. Visualization and Computer Graphics,IEEE Transactions on, 18(12):2839–2848, Dec 2012.
[26] B. Heuwing, T. Mandl, and C. Womser-Hacker. Methods for User-Centered Design and Evaluation of Text Analysis Tools in a DigitalHistory Project. Proceedings of the Association for Information Scienceand Technology, 53(1):1–10, 2016.
[27] S. Howell, M. Kelleher, A. Teehan, and J. Keating. A Digital Humani-ties Approach to Narrative Voice in The Secret Scripture: Proposing aNew Research Method. Digital Humanities Quarterly, 8(2), 2014.
[28] S. Janicke. Valuable Research for Visualization and Digital Humani-ties: A Balancing Act. In Workshop on Visualization for the DigitalHumanities, IEEE VIS 2016, Baltimore, Maryland, USA, October 24th,2016.
[29] S. Janicke, T. Efer, M. Buchler, and G. Scheuermann. Designing Closeand Distant Reading Visualizations for Text Re-use. In InternationalConference on Computer Vision, Imaging and Computer Graphics,pages 153–171. Springer International Publishing, 2014.
[30] S. Janicke, J. Focht, and G. Scheuermann. Interactive Visual Profilingof Musicians. Visualization and Computer Graphics, IEEE Transac-tions on, 22(1):200–209, Jan 2016.
[31] S. Janicke, G. Franzini, M. F. Cheema, and G. Scheuermann. OnClose and Distant Reading in Digital Humanities: A Survey and FutureChallenges. In R. Borgo, F. Ganovelli, and I. Viola, editors, Eurograph-ics Conference on Visualization (EuroVis) - STARs. The EurographicsAssociation, 2015.
[32] S. Janicke, G. Franzini, M. F. Cheema, and G. Scheuermann. VisualText Analysis in Digital Humanities. Computer Graphics Forum, 2016.
[33] S. Janicke and A. Gessner. A Distant Reading Visualization for VariantGraphs. In Proceedings of the Digital Humanities 2015, 2015.
[34] S. Janicke, A. Gessner, M. Buchler, and G. Scheuermann. Visualiza-tions for Text Re-use. GRAPP/IVAPP, pages 59–70, 2014.
[35] S. Janicke, A. Geßner, G. Franzini, M. Terras, S. Mahony, andG. Scheuermann. TRAViz: A Visualization for Variant Graphs. DigitalScholarship in the Humanities, 30(suppl 1):i83–i99, 2015.
[36] S. Janicke and D. Wrisley. Visualizing Mouvance: Towards a VisualAnalysis of Variant Medieval Text Traditions. Digital Scholarship inthe Humanities (to appear), 2017.
[37] S. Janicke and D. J. Wrisley. Visualizing Mouvance: Towards anAlignment of Medieval Vernacular Text Traditions. In Proceedings ofthe Digital Humanities 2016, 2016.
[38] M. L. Jockers. Macroanalysis: Digital Methods & Literary History.University of Illinois Press, 2013.
[39] D. Keim and D. Oelke. Literature Fingerprinting: A New Method forVisual Literary Analysis. In Visual Analytics Science and Technology,2007. VAST 2007. IEEE Symposium on, pages 115–122, Oct 2007.
[40] D. A. Keim, F. Mansmann, J. Schneidewind, J. Thomas, and H. Ziegler.Visual Analytics: Scope and Challenges. In Visual Data Mining, pages76–90. Springer, 2008.
[41] E. J. Kenney. Textual Criticism, 2012. https://www.britannica.com/topic/textual-criticism (Retrieved 2017-03-06).
[42] S. Koch, H. Bosch, M. Giereth, and T. Ertl. Iterative Integration ofVisual Insights during Scalable Patent Search and Analysis. IEEETransactions on Visualization and Computer Graphics, 17(5):557–569,May 2011.
[43] S. Koch, M. John, M. Worner, A. Muller, and T. Ertl. VarifocalReader –In-Depth Visual Analysis of Large Text Documents. Visualization and
Computer Graphics, IEEE Transactions on, 20(12):1723–1732, Dec2014.
[44] K. Kucher and A. Kerren. Text Visualization Techniques: Taxon-omy, Visual Survey, and Community Insights. In 2015 IEEE PacificVisualization Symposium (PacificVis), pages 117–121, April 2015.
[45] N. McCurdy, J. Lein, K. Coles, and M. Meyer. Poemage: Visualizingthe Sonic Topology of a Poem. Visualization and Computer Graphics,IEEE Transactions on, 22(1):439–448, Jan 2016.
[46] T. Munzner. A nested model for visualization design and validation. Vi-sualization and Computer Graphics, IEEE Transactions on, 15(6):921–928, 2009.
[47] T. Munzner. Visualization Analysis & Design. CRC Press, 2014.[48] S. B. Needleman and C. D. Wunsch. A general method applicable to
the search for similarities in the amino acid sequence of two proteins.Journal of molecular biology, 48(3):443–453, 1970.
[49] D. Oelke, D. Kokkinakis, and D. A. Keim. Fingerprint Matrices:Uncovering the dynamics of social networks in prose literature. InComputer Graphics Forum, volume 32, pages 371–380. Wiley OnlineLibrary, 2013.
[50] P. Riehmann, H. Gruendl, M. Potthast, M. Trenkmann, B. Stein, andB. Froehlich. WORDGRAPH: Keyword-in-Context Visualization forNETSPEAK’s Wildcard Search. Visualization and Computer Graphics,IEEE Transactions on, 18(9):1411–1423, Sept 2012.
[51] P. Riehmann, M. Potthast, B. Stein, and B. Froehlich. Visual As-sessment of Alleged Plagiarism Cases. Computer Graphics Forum,34(3):61–70, 2015.
[52] G. Roe. Intertextuality and Influence in the Age of Enlightenment:Sequence Alignment Applications for Humanities Research. In Pro-ceedings of the Digital Humanities 2012, 2012.
[53] B. Schmidt. Zooming In and Out: Close and Distant Reading.,2013. http://benschmidt.org/dighist13/?p=120 (Retrieved2017-06-27).
[54] B. Shneiderman. The Eyes Have It: A Task by Data Type Taxonomyfor Information Visualizations. In Visual Languages, Proceedings,pages 336–343, 1996.
[55] H. Siirtola, T. Saily, T. Nevalainen, and K.-J. Raiha. Text VariationExplorer: Towards interactive visualization tools for corpus linguistics.International Journal of Corpus Linguistics, 19(3):417–429, 2014.
[56] S. Silvia, R. Etemadpour, J. Abbas, S. Huskey, and C. Weaver. Visu-alizing Variation in Classical Text with Force Directed Storylines. InWorkshop on Visualization for the Digital Humanities, IEEE VIS 2016,Baltimore, Maryland, USA, October 24th, 2016.
[57] T. F. Smith and M. S. Waterman. Identification of common molecularsubsequences. Journal of molecular biology, 147(1):195–197, 1981.
[58] H. Strobelt, D. Oelke, B. C. Kwon, T. Schreck, and H. Pfister. Guide-lines for Effective Usage of Text Highlighting Techniques. Visualiza-tion and Computer Graphics, IEEE Transactions on, 22(1):489–498,Jan 2016.
[59] R. Vuillemot, T. Clement, C. Plaisant, and A. Kumar. What’s beingsaid near ”Martha”? Exploring name entities in literary text collections.In Visual Analytics Science and Technology, 2009. VAST 2009. IEEESymposium on, pages 107–114, Oct 2009.
[60] B. Walsh, C. Maiers, G. Nally, J. Boggs, and P. P. Team. Crowdsourcingindividual interpretations: Between microtasking and macrotasking.Literary and Linguistic Computing, 29(3):379–386, 2014.
[61] M. Wattenberg and F. Viegas. The Word Tree, an Interactive VisualConcordance. Visualization and Computer Graphics, IEEE Transac-tions on, 14(6):1221–1228, Nov 2008.
[62] D. Wheeles and K. Jensen. Juxta Commons. In Proceedings of theDigital Humanities 2013, 2013.
[63] P. Zumthor. Toward a Medieval Poetics. University of Minnesota Press,1992.