interactive infographics as an agricultural …
TRANSCRIPT

INTERACTIVE INFOGRAPHICS AS AN AGRICULTURAL COMMUNICATION
STRATEGY
by
ERIN BURNETT
(Under the Direction of Jessica Holt)
ABSTRACT
In public health, politics, and advertising, interactive content has created increased
elaboration from those audiences that would otherwise be least likely to engage with a message.
This study sought to examine interactivity as an agricultural communication strategy though the
lens of the dual-process model of interactivity effects. Respondents were randomly assigned a
static or interactive data visualization concerning the production of peaches and blueberries in
Georgia then asked to list their thoughts. Pre-existing factors of involvement and internet ability
were recorded. Respondents significantly elaborated more with an interactive message than the
static and this held true when pair-wise comparison of elaboration means were higher for the
interactive message across the board. However, these results indicated a departure from the dual-
process model of interactivity effects in that this difference in elaboration became statistically
insignificant when respondents were stratified into groups based on the model’s framework.
INDEX WORDS: interactivity, involvement, internet ability, agricultural news, online news,
interactive graphics, attitudes, elaboration

INTERACTIVE INFOGRAPHICS AS AN AGRICULTURAL COMMUNICATION
STRATEGY
by
ERIN BURNETT
BSA, University of Georgia, 2016
A Thesis Submitted to the Graduate Faculty of The University of Georgia in Partial Fulfillment
of the Requirements for the Degree
MASTER OF AGRICULTURAL AND EVIRONMENTAL EDUCATION
ATHENS, GEORGIA
2018

© 2018
Erin Burnett
All Rights Reserved

INTERACTIVE INFOGRAPHICS AS AN AGRICULTURAL COMMUNICATION
STRATEGY
by
ERIN BURNETT
Major Professor: Jessica Holt Committee: Abigail Borron Bartosz Wojdynski Electronic Version Approved: Suzanne Barbour Dean of the Graduate School The University of Georgia August 2018
iv
TABLE OF CONTENTS
Page
LIST OF TABLES...................................................................................................................... v
LIST OF FIGURES ................................................................................................................... vi
CHAPTER
1 INTRODUCTION .................................................................................................... 1
Infographics and Data Journalism ........................................................................ 1
Elaboration Likelihood Model and the Dual-Process Model of Interactivity......... 2
Need for Research ............................................................................................... 5
Definitions of Key Words .................................................................................... 8
Statement of Purpose ......................................................................................... 13
2 LITERATURE REVIEW ........................................................................................ 14
Infographics ...................................................................................................... 14
Interactivity ....................................................................................................... 15
Elaboration Likelihood Model and the Dual-Process Model of Interactivity....... 18
Involvement ...................................................................................................... 25
Ability ............................................................................................................... 27
Hypotheses ........................................................................................................ 32
3 METHODOLOGY .................................................................................................. 34
Stimulus Design ................................................................................................ 34
Research Design ................................................................................................ 37

v
Population ......................................................................................................... 40
Survey Administration ....................................................................................... 41
Data Analysis ................................................................................................... 44
Limitations ........................................................................................................ 45
4 FINDINGS .............................................................................................................. 48
Overview ........................................................................................................... 48
Sample .............................................................................................................. 48
Reliability .......................................................................................................... 48
Analysis ............................................................................................................ 50
Hypothesis Testing ............................................................................................ 58
Post-Hoc Analyses............................................................................................. 60
5 DISCUSSION ......................................................................................................... 62
Overview ........................................................................................................... 62
Elaboration ........................................................................................................ 63
Perceived Interactivity Measure ......................................................................... 64
Involvement Measure ........................................................................................ 65
Internet Access and Ability ................................................................................ 67
6 CONCLUSIONS ..................................................................................................... 70
Conclusions ....................................................................................................... 70
Implications ....................................................................................................... 71
Limitations ........................................................................................................ 75
Suggestions for Future Research ........................................................................ 75

vi
REFERENCES ......................................................................................................................... 79
APPENDICES
A Static Stimulus ........................................................................................................ 85
B Interactive Stimulus ................................................................................................. 86
C Georgia Department of Agriculture Press Release ................................................... 90
vii
LIST OF TABLES
Page
Table 1: Perceived Interactivity Measure Means ....................................................................... 41
Table 2: Internet Ability Measure Item Frequencies and Correlations with Elaboration............. 43
Table 3: Hours Online Respondent Grouping: Frequencies and Mean Elaboration .................... 44
Table 4: Ability, Involvement Mann-Whitney U Results ........................................................... 45
Table 5: Post-Hoc Respondent Grouping Frequencies and Mean Elaboration............................ 46

viii
LIST OF FIGURES
Page
Figure 1: Elaboration Likelihood Model (Petty & Cacioppo, 1986) ........................................... 18
Figure 2: Dual Process Model of Interactivity Effects (Liu & Shrum, 2009) ............................. 19
Figure 3: Involvement Score Frequencies ................................................................................. 54

1
INTRODUCTION
Infographics and Data Journalism
Media convergence and the constantly changing state of digital communication has led to
increased adaptation and hybridization in communication strategies (Weber & Rall, 2012). The
changing communication landscape has become increasingly reliant on visual graphics, with
online journalism in particular turning to interactive information graphics to tell stories
(Bounegru, Chambers, & Gray, n.d.; Weber & Rall, 2012). “News sites, such as nytimes.com,
guardian.co.uk, elmundo.es, bbc.co.uk, and spiegel.de, use interactive information graphics to
explain complex information clearly and intelligibly, e.g., the Fukushima nuclear disaster, the
White House health care plan, the Iraq protocols, the euro crisis, Hurricane Irene” (Weber &
Rall, 2012). The appeal of interactive infographics for both audiences and story-tellers is easy to
understand. These infographics have the unique power of engaging the reader in data, pointing
out relationships and patterns that would be difficult to explain through text alone (Weber &
Rall, 2012). As Reilly states, “In a news environment where high story turnover is necessary, the
strength of data visualization lies in the viewer’s ability to process visual information more
rapidly than verbal information” (2017).
The addition of interactive infographics can make an argument more persuasive and
attractive to readers, but it also poses a dilemma to communicators. To better understand the
power and limitations of interactive infographics to persuade and change attitudes, a basic
understanding of cognition and persuasion is required. To this end, Petty and Cacioppo created
the Elaboration Likelihood Model (ELM) (1986).

2
Elaboration Likelihood Model and the Dual-Process Model of Interactivity
The ELM is made up of two different routes of persuasion, which represent the two
different ways humans form opinions based on persuasive communication (Petty & Cacioppo,
1986). The first route of persuasion is the central route, which includes thoughtful consideration
of arguments central to the issue. This route requires more cognitive energy, but results in lasting
attitude formation (Sundar, Kalyanaraman, & Brown, 2003; Petty & Cacioppo, 1986). The
second route of persuasion is the peripheral route, which is tied to simple cues or affective
association. The peripheral route requires less cognitive energy, but attitudes formed via this
route are more ephemeral (Sundar, Kalyanaraman, & Brown, 2003; Petty & Cacioppo, 1986).
The route of persuasion a reader uses to form his opinion is determined by his motivation and
ability to evaluate the communication (Petty & Cacioppo, 1986). This motivation and ability
were combined under the term elaboration likelihood. The ELM proposed that there are a limited
number of ways to affect this elaboration likelihood (Petty & Cacioppo, 1986). The ELM’s
strength and ubiquity in cognition and communication research has been due to this ability to
classify all communication variables into the relatively simple categories of argument, peripheral
cue, or factor affecting argument scrutiny (Petty & Cacioppo, 1986). By containing the many
possible variables into these distinct categories, the ELM provided a schema through which the
persuasiveness of communication methods may be judged.
The presence of infographics increased the persuasiveness of messages for most
audiences (Vanichvasin, 2013). Infographics create a broader appeal and foster better
comprehension and retention of information as opposed to text or images alone (Vanichvasin
2013). Furthermore, the appeal seems universal, as infographics have been shown to lead to a
higher level of elaboration among both visual and verbal learners (Atkinson & Lazard, 2015).

3
The broad appeal of infographics and the continued hybridization of digital communication has
combined to create the ability to click, slide, or otherwise navigate multiple different visuals
working together as a group to tell the story of a dataset. These hybrid forms are known as
interactive infographics, which have become staples in online journalism of the aforementioned
news sources (Weber & Rall, 2012).
Applying the ELM to interactive infographics showed that the presence of interactivity
may serve as an argument, peripheral cue, or factor that affects the extent of elaboration (Petty &
Cacioppo, 1986; Liu & Shrum, 2009). It also suggested that this role of interactivity and its
effects will change according to the reader’s level of motivation and ability to process
information (Liu & Shrum, 2009). That is, for low-involvement individuals interactivity may act
as a positive peripheral cue and for high-involvement individuals it may be considered an
argument or factor that increases elaboration (Liu & Shrum, 2009).
The addition of interactivity to infographics presents a tempting opportunity to increase a
message’s persuasive power, but it can also be a deterrent for those readers not accustomed to
navigating online spaces (Liu & Shrum, 2009). In this online context, “interactivity, like
vividness, is a stimulus-driven variable, and is determined by the technological structure of the
medium” (Steuer, 1992). Hybridization of communication strategies and advances in technology
foster increased interactivity in messaging, which could in turn represent the potential of
increasing attitudes and elaboration in most audiences (Weber & Rall, 2012; Rafaelli, 1986).
Interactivity can not only increase attitudes and elaboration but can also foster other positive
effects as well, including increased performance quality, motivation, sense of fun, cognition,
learning, and sociability of a message (Rafaelli, 1986).

4
In ELM, the mere presence of interactivity acted as a positive peripheral cue to readers.
This combined with its unique power to illustrate data has made it a popular method of science
communication (Weber & Rall, 2012). The effects of interactivity on message persuasiveness
have been examined in the realm of public health, advertising, and marketing in multiple studies
(Liu & Shrum, 2009). The early results of these interactive infographic studies were often
contradictory, despite the broad appeal of infographics and the positive peripheral cue of
interactivity. Combining these two strategies created a new communication method that was
more than simply the sum of its parts. In an attempt to reconcile past research and move forward
with a model that accounted for the variables of involvement and ability put forth in the ELM,
Liu and Shrum proposed the dual-process model of interactivity effects in 2009. In this model,
the ability of consumers is defined by the amount of time they spend on the internet each week
and motivation is defined by the consumer’s level of involvement in the stimulus topic. Through
application of the dual-process model, interactivity proved to affect low-involvement consumers
positively, while it was moderated by ability in the case of high-involvement users. For low-
involvement users, internet experience did not change the higher processing and increased
attitudes resulting from the message’s level of interactivity (Liu & Shrum, 2009). For high-
involvement consumers, the ability to make use of the interactive elements allowed them to
enhance their central processing and improved their attitudes towards the message (Liu &
Shrum, 2009). However, the lack of internet experience of the novice user group of high
involvement individuals led to reduced focus on central arguments and more negative attitudes
as a result of the increased cognitive resources required (Liu & Shrum, 2009). In summary, under
the dual process model, three of the four groups experienced the positive effects of increased
message elaboration and positivity. The fourth group was inhibited due to their inability to make

5
effective use of the interactive elements. That is, interactivity increased attitudes and elaboration
for frequent internet users as well as infrequent users with little involvement in the message topic
but resulted in negative attitudes and decreased elaboration for those high involvement
individuals that used the internet infrequently. This dual-process model helped explain the small
portion of the audience that exhibited lower attitude and elaboration scores towards interactive
infographics (Liu & Shrum, 2009).
Need for Research
While several studies have been conducted on the effectiveness of interactive
infographics in the realms of public health, advertising, and marketing, none have broached the
topic of agriculture. With issues pertaining to genetically modified organisms, animal welfare,
and seed propriety, agricultural science is one of the more divisive sciences to capture the public
mind today (Brossard & Nisbet, 2006). With the introduction of opinions concerning
conventional agriculture and its accompanying sciences propagated by many disparate interests
including companies, politicians, farmers, scientists, and members of the general public, it can be
difficult for a low-involvement consumer to form their own opinions about agriculture in the
United States (Brossard & Nisbet, 2006). The public tendency is to take cognitive shortcuts
whenever available, relying on attitudes and beliefs to help make sense of persuasive agricultural
communications (Brossard & Nisbet, 2006). Therefore, the power of interactive infographics
could be harnessed to work as a peripheral cue to increase the attitudes of these low-involvement
individuals. In fact, Wojdynski states, “interactivity may specifically have an effect on those who
are otherwise least likely to engage with a message” (2015). Besides acting as a positive
peripheral cue, interactive infographics can be utilized in agricultural communication to combat
opinion overload of the uninformed consumer by presenting factual data in a manner that is both
6
engaging and easy to understand, which allows consumers to heuristically form their own
opinions.
As technology has increased exponentially, so, too, has the amount of data to which
communicators and their audience have access (Cairo, 2013). Much of the communication
received by the general public is digital, now that 89% of the U.S. population uses the internet
(Anderson, Perrin, & Jiang, 2018). In a time when companies, news outlets, and individuals are
vying for the public’s attention, communication that stands out amongst the crowd of
information online has become increasingly important (Holt, 2016). Furthermore, the increase in
the amount of information with which consumers are inundated has facilitated a commensurate
decrease in attention span (McSpadden, 2015). This information overload also means that the
more consumers use the internet, the more likely they are to encounter information with which
they have low involvement. Rather than provide reassurance, too much information tends to
overwhelm consumers, leaving them with negative attitudes towards the entire message (Spenner
& Freeman, 2012). In this digital landscape, messages must stand out from the crowd and be
quickly understood in order to be persuasive (McSpadden, 2015; Spenner & Freeman, 2012).
To keep pace with the exponential increase in internet use and its correlating increase in
the number of low-involvement message consumers, it is imperative that agricultural
communication adapt and better understand how best to communicate through interactivity. As
the use of internet-connected devices increases, the number of low-ability consumers will
decrease. This means that as more consumers turn to online sources for media consumption, the
value of interactivity in communication will rise. With the exponential increase of internet users,
interactive communication becomes an increasingly timely topic for research.

7
Aside from the need to stay relevant in a world of changing technology, the practical
significance of a better understanding of interactivity in the agricultural communication field
could create the opportunity for more persuasive communications. Interactivity could be
included in online websites, news stories, newsletters and crisis communication, to name a few.
Interactive infographics could give consumers more motivation to engage with the information,
as well as the power to understand how overarching agricultural issues like drought, temperature
increase, or use of pesticides personally affect them. Furthermore, practical use of interactive
infographics could help communicate complicated agricultural processes more effectively to the
low-involvement layman (Wojdynski, 2015).
Studies have not yet tested the dual-process model in the agricultural realm and it is
possible that examination of this politically and personally divisive topic can make unique
contributions to the standing literature. Although the majority of consumers are not part of the
agricultural industry, every consumer interacts with food multiple times each day. More research
is necessary to ascertain how this universal familiarity affects the “low-involvement”
classification. Furthermore, applying the dual-process model of interactivity to agricultural
communications poses an additional quandary: how does the model function when high-
involvement consumers are disproportionately low ability, as is likely to occur in the rural
agricultural population? A generally aging, rural, low-income population, agriculturalists are
among the least likely to exhibit high internet ability scores (Salemink, Strijker, & Bosworth,
2017). This means that the highest involvement group (agriculturalists) is more likely to be low
ability than the general public, resulting in an increased risk of negative attitudes and lower
elaboration for interactive agricultural infographics than for communications on a different topic.
How can interactivity be harnessed to stay relevant and reach new audiences without alienating

8
this core group of disproportionately low ability devotees? This study sought to address current
communication trends by identifying and discussing the significant moderators of attitude and
elaboration for interactive agricultural infographics among the general public.
Despite current communication trends and research, the potential of interactive
agriculture-based infographics to affect consumer attitudes and elaboration remains unclear, and
laboring under the misconception that agriculture is no different from other message topics could
risk the alienation of the science and industry’s biggest supporters.
Definitions of Key Words
Prior to positing research hypotheses and questions, this study defined key words that
form the basis of this study’s contribution.
Data visualization: Data visualization is “the science of visual representation of ‘data’,
defined as information which has been abstracted in some schematic form, including attributes or
variables for the units of information” (Friendly, 2001). The purpose of data visualization is to
function as a tool of exploration and discovery of data in a way that allows viewers to better
understand patterns and trends (Friendly, 2001). As Cairo (2013) states, “The first and main goal
of any graphic and visualization is to be a tool for your eyes and brain to perceive what lies
beyond their natural reach.” Most data visualizations, including the one used as a stimulus in this
study, consist of either statistical graphics, thematic cartography, or both (Friendly, 2011).
Infographic: Past definitions of infographics have distinguished between infographics and
data visualizations where, “infographics tell stories designed by communicators” and data
visualization “helps readers discover stories by themselves” (Cairo, 2013). However, the purpose
of data visualization and infographics are ultimately the same: to enable users to better
understand data by study of a visual representation, and as hybridization of data visualizations

9
has increased, the distinction between the two has become less sharp (Cairo, 2013; Weber &
Rall, 2012). Throughout this study, the terms infographic and data visualization were used
interchangeably as many current data visualizations are hybrids of infographics, text,
illustrations, interactive tools, and many other media (Weber & Rall, 2012). Cairo (2013)
contended that data visualization and infographics exist on a continuum. Where data
visualization is a tool for data exploration by users, infographics trend more towards the
presentation of information to users (Cairo, 2013). For example, where a data visualization is
either a statistical graphic or thematic map, an infographic can be as simple as a bar graph.
Graphics that simply present data in visual manner to a user without requiring further exploration
or understanding of the data are therefore considered to exist closer to the infographic side of the
continuum as opposed the data visualization (Cairo, 2013). Perhaps the simplest difference
between the two is that infographics tend to merely present one aspect of data where data
visualizations are tools to analyze the relationships and patterns within the data (Cairo, 2013).
The entirety of the message stimuli used in this study should be considered a data visualization,
but it is composed of elements that range across the presentation-exploration continuum of
infographics and visualizations presented by Cairo (2013). This hybridization of infographics
and visualization is common of most current data journalism (Weber & Rall, 2012).
Interactivity: This study defined interactivity as proposed by Steur (2009)
“Interactivity is the extent to which users can participate in modifying the form and
content of a mediated environment in real time. Interactivity in this sense is distinct from
engagement or involvement as these terms are frequently used by communication
researchers.”

10
There are three different types of interactivity proposed by Weber & Rall (2012)
including linear, explorative, and non-linear interactivity. Along with other elements, these
interactivity types correspond to different levels of message interactivity observed as low,
moderate, and high (Sundar, Kalyanaraman, & Brown, 2003; Weber & Rall, 2012). Liu (2003)
proposed three main dimensions by which this level of interactivity may be perceived by users.
The first is a user’s ability to voluntarily participate in and instrumentally influence a
communication, called active control (Liu, 2003). The second dimension is flow of information
between the message and the user, called two-way communication (Liu, 2003). The third is the
speed by which the interaction between the message and user occurred, called synchronicity
(Liu, 2003). Liu defines interactive communication as, “a communication that offers individuals
active control and allows them to communicate both reciprocally and synchronously,” (2003).
Interactive Infographic: This study defined interactive infographics as, “an independent
visual representation of information or knowledge with different modes: e.g., images (still and
moving, diagrams, maps), written texts, audios, and design elements are combined in such a way
that they create a new hybrid form” (Weber & Rall, 2012). In this study, interactive infographics
are therefore considered data visualizations that make use of both infographics and interactivity.
Hybridization: By using the term hybridization, this study meant “the emergence of new
media forms by adapting or transforming old patterns or combining different patterns to create a
new one. Formerly separate areas and media are intertwined and connected to create a new
cohesive whole” (Weber & Rall, 2012). In this sense, interactive infographics are considered a
hybrid form of data visualization as they combine infographics and interactivity, often in
conjunction with other media forms. As new platforms have emerged and the availability and
speed of the internet has increased, so too, has the hybridization of data visualization and
11
journalism (Weber & Rall, 2012). It is expected that this trend of hybridization of data
visualizations will continue (Weber & Rall, 2012).
Elaboration: This study defined elaboration as, “a continuum of no thought concerning
issue-relevant information presented to complete critical thought of every argument and
integration of these elaborations into the person’s attitude schema” (Petty & Cacioppo, 1986). A
high level of elaboration likelihood engendered positive attitudes, deeper critical thinking, and
more resilient beliefs and behavior changes, and is the goal of most persuasive communications
(Petty & Cacioppo, 1986). A low level of elaboration likelihood engendered less message-
relevant thoughts and belief and behavior resiliency but did not always indicate negative
message attitude (Petty & Cacioppo, 1986). In low elaboration situations, user cognition
followed the peripheral route of ELM in which the presence of peripheral cues determined user
attitudes. When viewed from an interactive infographic perspective, interactivity functioned as a
positive peripheral cue at lower elaboration likelihood levels, providing an overall positive effect
on consumer message attitudes (Liu & Shrum, 2009; Wojdynski, 2015).
Involvement: Involvement was defined as “the extent to which an advocacy has ‘intrinsic
importance’ or ‘personal meaning’” (Petty & Cacioppo, 1986). This personal relevance is based
on the consumer’s needs, values, and interests and comprises both cognitive and affective
messages (Zaichkowsky, 1994). Involvement occurred when a consumer expected the message
topic to have serious consequences in their day-to-day lives (Petty & Cacioppo, 1986). That is, if
a consumer considered the topic of the message important and personally relevant, he would be
motivated to think critically in order to better understand the message (Petty & Cacioppo, 1986).
This type of consumer was considered highly involved with said message topic. Consumers who
consider the topic to be of trivial importance and are therefore unmotivated to critically examine

12
the message were considered low involvement (Petty & Cacioppo, 1986). The level of a
consumer’s involvement determines whether his message attitudes and thoughts will occur via
the peripheral or central route (Petty & Cacioppo, 1986). In this sense, involvement is a
moderating factor of elaboration for both the ELM and the dual-process model of interactivity
effects. For the purposes of this study, the ELM’s “motivation to process” moderator should be
considered the equivalent of the “involvement” moderator found in the dual-process model of
interactivity effects (Liu & Shrum, 2009; Petty & Cacioppo, 1986).
Ability: This study defined ability as the extent to which a consumer could effectively
make use of the interactive elements present within the interactive message stimulus (sliders,
drop down menus, navigational bars, etc.) and other similar online interactive infographics.
Users with high ability were able to effectively utilize the interactive elements as tools to
communicate with interactive infographics (Liu & Shrum, 2009). Users with low ability
struggled or were unable to use the interactive elements (Liu & Shrum, 2009). In their dual-
process model of interactivity effects, Liu and Shrum (2009) posited that this ability could be
equated with a user’s internet experience and resulting competence and quantified this level of
ability by the hours a respondent spent online each week. In an attempt to extend this study’s
findings to agricultural communication, the current study measured ability in the same way for
the purpose of hypothesis testing. Online communication strategies are constantly evolving,
however, and the researcher recognized from the literature review that hours spent online each
week measure may no longer be the most accurate predictor of respondent ability (Anderson,
Perrin, & Jiang, 2018; DiMaggio & Hargittai, 2001; Salemink, Strijker, & Bosworth, 2017). To
best measure a user’s ability to effectively use the interactive elements, which was equated by
Liu and Shrum (2009) to a user’s internet experience, the researcher attempted to gain a more

13
detailed understanding of respondent’s online experiences that extended past the original
measure of hours spent online. To this end, respondents were asked to answer questions
concerning their internet competence, purpose for going online, type of internet connection, and
other topics related to a user’s overall internet experience. These questions (Table 2) were
selected as items of interest due to their presence in current internet connectivity research
(Anderson, Perrin, & Jiang, 2018; Salemink, Strijker, & Bosworth, 2017). User responses to
these selected internet ability items were used in post-hoc analyses to provide a deeper
understanding of the dual-process model of interactivity effects within the agricultural
communication realm. For the purposes of this study, the ELM’s “ability to process” moderator
should be considered the equivalent of the “internet ability” moderator found in the dual-process
model of interactivity effects (Liu & Shrum, 2009; Petty & Cacioppo, 1986).
Statement of Purpose
The purpose of this study was to ascertain whether interactive infographics could be an
effective agricultural communication strategy by exploring the effects of interactivity on the
average consumer’s elaboration of messages presented as agricultural infographics through the
framework posited by the dual-process model of interactivity effects (Liu & Shrum, 2009).

14
LITERATURE REVIEW
Infographics
Infographics have become a ubiquitous tool of communication in many different
disciplines including science, engineering, and even literature (Cairo, 2015; Ciaiti, Marchelli,
Pretesi, Rapetti, Redavid, Vanuzzi, 2016; Cheng, Drewnowski, & Otten, 2015; Gebre & Polman,
2015). This is in part due to public preference. In the general public, an effective use of
infographics creates a broader appeal, comprehension, and retention of information as opposed to
only text or imagery (Vanichvasin, 2013). Infographics have been proven to help people make
sense of a mass of scientific data in a quick and manageable way (Dur, 2014). Furthermore,
infographics are not only the audience-preferred tool in science communication, but also lead to
a higher level of elaboration among both visual and verbal learners (Atkinson & Lazard, 2015).
Atkinson and Lazard’s study compared attitudes and elaboration toward messages based on
recycling, and, of particular interest in this study, genetically modified organisms. They found
infographics created more critical thinking engagement than image or text cues alone, regardless
of whether the subject exhibits a visual or verbal learning style. Although both groups responded
more favorably and elaborated more when the message was presented as an infographic as
opposed to text or image representations, surprisingly people with higher visual literacy
exhibited significantly less elaboration than those with lower visual literacy (Atkinson & Lazard,
2015). In this study, visual literacy served as an implicit moderating factor of elaboration for
both message stimuli.

15
Interactivity
Interactive online infographics differ from static, printed graphics in several ways. The
information architecture, interactivity, dramaturgy, intermediality, and multimodality aspects of
interactivity fundamentally change a user’s perception, the production process of the graphic,
and even the way the story is covered (Weber & Rall, 2012). Interactivity moderates a user’s
perception, the way in which he perceives, clicks, and navigates through information graphics on
the web. Furthermore, due to the differences in the way in which designers, editors, or journalists
produce information graphics, an entirely new set of skills or even professionals are required to
create these interactive infographics. The advent of interactivity has even, in some ways,
changed the way in which facts or stories are conveyed to the public (Weber & Rall, 2012).
The flashy graphics and bells and whistles of sliders, buttons, and pop-ups of interactive
infographics certainly have their appeal. The New York Times devoted an entire office to data
visualization and won several awards for their cutting-edge data journalism (Weber & Rall,
2012). As Rafaelli said, “Interactivity is a widely used term with an intuitive appeal, but it is an
under-defined concept” (1986). Many studies have attempted to classify interactivity in different
ways, because as technology changed, so too did the extent of interactivity. For the purposes of
this study, interactivity was theoretically defined by Steur (1992).
There are three main types of interactivity present in contemporary data visualizations.
These include explorative, which allows users to explore the data by themselves through
manipulation via filtering, selecting, and searching the data; non-linear, which allows users the
possibility of choosing their own navigation path within a given frame of data or facts through
the navigation tools of timelines, sliders, and navigation menus; and linear, which enables the
user to move between information sequences (forwards and backwards) through a predefined
16
narrative frame (Weber & Rall, 2012). Most online visualizations make use of a combination of
multiple interactivity types (Weber & Rall, 2012). If the different modes are combined
successfully, the entire message benefits as, “the information graphic becomes a new emergent
whole—greater than the sum of its parts” (Weber & Rall, 2012).
Increased technology has in turn led to a rise in hybridization in the realm of interactive
data journalism. In this case, hybridization is not a mere static process but an ongoing evolution
that intertwines many disparate elements in a dynamic way. Contemporary messages include
elements of journalism and writing, of course, but also static graphic design, information design,
motion graphics, animation, VFX, digital filmmaking, and computer science (Weber & Rall,
2012). A message this complex requires a new kind of journalistic team. As such, the relatively
new field of “graphics editor,” which combines data-driven journalism with the requirements of
graphic design, animation, digital filmmaking, computer science, and more, emerged. Increased
hybridization has also made imperative the cooperation and communication between classic
journalists and computer scientists in the co-creation of these graphics (Cheng, 2015).
Additionally, it has spurred new courses of study in communication (Weber & Rall, 2012). It is
important to note that although the hybridization and combination of multiple different forms of
media to tell a single story can create a more emotional or effective message, the reverse is also
true. All these different forms of communication must be skillfully woven to describe a single,
coherent message. Weber & Rall warned, “if the message of an information graphic is not clearly
defined, the graphic remains a smorgasbord of different modes without any coherence” (2012).
Therefore, it is incumbent upon the creators of interactive infographics to consider the target
audience’s ability to understand and use these hybrid forms of interactivity.

17
Weber & Rall posited that contemporary visualizations can be classified into the
categories of low, medium, and high interactivity by the methods through which users interact
with the information (2012). Low interactivity messages require users to click objects such as
buttons, people, or images and are explored in a linear method. Medium interactivity messages
exhibit a hierarchical, hyperlinked structure. Finally, high interactivity levels are exhibited by the
user’s ability to influence content or choose his own navigation path. It should be noted that
under Liu and Shrum’s dual-process model of interactivity, not all users present the same ability
to use these increasingly complex methods of interactivity (2009).
A balance between interactivity and ability must be created in order to construct the
message that will most positively affect elaboration and attitudes. Interactivity is useful in that it
increases motivation in low-involvement individuals, but it also must be kept in mind that, for
high-involvement individuals, interactivity requires more cognitive resources and can detract
from relevant information or form frustration, making an interactive website appear worse than a
less-interactive website (Liu & Shrum, 2009). The final effect of interactivity is determined by
the balance between the cognitive resources available to participate and understand versus the
cognitive cost of interactivity (Liu & Shrum, 2009). This means that higher levels of interactivity
increase the attitudes of new audiences, but do not always function as intended for motivated
information seekers (Wojdynski, 2015). Furthermore, at high levels, consumers exhibit little
discrimination between levels of interactivity (Wojdynski, 2015). In fact, the perceptual effects
of high interactivity were statistically indistinguishable from those of low or no interactivity
(Sundar, Kalyanaraman, & Brown, 2003). As high interactivity presents the possibility of
alienating high involvement consumers or frustrating those with low ability to use or understand
the interactive elements, low or medium levels of interactivity are preferred. A study of the

18
effects of interactivity on consumer preference of politicians found that, “Moderate interactivity
seemed to enhance the candidate’s appeal as well as his character, but high interactivity seemed
to detract from it. Similarly, the level of voter agreement with the candidate’s position on policy
issues was enhanced with moderate interactivity but not with high interactivity” (Sundar,
Kalyanaraman, & Brown, 2003). Of particular interest to the creator of these online messages,
then, is the consumer’s perceived level of interactivity. In fact, a 2015 study found that
interactivity led to more positive attitudes “only to the extent that users perceived the site as
more interactive, suggesting that attempts by content producers to increase such perceptions may
be worth the investment” (Wojdynski). Liu’s perceived interactivity scale proved a useful tool
for measuring consumer perceptions of interactivity levels. This scale was designed to be used in
academic research to understand the effect of perceived interactivity on a consumer’s response to
online communication (Liu, 2003).
In sum, interactivity could prove a useful tool in agricultural communication because
studies suggest interactive graphics in news content can generate favorable attitudes toward the
stimulus, which may, in turn, have a positive effect on the perception of both the message
content and the news organization. Interactivity is also particularly adept at engaging new
audiences that were before the least likely to exhibit interest in the message (Wojdynski, 2015).
However, increased interactivity also has the potential to alienate the high-involvement core
audience when their level ability to use these interactive features is not considered in the creation
of the message.
Elaboration Likelihood Model and the Dual-Process Model of Interactivity Effects
The effectiveness of an interactive message can be measured by the extent of a user’s
attitudes toward and elaboration on its themes. The ELM posited that elaboration is “a

19
continuum of no thought concerning issue-relevant information presented to complete critical
thought of every argument and integration of these elaborations into the person’s attitude
schema” (Petty & Cacioppo, 1986). That is, a more effective or persuasive message engages the
user in more issue-relevant thinking and behavior. The ELM serves to simplify the route of
elaboration into two distinct routes, the central or peripheral, moderated by a limited number of
variables including persuasiveness of an argument, presence of peripheral cues, or argument
scrutiny, among others. By organizing and simplifying the elaboration process, the ELM
provided a framework to evaluate message effectiveness (Petty & Cacioppo, 1986).
Dual-process models have long been a focus of cognitive psychology. Although there has
been much research throughout the years seeking to understand the process to persuasion, most
studies have focused on two distinct routes of attitude change and the factors that affect these
routes (Petty & Cacioppo, 1986). In dual-process models of thought, ability and involvement are
both moderating factors. When presence of ability and involvement create a high likelihood of
elaboration, the central route of persuasion occurs (Petty & Cacioppo, 1986). In this central
processing route, the expenditure of cognitive resources is required in addition to the
aforementioned motivations. In absence of these motivations, the likelihood of elaboration is
low, and the peripheral route occurs as it requires minimal cognitive resources (Sundar,
Kalyanaraman, & Brown, 2003; Petty & Cacioppo, 1986). Elaboration through the central route
is preferred as attitude changes created through the expenditure of cognitive resources are more
persistent, resistant, and predictive of behavior change than those affected via the peripheral
route (Petty & Cacioppo, 1986).
This central route spurs careful consideration and integration of relevant information to
create attitude and position changes within the consumer (Petty & Cacioppo, 1986). The central

20
route is characterized by careful consideration of justification of behavior against attitudes;
increased comprehension, learning, and retention; the nature of cognitive responses; and how a
user combines beliefs into an overall evaluative reaction (Petty & Cacioppo, 1986). Not only are
these arguments more carefully evaluated in the central route, they are also “accessed, rehearsed,
and manipulated more times, strengthening the interconnections among the components and
rendering the schema more internally consistent, accessible, enduring, and resistant than under
the peripheral route” (Petty & Cacioppo, 1986). The cognitive cost of these attitude changes was
therefore much higher than those of the peripheral route which results in attitude shifts that are
more predictive of future behavior (Petty & Cacioppo, 1986).
In contrast, the peripheral route of persuasion occurs when the likelihood of elaboration is
low. The peripheral route is the method of persuasion of low-involvement individuals who have
little motivation to consider arguments carefully and therefore often rely on external cues to
determine their attitude towards the message. These cues can include source attractiveness,
number of sources, presentation of message and more (Petty & Cacioppo, 1986). The overall
attitude shift of the peripheral route is a simple inference based on the consumer’s opinion of
these cues rather than careful scrutiny of the argument (Petty & Cacioppo, 1986). The peripheral
route may still prove useful in changing consumer attitudes towards a message, but these shifts
are more ephemeral and less predictive of future behavior than those occurring in the central
route (Petty & Cacioppo, 1986) (Figure 1).
In sum, persuasion occurring via the central route results in greater recall and
accessibility of attitude-relevant information (Petty & Cacioppo, 1986). Therefore, central route
persuasion yields consumers that are more consistent in their attitude shift over time, better able
to defend their position, and more likely to act on their beliefs (Petty & Cacioppo, 1986).

21
Peripheral route persuasion is the result of simple inferences spurred by cues and, while less
predictive of behavior, can also result in attitude shift (Petty & Cacioppo, 1986). The ELM
serves as a useful tool for the evaluation of interactive messages because it shows that
interactivity can be an argument, peripheral cue, or factor that affects extent of elaboration
depending on the level of a reader’s motivation and ability to process information.
The ELM was adapted to form the dual-process model of interactivity by Liu and Shrum
in 2009. This model focused on involvement and ability as the main moderating factors of
attitude change when consuming an interactive message. Through this framework, the mere
presence of interactivity served as a peripheral cue that led to positive attitude changes regardless
of user ability. Under high-involvement conditions, interactivity spurred positive attitudes for
high-ability users, but led to more negative attitudes for inexperienced internet users (Liu &
Shrum, 2009). This result may be due to the fact that high-involvement users are already
motivated to give careful consideration to the message through the central route. Interactivity can
increase the cognitive cost of understanding the message for low-ability users. Therefore, this
group of users is more likely to consider the bells and whistles of interactivity as distraction or
unnecessary complication of the information they are seeking. This can lead to frustration and
decreased attitudes towards the message as a whole, regardless of the argument presented (Liu &
Shrum, 2009).
Figures 1 and 2 were presented one after another in an effort to better illustrate the
relationship between the Elaboration Likelihood Model (Petty & Cacioppo, 1986) and the dual-
process model of interactivity (Liu & Shrum, 2009). The corresponding pairs of
motivation/involvement and ability/internet ability were highlighted in yellow. Below each
yellow block is a reference to the corresponding measure of the other scale as well as a short

22
description of some of the considerations of the moderator written within the block. For example,
in Figure 1’s illustration of ELM, the “motivation to process” block corresponded with the dual-
process model of interactivity’s “involvement” block and took into consideration a message’s
relevance, the viewer’s need for cognition, personality responsibility, and more. Figure 1’s
“ability to process” block corresponded with Figure 2’s “internet ability” block and took into
consideration viewer distraction, message repetition, viewer prior knowledge, and message
comprehensibility.

23
Figure 1. Elaboration Likelihood Model (Petty & Cacioppo, 1986). This figure shows the basis
for the Liu and Shrum’s (2009) adapted dual-process model of interactivity effects.

24
Figure 2. Dual-Process Model of Interactivity Effects (Liu & Shrum, 2009). This figure shows
the dual-process model for interactivity’s adaptation from the Elaboration Likelihood Model
(Petty & Cacioppo, 1986).
The dual-process model of interactivity confirmed Wojdynski’s assertion that
interactivity can be a useful tool for increasing the attitudes of new audiences (2015). Liu and
Shrum’s 2009 study found “large numbers of interactive features present in high-interactivity
websites may persuade low-involvement users, whether those features will prove relevant or
beneficial to them or not.” Interactivity increased the consumer’s affective involvement with a
website which resulted in a more enjoyable browsing experience. These attitude changes can
extend to create positive attitudes not only towards the website but also the brand or news service
(Liu & Shrum, 2009).
However, interactivity can prove a double-edged sword. Interactive message creators
should pay special attention to their audience’s ability so as not to alienate their high-

25
involvement users with what they view as difficult to use interactive features. The ability of
interactivity to simultaneously evoke positive brand attitudes for some and negative attitudes for
others was confirmed in a 2003 study that found consumers with little political interest found a
candidate with a medium or high-interactivity website to be significantly more caring and
sensitive than those who viewed a low-interactivity website (Sundar, Kalyanaraman, & Brown).
However, for politically savvy consumers, this effect was reversed with those viewing the high-
interactivity site exhibiting negative attitudes towards the fictitious candidate. Savvy consumers
viewing the medium-interactivity site still reported improved attitudes, however (Sundar,
Kalyanaraman, & Brown, 2003). This follows the dual-process model of interactivity and also
exhibits the moderating factor of involvement.
“In sum, the central tenet of the proposed model is that interactivity can affect the
effectiveness of persuasion through distinct processes, either by serving as a peripheral
cue through its mere presence in a Web site or by directly interacting with central
processing (through the facilitating and/or inhibiting effects and through interactivity
serving as a central argument itself)” (Liu & Shrum, 2009).
Involvement
Because both involvement and ability are the most important variables of elaboration and
attitude change when it comes to interactivity, they bear further investigation for the purposes of
this study. There are intrinsic social, psychological, and functional risks for a high-involvement
consumer to either be ill-informed or lack sufficient information (Dholakia, 2001). Therefore it
follows that information seeking and dissemination are also indicative of high-involvement, as
consumers strive to be well-informed on matters that affect their personal and professional well-
being (Dholakia, 2001). The ELM contends that as an issue or product increases in personal

26
relevance or consequences, it becomes more important and adaptive to forming an informed
opinion. Thus, people are more motivated to devote the cognitive effort required to evaluate the
true merits of an issue or product when involvement is high rather than low (Petty, Cacioppo, &
Schumann, 1983). The moderating effect of involvement has been confirmed by a number of
studies that find that high-involvement consumers are more likely to engage with and scrutinize
the arguments of a relevant message (Sundar, Kalyanaraman, & Brown, 2003; Liu & Shrum,
2009; Petty, Cacioppo, & Schumann, 1983; Wodjynski, 2015; Wright, 1974). High-involvement
consumers also exhibit increased recall and recognition of relevant information in addition to
increased attitudes and changed behavior (Petty & Cacioppo, 1986).
From an interactive infographic perspective, involvement also determined whether a
consumer was motivated to use the interactive elements or whether they functioned as a positive
peripheral cue (Liu & Shrum, 2009). High involvement users were motivated to critically
examine the message and therefore used the interactive elements. Low involvement users noticed
the interactive elements but were not motivated to use them to explore the data. The presence of
these interactive elements, however, did function as a positive peripheral cue to these low-
involvement users.
This study measured consumer involvement by using the Personal Involvement Inventory
(PII) (Zaichkowsky, 1994). The PII is a context-free, 10-item, dichotomous pair, 7-point Likert
scale created to measure the motivational state of involvement by investigating the three factors
affecting involvement: characteristics of the consumer, situation, and stimulus (Zaichkowsky,
1994). The PII is a simple measure proven to be successful in discriminating a consumer’s
reactions to a particular message in relation to the message presentation and the consumer’s own
characteristics (Zaichkowsky, 1994). Advertisements with the same message presented in
27
different ways have received different scores, exhibiting the inventory’s usefulness in the
investigation of consumer preference when it comes to message presentation. Aside from its
success in measuring advertising effectiveness, this inventory was created as a theoretical tool
for academic research to measure and account for individual variation in the level of involvement
of a consumer.
Ability
The second moderating factor for elaboration and attitude change formed via interactivity
is user ability. This is the ability for the audience to use and understand the various buttons,
sliders, filtering mechanisms, etc. present in all interactive online infographics. This ability can
therefore be equated with a user’s level of internet competence. Internet competence is the
capacity of an individual to use the internet for the purposes they choose while experiencing the
maximum amount of satisfaction and minimum amount of stress (DiMaggio & Hargittai, 2001).
This competence is a self-perpetuating cycle as those users with high ability routinely gain more
satisfaction from their experience, making them more likely to use the internet again and again,
gaining further skills (DiMaggio & Hargittai, 2001). Ability to use internet is not equal across
the general public, however. There are many groups of people who fall vulnerable to low-ability
due to extenuating conditions (Salemink, Strijker, & Bosworth, 2017). The defining factor of
most of these groups is their rural location (Salemink, Strijker, & Bosworth, 2017). Consider the
ubiquity of remote location in the following list of low-ability populations composed in a 2017
meta-analysis of Internet access: rural children, rural youth, rural women, older people, rural
patients, rural employees, rural entrepreneurs, and farmers (Salemink, Strijker, & Bosworth,).
Unfortunately, this spatial digital divide is growing (Salemink, Strijker, & Bosworth,
2017). Urban areas are digital hot-spots with pre-existing high-speed internet infrastructure and
28
an incentivized market that encounters less barriers than in rural areas. In these rural areas, the
issue is no longer access to the Internet, but rather their impeded ability to innovate, consume,
and interact with the modern-day information society on the same level as their urban
compatriots (Salemink, Strijker, & Bosworth, 2017). The introduction of greater speed and
reliability of next generation access networks and increased mobile and mobile broadband
coverage in urban areas has further exacerbated this divide as, similar to broadband, these
innovations are not present in rural communities due to the increased barriers of little existing
information infrastructure, lack of incentives, increased area, and lower income (Salemink,
Strijker, & Bosworth, 2017). Federal, state, and local governments have taken notice of this
divide and begun to institute policy to minimize these regional disparities. These policies have
progressed from simply focusing on providing a connection for all to providing next generation
access for all (Salemink, Strijker, & Bosworth, 2017). However, due to the fact that rural areas
have missed out on earlier innovations in information infrastructure these policies must now
work at a double pace to not only make sure these areas are no longer falling behind, but also
provide the opportunity for rural areas to keep pace with burgeoning innovations in connectivity
(Salemink, Strijker, & Bosworth, 2017).
In both policy and research, the definition of user ability is no longer confined to simple
access to the internet but must be redefined by an internet user’s skills and success in their online
pursuits. As internet penetration has increased, the quality of use has become the most important
dimension by which to classify user ability (DiMaggio & Hargittai, 2001). Internet access has
been redefined in social and technological terms to progress from “who can find a connection?”
to “what are people doing and able to do when they go online?” (DiMaggio & Hargittai, 2001).

29
“The debate is no longer about ‘haves’ and ‘have nots’; instead, it has started to focus on the
degree of usage and different usage patterns” (Salemink, Strijker, & Bosworth, 2017).
Despite the current increased internet penetration and progressive policy, there are still
several barriers to increasing the ability of rural inhabitants. These include a lack of financial
resources, unemployment, lower education levels, and conservative attitudes (Salemink, Strijker,
& Bosworth, 2017). Importantly, the high-involvement audience of this particular study are
agriculturalists which are, of course, majority rural, with 99% of the nation’s 2.1 million farms
owned and operated by rural families (American Farm Bureau, 2017). “Rural Americans are
more than twice as likely as those who live in urban or suburban settings to never use the
internet” (Anderson, Perrin, & Jiang, 2018). With their rural location and aging population in
mind, it could be inferred that agriculturalists likely exhibit lower ability scores than the
population average.
The first barrier that inhibits rural ability is income (Salemink, Strijker, & Bosworth,
2017). Although the United States Department of Agriculture said that, “Farm households in
general are neither low-income nor low-wealth,” stating that the median operator household
income of farmers ($76,700) is “practically the same” as the median for households with a self-
employed head ($78,400), it is important to consider the vast income stratification of participants
in the agriculture industry (2016). The National Agricultural Statistic Services lists only three
agricultural professional categories out of eight that make over $37,000 each year on average.
The next highest average salary is $28, 940 with the “farmworkers and laborers: crop, nursery,
and greenhouse” and “graders and sorters” categories just barely earning over $20,000 each year.
These farmworkers also experience above average unemployment rates, 13.5% in 2012 as
compared to the 8.1% national average in the same year (cite).

30
High-involvement agriculturalists also suffer from the ability barrier of low education.
There is a split between laborers and supervisors versus the farm managers. 25% of managers
have some college education with 6% having less than a 9th grade education. 20% of farm
laborers have had some college education and nearly a third, 31%, have less than a 9th grade
education. Despite the stark contrast of these two groups, they are both indicative of far lower
education levels than the United States average of 64% of people earning some college education
and 3% having less than a 9th grade education. The 2017 meta-analysis also found that
conservative values could present a barrier to internet ability (Salemink, Strijker, & Bosworth).
Rural areas are more likely vote conservative with 67.1% of rural voters classifying themselves
as Republican in “red” states and 56.5% in “blue” states during the 2000-2004 election term
(McKee, 2008). This voting behavior indicated rural tendencies towards conservative values and
behaviors (McKee, 2008).
The meta-analysis also listed “older people” as a low-ability group (Salemink, Strijker, &
Bosworth, 2017). According to the United States Department of Agriculture census of 2012,
agriculturalists are a disproportionately aging group. The average age of farmers in the United
States is 58, with Georgia farmers being 65 years-old on average, fitting the common American
definition of senior citizen. “Seniors are the age group most likely to say they never go online.
Although the share of non-internet users ages 65 and older decreased by 7 percentage points
since 2016, about a third today do not use the internet, compared with only 2% of 18- to 29-year-
olds” (Anderson, Perrin, & Jiang, 2018). This means the core group of high-involvement users
are likely low-ability because not only are the majority of agriculturalists rural with all the
accompanying barriers of low education, low income, and low-incentive markets, they are also
aging.

31
The digital divide has come to encompass much more than simple access (Salemink,
Strijker, & Bosworth, 2017). DiMaggio and Hargittai recognized three dimensions of inequality:
technical, autonomy, and skill (2001). Those who suffer from technical inequality have slow
connections, older software and hardware, and decreased bandwidth (DiMaggio & Hargittai,
2001). These are all common issues in rural areas (Salemink, Strijker, & Bosworth, 2017). Those
who exhibit technical inequality are likely to find their online experiences less gratifying and are
therefore less likely to use the internet often and gain further “skills that enable users to derive
the full benefits that access can provide” (DiMaggio & Hargittai, 2001). The second dimension
of inequality focuses on the autonomy of internet use, that is how much control a user exercises
over his online experience. An important facet of this dimension is the question of where a user
is accessing the internet. If they are accessing it via a community lab, a common occurrence in
rural areas, users have less autonomy over their online experience (DiMaggio & Hargittai, 2001).
The final dimension is the inequality of skill. Internet-competent people have the “capacity to
respond pragmatically and intuitively to challenges and opportunities in a manner that exploits
the Internet’s potential” (DiMaggio & Hargittai, 2001). This includes the knowledge required to
log on, search, download files, and even troubleshoot inevitable hardware or software issues.
These skills are often learned through using the Internet on a regular basis, which often pairs this
type of inequality with either or both of the former (DiMaggio & Hargittai, 2001). Because rural,
older populations are less likely to be on the internet they therefore are also less likely to possess
the internet competency they need to receive satisfaction from their online experience (DiMaggio
& Hargittai, 2001). An additional dimension that affects user ability is the level of social support
a user receives. This social support can be comprised of formal technical assistance from people
employed to provide it, like the Geek Squad, for instance, assistance from friends and family,

32
and emotional reinforcement from friends and family. The presence of a group that not only
socially encourages internet use but may also offer assistance for those lacking in skill or access
influences a user’s ability level (DiMaggio & Hargittai, 2001).
As aforementioned, the digital divide has now been redefined to account for variation in
internet usage. Public policy is encouraging uses that extend past entertainment, and instead
focusing on fostering economic development through online entrepreneurial programs and
increasing access to public health and education (DiMaggio & Hargittai, 2001; Salemink,
Strijker, & Bosworth, 2017). The internet can be used for the enhancement of human and social
capital and foster political participation, and use past pure consumption is a strong predictor of
positive life outcomes (DiMaggio & Hargittai, 2001). Unfortunately, not every person has the
access and ability to take advantage of these opportunities. “Developments so far indicate that
telecommunication companies will not provide every rural household or business with a high-
speed Internet connection comparable to those in urban areas. Rural areas are served last, if they
are served at all” (Salemink, Strijker, & Bosworth, 2017).
Hypotheses
Based on a review of past studies concerning elaboration, ability, and involvement, this
study put forth four hypotheses:
H1: Users will perceive the interactive infographic as more interactive than the static.
H2: Interactive message elements will produce an overall positive effect on user elaboration.
H3: The high involvement group of agriculturalists will be disproportionately low ability.
H4: Three of the four respondent groupings: adept, high involvement respondents and
respondents in both low involvement categories, will elaborate more with the interactive
message when compared with the static message. The fourth, the high-involvement, novice

33
group, will exhibit decreased elaboration when viewing the interactive infographic compared to
the static infographic.
Previous research supported these hypotheses. The aim of this study was to add to this
pre-existing understanding of interactive communication strategies by presenting a relevant
agricultural message to a general populace, in this case a message about blueberry and peach
production in Georgia during the year 2017 to Georgia residents. This closely replicated the
manner in which citizens are exposed to journalism in their daily lives. This study thereby aimed
to use these hypotheses to explore the feasibility of interactive infographics as a method of
agricultural communication with the goal of increased elaboration.

34
METHODOLOGY
Stimulus Design
Respondents were divided randomly between interactive and static message stimuli. Both
messages explained the economic impact of poor blueberry and peach production in the state of
Georgia in 2017. Both versions of the messages were made as similar as possible to avoid
incidental confounds. That is, the two conditions were identical in content and differed only in
their levels of interactivity. This includes information including introductory text and charts as
well as message presentation elements. Each message had three data visualizations: a map and
two charts. The map included color-coded locations of peach and blueberry farms in the state of
Georgia. Farm location data was provided by the Georgia Department of Agriculture. These
locations were overlaid on maps made from the National Oceanic and Atmospheric
Administration’s temperature data for Georgia regions during the months of January through
June 2017. The next data visualization was a scatterplot of Georgia’s peach and blueberry yield
compared against the price received per pound from 2008-2016. This map showed a fairly linear
progression of peach prices as compared to a higher but unpredictable and widely variable price
per pound of blueberries. The final data visualization illustrated the quality of peach and
blueberry yields for the months of April and May from 2015-2017. The quality was measured by
the percent of the total month’s yield graded as either excellent, good, fair, poor, or very poor.
This visualization illustrated the extremely poor quality of fruit during 2017 in comparison to the
past two years.

35
Where the data visualization components were identical in both stimuli, so too were the
message presentation elements of fonts, and images. Both messages used the same four images
of frost-damaged blueberries and blooms and peach trees in the snow found on the Georgia
Department of Agriculture’s website (See Appendices A and B to compare the two stimuli).
The control group was shown the static stimulus: an infographic published in the Georgia
Department of Agriculture’s newspaper publication, The Farmers and Consumers Market
Bulletin, in May of 2017 (See Appendix A to view the static stimulus). This data visualization
appeared as an embedded .png image within the Qualtrics survey, therefore respondents were not
required to navigate away from the survey to view the static stimulus.
In their 2012 meta-analysis of interactive infographics, Weber and Rall found that many
interactive infographics are the result of increased hybridization of three different types of
interactivity. This hybridization allowed users to explore the data or story in a way unique to
their sensibilities and was followed in the creation of the interactive stimulus used in this study.
Treatment groups were shown an interactive version of the message that featured all three types
of interactivity: explorative, non-linear, and linear (Weber & Rall, 2012) (See Appendix B for
more information about the specific uses of interactive tools within the interactive stimulus).
Linear interactivity most commonly functions as a guided tour of the data visualization or story,
allowing viewers to move backwards and forwards, progressing through a message step by step
(Weber & Rall, 2012). Common navigation tools for linear interactivity include progress bars,
start buttons, and forward and back buttons (Weber & Rall, 2012). This study’s interactive
message used forward and backward buttons to establish linear interactivity (Appendix B).
Explorative interactivity is based on data visualization, and is non-linear in character (Weber &
Rall, 2012). This means users must explore data by themselves and are able manipulate the

36
graphic by filtering, selecting, and searching the data (Weber & Rall, 2012). This study’s
interactive message established explorative interactivity through the use of a dropdown menu in
the chart exploring peach and blueberry quality (Appendix B). The third type of interactivity,
non-linear, offers users the possibility of choosing their own navigation path within a given
frame of data or fact. However, non-linear interactivity differs from explorative in that users may
not manipulate the graphic or generate a new setting of data (Weber & Rall, 2012). The most
common navigation tools for non-linear interactivity include timelines, sliders, or navigation
menus (Weber & Rall, 2012). This study’s interactive stimulus established non-linear
interactivity through the use of a timeline slider on the map data visualization that allowed
respondents to toggle through the temperature data of the months of January through June of
2017 (Appendix B).
This study’s interactive stimulus was created to follow recommendations of effective
interactivity use. Studies indicated low to moderately interactive messages provided the best
chance for elaboration in groups moderated by involvement and ability (Liu & Shrum, 2009;
Sundar, Kalyanaraman, & Brown, 2003; Weber & Rall, 2012). This study’s interactive stimulus
followed guidelines to establish low and moderate interactivity from two different studies
(Sundar, Kalyanaraman, & Brown, 2003; Weber & Rall, 2012).
The linear interactivity type was preferred to create low interactivity conditions (Weber
& Rall, 2012). Most interactive infographic authors and readers “prefer traditional ‘step-by-step
navigation’ because linear storytelling ensures clear user guidance. In the experts’ opinions,
users can perceive all aspects of the story and therefore catch the message easily; they are not
overwhelmed by information or even lost in the data” (Weber & Rall, 2012). Although each type
of interactivity was present in this study’s interactive stimulus to replicate the common
37
hybridization found within the communication strategy, the predominant type of interactivity
was linear, controlled by the navigation bar and forward and back arrows. This followed Weber
and Rall’s (2012) recommendations for low interactivity conditions as it allowed users to only
view and interact with one figure at a time.
Moderate interactivity was established through the use of hyperlinks (Sundar,
Kalyanaraman, & Brown, 2003). A hyperlink to the Georgia Department of Agriculture’s press
release on the 2017 freeze damage to peaches and blueberries (Appendix C) was used to
establish moderate interactivity conditions as hyperlinks were a common type of interactivity
that create a hierarchical linear flow of information (Sundar, Kalyanaraman, & Brown, 2003).
Research Design
The purpose of this study was to better understand elaboration of an interactive
agricultural message. The technique of thought-listing was used to gauge the audience’s attitudes
and elaboration (Cacioppo & Petty, 1981). The message audience was then asked to list their
thoughts on the topic after viewing the message. This technique of writing a list of thoughts is a
useful measure, as it can be administered in a manner that does not restrict dimensions, is easily
administered over web survey, and is perceived as private and nonthreatening (Cacioppo &
Petty, 1981). Importantly, thought listing does not affect reported behavior and is proven to be
non-reactive (Cacioppo & Petty, 1981). It is sensitive to distraction, repetition, social loafing,
and changes in cognitive response when a person’s motivation or ability has been manipulated
(Cacioppo & Petty, 1981). Furthermore, the thought-listing technique allows for the self-
generation of arguments, which has been found to be a direct result of high-cognitive cost
activities (Cacioppo & Petty, 1981). Realizing the number of thoughts elicited by each subject
will vary, Cacioppo and Petty (1981) suggested controlling for this variable by calculating a ratio

38
score where (favorable thought- unfavorable thought)/(favorable thought + unfavorable thought),
which was observed in this study. The thought listing measure was reliable both internally
through split-half testing and on retesting (Cacioppo & Petty, 1981). Because the measure is
reliable, valid, and non-reactive, it has been shown to tap into a consumer’s thoughts that
moderate their affective and behavioral responses (Cacioppo & Petty, 1981).
Following the thought-listing exercise was the elaboration validation model created by
Reynolds (1997). Reynolds created this measure in order to improve upon past inconsistencies
when it came to measuring elaboration (1997). The measure was included in the current study to
lend validation to the more complicated process of scoring open-ended responses. The measure
has proven to be reliable, with over several studies. Confirmatory factor analytic procedures
support the structure of the scale (Reynolds, 1997).
The third measure used in this study is Zaichkowsky’s Personal Involvement Inventory
(PII) (1994). The PII was used in this study to help segment consumers into high and low-
involvement groups used for comparison through the dual-process model of interactivity
(Zaichkowsky, 1994). The PII was selected for this study as it is successful not only in
discriminating different subject’s reactions to the same message, but also in discriminating
between advertisements by way of measuring subject responses. This proves useful in a study of
this nature where the variable of interest is the moderating factor of ability which will vary from
respondent to respondent, and the treatment is the mode in which the message is delivered.
While the PII can successfully discriminate different subject’s responses to the same ad, it can
also discriminate between responses to two different ads with the same message, similar to the
treatment and control messages of this study (Zaichkowsky, 1994).

39
Furthermore, the PII is not biased between affectational or informational messages like
the one presented in this study (Zaichkowsky, 1994). This means that the PII proved an effective
tool for evaluating message response on both an emotional and cognitive level. The internal scale
reliability of PII was over .9 with Cronbach’s alpha ranging from .91-.95 in one study and .94-
.96 in another (Zaichkowsky, 1994). Validity has been studied in a number of ways. Validity was
first was proven by expert, independent reviewers who rated subjects’ open-ended responses as
to why they responded the way they did to the scale. These reviewers were kept blind to the
message and asked to read the response and categorize the subject as low, medium, or high levels
of involvement. Data indicated a significant (p < .01) relationship between the PII scale scores
and the judges’ perceptions of the open-ended responses (Zaichkowsky, 1994). Further validity
was proven in that a subject’s selections on the PII exhibited discrimination between messages
selected for airing and those rejected (Zaichkowsky, 1994).
The fourth measure this study used was Liu’s Perceived Interactivity Scale (2003). This
scale was a stable measure of interactivity for both low and high-ability users and, therefore, not
only functions as a tool of measuring perceptions but also as a manipulation check (Liu, 2003).
Liu posited, “Results from the studies showed that interactivity comprises three correlated but
distinct dimensions: active control, two-way communication, and synchronicity” (Liu, 2003).
These categories have been proven to be reliable with a Cronbach’s alpha above .7 with an
average Cronbach’s alpha of .75 for active control, .86 for two-way communication, and .86 for
synchronicity (Liu, 2003). The reliability of the Perceived Interactivity Scale was further
corroborated through structural equation modeling and extracting average variances. Reliability
calculated through structural equation modeling was .81 for active control, .90 for two-way
communication, and .89 for synchronicity (Liu, 2003).

40
The scale also demonstrated discriminant, known group, and content validity.
Discriminant validity is proven in that all three average variances extracted were larger than the
squared pairwise correlations for all three studies, meaning that each measure of active control,
two-way communication, and synchronicity were independent measures (Liu, 2003).
Furthermore, in the chi-square statistics comparison among the different models, each
constrained model resulted in a significantly improved chi-square from the less constrained
models, again suggesting discriminant validity (Liu, 2003). Validity was further confirmed by
testing correlations between each pair of factors using a 95% confidence interval. In this study,
“the confidence intervals were (.09, .37) for active control-two-way communication correlation,
(.41, .63) for active control- synchronicity correlation, and (.19, .42) for two-way
communication-synchronicity correlation” (Liu, 2003). Known group validity was suggested as
the website intentionally designed to be more interactive scored higher on the perceived
interactivity scale and vice versa (Liu, 2003). Content validity was demonstrated as independent
reviewers showed a significant (p < .01) correlation for all three factors including .40 for active
control, .43 for two-way communication, and .54 for synchronicity (Liu, 2003).
Population
Because the current study sought to investigate the moderating effect of interactivity on
agricultural communications to the general public, a broad population was selected. The
experimental messages presented in this study were based on blueberry and peach production in
Georgia. In order to ensure that all respondents had the same base level of involvement due to
location, the sample was comprised of Georgia residents. Furthermore, the selection of Georgia
residents as a sample best replicated the manner in which stories like this are likely to be
communicated to the public outside experimental conditions. For instance, the static graphic
41
shown to the control group was printed in The Georgia Farmers and Consumers Market
Bulletin, a statewide newspaper published by the Georgia Department of Agriculture, with over
42,000 subscribers at the time of publication. The sample selected sought to replicate the state of
Georgia’s general population. It comprised 460 respondents over the age of 18, divided evenly
between the treatment and control with 230 in each group. In order to match the U.S. Census
Bureau’s population estimates for July 1, 2017 this sample was 50% male and 50% female with
a racial profile of 55.9% Non-Hispanic white, 30.6% black, 6% Hispanic, 3.2% Asian, and 4.3%
other. All respondents were recruited through Qualtrics via crowdsourcing techniques and
received remuneration as outlined in Qualtrics’ terms.
The online survey presented to respondents was created by adhering to the techniques of
thought-listing, perceived interactivity, and the personal involvement inventory in combination
with questions concerning ability, recall, and demographic information. The survey was
administered to a total of 464 different respondents in which the treatment and control messages
were assigned randomly. 269 respondents viewed the static control message stimulus and 195
viewed the experimental interactive.
Survey Administration
Due to a technical issue with the method in which respondents viewed the interactive
message, a small adjustment to the survey was made after 353 respondents completed the survey.
Of these first 353 respondents, 153 of these were randomly assigned the interactive experimental
condition. These 153 respondents were all asked to navigate away from the survey in order to
view the message on a blank browser tab. However, due to an increased dropout rate of
respondents after being asked to navigate away and return to the survey, the method of viewing
was modified so that respondents using a desktop would view a version of the interactive

42
message embedded within the survey in much the same way the static graphic visualization used
for the static experimental condition was embedded in the survey. Respondents taking the survey
with their mobile phone were still asked to navigate away from the survey with the exact same
question as the prior version of the survey, as the embed code for the interactive message did not
prove mobile-friendly when inserted into the Qualtrics survey software. In order to assure this
modification did not affect the validity of responses, a Mann-Whitney U test was conducted
between the first group of 147 responses to the interactive experimental condition recorded prior
to the survey edit and the following group of 48 responses to the same condition that may not
have been required to navigate away from the survey in order to view the message based on their
device. The two groups exhibited no significant difference in elaboration (Mann-Whitney U =
3317, n1 = 147, n2 = 48, p = .668). After viewing the message, respondents were given
instructions and proceeded to the thought-listing portion of the survey.
In this study, the thought-listing technique was carried out in the manner recommended
by Cacioppo and Petty including topic instruction, time limits, and post-message survey as
opposed to pre and post (1981). During the topic instruction portion, participants were asked to
list all thoughts that occurred to them while viewing the message in order to avoid the dubious
assumption that participants are able to discriminate the cognitive effect of the message. This
topic instruction produces experimental demand for subject to report relevant responses and
compels them to show their “open mindedness” and “intelligence” by generating thoughts on
both sides of the issue (Cacioppo & Petty, 1981). A time limit of five minutes was instituted to
increase the chance that responses were easily accessible and directly evinced by the message.
Participants were asked to list their thoughts directly after viewing the message to best replicate
the affective and cognitive responses present in normal conditions (Cacioppo & Petty, 1981).

43
While measuring after the message has occasionally led to some loss of retention of cognitions,
this is the preferred method as it least distorts naturally elicited responses (Cacioppo & Petty,
1981). Participants were presented with a total of 18 blanks to fill within the allotted five
minutes, though respondents were instructed that they were neither required nor expected to fill
all the blanks.
Reynold’s elaboration validation measure followed the thought listing procedure in the
survey. Respondents were asked to indicate on a seven-point Likert scale their level of
agreement with 12 phrases created to gauge the cognitive effort they expended while viewing the
stimulus. These 12 phrases consist of “six phrases descriptive of cognitive effort and six phrases
descriptive of a lack of cognitive effort” (Reynolds, 1997). The twelve phrases were placed in a
random order, consistent with Reynold’s research (1997).
The next portion of the survey gathered respondent’s perceptions of message interactivity
using Liu’s Perceived Interactivity Scale (2003). This is a seven-point Likert scale with 15 total
statements. Respondents were asked to indicate their level of agreement with the statements
divided among three categories so that active control contains four statements, two-way
communication contains six, and synchronicity contains five.
After recording the respondent’s perceptions of interactivity, the survey proceeded to four
simple recall questions. These questions were multiple choice with three options. One question
was asked based off each of the three charts presented and one question was based on the title of
the overall message. These questions were written to be easily answered by any respondent who
paid close attention to the message. These questions served not only as a test of recall for the
control and experiment, but also a manipulation check for the attention the respondent paid to the
message.

44
Next, respondents answered questions pertaining to their internet ability. First, they
answered an open-ended question about the hours they spend online each week. This is a
common way to define a respondent’s internet ability (Liu & Shrum, 2009; Liu, 2003). However,
to paint a more complete picture of a user’s ability, respondents were also asked by a multiple-
choice question for what purposes they used the internet in the past week and what kind of
connection they used (DiMaggio & Hargittai, 2001). Finally, respondents were asked to indicate
the level to which they agreed with a block of four seven-point Likert scale statements pertaining
to their online autonomy, skill, speed, and social network (DiMaggio & Hargittai, 2001).
Respondents then proceeded to fill out Zaichkowsky’s Personal Involvement Inventory.
This scale consists of 10 dichotomous word pairs measured on a seven-point Likert scale.
Finally, respondents were asked for demographic information including their age, household
income, education, and whether they considered themselves rural or urban and conservative or
liberal.
Data Analysis
After receiving responses, the data were coded in a number of different ways including
coding thoughts and creating a summed score for perceived interactivity, involvement, and
ability. In the thought listing method, “independent judges have demonstrated a high degree of
agreement in their classification of responses along the polarity dimension” (Cacioppo & Petty,
1981). Open-ended responses were polarity coded by two independent judges. Polarity was
judged to be negative if statements involving the referent that mention specific undesirable
attributes or negative associations, challenges to the validity of the stimulus or situation and
statements of negative effect (Cacioppo & Petty, 1981). Positive polarity is evident in statements
in favor of the referent (advocation or self) that mention specific desirable attributes or positive

45
associations, statements that support validity or value of situation/stimulus and statements of
positive effect about the referent (Cacioppo & Petty, 1981). Thoughts were coded as neutral or
irrelevant when they expressed no effect with regards to the referent (Cacioppo & Petty, 1981).
No weighting mechanism was used as a measure of how strongly assertions were made as this
has shown to have a null effect, neither altering nor strengthening the effect (Cacioppo & Petty,
1981). Judges were hypothesis-blind graduate students familiar with scoring categories. These
judges were trained and then tested for agreeance of 5% of the responses (n = 23). The
Krippendorff’s alpha test was used to estimate the inter-judge reliability (Krippendorff, 2011).
Judges showed high reliability, with a=.8261.
Limitations
It is acknowledged there are limitations of this study that are a direct result of the
frameworks used. All of these frameworks including the ELM, personal involvement inventory,
perceived interactivity scale, and ability scores exist on a continuum. Sorting groups based on
these scores simplifies this continuum into two groups which does not acknowledge the variance
between individuals within each group. The researcher acknowledges this is an inherent
limitation in all dual-process models and that both central and peripheral persuasion often work
together to yield the affective and behavioral responses exhibited (Petty & Cacioppo, 1986).
There are also variables that are uncontrollable in this study but are known to affect elaboration
including level of distraction, an individual’s personal need for cognition, and prior knowledge
or opinion (Petty & Cacioppo, 1986). It is further understood that ability, one of the most
important moderating factors of the dual-process model of interactivity exists not only on a
continuum but one that is ever-changing. Access and use of the internet is continually
transformed by multiple factors including choices of corporations, individual users, and

46
government regulations (DiMaggio & Hargittai, 2001). In order to limit this effect stemming
from the rapid change of technology, the researcher attempted to use the most current data
available at the time of this study concerning internet reach and use data. It is acknowledged that
it is unlikely that these ability scores would remain unchanged were this study to be replicated at
a later date. The aforementioned limitations are present due to the nature of the frameworks used
and variables measured.
Sample limitations are also acknowledged by the researcher. By nature of the recruitment
of this Qualtrics panel, it is likely that these respondents are higher ability than the general
population. It is also unlikely that many farmers or other agriculturalists are Qualtrics online
survey respondents, an important note for this study. It is also possible that this type of survey is
excluding almost all of the lowest ability Georgians as it is unlikely that they will be taking
online surveys for credit remuneration. Additionally, it is likely that, despite the fact that 43% (n
= 202) respondents self-reported as living in a rural area, many rural Georgians highly involved
with agriculture are excluded from this sample due to the unavailability of a reliable internet
connection in rural areas (Salemink, Strijker, & Bosworth, 2017).
As is the nature of most internet surveys, respondents to this study were required to self-
report the majority of their responses including their level of involvement with agriculture, how
often they are online, and their reasons for going online, among many other questions. One
limitation of self-reporting is that the researcher may fail to adequately define a term or concept
in a way the respondent understands, resulting in a miscommunication error between what is
being asked and what the respondent perceives as the question. Self-reporting not only requires
respondents to have an accurate understanding of the question, but also assumes respondents are
able to judge themselves and their emotions without bias. This assumption has been proven

47
incorrect as past cognitive research has demonstrated a significant bias when respondents self-
report and is therefore considered a limitation of the current study (Petty & Cacioppo, 1981).

48
FINDINGS
Overview
The original hypotheses of this study were all rejected as the results did not follow the
expected framework put forward by Liu and Shrum (2009). In the 2009 study, Liu and Shrum
measured internet ability as the amount of time a participant spent online each week. This
measure was recreated along with two others in an effort to better understand the moderating
effect of internet ability on elaboration for interactive messages. This study used an alpha level
of significance of .05 for all statistical tests.
Sample
A crowd-sourced sample of 466 respondents, with an even gender split and racial makeup
matching 2017 predicted U.S. census numbers for the state of Georgia, was used to represent the
population of the state in this study. 43% (n = 202) respondents described their location as
“rural,” with the remaining 57% (n = 264) identified as residing in an “urban” location. Of this
sample, 42% (n = 195) were exposed to the interactive experimental condition and 58% (n =
271) to the static condition, through random assignment.
Reliability
The reliability for all scales was over .7 and recognized as an acceptable level for
Cronbach’s alpha (n = 466) (Nunnally, 1978; Santos, 1999). Reliability of the elaboration
validation measure was verified with a Cronbach’s a = .825. This was in comparison with
Reynold’s findings of a = .86 to .94 over several studies (1997). Reliability of the researcher-
created internet autonomy 7-point Likert scale (Table 1) was a = .754. Reliability for

49
Zaichkowsky’s Personal Involvement Inventory was a = .929. This was in line with
Zaichkowsky’s reports of the scale’s overall reliability to be a = .91- .95 in one study and a = .94
- .96 in another (1994).
The perceived interactivity measure proposed by Liu (2003) was measured for reliability
based on the experimental condition. The active control measure did not meet the .7 Cronbach
alpha standard. Implications are discussed in Chapter Five. For the interactive condition,
Cronbach’s alpha was a= .373 for active control, a = .915 for two-way communication, and a =
.75 for synchronicity. For the static condition, Cronbach’s alpha was a = .486 for active control,
a = .925 for two-way communication, and a =.713 for synchronicity. This is in comparison to
Liu’s 2003 reported reliability of the overall scale of a = .75 for active control, a = .86 for two-
way communication, and a = .86 for synchronicity
Inter-coder reliability for the thought-listing measure was acceptable, calculated by the
Krippendorff’s alpha of a = .8261 (Krippendorff, 2011). Attitude scores were calculated by
favorable thought - unfavorable thought)/(favorable thought + unfavorable thought) in order to
avoid weighting attitudes by the number of thoughts as recommended by Cacioppo and Petty
(1981).
After reliability of the survey measures was established, an in-depth statistical analysis
was conducted to explore the relationship between interactivity and elaboration of an interactive
agricultural infographic and to determine the feasibility of interactivity as an agricultural
communication strategy.

50
Analysis
Nonparametric Tests
A Shaprio-Wilk’s test (p > .05) (Shapiro & Wilk, 1965; Razali & Wah, 2011), and an
inspection of the skewness and kurtosis measures and standard errors (Cramer, 1998; Cramer &
Howitt, 2004; Doane & Seward, 2011), and a visual inspection of their histograms, normal Q-Q
plots and box plots showed the sample data were not approximately normally distributed. A non-
parametric Levene’s test was used to verify the equality of variances in the samples
(homogeneity of variance) (p > .05) (Nordstokke & Zumbo, 2010; Nordstokke, Zumbo, Cairns,
& Saklofske, 2011). As such, all statistical tests conducted with the overall thought listing
attitude scores were non-parametric. This inspection of normality and homogeneity of variances
was carried out for all scales listed in these results. This means that although much of the data
from this study exhibited non-normal distributions, the homogeneity of variances in each of these
cases allowed for non-parametric statistical tests to be conducted.
These non-parametric tests account for non-normally distributed data by assessing the
location and range of the lowest group's distribution within the overall sample range and
contrasting this against a theoretical ranked distribution approaching normal. That is, due to the
homogenous variances, nonparametric tests can redistribute data normally through the use of
ranking. The nonparametric tests used in this data analysis included the Kruskal-Wallis test, a
one-way ANOVA analysis of rank; the Mann-Whitney test, considered the nonparametric
equivalent of a t-test; and Spearman’s correlation, a bivariate correlation that is the
nonparametric equivalent to Pearson’s correlation.
51
Elaboration Measure
Thoughts were coded based on attitudes as recommended by Cacioppo and Petty (1981).
Thoughts were coded as positive if they were, “in favor of the referent that mention specific
desirable attributes or positive associations, statements that support validity or value of
situation/stimulus and statements of positive effect” (Cacioppo & Petty, 1981). Examples of
thoughts scored as positive included, “I am from Ga, but didn't realize that the blueberry industry
was as profitable in Ga” and “Blueberries and peaches suffered due to odd weather patterns in
2017.” These thoughts were considered positive as they support the value and validity of the
stimulus message. Thoughts were coded as neutral or irrelevant if they, “express no affect with
regards to the referent,” (Cacioppo & Petty, 1981). Examples of thoughts scored as neutral
included, “I love to make dessert from both,” and “I like UGA because it is a good university to
be at.” All other thoughts were coded as negative as they, “mention specific undesirable
attributes or negative associations, challenges to the validity of the stimulus or situation, and
statements of negative affect,” (Cacioppo & Petty, 1981). Examples of thoughts scored as
negative included, “information laid out in a really boring unnatractive [sic] way,” and “I think
they're downplaying the importance of the peaches.” Overall attitude scores were calculated by
(favorable thought - unfavorable thought)/(favorable thought + unfavorable thought) as
recommended by Petty and Cacioppo (1981). The computed attitude scores were then converted
to z and t scores in order to enhance interpretation.
Elaboration validation scores from the Reynolds (1997) measure also exhibited a non-normal
distribution with homogeneity of variance. A very weak correlation of rs = .147, p <.001 was
found between the thought-listing attitude score and elaboration validation score. A composite
score was created through simple averaging of z scores. This elaboration composite score did not
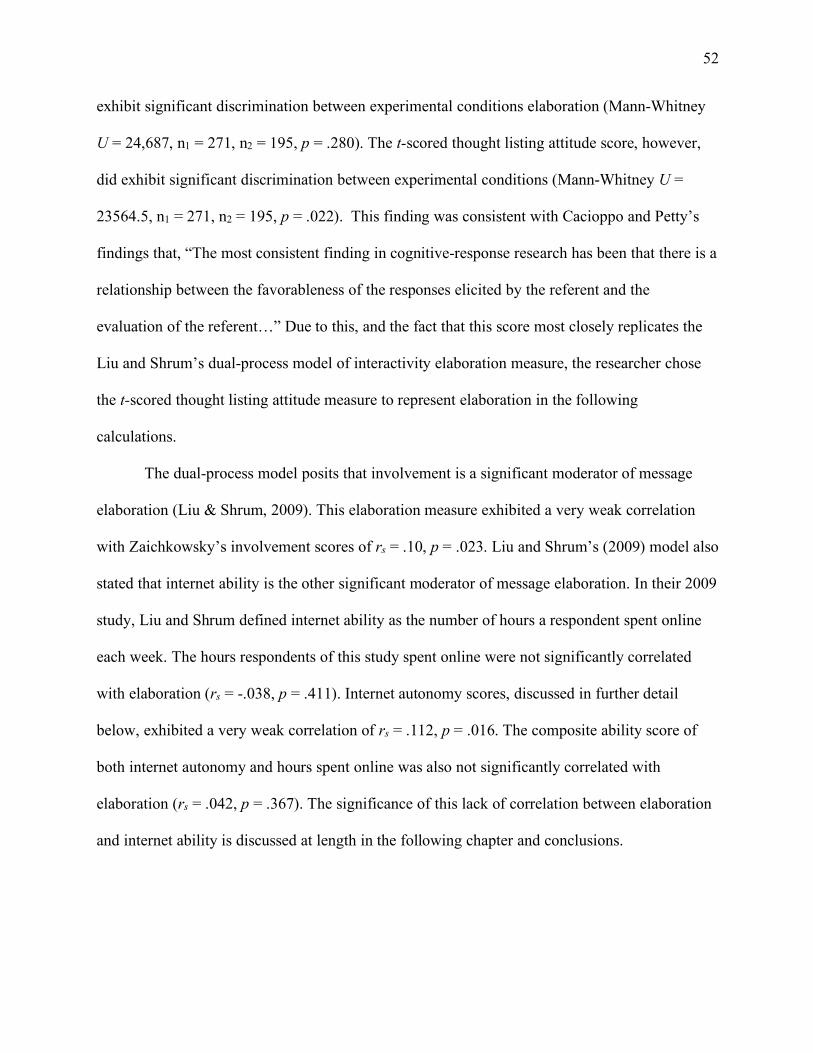
52
exhibit significant discrimination between experimental conditions elaboration (Mann-Whitney
U = 24,687, n1 = 271, n2 = 195, p = .280). The t-scored thought listing attitude score, however,
did exhibit significant discrimination between experimental conditions (Mann-Whitney U =
23564.5, n1 = 271, n2 = 195, p = .022). This finding was consistent with Cacioppo and Petty’s
findings that, “The most consistent finding in cognitive-response research has been that there is a
relationship between the favorableness of the responses elicited by the referent and the
evaluation of the referent…” Due to this, and the fact that this score most closely replicates the
Liu and Shrum’s dual-process model of interactivity elaboration measure, the researcher chose
the t-scored thought listing attitude measure to represent elaboration in the following
calculations.
The dual-process model posits that involvement is a significant moderator of message
elaboration (Liu & Shrum, 2009). This elaboration measure exhibited a very weak correlation
with Zaichkowsky’s involvement scores of rs = .10, p = .023. Liu and Shrum’s (2009) model also
stated that internet ability is the other significant moderator of message elaboration. In their 2009
study, Liu and Shrum defined internet ability as the number of hours a respondent spent online
each week. The hours respondents of this study spent online were not significantly correlated
with elaboration (rs = -.038, p = .411). Internet autonomy scores, discussed in further detail
below, exhibited a very weak correlation of rs = .112, p = .016. The composite ability score of
both internet autonomy and hours spent online was also not significantly correlated with
elaboration (rs = .042, p = .367). The significance of this lack of correlation between elaboration
and internet ability is discussed at length in the following chapter and conclusions.
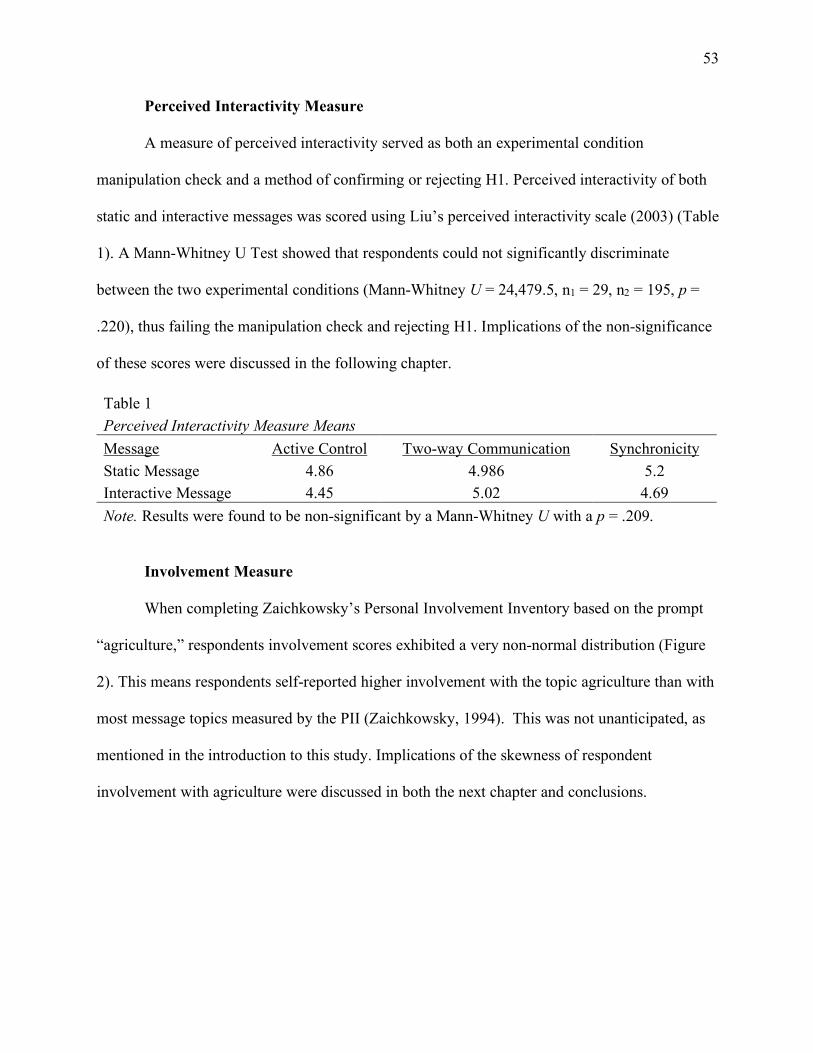
53
Perceived Interactivity Measure
A measure of perceived interactivity served as both an experimental condition
manipulation check and a method of confirming or rejecting H1. Perceived interactivity of both
static and interactive messages was scored using Liu’s perceived interactivity scale (2003) (Table
1). A Mann-Whitney U Test showed that respondents could not significantly discriminate
between the two experimental conditions (Mann-Whitney U = 24,479.5, n1 = 29, n2 = 195, p =
.220), thus failing the manipulation check and rejecting H1. Implications of the non-significance
of these scores were discussed in the following chapter.
Table 1 Perceived Interactivity Measure Means Message Active Control Two-way Communication Synchronicity Static Message 4.86 4.986 5.2 Interactive Message 4.45 5.02 4.69 Note. Results were found to be non-significant by a Mann-Whitney U with a p = .209.
Involvement Measure
When completing Zaichkowsky’s Personal Involvement Inventory based on the prompt
“agriculture,” respondents involvement scores exhibited a very non-normal distribution (Figure
2). This means respondents self-reported higher involvement with the topic agriculture than with
most message topics measured by the PII (Zaichkowsky, 1994). This was not unanticipated, as
mentioned in the introduction to this study. Implications of the skewness of respondent
involvement with agriculture were discussed in both the next chapter and conclusions.

54
Figure 3. Involvement Score Frequencies. This figure illustrates the non-normal distribution of
respondent involvement scores.
Zaichkowsky recommended 40 as the center involvement score for splitting respondents
into low and high involvement categories (1994). However, due to the non-normal distribution of
scores, only 30 respondents of the 466 scored below 40. Should this split recommendation be
observed, this group of 30 respondents would have been further subdivided into four groups to
account for the experimental condition and ability grouping measures. The small number of
respondents in these low-involvement groupings could potentially result in poor statistical
comparison.

55
In the case of Liu & Shrum’s dual-process model of interactivity effects study, the
moderating effect of ability was grouped by a median split (2009). The researcher therefore also
conducted a median split on the moderating measure of involvement to ensure that each
respondent grouping contained enough respondents to conduct statistical tests. For the purposes
of this study, a median split was conducted for grouping purposes with those respondents scoring
60 or below considered relatively low involvement and those of 61 or higher considered
relatively high involvement.
Internet Ability Measures
This study asked respondents the following questions found in Table 2 concerning their
internet ability. The first, free-response measure of hours spent online each week was selected
for the purpose of recreating the 2009 study by Liu and Shrum. The researcher recognized that
what may be considered an accurate internet ability measure in 2009 may no longer be as
significant of an indicator of elaboration moderation nine years later and therefore included
additional questions based on digital equality research (Anderson, Perrin, & Jiang, 2018;
DiMaggio & Hargittai, 2001; Salemink, Strijker, & Bosworth, 2017). Table 2 illustrates both the
respondent frequency and Spearman’s correlation r values of the internet ability questions asked
in this survey. From these questions, two different measures were created with an additional
composite measure for comparison with the elaboration measure.

56

57
The first measure created was a simple t-scored measure of hours that each respondent
spends online during the week. This measure was created for the purpose of recreating the 2009
Liu and Shrum study. The 2009 study found that respondents (n = 80) spent an average of 12.17
hours online and conducted a median split (median = 7.50) (Liu & Shrum). The current study (n
= 466) found the average hours respondents spent online each week to be 26.11 hours. The hours
spent online were not normally distributed and exhibited a large standard deviation of 23.54,
indicating that the self-reported number of hours respondents spent online was widely variable.
A median split was also conducted for this study’s adept and novice internet ability groups at 21
hours online per week. The second measure created was a simple averaged t-scored measure of
all other autonomy questions. This score, called autonomy, was not significantly correlated with
the number of hours spent online (rs = -.005, p = .923). A third, composite measure was created
by averaging of the t-scored hours online and autonomy score. This measure, called ability
composite, was then t-scored for enhanced interpretation in post-hoc analyses.
All three internet ability measures were tested for correlation with the elaboration
measure. Both the hours online score (rs = -.038, p = .411) and ability composite score (rs = -
.045, p = .339) were not significantly correlated with elaboration. The autonomy score exhibited
a very weak correlation of rs = .112, p = .016. Respondent grouping was created by each internet
score in order to gain a better understanding of the moderating factor of internet ability within
the dual-process model of interactivity. The number of hours respondents spent online each week
best replicates the measure used in the Liu and Shrum (2009) study, and therefore was used to
group respondents in order to test H4 through a Kruskal-Wallis test. Kruskal-Wallis scores of
groupings by the two other ability measures created (autonomy and ability composite scores)
were conducted as part of post-hoc analyses.

58
Respondent Grouping
Following a similar protocol as the dual-process model of interactivity study (Liu &
Shrum, 2009), grouping of respondents was conducted by median splits of both involvement
scores and hours online scores. This created eight distinct groups categorized by experimental
condition, involvement, and ability with which to compare mean elaboration and conduct
hypothesis testing (Table 3).
Table 3 Hours Online Respondent Grouping: Frequencies and Mean Elaboration
Experimental Condition
Static Interactive
High involvement Low involvement High involvement Low involvement
Ability n M n M n M n M Novice 73 49.86 64 48.05 39 53.11 55 50.44 Adept 78 50.27 54 47.09 54 52.49 47 49.81 Note. These means were found to be non-significant by a Kruskal-Wallis H = 10.726, p = .151.
Hypothesis Testing
H1: Users will perceive the interactive infographic as more interactive than the static.
H1 was rejected by the perceived interactivity scale manipulation check in which respondents
exhibited no significant discrimination between the interactive and static experimental messages
(Mann-Whitney U = 24479.5, n1 = 269, n2 = 195, p = .209) (Table 1).
H2: Interactive message elements will produce an overall positive effect on user
elaboration. H2 was confirmed where mean elaboration for the interactive condition (n = 195)
was 51.39 and mean elaboration for the static condition (n = 269) was 48.99 (Mann-Whitney U =
23564.5, n1 = 269, n2 = 195, p = .022). This hypothesis was further supported across the two
other respondent groupings used in post-hoc analyses where the mean elaboration was higher for
the interactive stimulus than the static in every pair-wise comparison.

59
H3: The high involvement group of agriculturalists will be disproportionately low ability.
H3 was rejected as the hours spent online score in fact exhibited a very weak positive correlation
of rs = .135, p = .004. Furthermore, involvement also exhibited a very weak positive correlation
with both other ability measures including autonomy (rs = .161, p < .001) and ability composite
(rs = .192, p < .001). These positive correlations may be related to the skewness of the
involvement measure exhibited in Figure 1.
When the median split grouping of involvement was conducted (n1 = 244, n2 = 222),
Mann-Whitney U tests revealed a significant difference among all three measures when
compared to ability (Table 4).
Table 4 Ability, Involvement Mann-Whitney U Results
Measure Low Involvement Median
High Involvement Median U p
Hours Online 47.41 49.11 23272 .013 Autonomy 49.38 50.94 23079.5 .009 Ability Composite 48.14 50.69 22406.5 .002
H4: Three of the four respondent groupings: adept, high involvement respondents and
respondents in both low involvement categories will elaborate more with the interactive message
when compared with the static message. The fourth, the high-involvement, novice group will
exhibit decreased elaboration when viewing the interactive infographic compared to the static
infographic. This hypothesis was rejected when no significant difference in elaboration was
found among hours online respondent groups (Kruskal-Wallis H = 10.726, p = .151) (Table 3).
Kruskal-Wallis H tests were also conducted on autonomy and ability composite groupings in
post-hoc analyses.
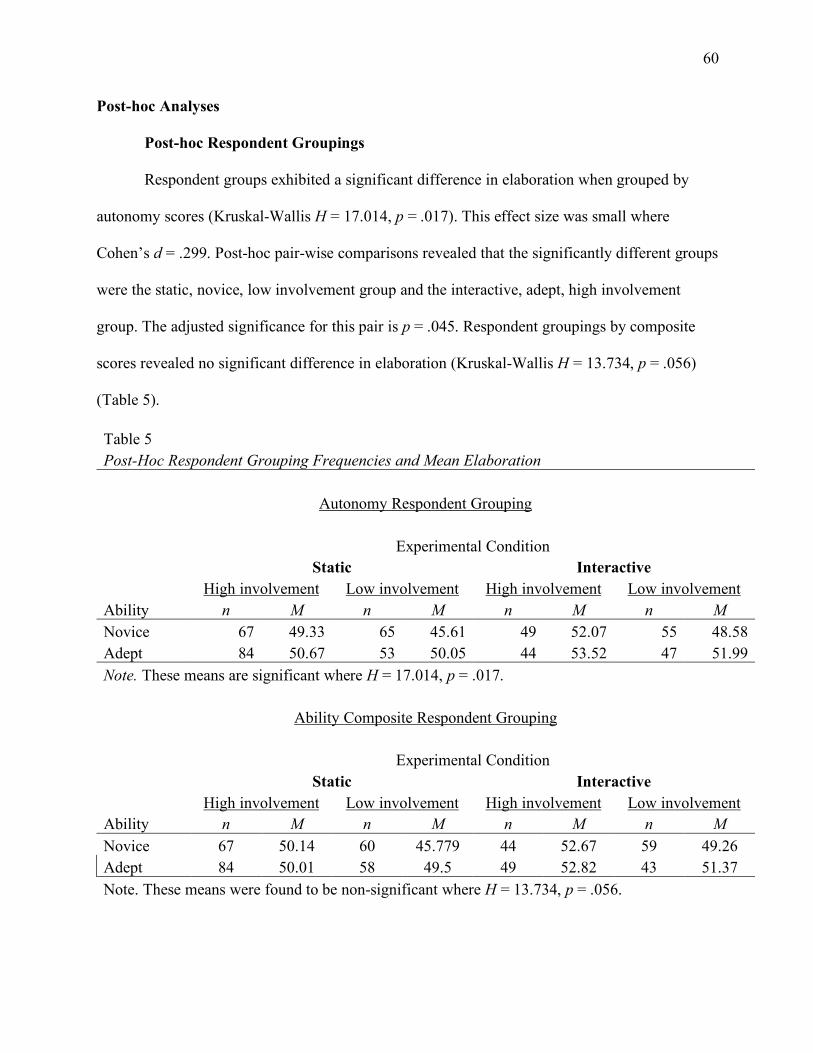
60
Post-hoc Analyses
Post-hoc Respondent Groupings
Respondent groups exhibited a significant difference in elaboration when grouped by
autonomy scores (Kruskal-Wallis H = 17.014, p = .017). This effect size was small where
Cohen’s d = .299. Post-hoc pair-wise comparisons revealed that the significantly different groups
were the static, novice, low involvement group and the interactive, adept, high involvement
group. The adjusted significance for this pair is p = .045. Respondent groupings by composite
scores revealed no significant difference in elaboration (Kruskal-Wallis H = 13.734, p = .056)
(Table 5).
Table 5 Post-Hoc Respondent Grouping Frequencies and Mean Elaboration
Autonomy Respondent Grouping
Experimental Condition Static Interactive
High involvement Low involvement High involvement Low involvement Ability n M n M n M n M Novice 67 49.33 65 45.61 49 52.07 55 48.58 Adept 84 50.67 53 50.05 44 53.52 47 51.99 Note. These means are significant where H = 17.014, p = .017.
Ability Composite Respondent Grouping
Experimental Condition Static Interactive
High involvement Low involvement High involvement Low involvement Ability n M n M n M n M Novice 67 50.14 60 45.779 44 52.67 59 49.26 Adept 84 50.01 58 49.5 49 52.82 43 51.37 Note. These means were found to be non-significant where H = 13.734, p = .056.

61
Other post-hoc analyses
Perceived interactivity and elaboration scores exhibited no significant correlation (rs =
.082, p = .079). Elaboration scores did, however, exhibit a very weak positive correlation of rs =
.16, p = .001 when compared to recall scores. This correlation was also significant when tested
with a Mann-Whitney where U = 23115.5, p = .02. Median recall scores for both static and
interactive were both 2, so means were calculated. The mean recall for the static message (n =
269) was 2.11. Mean recall score for the interactive message (n = 195) was slightly higher at
2.32. The effect size of this correlation was small, where Cohen’s d = .204.

62
DISCUSSION
Overview
The findings of this study did not replicate the dual-process model of interactivity put
forth by Liu and Shrum (2009). Most of the hypotheses posed in this study were based from this
theoretical framework and were therefore rejected. A few major differences between this study
and Liu and Shrum’s, on which the dual-process model of interactivity was based were the
sample size, year in which the study was conducted, and stimulus subject. It is possible that these
were contributing factors in the failure to extend the findings through the current study.
The sample size was n = 80 of undergraduate business students (Liu & Shrum, 2009).
The researcher attempted to extend the findings of this 2009 study to a more general population,
the state of Georgia, and as such increased the sample size to n = 466. Internet use has also
changed drastically since 2009. In fact, internet adoption among American adults has increased
13% since 2009, from 76% to 89% (Anderson, Perrin, & Jiang, 2018). In the discussion of
results of the 2009 study, it is suggested this study could be extended to different messages or
moderating factors (Liu & Shrum). The message stimulus of the 2009 study was directed toward
selling an MP3-player, not only a very different message topic, but one that is also a sign of the
nine years that have passed between these two studies (Liu & Shrum). The attempt to extend the
findings of the dual-process model of interactivity to an agricultural news message were
unsuccessful. This differing stimulus topic certainly affected the involvement of the sample,
skewing it significantly which, in turn, created another barrier toward the recreation of Liu &
Shrum’s findings (2009).
63
Elaboration
Two different elaboration measures were used in this study. The first, a judge-coded
thought listing exercise in which thoughts were coded according to polarity, and the second an
elaboration validation measure (Reynolds, 1997). These two measures exhibited a very weak
correlation rs = .147, p < .001. It is possible that further scoring of respondent thoughts on the
dimensions of origin, target, etc. could affect this correlation. These two measures differ in the
fundamental way of who is judging the level of elaboration. For this study’s thought listing
measure, respondents were simply asked to provide thoughts. It was the responsibility of trained
judges to assign value to these thoughts, and this method could present the possibility of a judge
misrepresenting a subject’s thoughts. In contrast, the elaboration validation measure required
respondents to self-report their own elaboration, something respondents are not always able or
willing to do accurately, especially when asked to classify their thoughts along several different
dimensions (Cacioppo & Petty, 1981). Another difference between these two measures is the
elaboration validation measure requires respondents to rate their level of agreement with certain
statements, whereas in the polarity coding of thought-listing, weighting of scores by the
extremity of the view is discouraged (Cacioppo & Petty, 1981).
An elaboration composite was created by simple averaging of elaboration validation and
thought-listing t-scores scores and then t scoring once more for enhanced interpretation, and of
these three measures, only the thought-listing score exhibited significant discrimination between
the interactive and static messages (Mann-Whitney U = 23564.5, n1 = 271, n2 = 195, p = .022).
This measure is also the one that most closely replicated the measure used by Liu and Shrum and
was therefore selected for hypothesis testing and respondent grouping.

64
Perceived Interactivity Measure
It is possible that, as people spend more time online, perceptions of what constitutes
interactivity have changed. Distributions of perceived interactivity scores for both stimuli were
non-normal with medians of 5 and standard deviations of .96 with a range of 5.13 for the
interactive stimulus and 5.2 for the static. Furthermore, respondents failed to significantly
discriminate between the interactive and static messages (Mann-Whitney U = 24479.5, n1 = 269,
n2 = 195, p = .209).
This could be due to the researcher’s attempt to keep the level of interactivity within the
interactive experimental condition no higher than medium interactivity, as recommended by past
research (Sundar, Kalyanaraman, & Brown, 2003; Weber & Rall 2012). The interactive stimulus
exhibited low interactivity through its linear, storyboard-like progression and medium
interactivity through the inclusion of hyperlinks as recommended by Weber & Rall (2012).
Given that these recommendations were made six years ago, it is possible that both perception
and preference of level of interactivity has changed as internet ability has changed.
A more recent study by Wojdynski stated that interactivity, “led to more positive attitudes
toward the article only to the extent that users perceived the site as more interactive, suggesting
that attempts by content producers to increase such perceptions maybe worth the investment,”
(2015). The current study, however, indicated no significant correlation between perceived
interactivity scores and the elaboration measure (rs = -.008, p = .865). It is possible that part of
this lack of correlation could be due to the non-reliability of the active control measure within the
perceived interactivity scale for this particular study (a = .373) for the interactive condition and a
= .486 for the static). No single item within the measure contributed to this low Cronbach’s
score, although this active control measure only contained four questions.

65
Other explanations for respondents failing to significantly discriminate between
experimental conditions could include survey administration obstacles. After 347 responses had
been recorded, Qualtrics, the survey administrator, reported to the researcher that a larger than
normal number of respondents were leaving the survey unfinished after being required to
navigate to a different browser tab to view the interactive stimulus. Respondents were required to
navigate to a tab where they could view the interactive message. This message was embedded
into a blank web page stored on the Georgia Department of Agriculture server, in order to
closely simulate the way respondents might encounter interactive agricultural messages outside
of experimental conditions. However, it seemed that many respondents were either unable or
unwilling to navigate back to the browser tab where they could finish the survey. This created an
issue for Qualtrics to obtain the required number of responses and therefore an edit was made to
the survey where desktop users could view the interactive message embedded within the
Qualtrics survey. Due to coding requirements, respondents using mobile devices were still
required to navigate away from and back to the survey tab in order to view the interactive
message. Although there was no significant difference in elaboration between the groups of
respondents who viewed the interactive message prior to the survey administration edit and those
that viewed the interactive message embedded within the survey, it is possible this large drop-off
rate that occurred when viewing the interactive message contributed to the failed perceived
interactivity manipulation check and the rejection of H1 (Mann-Whitney U = 3317, n1 = 147, n2
= 48, p = .668).
Involvement Measure
The introduction to this thesis stated, “Although the majority of consumers are not part of
the agricultural industry, every consumer interacts with food multiple times each day. More

66
research is necessary to ascertain how this universal familiarity affects the “low-involvement”
classification.” This rings true after examination of the results presented in Chapter 4. When
creating the measure, Zaichkowsky recommended that 40 be the midpoint of the scale (1994).
However, this assumes a normal distribution, which was not present in this study. In fact, had
only the scores ranging from 10 – 40 on the PII scale been categorized as low involvement, this
study would only have had 30 of the 466 respondents in the low involvement category, spread
across four different groupings.
Therefore, it was necessary to create a median split as was conducted for the internet
ability moderating factor in Liu and Shrum’s 2009 study. The median used for this split was 61,
far greater than the assumed normality of 40. If this study had replicated the results of the Liu
and Shrum study (2009), this unusually high level of involvement could have been a detriment to
agricultural communicators wishing to use interactivity as a method to improve attitudes and
elaboration, as it would have increased the possibility of the negative attitudes from the high
involvement, low ability group just by virtue of frequency of the respondents in the high
involvement group. This proved not to be the case in the current study, however, so it cannot be
concluded that an agricultural topic has a significant effect on the relationship between
elaboration and involvement.
It is interesting to consider why the topic of agriculture produced such skewed results
within the PII. There are a number of possibilities as to why this is; only two of which could
include be the ubiquity of agriculture and the importance of agriculture to the state of Georgia.
This stimulus message made a point of highlighting the importance of blueberry and peach
production to the state’s economy. This may also have affected responses to the PII as
respondents were asked their opinions after viewing the message as opposed to before.
67
Examining the high and low involvement populations demographically, there is a
significant difference between rural and urban location between high and low involvement
groups, as may be expected (U = 23127, p = .019). The effect size was small, Cohen’s d = .217.
In terms of frequencies, the high involvement group was 46.7% rural (n = 114) and 53.3% urban
(n = 130), as compared to the low involvement group that was 40% rural (n = 88) and 60% urban
(n = 132). There is little other difference between these two groups demographically; they share
similar makeups when it comes to age, education level, political ideology, and household
income.
Despite the non-normal distribution, PII scores were still positively correlated with
elaboration, although very weakly, confirming the assumption that a higher level of involvement
increases the likelihood of elaboration (rs = .10, p = .023). However, when groupings were
divided at the 61 median score and this correlation was retested with a Mann-Whitney U test,
there was no significant difference between the two groups. This suggests that, in the case of
agricultural messages, a more discriminatory involvement measure is necessary in order to
predict elaboration through the dual-process interactivity model.
Internet Access and Ability
As mentioned in the limitations of this study and the Liu and Shrum study (2009),
creating an accurate measure of internet ability that stands the test of time is difficult, if not
impossible, due to the ever-changing relationship of consumers and the internet. For research
that includes internet ability, this may make recreation of study results exponentially more
difficult as more years pass between both studies. At the time of publication of Liu’s Perceived
Interactivity Scale, 2003, no more than 15% of respondents of any of the three studies conducted
had used the internet for over six years, a statistic that has certainly changed. At the time this

68
research was conducted, the offline American population has “declined substantially since
2000,” dropping from a non-adoption rate of 48% to just 15% over the past six years (Anderson,
Perrin, & Jiang, 2018; Liu & Shrum, 2003; Zickuhr, 2013). For example, in the 2009 dual-
process model of interactivity study, Liu and Shrum’s respondents reported spending an average
of 12.17 hours online each week where the median = 7.50. As is to be expected, that number is
much larger in this current study, where the average number of hours respondents spend online
each week equaled 26 and the median = 21. However, what is most concerning about the validity
of this question as a measure of ability is the standard deviation of 23.52 among respondents. A
standard deviation this large, along with the non-normal distribution of data raises concerns
about how respondents conceptualize “time online.” Do they consider using mobile applications
like Facebook being “online” or strictly online activity via a web browser? Again, this study
finds necessary a more discriminatory measure through which to measure ability in order to
recreate the dual-process model findings.
The researcher anticipated this issue and intended to create an autonomy score based on
digital inequality research from which to create a composite internet ability score that would
prove a more accurate measure of true internet ability (Anderson, Perrin, & Jiang, 2018;
DiMaggio & Hargittai, 2001; Salemink, Strijker, & Bosworth, 2017). However, the hours a
respondent spent online was not significantly correlated with the autonomy measure (rs = -.005,
p = .923). The hours spent online measure was used to define ability in hypothesis testing as it
most closely followed the dual-process model framework put forth by Liu and Shrum (2009).
However, the number of hours a respondent spent online each week did not prove to be a
moderating factor in this study as evidenced by the non-significant correlation between the hours
a respondent spent online and their level of elaboration (rs = -.038, p = .411). In post-hoc

69
analyses, the researcher-created autonomy score exhibited a very weak correlation to elaboration
of rs = .112, p = .016. The composite score created from averaging hours spent online and
measured autonomy exhibited also exhibited no correlation with elaboration. The lack of
significant correlation with hours spent online and the very weak correlation of the internet
autonomy scores to elaboration could indicate that the measure of internet ability defined as a
moderator of the dual-process model of interactivity effects requires modern adjustment in order
to be used as an accurate grouping measure.

70
CONCLUSIONS
Conclusions
The failure of this study to extend the results of the dual-process model of interactivity to
a larger population based on an agricultural message, while also observing an overall positive
effect of interactivity on elaboration creates interesting implications for the field of agricultural
communication. The dual-process model of interactivity and other research presented the
possibility of alienating the core group of high-involvement agriculturalists by investing in
interactive agricultural communication strategies. By testing this dual-process interactivity model
for an agricultural message based on a general population and finding no significance, this study
found that the risk of alienating any group is minimal, so long as interactivity conditions are not
high. In fact, mean elaboration was significantly higher for respondents who viewed the
interactive stimulus as opposed to the static. After respondent were stratified by involvement and
ability through the dual-process model of interactivity effects framework, this elaboration
correlation lost its significance. Though the elaboration correlations for most groupings were not
found to be statistically significant, mean elaboration for the interactive message was higher in
every pair-wise comparison. It should be noted that this non-significance by no means disproved
the dual-process model of interactivity, but instead called for a more modern modification of
moderating factors measures.

71
Implications
Theoretical
The failure of this study to prove the hypotheses based on the dual-process model of
interactivity presents several theoretical implications. First, it exhibits a need for improved
discrimination between ability scores on topics as ubiquitous as agriculture. As the distribution
of these involvement scores were non-normal with a median of 61 as opposed to 40 within the
range of 10-70, a different measure of involvement may be required to accurately group
respondents into low and high involvement categories. Further investigation is required as to the
reason why these scores were so high. Possible explanations include the importance of
agriculture to Georgia or the fact that respondents viewed the message prior to reporting their
involvement. Due to the relevance of the message and its topic of the importance of blueberry
and peach production to the state’s economy, it is possible respondents self-reported higher than
normal involvement scores. Involvement could potentially be more accurately self-reported as a
moderating factor in a message stimulus study, should respondents be asked to rank their
opinions prior to viewing the message as opposed to afterwards. However, it is also possible that
respondents are accurately reporting their level of involvement and are simply more highly
involved with the topic of “agriculture” as opposed to a specific brand or product. If the latter
case, this study exhibited a need for a different involvement measure when attempting to
discriminate between high and low involvement groups in a topic that has the potential to be
ubiquitous or highly relevant.
Secondly, the respondent’s failure to discriminate on the perceived interactivity scale
between static and interactive messages carries its own theoretical implications. This study could
suggest this scale may need further testing with more contemporary data in order to maintain its

72
relevance. In the same way that internet use is constantly evolving, so too may perceptions of
what constitutes interactivity. Comparing modern interactive and static messages on the scale
could support the scale’s continued use. An alternative explanation could be that the
recommended levels of interactivity should be changed as internet ability continues to rise. It is
possible the reason that the interactive message was not significantly perceived as more
interactive was due to the fact that respondents are more accustomed to increased interactivity as
internet adoption has increased. Correlating elaboration with differing levels of modern
interactive messages could change past recommendations of low to medium interactivity levels
(Sundar, Kalyanaraman, & Brown, 2003; Weber & Rall 2012).
Third, this study suggests that should the dual-process model of interactivity effects
framework be followed, a more current and discriminatory measure of internet ability is
required. Due to the lack of significant correlation between hours spent online and elaboration,
this study suggested that hours spent online are no longer a significant moderating factor for
elaboration of interactive messages. Furthermore, it also raised the issue of validity of self-
reporting hours spent online due to the non-normal distribution and very large standard deviation
of this free response field. The only measure that even very weakly correlated with elaboration
was one based in internet connectivity and literacy research rather than a quantitative measure of
hours spent online. It should be noted that this autonomy measure was not significantly
correlated with the number of hours respondents self-reported that they spent online. Liu and
Shrum mention that the dual-process model of interactivity is flexible to different measures and
is merely a model of elaboration in response to the interactivity cue (2009). This could allow for
a more modern interpretation of the moderating factors of both ability and involvement.
Interactivity proved to have an overall positive effect on message elaboration. This significance

73
was lost, however, when the respondents were grouped according the moderators used by Liu
and Shrum (2009). This further impresses the need for a better measure for these moderating
factors as it demonstrated that there is an effect, but that the dual-process model of interactivity
effects framework, used with these measures did not explain this effect.
Furthermore, the overall positive effect of interactivity on message elaboration calls for
further research on the effects of interactivity on agricultural communications. Though the
effects did not follow the hypotheses based in the dual-process model of interactivity effects,
mean elaboration for the interactive stimulus was higher than the static, even when respondents
perceived no significant difference between interactivity levels of the two. This bears further
investigation not only to be understand respondent perceived interactivity but also to identify
other potential moderators of elaboration on interactive agricultural messages.
Practical
Though this study by no means disproves the dual-process model of interactivity effects
as much as it calls for a modern reinterpretation of its moderating factors, it does encourage
agricultural communicators to pursue more interactive communication strategies. This study
found that the likelihood of creating negative attitudes or elaboration affects through the use of
interactive messages is minimal, so long as messages are kept to medium or low interactivity
levels. It also found that despite consumers not perceiving the interactive stimulus as more
interactive than the static, they still elaborated significantly more in the experimental interactive
condition. Because greater elaboration is the path to increasing positive attitudes, deeper critical
thinking, and more resilient beliefs and behavior changes, this was an important realization that
encourages agricultural communicators to increase the interactivity of their messages, if only
slightly, to in turn increase message persuasiveness (Petty & Cacioppo, 1986).

74
Past research also confirmed that interactivity can be a useful tool for enhancing
elaboration and pairwise comparisons show that the mean elaboration score for the interactive
agricultural message was also greater in every grouping, despite the statistical insignificance
created by the moderating measures (Sundar, Kalyanaraman, & Brown, 2003; Weber & Rall,
2012; Wojdynski, 2015). This means that agricultural communicators should move forward with
interactive strategies based on the recommendation of past research, the inability of this study to
prove that a high involvement in agriculture will result in decreased elaboration, and the overall
positive effect of interactivity on message elaboration.
Another practical significance of this study is that, in this inability to prove that a high
involvement in agricultures risks decreased elaboration while also finding an overall positive
effect of interactivity, it supported the call for greater cross-training of communicators in digital
and interactive strategies and more accessible software programs for data visualization (Reilly,
2017; Weber & Rall, 2012). Reilly particularly focused on the need for smaller, local news
outlets to remain relevant through increased use of data visualization and digitalization of
content (2017). This study supports the notion that interactive strategies could help
communicators even in both rural and urban areas. As professional agricultural communicators
are often crisis communicators, public relations managers, social media experts, writers, and
graphic designers all rolled into one, training in interactive strategies and the software needed to
create interactive data visualizations will not only pay dividends currently but will also continue
to increase in value as both internet adoption and literacy increase. This notion presents the
pedagogical implication that interactivity training should be provided to agricultural
communicators within college curriculums in order to provide students the tools they will need to
stay relevant within the quickly-changing communication realm.

75
Limitations
A few possible limitations of this study that have not yet been discussed in Chapters
Three and Five include the general negativity of the topic of the message topic and its possible
implications for polarity coding, the effect of the UGA branding on the Qualtrics survey pages,
and general sample limitations. The topic of the message presented to respondents was the loss
of revenue incurred by Georgia’s economy due to strange weather patterns that killed or
otherwise ruined many peaches and blueberries during the 2017 growing season. As this message
was inherently negative, polarity coding was likely more difficult than that of a message with a
more optimistic or neutral tone. However, coder instruction and training resulted in a high inter-
coder reliability of a = .826 (Krippendorff, 2011).
A second limitation was the effect of University of Georgia branding of a respondent’s
level of trust in the message. It is possible that having the UGA academic logo on each page of
this study led respondents to place more trust in this message than they would normally, resulting
in increased elaboration both from a polarity standpoint in the thought listing measure and as a
reliable message source (Petty & Cacioppo, 1986). The term “UGA” and city of “Athens” were
both mentioned seven times whereas “university” was mentioned eight and “school” three,
exhibiting that the university branding did play some role in respondent reaction to the message
stimulus.
Suggestions for future research
Through the course of this thesis, the researcher recognized several avenues for future
research. The first and most important recommendation of this study is for investigation into
different, more current ways to measure the moderating factors of ability and involvement that

76
more strongly correlate with elaboration than those used in this study based on the dual-process
model research conducted by Liu and Shrum (2009).
Next, the researcher recommends that the thought-listing responses for this study be
coded on target and origin dimensions and then re-tested for correlation with the elaboration
validation measure. These additional codings could contribute to the theoretical understanding of
elaboration and thought-listing procedures. The thought-listing method is a time-consuming
measure of elaboration that requires coordination with other judges and experimental condition
blindness (Petty & Cacioppo, 1981). A measurement like Reynold’s elaboration validation
would be a preferred measure as it precludes the need for additional judges and their possibility
of misinterpreting a thought, while also keeping respondents from being required to judge their
own thoughts (1997). In short, it is a much more convenient measure of elaboration for both
respondents and researchers and a further investigation of this dataset could provide more
support for the measure.
The next set of recommendations involves re-running the experiment with different
manipulations. The first recommended manipulation is the increase of interactivity to the high
levels defined by Weber & Rall (2012). It is possible that increased interactivity will lead to a
statistically significant manipulation check and results that more closely replicate Liu and
Shrum’s 2009 study. It is also possible, though unlikely, that novice internet users’ tolerance of
interactivity has increased to the point that no group will exhibit decreased elaboration of an
average interactive message regardless of interactivity level. It is more likely that novice
interactivity has increased at a level commensurate with ability and therefore the dual-process
model of interactivity would remain intact. Replicating this study with a more interactive

77
message could lead to more statistically significant results and a better understanding of the
modern consumer’s relationship with interactivity.
The second recommended replication could be conducted by changing the message
stimulus to a more neutral or optimistic agricultural topic. Other additional dimensions on which
to manipulate the stimulus could include relevance, for example a Georgia-focused message
versus a nationally focused message, or timeliness. For example, one respondent wrote, “old
news” in the thought-listing exercise of this study in response to the data from 2017. Replicating
the study with a message less than a year old could increase the perceived relevance.
The researcher also recommends that future studies similar to this one actively include
more farmers and agriculturalists. Due to the sample limitations, it is likely that few
agriculturalists took this survey despite the high involvement scores exhibited and fairly high
percentage of rural respondents. As these are the people that will likely comprise the group
hypothesized by the dual-process model of interactivity and other research to exhibit the most
negative elaboration towards increased interactivity, they are an important group to include in
studies like this one. Practical rather than experimental hypothesis testing could be carried out
through publications like the Farmers and Consumers Market Bulletin, which boasts a large
subscription base of agriculturalists.
A final interesting avenue of research could be the effect of pre-screening respondents
based on cookies or a pre-screening question pertaining to internet ability prior to presenting an
audience a particular web page. For instance, if a person’s cookies indicate they are a novice
internet user, they could be automatically routed to a less-interactive web page, or perhaps a pre-
screening question indicates an adept user who is then shown a more interactive message. The

78
implications these pre-screening conditions could have on message elaboration and trust could
provide a new application of the dual-process model of interactivity.
An overall positive effect of interactivity was found in this study despite the fact
respondents did not recognize the experimental stimulus to be more interactive than the static.
This means that people responded more favorably and thought more critically about an
interactive message without recognizing the potential cause of this increased elaboration. The
dual-process model of interactivity effects used with the stated measures of ability and
involvement also did not explain this positive effect. In fact, the power of this effect was diluted
into statistical insignificance by grouping respondents by these ability and involvement
measures. This should be recognized as both a theoretical call for modernization of the dual-
process model of interactivity moderation measures, and a practical push for agricultural
communicators to pursue more interactive communication strategies.

79
References
American Farm Bureau, (2017). Food and Farm Facts. Retrieved from
http://www.agfoundation.org/resources/food-and-farm-facts-2017
Anderson, M., Perrin, A., & Jiang, J. (2018). 11% of Americans don’t use the internet. Who are
they? Pew Research Center, Retrieved from http://www.pewresearch.org/fact-
tank/2018/03/05/some-americans-dont-use-the-internet-who-are-they/
Atkinson, L., & Lazard, A. (2015). Putting environmental infographics center stage: The role of
visuals at the elaboration likelihood model’s critical point of persuasion. Science
Communication, 37(1), 6-33. http://dx.doi.org/10.1177/1075547014555997
Bounegru, L., Chambers, L., & Gray, J. (Eds.). (n.d.) The Data Journalism Handbook. Available
from http://datajournalismhandbook.net/1.0/en/index.html
Brossard, D., & Nisbet, M. C. (2006). Deference to scientific authority among a low information
public: Understanding U.S. opinion on agricultural biotechnology. International Journal
of Public Opinion research, 19(1), 24-52. http://dx.doi.org/10.1093/ijpor/edl003
Cacioppo, J. T., & Petty, R. E. (1981). Social psychological procedures for cognitive response
assessment: The thought listing technique. In T. Merluzzi, C. Glass, & M. Genest (Eds.),
Cognitive assessment.
Cairo, A. (2013). The functional art: An introduction to information graphics and visualization.
Berkeley, CA: New Riders.
Cairo, A. (2016). The truthful art: Data, charts, and maps for communication. Berkeley, CA:
New Riders.

80
Cheng, K., Drewnowski, A., & Otten, J. (2015). Infographics and public policy: Using data
visualization to convey complex information. Health Affairs 34(11), 1901-1907.
http://dx.doi.org/10.1377/hlthaff.2015.0642
Ciati, R., Marchelli, L., Pratesi, C. A., Rapetti, V., Redavid, E., & Vannuzzi, E. (2016). Using an
infographic tool to promote healthier and more sustainable food consumption: The
double pyramid model by Barilla Center for Food and Nutrition. Agriculture and
Agricultural Science Procedia, 8, 482-488.
http://dx.doi.org/10.1016/j.aaspro.2016.02.049
Dholakia, U.M. (2001) "A motivational process model of product involvement and consumer
risk perception", European Journal of Marketing, 35(11-12). p.1340-1362,
https://doi-org.proxy-remote.galib.uga.edu/10.1108/EUM0000000006479
DiMaggio, P., & Hargittai, E. (2001). From “digital divide” to “digital inequality”: Studying
internet use as penetration increases. Retrieved from
https://www.princeton.edu/~artspol/workpap/WP15%20%20DiMaggio%2BHargittai.pdf
Dur, B. U. (2014). Data visualization and infographics in visual communication design education
at the age of information. Journal of Arts and Humanities, 3(5), 39-50.
http://dx.doi.org/10.18533/journal.v3i5.460
Friendly, M. & Denis, D. J. (2001). Milestones in the history of thematic cartography, statistical
graphics, and data visualization. Retrieved from http://www.datavis.ca/milestones/
Gebre, E. H. & Polman J. L. (2015). Towards critical appraisal of infographics as scientific
inscriptions. Journal of Research in Science Teaching 52(6), 868-893.
https://doi.org/10.1002/tea.21225

81
Holt, D. (2016). Branding in the age of social media. Harvard Business Review, Retrieved from
https://hbr.org/2016/03/branding-in-the-age-of-social-media
Krippendorff, K. (2011). Computing Krippendorff’s alpha-reliability. Retrieved from
http://repository.upenn.edu/asc_papers/43
Liu, Y. (2003). Developing a scale to measure the interactivity of websites. Journal of
Advertising Research, 43(2), 207–216. http://dx.doi.org/10.1017/S0021849903030204
Liu, Y., & Shrum, L. J. (2009). A dual-process model of interactivity effects. Journal of
Advertising, 28(2), 53–68. http://dx.doi.org/10.2753/JOA0091-3367380204
Martin, W. E., & Bridgmon, K. D. (2012). Quantitative and Statistical Research Methods: From
Hypothesis to Results. Somerset, NJ: Wiley.
McKee, S. C. (2008). Rural voters and the polarization of American presidential elections. PS,
Political Science & Politics, 41(1), 101-108. Retrieved from
http://proxy-remote.galib.uga.edu:80/login?url=https://search-proquest-com.proxy-
remote.galib.uga.edu/docview/224979083?accountid=14537
McSpadden, K. (2015). You now have a shorter attention span than a goldfish. Time. Retrieved
from http://time.com/3858309/attention-spans-goldfish/
Nordstokke, D. W., & Zumbo, B. D. (2010). A new nonparametric Levene test for equal
variances. Psicológica, 31(2), 401-430. Retrieved from
https://www.researchgate.net/publication/236596812_A_New_Nonparametric_Levene_T
est_for_Equal_Variances

82
Nordstokke, D. W., Zumbo, B. D., Cairns, S.L., & Saklofske, D.H. (2011). The operating
characteristics of the nonparametric Levene test for equal variances with assessment and
evaluation data. Practical Assessment, Research & Evaluation, 1(5). Retrieved from
https://pareonline.net/pdf/v16n5.pdf
Nunnally, J.C. (1978) Psychometric theory. 2nd Edition, McGraw-Hill, New York.
Petty, R. E., & Cacioppo, J. T. (1986). The elaboration likelihood model of persuasion.
Advances in experimental social psychology 19, 123-205.
https://doi.org/10.1016/S0065-2601(08)60214-2
Petty, R.E., Cacioppo, J. T., & Schumann, D. (1983). Central and peripheral routes to advertising
effectiveness: The moderating role of involvement. Journal of Consumer Research 10,
135-146. https://doi.org/10.1086/208954
Rafaeli, S. (1988). Interactivity: From new media to communication. In R. Hawkins, J.
Weimann, & S. Pingree (Eds.), Advancing communication science: Merging mass and
interpersonal processes (pp. 110-134). Newbury Park, CA: Sage.
Reilly, S. (2017). The need to help journalists with data and information visualization. IEEE
computer graphics and applications, 37(2), 8-10.
http://dx.doi.org/10.1109/MCG.2017.32
Reynolds, A. A. (1997). A validation test of a message elaboration measure. Communication
Research Reports, 14(3). http://dx.doi.org/10.1080/08824099709388670
Santos, J. R. A. (1999). Cronbach’s alpha: A Tool for assessing the reliability of scales. Journal
of Extension, 37(2). Retrieved from
https://www.joe.org/joe/1999april/tt3.php/journal-current-issue.php

83
Salemink, K., Strijker, D., & Bosworth, G. (2017). Rural development in the digital age: A
systematic literature review on unequal ICT availability, adoption, and use in rural areas.
Journal of Rural Studies 54, 360-371. http://dx.doi.org/10.1016/j.jrurstud.2015.09.001
Spenner, P., & Freeman, K. (2012). To keep your customers, keep it simple. Harvard Business
Review, Retrieved from https://hbr.org/2012/05/to-keep-your-customers-keep-it-simple?
Steuer, J. (1992). Defining virtual reality: Dimensions determining telepresence. Journal of
Communication, 42(4), 73-93. https://doi.org/10.1111/j.1460-2466.1992.tb00812.x
Sundar, S. S., Kalyanaraman S., & Brown, J. (2003). Explicating web site interactivity:
Impression formation effects in political campaign sites. Communication Research 30(1),
30-59. http://dx.doi.org/ 10.1177/0093650202239025
United States Department of Agriculture. (2016). America’s diverse family farms (Economic
Information Bulletin No. 164). Washington, DC: U.S. Government Printing Office
Weber, W., & Rall, H. (2012). Proceedings from International Communication Association:
Between data visualization and visual storytelling: The interactive information graphic
as a hybrid form. Phoenix, AZ.
Vanichvasin, P. (2013). Proceedings from ICQA 2013: The International Conference on QA
Culture: Cooperation or Competition 2013: Enhancing the quality of
learning through the use of infographics as a visual communication and learning tool.
Tung Phayathai, Ratchathewi, Bangkok: Offset Plus. Retrieved from
http://www.icqa2014.com/downloads/Proceeding_29.pdf
Wojdynski, B. (2015) Interactive data graphics and information processing: The moderating role
of involvement. Journal of Media Psychology 21(1), 11-21.
http://dx.doi.org/10.1027/1864-1105/a000127

84
Zaichkowsky, J. L. (1994). The personal involvement inventory: Reduction, revision, and
application to advertising. Journal of Advertising 23(4), 59-70.
https://doi.org/10.1080/00913367.1943.10673459
Zickuhr, K. (2013). Who’s not online and why. Pew Research Center. Retrieved from
http://www.pewinternet.org/2013/09/25/whos-not-online-and-why/

85
Appendix A
Static stimulus

86
Appendix B
Interactive Stimulus

87

88

89

90
Appendix C
Georgia Department of Agriculture press release concerning 2017 freeze effects on blueberries
and peaches
Georgia Department of Agriculture
Gary W. Black, Commissioner
19 Martin Luther King Jr. Dr. SW
Atlanta, GA 30334
www.agr.georgia.gov
Find us on Facebook • Follow on Twitter: @GDAFoodSafety •@GeorgiaGrown
Press Release
FOR IMMEDIATE RELEASE
Monday, March 20, 2017
Office of Communications
404-656-3689
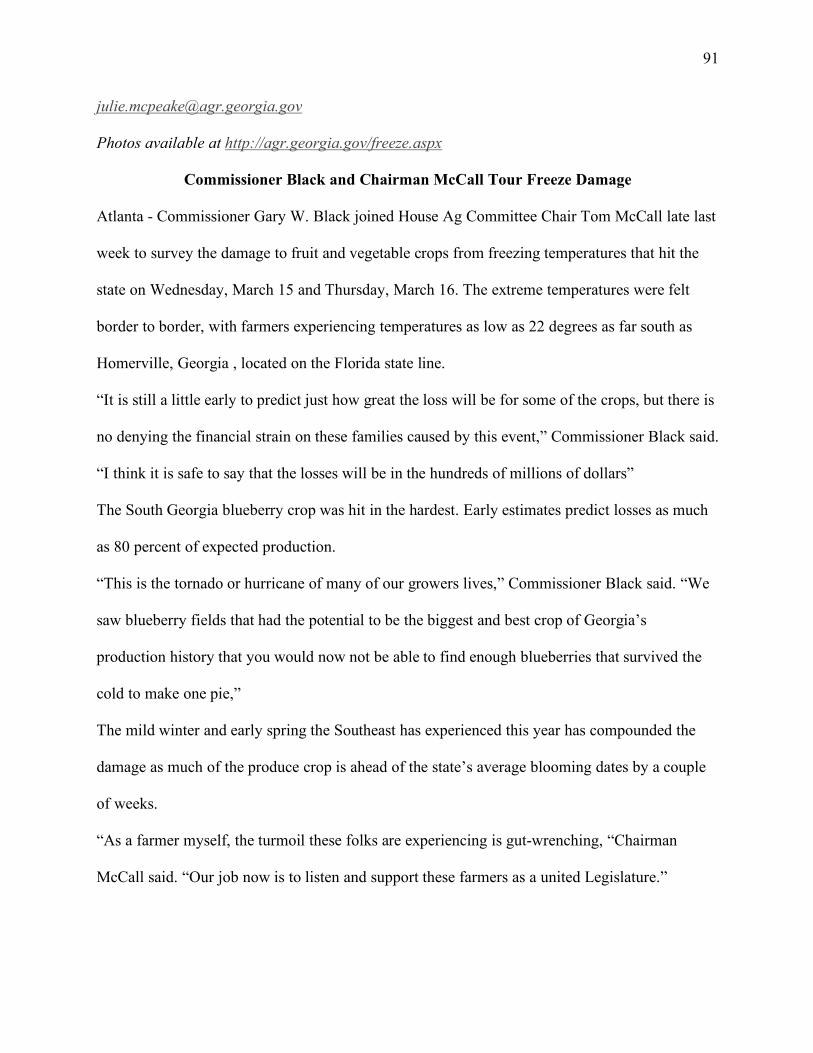
91
Photos available at http://agr.georgia.gov/freeze.aspx
Commissioner Black and Chairman McCall Tour Freeze Damage
Atlanta - Commissioner Gary W. Black joined House Ag Committee Chair Tom McCall late last
week to survey the damage to fruit and vegetable crops from freezing temperatures that hit the
state on Wednesday, March 15 and Thursday, March 16. The extreme temperatures were felt
border to border, with farmers experiencing temperatures as low as 22 degrees as far south as
Homerville, Georgia , located on the Florida state line.
“It is still a little early to predict just how great the loss will be for some of the crops, but there is
no denying the financial strain on these families caused by this event,” Commissioner Black said.
“I think it is safe to say that the losses will be in the hundreds of millions of dollars”
The South Georgia blueberry crop was hit in the hardest. Early estimates predict losses as much
as 80 percent of expected production.
“This is the tornado or hurricane of many of our growers lives,” Commissioner Black said. “We
saw blueberry fields that had the potential to be the biggest and best crop of Georgia’s
production history that you would now not be able to find enough blueberries that survived the
cold to make one pie,”
The mild winter and early spring the Southeast has experienced this year has compounded the
damage as much of the produce crop is ahead of the state’s average blooming dates by a couple
of weeks.
“As a farmer myself, the turmoil these folks are experiencing is gut-wrenching, “Chairman
McCall said. “Our job now is to listen and support these farmers as a united Legislature.”

92
Georgia was poised to be the largest blueberry producing state for 2017. The annual blueberry
farm gate value is over $255 million with a significantly greater economic impact. Other crops
affected by the freeze include peaches, strawberries, watermelons, peppers and other tabletop
vegetables. The peach crop could be down as much as two thirds.
###
About the GDA The Georgia Department of Agriculture (GDA) is the voice of the state’s
agriculture community. The department's mission is to provide excellence in services and
regulatory functions, to protect and promote agriculture and consumer interests, and to ensure an
abundance of safe food and fiber for Georgia, America, and the world by using state-of-the-art
technology and a professional workforce. For more information, visit www.agr.georgia.gov.
Julie McPeake