interactive browsing and navigation in relational databasesdchau/papers/16-vldb-etable.pdf ·...
TRANSCRIPT

Interactive Browsing and Navigationin Relational Databases
Minsuk Kahng, Shamkant B. Navathe, John T. Stasko, and Duen Horng (Polo) ChauGeorgia Institute of Technology
Atlanta, GA, [email protected], [email protected], [email protected], [email protected]
ABSTRACTAlthough researchers have devoted considerable attention to help-ing database users formulate queries, many users still find it chal-lenging to specify queries that involve joining tables. To help usersconstruct join queries for exploring relational databases, we pro-pose ETable, a novel presentation data model that provides userswith a presentation-level interactive view. This view compactlypresents one-to-many and many-to-many relationships within a sin-gle enriched table by allowing a cell to contain a set of entity ref-erences. Users can directly interact with this enriched table to in-crementally construct complex queries and navigate databases ona conceptual entity-relationship level. In a user study, participantsperformed a range of database querying tasks faster with ETablethan with a commercial graphical query builder. Subjective feed-back about ETable was also positive. All participants found thatETable was easier to learn and helpful for exploring databases.
1. INTRODUCTIONA considerable challenge for non-technical users of relational
databases is constructing join queries [29]. The join operation is re-quired for even simple data lookup queries since relational databasesstore information in multiple separate normalized tables. Althoughdatabase normalization provides many benefits for managing data(e.g., avoiding update anomalies), it significantly decreases the us-ability of database systems by forcing users to write many joinqueries to explore databases.
Constructing join queries is difficult for several reasons. Themain reason is that users find it difficult to determine which re-lations to join among many relations. Understanding the role ofeach relation that represents a relationship of interest and findingthe right join attributes are not trivial tasks, even when a schema di-agram is given. To tackle this challenge, users often write complexqueries by starting with a simpler query and iteratively adding oper-ators [37]. Although this iterative strategy is helpful, it is still chal-lenging because the format of join query results is hard to interpret.For example, consider a query that joins two relations in many-to-many relationships (e.g., Papers and Authors in Figure 3). Aresult of this query produces a large number of duplications (e.g.,
This work is licensed under the Creative Commons Attribution-NonCommercial-NoDerivatives 4.0 International License. To view a copyof this license, visit http://creativecommons.org/licenses/by-nc-nd/4.0/. Forany use beyond those covered by this license, obtain permission by [email protected] of the VLDB Endowment, Vol. 9, No. 12Copyright 2016 VLDB Endowment 2150-8097/16/08.
the title of each paper repeated as many times as the number of itsauthors). People represent the same information differently whenthey use a spreadsheet. For instance, they might create a cell con-taining multiple values separated by commas. Relational databasescannot represent data in this way because the relational model (asimplemented in most relational DBMSs) requires that data be atleast in the first normal form.
The usability challenge of writing complex queries has been stud-ied by many researchers. Although visual query builders help peo-ple formulate SQL queries [13], they separate query constructionand result presentation parts [29], introducing a usability gap be-tween users’ actions and their results [42, 37]. To overcome thislimitation, researchers argue that database interfaces need to adoptthe direct manipulation principle [42], a well-known concept in thehuman-computer interaction (HCI) area [29, 35]. It enables usersto iteratively specify operators by directly interacting with result in-stances using simple interactions [35]. Researchers also argue thatjoin query results should be represented in an easier-to-understandformat that improves the interpretation of query results. Jagadish etal. [30] proposed the notion of the presentation data model, whichthey defined as a full-fledged layer above the logical and physicalschema. This presentation layer allows users to better understandthe query results without requiring full awareness of the schema.All this research strongly suggests the need for developing databaseinterfaces that are usable, interactive, and interpretable.
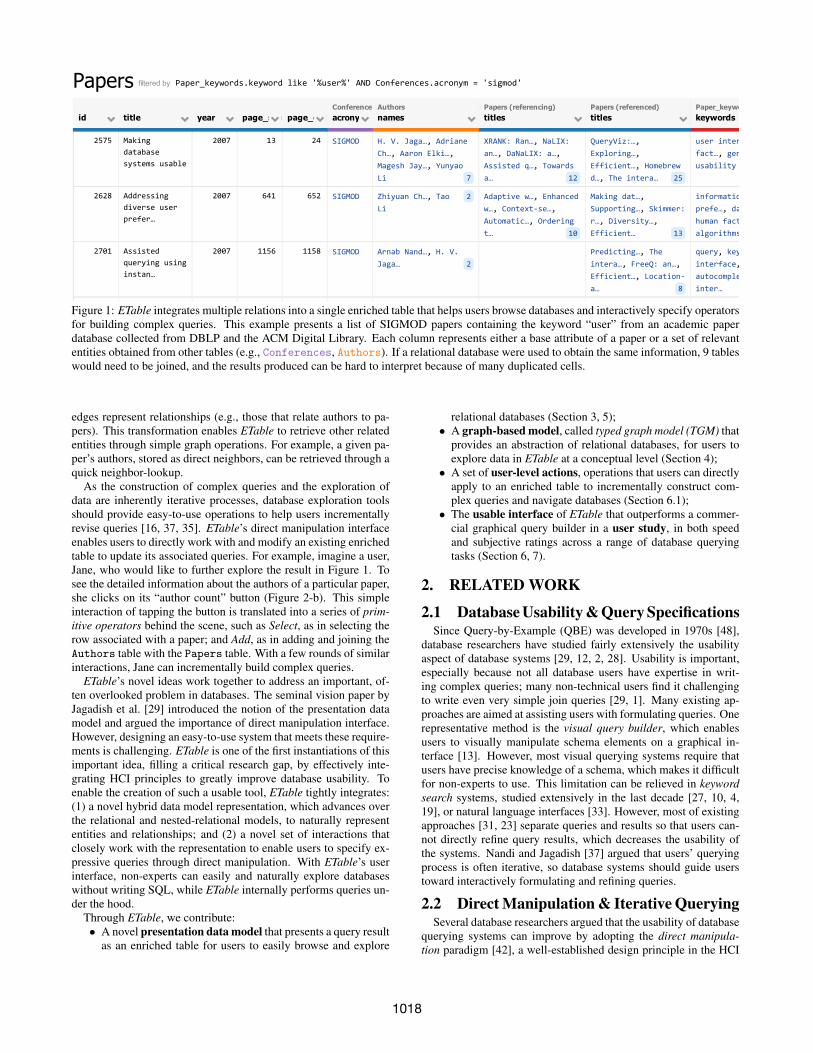
We present ETable, a novel presentation data model with whichusers can interactively browse and navigate databases on an entity-relationship level without writing SQL. ETable presents a queryresult as an enriched table in which each cell can contain a set ofentity references. By deliberately relaxing the first normal form, wecompactly represent one-to-many and many-to-many relationshipswithin a single table — a novel capability that enables users to moreeasily browse and interpret query results consisting of multiple re-lations. Figure 1 illustrates how ETable effectively presents a listof SIGMOD papers containing the keyword “user” from an aca-demic paper database collected from DBLP and the ACM DigitalLibrary (see Figure 3 for schema). Each row in ETable shows thebase attributes and relevant entities of a paper, such as its authorsand cited papers. If a relational database were used to obtain thesame information, 9 tables would need to be joined, and the resultsproduced would be hard to interpret (e.g., many duplicated cells).
To discover which relevant entities should be shown for eachrow, ETable uses a novel graph-based model called the typed graphmodel (TGM), which frees users from concerning themselves withthe complexity of the logical schema; users may instead focus onexploring and understanding the data set at the conceptual (or entity-relationship) level. The typed graph model stores relational data asgraphs in which nodes represent entities (e.g., authors, papers) and
1017
Papers filtered by Paper_keywords.keyword like '%user%' AND Conferences.acronym = 'sigmod'
id title year page_start page_endConferencesacronym
Authorsnames
Papers (referencing)titles
Papers (referenced)titles
Paper_keywordskeywords
2575 Makingdatabasesystems usable
2007 13 24 SIGMOD
7
H. V. Jaga…, AdrianeCh…, Aaron Elki…,Magesh Jay…, YunyaoLi 12
XRANK: Ran…, NaLIX:an…, DaNaLIX: a…,Assisted q…, Towardsa… 25
QueryViz:…,Exploring…,Efficient…, Homebrewd…, The intera…
6
user inter…, humanfact…, general ,usability , design
2628 Addressingdiverse userprefer…
2007 641 652 SIGMOD 2Zhiyuan Ch…, TaoLi
10
Adaptive w…, Enhancedw…, Context‐se…,Automatic…, Orderingt… 13
Making dat…,Supporting…, Skimmer:r…, Diversity…,Efficient… 5
informatio…, userprefe…, data explo…,human fact…,algorithms
2701 Assistedquerying usinginstan…
2007 1156 1158 SIGMOD2
Arnab Nand…, H. V.Jaga…
8
Predicting…, Theintera…, FreeQ: an…,Efficient…, Location‐a… 8
query, keyword,interface,autocomple…, userinter…
1928 SkewTune:mitigatingskew in m…
2012 25 36 SIGMOD
4
YongChul K…,Magdalena…, BillHowe, Jerome A.… 3
A platform…, Alatency…, Highly‐Ava…
6
Minimal Ma…,SpongeFile…, Shark:SQL…, Fast data…,Effective…
9
skew, parallel d…,design, query proc…,performanc…
1953 Towards aunifiedarchitecture…
2012 325 336 SIGMOD
4
Xixuan Fen…, ArunKumar, Benjamin R…,Christophe… 4
Towards a…, MCDB: amo…, MauveDB: s…,Large‐scal…
6
Sparkler:…, LearningG…, A performa…,Knowledge…, Shark:SQL…
10
theory, user‐defin…,measuremen…,incrementa…,design
2326 Efficientlyincorporatinguser…
2009 87 100 SIGMOD
4
Xiaoyong C…, Ba‐QuyVuo…, AnHai Doan,Jeffrey F.…
7
Provenance…, Pay‐as‐you…, An Interac…, Tosearch…, Interactiv…
5
Building,…,Automatica…,Integratin…,Provenance…, Deco:decl…
8
informatio…, userfeedb…, systems ,informatio…, design
1875 Interactivedata miningwith 3…
2013 1009 1012 SIGMOD
4
Elke Achte…, Hans‐Peter…, Erich Schu…,Arthur Zim…
3Efficient…, FindingGe…, Computing…
3
SigniTrend…,Subsamplin…,Representa… 4
visualizat…, userinter…, high‐dimen…,parallel c…
2688 MashMaker:mashups forthe mas…
2007 1116 1118 SIGMOD2
Robert Enn…, Minos N.G… 3
VizDeck: s…, VizDeck:a…, Exploring… 3
human fact…, end‐users , design
2317 Crowds,clouds, andalgorithms…
2010 1259 1260 SIGMOD
5
Sihem Amer…, AnHaiDoan, Jon M. Kle…,Nick Kouda…, MichaelJ.…
2Early onli…, Pay‐as‐you… 2
CrowdDB: a…,StreamRec:…
16
security,experiment…,economics,user/machi…,reliabilit…
2219 Load‐balancedquerydisseminat…
2010 471 482 SIGMOD
4
Emiran Cur…, AlinDeuts…, K. K. Rama…,Divesh Sri… 3
Speeding u…,Distribute…, P‐ring:an…
1Privacy pr…
12
online com…,publisher…, loadbalan…, design, usercenso…
2675 ConEx: a 2007 1076 1078 SIGMOD Chaitanya…, Maksims Toward a P…, 1ParaTimer:… graphical…, design ,
HISTORY
1. Open 'Papers' table
2. Filter 'Papers' table by(Paper_keywords like '%user%')
3. Sort table by # of Papers(referenced)
4. Filter 'Papers' table by(Paper_keywords like '%user%' &Conferences = 'sigmod')
5. Sort table by # ofPaper_keywords
6. Sort table by # of Papers(referenced)
ETABLE BUILDER Choose a table
Figure 1: ETable integrates multiple relations into a single enriched table that helps users browse databases and interactively specify operatorsfor building complex queries. This example presents a list of SIGMOD papers containing the keyword “user” from an academic paperdatabase collected from DBLP and the ACM Digital Library. Each column represents either a base attribute of a paper or a set of relevantentities obtained from other tables (e.g., Conferences, Authors). If a relational database were used to obtain the same information, 9 tableswould need to be joined, and the results produced can be hard to interpret because of many duplicated cells.
edges represent relationships (e.g., those that relate authors to pa-pers). This transformation enables ETable to retrieve other relatedentities through simple graph operations. For example, a given pa-per’s authors, stored as direct neighbors, can be retrieved through aquick neighbor-lookup.
As the construction of complex queries and the exploration ofdata are inherently iterative processes, database exploration toolsshould provide easy-to-use operations to help users incrementallyrevise queries [16, 37, 35]. ETable’s direct manipulation interfaceenables users to directly work with and modify an existing enrichedtable to update its associated queries. For example, imagine a user,Jane, who would like to further explore the result in Figure 1. Tosee the detailed information about the authors of a particular paper,she clicks on its “author count” button (Figure 2-b). This simpleinteraction of tapping the button is translated into a series of prim-itive operators behind the scene, such as Select, as in selecting therow associated with a paper; and Add, as in adding and joining theAuthors table with the Papers table. With a few rounds of similarinteractions, Jane can incrementally build complex queries.
ETable’s novel ideas work together to address an important, of-ten overlooked problem in databases. The seminal vision paper byJagadish et al. [29] introduced the notion of the presentation datamodel and argued the importance of direct manipulation interface.However, designing an easy-to-use system that meets these require-ments is challenging. ETable is one of the first instantiations of thisimportant idea, filling a critical research gap, by effectively inte-grating HCI principles to greatly improve database usability. Toenable the creation of such a usable tool, ETable tightly integrates:(1) a novel hybrid data model representation, which advances overthe relational and nested-relational models, to naturally represententities and relationships; and (2) a novel set of interactions thatclosely work with the representation to enable users to specify ex-pressive queries through direct manipulation. With ETable’s userinterface, non-experts can easily and naturally explore databaseswithout writing SQL, while ETable internally performs queries un-der the hood.
Through ETable, we contribute:• A novel presentation data model that presents a query result
as an enriched table for users to easily browse and explore
relational databases (Section 3, 5);• A graph-based model, called typed graph model (TGM) that
provides an abstraction of relational databases, for users toexplore data in ETable at a conceptual level (Section 4);• A set of user-level actions, operations that users can directly
apply to an enriched table to incrementally construct com-plex queries and navigate databases (Section 6.1);• The usable interface of ETable that outperforms a commer-
cial graphical query builder in a user study, in both speedand subjective ratings across a range of database queryingtasks (Section 6, 7).
2. RELATED WORK
2.1 Database Usability & Query SpecificationsSince Query-by-Example (QBE) was developed in 1970s [48],
database researchers have studied fairly extensively the usabilityaspect of database systems [29, 12, 2, 28]. Usability is important,especially because not all database users have expertise in writ-ing complex queries; many non-technical users find it challengingto write even very simple join queries [29, 1]. Many existing ap-proaches are aimed at assisting users with formulating queries. Onerepresentative method is the visual query builder, which enablesusers to visually manipulate schema elements on a graphical in-terface [13]. However, most visual querying systems require thatusers have precise knowledge of a schema, which makes it difficultfor non-experts to use. This limitation can be relieved in keywordsearch systems, studied extensively in the last decade [27, 10, 4,19], or natural language interfaces [33]. However, most of existingapproaches [31, 23] separate queries and results so that users can-not directly refine query results, which decreases the usability ofthe systems. Nandi and Jagadish [37] argued that users’ queryingprocess is often iterative, so database systems should guide userstoward interactively formulating and refining queries.
2.2 Direct Manipulation & Iterative QueryingSeveral database researchers argued that the usability of database
querying systems can improve by adopting the direct manipula-tion paradigm [42], a well-established design principle in the HCI
1018

and information visualization areas. Acknowledging that users’needs are often ambiguous rather than precisely specifiable, re-searchers have developed many tools that enable users to interac-tively browse and explore databases [28, 11, 43]. Although they arenot specifically designed for relational databases, a number of inter-active visualization systems for entity-relationship data have beendeveloped by information visualization researchers [32, 22, 21, 36].For example, NetLens [32] visualizes relationships between twoselected entity types in many-to-many relationships, and Graph-Trail [22] visually summarizes each entity type and enables usersto switch between entities. Although these visualization systemsprovide an overview of data sets, they are not suited for examiningdatabase instances along with attributes. In exploring and analyz-ing instance-level information, tabular interfaces, including spread-sheets, are better suited and often preferred by database users [24,46, 35, 17, 25]. Tyszkiewicz [46] argued that spreadsheets can playa role as a database engine by using functions and macros. Liuand Jagadish [35] formally defined operators that interactively per-form grouping operations within a spreadsheet. However, since therigid tabular structure does not effectively present many-to-manyrelationships, the spreadsheet suffers from the same problems thatrelational databases have (i.e., a large number of duplications). Toovercome this limitation, Jagadish et al. [30] proposed using a pre-sentation view layer on top of underlying databases, which is thenotion of the presentation data model, defined as a full-fledgedlayer on top of the logical and physical models. The challenge is todesign presentation data models that help people easily understandjoin query results and interact with them.
2.3 Data Models for Effective PresentationTo develop an intuitive structure for presentation data models, we
review a number of data models that conceptualize the mini-worldrepresented in databases. One such example is the nested relationalmodel, studied in the 1980s, which allows each cell to contain an-other table that presents one-to-many relationships in a single ta-ble [40, 39]. The nested model has been used in several studies fordesigning database interfaces. Bakke et al. [7] recently designeda direct manipulation interface for nested-relational databases, andDataPlay [3] also used the nested model for presenting query re-sults. However, the model suffers from scalability issues becausethe sizes of the nested tables often become huge when an inner ta-ble contains a large number of associated rows or columns [8]. Oneway to tackle this problem is to replace the inner table with a set ofpointers. For example, the object-relational model lets attributes beuser-defined types that include pointers [44]. We adapt this idea byintroducing an entity reference which compactly represents relatedentities. Another class of the data models that effectively concep-tualize the real-world is the graph data model [6, 26, 14, 45]. Itrepresents entities as nodes and relationships as edges based on theentity-relationship model [18, 9]. Catarci et al., [15] used a graph-style translation layer for their visual querying system. To pro-vide users with an easy-to-understand view at an entity-relationshiplevel, we also maintain a graph-style model, transformed from re-lational databases, under the presentation view.
3. INTRODUCING ETABLEBefore we describe the technical details of the proposed data
models, we introduce ETable by describing what users see and howthey can interact with it.
Representation. Figure 1 illustrates an enriched table that wecall Etable. As mentioned earlier, it presents a list of SIGMODpapers containing the keyword “user” from our collected database(see Figure 3 for schema). Each row of Etable represents a single
Results for each of the three actions:
Click count
a
b
c
Click
Pivot button
b cClick
reference
a
Figure 2: Users can iteratively specify user-level actions by inter-acting with ETable. In this example, users can examine furtherinformation about paper authors in three ways: (a) clicking on anauthor’s name; (b) clicking a paper’s author count; (c) clicking onthe pivot button.
entity of the selected entity type (i.e., Papers); its column rep-resents either a base attribute of the entity (e.g., year) or a set ofrelevant entities (e.g., authors, keywords). This representation isformed by pivoting a query result of a join of multiple tables (e.g.,Papers, Paper keywords, Authors) to a user-selected entity type(e.g., Papers). One advantage of this representation is that it cansimultaneously present all relevant information about an entity ina single row (e.g., authors, keywords, citations). The relationalmodel cannot represent all of this information in a single relationwithout duplications because every attribute value must be atomic.For instance, when the Papers table is joined with the Authors
table, the paper information is repeated as many times as the num-ber of authors, which prevents users from quickly interpreting theresults. We integrate information spread across multiple tables intoa single table by allowing each cell to contain a set of references toother entities.
Interactions. Users can interact with Etable to explore furtherinformation. For instance, to examine further information aboutthe authors of the papers in Figure 1, users can create a new Etablethat lists authors in several ways, as depicted in Figure 2: (1) Ifusers are interested in one of the authors (e.g., Arnab Nandi), theycan click on his name to create a new Etable consisting of one rowthat presents its attributes; (2) if users want to list the completeset of authors (e.g., all seven authors of the paper titled “Makingdatabase systems usable”), they can click on the author count in
1019

Form Source Determining factor for mapping from a relational table
Node types Entity tables Relation with a single-attribute primary keyMulti-valued attributes Relation with two attributes; one of them is a foreign key of an entity relationSingle-valued categorical attributes Attribute of low cardinality
Edge types One-to-many relationships Foreign key between two entity relationsMany-to-many relationships Relation with a composite primary key; both are foreign keys of entity relationsMulti-valued attributes From an entity table to a multi-valued attributeSingle-valued categorical attributes From an entity table to a categorical attribute
Table 1: Categories of node and edge types based on how they are translated from relational schema
Paper_Authors
paper_id author_id order
Authors
id name institution_id
Papers
id conference_id title year page_start page_end
Paper_Keywords
paper_id keyword
Paper_References
paper_id ref_paper_id
Foreign key
Primary key
Conferences
id short title
Institutions
id name country
id
Figure 3: The relational schema of the academic data set used inthis work, 7 relations in total.
the right corner of the cell (i.e., 7); and (3) if users want to listand sort the entities across the entire rows in a column (e.g., Whowrote the most papers about “user” in SIGMOD?), they can clickon the pivot button on the column menu, which groups and sortsthe authors based on the number of papers they have written. Bygradually applying these operations, users can incrementally makesense of data and build complex queries.
4. TYPED GRAPH MODELIn this section, we define a typed graph model (TGM) which en-
ables users to explore relational databases on a conceptual entity-relationship level without having to know a logical schema. A rela-tional schema and instances are translated into a database schemagraph and database instance graph as a preprocessing step, and alloperations specified by users on the ETable interface are executedover these graphs, not relational databases.
We represent entities and relationships as a graph with types andattributes. Each entity forms a node, and relationships among theentities become edges. A typed graph database (TGDB) consistsof a TGDB schema graph, GS , and a TGDB instance graph, GI .
Definition 1. Schema Graph. A TGDB schema graph GS isa tuple (T ,P), where T represents a set of node types (or entitytypes1), and P ⊆ T × T represents a set of edge types (or rela-tionship types). Each node type τi ∈ T is a tuple (αi,Ai, βi),where αi denotes the name of a node type, Ai is a set of single-valued attributes, and βi is a label attribute chosen from one of theattributes and used to represent node instances of this type. Eachedge type ρ ∈ P also has a name and a set of attributes. We denotethe source and target node types of ρ as source(ρ) and target(ρ),respectively. All the edge types, except self loops, are bidirectional.
1We use the words “node” and “entity” interchangeably. A nodeis used more formally; an entity is used more for presentation tousers.
Institutions Institutions: country
PapersConferences
Authors
Papers: yearPaper_keywords:
keyword
Figure 4: TGDB schema graph constructed from the relationalschema in Figure 3. Each rectangle represents a node type, andeach edge is an edge type.
Papers
Institutions
Paper_Keywords:
keyword
Authors
Papers: year
Institutions: country
Conferences
……
…
…
…
… …
2014
2007
2011
H. V. Jagadish
Arnab Nandi
Jeff Heer S. Korea
KDD
CHI
Univ. of Washington
Univ. of Michigan
Seoul National Univ.
data cleaning
usability
user interface
USA
SIGMOD Making database system...
Schema-free SQL
Wrangler: interactive vis...
India
Figure 5: A part of the TGDB instance graph constructed fromthe academic data set used in this paper, following the schema inFigure 4. Node types shown in blue italic font.
Definition 2. Instance Graph. A TGDB instance graph GI , isa tuple (V,E), where V represents a set of nodes (or entities) andE represents a set of edges (or relationships) between two nodes.Every instance graph GI has a corresponding schema graph GS ,and the instance graph has a node type mapping function typeτ :V → T and an edge type mapping function typeρ : E → P thatpartition nodes V into V1, ..., VnT and edges E into E1, ..., EnP .Each node v ∈ V consists of a set of attribute values v[Aij ] for theattributes of the corresponding node type and has a label defined aslabel(v) = v[βi]. Each edge e ∈ E consists of a set of attributevalues e[Aij ] for its type. We denote the source and target nodes ofe as source(e) and target(e), respectively.
The typed graph model, similar to many graph data models [6,26, 45], is much more effective for conveying a conceptual under-standing of the mini-world represented in databases than the rela-tional model. As it abstracts relational databases, users can ignorethe logical and physical representation of data. Users can also eas-ily understand the structure of data, since nodes always represent
1020

entities and edges represent relationships, Unlike TGM, the rela-tional model is a mixture of entities, relationships, and multival-ued attributes. Although some existing graph models are more ex-pressive for representing a variety of relationships (e.g., hierarchi-cal parent-child relationships among entities), we simply use nodesand edges to focus on making the semantics of the underlying re-lations more explicit by mapping to entities and relationships thatthey represent in the real world.
Relational databases can be translated into the TGDB schemaand instance graphs in a near-automatic process. We adapt the re-verse engineering literature pertaining to translating relational data-bases into several graph-style models [9, 20, 41]. A detailed proce-dure presented in Appendix A includes an analysis of a relationalschema based on primary keys, foreign keys, and cardinalities forclassifying tables into several categories, and a series of actions thatcreate the schema graph. Table 1 summarizes the categories of nodeand edge types based on how they are determined from relationalschema. Figures 4 and 5 illustrate a schema graph and a part of theinstance graph constructed from an academic publication databasewhose schema is shown in Figure 3.
5. ETABLE PRESENTATION DATA MODELWe present our ETable presentation data model for usable explo-
ration of entities and relationships in databases.
5.1 Enriched TableA query result in the ETable model is presented as an enriched
table, which we also call ETable. An ETableR has a set of columnsA and consists of a set of rows r ∈ R. The columns are catego-rized into two types: single-attribute columns and entity-referencecolumns. The value of the single-attribute column r[A] is atomicas it is in the relational model. The value of the entity-referencecolumn r[A] contains a single or a set of entity references. The en-tity reference refers to another node in the database instance graph.Unlike a foreign key in the relational model, each entity referenceis shown as a clickable label, similar to a hyperlink on a webpage.Just like how a hyperlink’s hypertext describes the webpage thatthe link points to (instead of its URL), for example, ETable repre-sents an author’s entity reference by the author name (instead of theauthor ID).
The entity-reference columns present rich information spreadacross multiple relations within a single enriched table. While aforeign key attribute in the relational model contains only a singlereference for a many-to-one relationship because of the first normalform, an entity-reference column can represent one-to-many re-lationships, many-to-many relationships, or multivalued attributesin a single column. Furthermore, the entity-reference column hasadvantages over the nested relational model which requires muchscreen space as it squeezes another table into cells, leading to ineffi-cient browsing. Unlike the nested model, ETable presents clickablelabels that compactly show information and allow users to furtherexplore relevant information.
5.2 ETable SpecificationAn ETable can be specified by selecting specific elements of the
TGDB database schema and instance graphs introduced in the pre-vious section.
Definition 3. ETable Query Specification. An ETableR is spec-ified by a query pattern Q, which is a tuple (τa, T, P, C).
1. Primary node type τa: It is one of the node types in theschema graph. Each row of ETable will represent a singlenode instance of the primary node type.
Authors Institutions
country like ‘%Korea%’
PapersConferences
acronym = ‘SIGMOD’ year > 2005
Figure 6: An example query pattern in a diagrammatic notation.It represents a query that finds a list of researchers who have pub-lished papers at SIGMOD after 2005 and are currently working atinstitutions in Korea.
2. Participating node types T : It is a set of node types cho-sen from the node types in the schema graph (i.e., T ={t1, ..., tnT },∀ti ∈ T ). It must contain the primary nodetype τa (i.e., τa ∈ T ). It determines the scope of data in-stances and is similar to a set of relations in SQL FROMclauses. A node type in the schema graph can exist multipletimes in the participating node types, like a relational algebraexpression can contain the same relation multiple times.
3. Participating edge types P : It is a set of edge types selectedfrom the schema graph (i.e., P = {p1, ..., pnP },∀pi ∈ P).It connects the participating nodes types, thus all the sourceand target nodes of these edges should exist in the partic-ipating node types (i.e., source(pi) ∈ T ∧ target(pi) ∈T,∀pi ∈ P).
4. Selection conditions for node types C: It is a set of selec-tion conditions C = (C1, ..., CnT ) applied to each of theparticipating node types, i.e., Ci applies to ti ∈ T .
A query pattern can be represented as an acyclic graph whereone of the nodes is marked as a primary node type and any nodecan have selection conditions. For example, the query pattern inFigure 6 represents a query that produces a list of researchers whohave published papers at SIGMOD after 2005 and are currentlyworking at institutions in Korea.
5.3 Incremental Query Building with Primi-tive Operators
In ETable, a query pattern can be constructed and updated byprimitive operators. Each operator builds on an existing ETablequery to generate a new, updated ETable query. In this subsection,we describe these operators in detail. In Section 6.1, we will de-scribe how users’ actions performed on the ETable user interfacewill invoke these operators. Formally, given an ETable specifica-tion Q(τa, T, P, C), each of the following operator creates a newspecification Q′(τ ′a, T ′, P ′, C′), except the Initiate operator whichcreates a new ETable from scratch.
1. Initiation. A new ETable can be created by selecting oneof the node types τk in the schema graph. Its result lists thecorresponding nodes.
Initiate(τk) = Q′
where τ ′a = τk, T′ = {τk}, P ′ = {}, and C = {}.
2. Selection. ETable rows can be filtered based on their columns,similar to the selection operator in the relational model. Ap-plying a selection condition Ck to the primary node type τafilters the rows of the current ETable.
Select(Ck, Q) = Q′
where τ ′a = τa, T′ = T, P ′ = P, and C′a = Ck.
1021

Primitive Operators applied Corresponding User-Level Actions
Clicking
”Conferences” table
in default view lists
all conferences
Clicking paper count at the end of the row
for SIGMOD lists all SIGMOD papers
Clicking pivot button groups authors
and ranks them by paper count;
The result shown at bottom right
(Divesh Srivastava ranked first).
Previous result preserved at top right
to help users interpret transformation.
Opening the filter window and specifying a condition
filters papers down to those published after 2005
Open(“Conferences”)
Filter(“year>2005”)
Pivot(“Authors”)
Seeall(“SIGMOD”, “Papers”)
Initiate(“Conferences”)
Conferences
P1
Select(“acronym = ‘SIGMOD”)
Conferencesacronym = ‘SIGMOD’
P2
Add(“Papers”)
PapersConferences
acronym = ‘SIGMOD’
P3
Select(“year > 2005”)
PapersConferences
acronym = ‘SIGMOD’ year > 2005
P4
Add(“Authors”)
AuthorsPapersConferences
acronym = ‘SIGMOD’ year > 2005
P5
Add(“Institutions”)
Authors InstitutionsPapersConferences
acronym = ‘SIGMOD’ year > 2005
P6
Select(“country like ‘%Korea%’”)
Authors Institutions
country like ‘%Korea%’
PapersConferences
acronym = ‘SIGMOD’ year > 2005
P7
Shift(“Authors”)
Authors Institutions
country like ‘%Korea%’
PapersConferences
acronym = ‘SIGMOD’ year > 2005
P8
U1
U2
U3
U4
Figure 7: An example of incrementally building a complex query: find a list of researchers who have published papers at SIGMOD after2005 and are currently working at institutions in Korea. Left: constructing the query through a series of ETable primitive operators. Right:corresponding user actions in the interface that invoke the operators (Section 6.1 describes the user-level actions in detail). User actions forthe operators P6-P8, similar to the others shown in the figure, are omitted for brevity.
3. Adding a node type. Another node type can be added toa query pattern to examine how it is related to the currentprimary node type. It corresponds to adding a join operatorin the relational model. Selecting one of the node types thatare linked to the primary node type τa by an edge type ρk(i.e., source(ρk) = τa), adds it to the participating nodetypes in the current query Q.
Add(ρk, Q) = Q′
where τ ′a = target(ρk), T ′ = T ∪ {target(ρk)},P ′ = P ∪ {ρk}, and C′ = C ∪ {}.
4. Shifting focus to another participating node type. The pri-mary node type τa can be changed to one of the other par-ticipating node types τk. It can be thought of as representingthe current join result from a different angle.
Shift(τk, Q) = Q′
where τ ′a = τk, T′ = T, P ′ = P, and C′ = C.
The above primitive operators enable us to build any complexqueries by incrementally specifying the operators one-by-one. Fig-ure 7 (left) illustrates the query construction process consisting of 8operators. A new query pattern can be created with Initiate; Selec-tion conditions can be added with Select, just like writing expres-sions in WHERE clauses in SQL; and node types can be added withAdd, just like adding relations to FROM clauses and setting one ofthem as a GROUP BY attribute. Also, the primary node type can bechanged with Shift, similar to changing the GROUP BY attribute.A sequence of these operators specified constitutes a query patternin the ETable model. These operators can be invoked by users onthe user interface with user-level actions, which we will describedetails in Section 6.1. The right side of Figure 7 shows how userscan specify the same query through the user interface.
5.4 Query ExecutionA query pattern is executed to produce a result in the ETable
format. The execution process is divided into two steps: instancematching and format transformation. The first step extracts matchednode instances from the TGDB instance graph, and the second steptransforms a result from the first step into the ETable format.
1022

Conf Paper
1 1
1 4
1 5
1 8
Conf Paper Autho Insti
1 1 1 3
1 4 1 3
1 4 4 3
1 4 11 8
1 5 1 3
1 8 1 3
1 8 4 3
id name Insti Papers Conf
1 Bob 3 1,4,5,8 1
4 Mark 3 4,8 1
11 Chad 8 4 1
Conf
1
Paper Autho
1 1
1 2
4 1
4 4
4 11
5 1
8 1
8 4
Paper
1
3
4
5
7
8
11
..
Autho
1
2
3
4
5
6
7
..
Insti
3
4
8
9
14
20
21
..
Autho Insti
1 3
2 1
3 3
4 3
5 7
6 7
7 2
.. ..
𝜎𝑎𝑐𝑟𝑜𝑛𝑦𝑚=′𝑆𝐼𝐺𝑀𝑂𝐷′(𝑅𝐶𝑜𝑛𝑓) ∗𝐶𝑜𝑛𝑓−𝑃𝑎𝑝𝑒𝑟𝑠 𝜎𝑦𝑒𝑎𝑟>2005(𝑅𝑃𝑎𝑝𝑒𝑟𝑠) ∗𝑃𝑎𝑝𝑒𝑟𝑠−𝐴𝑢𝑡ℎ𝑜𝑟𝑠 𝑅𝐴𝑢𝑡ℎ𝑜𝑟𝑠 ∗𝐴𝑢𝑡ℎ𝑜𝑟𝑠−𝐼𝑛𝑠𝑡 𝜎𝑐𝑜𝑢𝑛𝑡𝑟𝑦 𝑙𝑖𝑘𝑒 ′%𝐾𝑜𝑟𝑒𝑎%′(𝑅𝐼𝑛𝑠𝑡)
Instance matching Format transformation
Authors
Intermediate graph relation Final result in ETable format
Figure 8: ETable query execution process consists of two steps: (1) the instance matching step which extracts matched instances from theinstance graph and (2) the format transformation step which transforms the instances into the ETable format.
5.4.1 Instance MatchingThe instance matching process finds a set of matched instances
for a given query pattern. Formally, it returns a graph relation RG,which consists of a set of tuples, each of which contains a list ofnode instances in the database instance graph. The graph relationis generated with an instance matching function m(Q), which con-sists of a series of operations. The operations constitute primitiveswhich make up a graph relation algebra.
A graph relationRG, similar to a relation in the relational model,consists of a set of tuples with a set of attributes. The schema of thegraph relation is defined as a set of node types A = (A1, ..., An)where Ai ∈ T . In other words, each attribute Ai corresponds to anode type. The node type τj determines the domain of the attribute(i.e., domaini = {v|v ∈ Vj}). A base graph relation is defined asa graph relation with a single attribute. In other words, each nodetype τ1, ..., τn produces a base graph relation RG1 , ..., RGn . A non-base graph relation can be created by applying the following graphrelation operators to the base graph relations.
1. Selection. It filters tuples of a graph relation R using a se-lection condition Ci applicable to one of the node types Ai.
σCi(RG) = {r|r ∈ RG ∧ r[Ai] satisfies Ci}.
2. Join. It joins two graph relations R1 and R2 using edgetypes ρk. The attributes of the created graph relation is aconcatenation of the attributes of the two graph relations.
RG1 ∗ρk RG2 = {(r1, r2)|r1 ∈ RG1 ∧ r2 ∈ RG2∧ source(ρk) ∈ A1 ∧ target(ρk) ∈ A2}.
We use a symbol, ∗, to differentiate it from the relationalcorrespondence, ./, and not to be confused with natural join.
3. Projection. It removes all attributes of the graph relationsexcept the given attribute. Duplicated rows are eliminated.
ΠAi(RG) = {r[Ai]|r ∈ RG}.
These operators enable us to define an instance matching func-tion m(Q). In fact, this function only requires the Selection andJoin operators: the Projection operator will be used later in the for-mat transformation step.
Definition 4. Instance Matching. Given a ETable query patternQ(τa, T, P, C), a matching function m returns a graph relation RG
containing node instances in the instance graph GI .
m(Q) = σC1(RG1 ) ∗p1 σC2(RG2 ) ∗p2 ... ∗pn−1 σCn(RGn ),
where RGi is a base graph relation obtained from a node type ti ∈T , i.e., RGi = {v|v ∈ V ∧ type(v) = ti}, Ci ∈ C is a selection
condition for Ri, and pi ∈ P is one of the edge types that joinsgraph relations on both sides, i.e., pi = {p|p ∈ P ∧ source(p) ∈{t1, ...ti} ∧ target(p) ∈ {ti+1, ...tn}}.
Figure 8 (left) illustrates the instance matching process. It returnsa graph relation, which is an intermediate format to be transformedinto the ETable format.
5.4.2 Format TransformationA graph relation obtained from the instance matching function
is transformed into the ETable format. We describe how rows andcolumns of ETable are determined from it.
The rows of ETable consist of nodes of the primary node type,filtered by all selection conditions in the query pattern. They areextracted from the instance matching result:
R = {v|v ∈ Πτa(m(Q(τa, T, P, C)))}.
Given the result of the instance matching function, all attributes ex-cept the attribute representing the primary node type are discarded,and then, each of distinct node in that column becomes a row.
ETable has three types of columns to present rich information foreach row. In addition to the attributes of the primary node types,which we call base attributes Ab, we introduce two other typesof columns for presenting a set of entity references: participatingnode columns, At, and neighbor node columns, Ah.
1. List of base attributes Ab: It is a full set of the attributesA of the primary node type τa. The value of the columnAj ∈ Ab would be a single value:
r[Aj ] = v[Aj ].
2. List of participating node types At: It is a set of all thenode types T in the query pattern, except the primary nodetype τa, i.e., At = {τ |τ ∈ T ∧ τ 6= τa}. The value of thecolumn Aj ∈ At would be a set of entity references:
r[Aj ] ={u|u ∈ V ∧Aj = type(u)
∧Πtype(u)στa=r(m(Q))}.
3. List of neighbor node types Ah: It is a set of all the neigh-boring node types of the primary node type τa in the schemagraph regardless of the query pattern, i.e.,Ah = {(ρ, τ)|τ ∈T ∧ ρ ∈ P ∧ source(ρ) = τa ∧ target(ρ) = τ}. The valueof the column Aj ∈ Ah would be a set of nodes references:
r[Aj ] ={u|u ∈ V ∧ e ∈ E ∧Aj = (type(e), type(u))
∧ u = target(e) ∧ r = source(e)}.
1023

12 3
4
Figure 9: The ETable interface consists of (1) the default table list for initiating a query, (2) the main view presenting query results, (3) theschema view showing a query pattern, and (4) the history view listing operators specified by users. Users can build queries and exploredatabases by directly interacting with the interface.
Figure 8 (right) illustrates the results produced from the formattransformation process. The first two columns are base attributes,and the rest of the columns are participating node columns. Weomit neighbor node columns as some of these columns are the sameas the participating node columns.
By transforming the graph relation into the ETable format, wecompactly present join query results without duplications. Eachrow of ETable is uniquely determined by a node of a primary nodetype. The participating node columns show all the other entitytypes in the query pattern with respect to the primary node type.This transformation process is similar to setting one of the relationsas a GROUP BY attribute in SQL, but while GROUP BY aggre-gates the corresponding instances into a single value (i.e., COUNT,AVG), ETable presents a list of the corresponding instances as en-tity references. The neighbor node columns are also useful fordescribing the rows of the ETable, although information in thesecolumns is not obtained from the graph relation. These columns en-able users to browse one-to-many or many-to-many relationships.Moreover, they provide users with a preview of possible new joinoperations as it presents all the join candidates. For instance, aETable in Figure 1 consists of many neighbor node columns (e.g.,Authors) that helps users browse rich information about each paper.
6. INTERFACE & SYSTEM DESIGNETable’s interface (Figure 9) consists of four components: (1)
the default table list, (2) the main view, (3) the schema view, and (4)the history view. The default table list presents a list of entity typesin the schema graph. Users can pick one from the list to initiatea query. The main view presents an ETable executed based on aquery pattern which is graphically shown over the schema view.Users can directly interact with the main view to update the currentquery. The list of actions specified by users is presented on thehistory view, which allows users to revert to a previous state.
6.1 User-Level ActionsUsers can update the current query pattern by directly interact-
ing with ETable via user-level actions. As shown in Figure 7, theseactions in turn invoke their corresponding primitive operators (dis-cussed in Section 5.3).
1. Open a new table. Users can open a new table by clicking anode type τk on the default table list. The action invokes theInitiate(τk) operator (Fig 7: action U1).
Open(τk) = Initiate(τk).
2. Filter. Users can filter the rows of the current ETable byinducing selection conditions via a popup window at the col-umn header (Fig 7: action U3). Besides the base attributes,users can also filter rows by the labels of the neighbor nodescolumns (e.g., authors’ names), which is translated into sub-queries. We currently provide only a conjunction of pred-icates, but it is straightforward to provide disjunctions andmore operations. The action invokes the Select operator.
Filter(C,R) = Select(C,R).
3. Pivot. Users can change the primary node type by clickingthe pivot button on the context menu for neighbor or partici-pating node columns. It calls the Add operator if the columnis the neighbor node type (Fig 7: action U4); it performs theShift operator if it is the participating node type.
Pivot(ρl, R) = Add(ρl, R),
or Pivot(τk, R) = Shift(τk, R).
4. See a particular node. When users are interested in one ofthe entity references, they can click it to create a new ETableconsisting of a single row presenting the clicked entity. Un-like the above actions, it invokes two primitive operators: itinitiates a new ETable, and then perform the Select operatorto show the single node. For the clicked node vk:
Single(vk, R) =Select(C, type(vk), Initiate(type(vk)),
where C = {u|u = vk}.
5. See all related nodes. When users are interested in a fulllist of entity references, they can click a number (i.e., entityreference count) in the right corner of a cell (Fig 7: actionU2). It also encapsulates two primitive operators. The opera-tors invoked are different depending on whether the selected
1024

Task Category #Relations
1. Find the year that the paper titled ‘Making database systems usable’ was published in. Attribute 12. Find all the keywords of the paper titled ‘Collaborative filtering with temporal dynamics’. Attribute 23. Find all the papers that were written by ‘Samuel Madden’ and published in 2013 or after. Filter 34. Find all the papers written by researchers at ‘Carnegie Mellon University’ and published
at the KDD conference.Filter 5
5. Which institution in South Korea has the largest number of researchers? Aggregate 26. Find the top 3 researchers who have published the most papers in the SIGMOD conference. Aggregate 4
Table 2: List of tasks. Task 1 & 2 retrieve attribute values, task 3 & 4 filter entities, task 5 & 6 perform aggregations.
column is neighbor or participating node column. For theneighboring node column ρl of vk:
Seeallh(vk, ρl, R) =Add(ρl, Select(C, type(vk), R)),
where C = {u|u = vk},
and for the participating node column tl:
Seeallt(vk, tl, R) =Shift(tl, Select(C, type(vk), R)), R)),
where C = {u|u = vk}}.
ETable supports additional actions that help with database explo-ration, such as: (1) Sort rows based on the values in a column; (2)Hide/show columns to reduce visual complexity in the interface;and (3) Revert to previous queries via the left history panel.
6.2 ArchitectureETable system uses a three-tier architecture, consisting of (1)
an interactive user interface front-end that can run in any mod-ern web browsers, written in HTML, JavaScript, and D3.js2; (2)a Python-based application server; and (3) a PostgreSQL databasebackend. The PostgreSQL database stores TGDB schema and in-stance graphs in four relational tables: nodes, edges, node types,
and edge types. A query pattern for ETable is translated into SQLqueries that operate on the PostgreSQL database. To efficiently per-form queries, we partition a long SQL query into multiple queriesconsisting of a fewer number of relations to be joined (i.e., each fora single entity-reference column) and merge them.
7. EVALUATION: USER STUDYTo evaluate the usability of ETable, we conducted a user study
that tests whether users can construct queries quickly and accu-rately. We compared ETable with Navicat Query Builder.3 Navi-cat is one of the most popular commercial database administrationtools with a graphical query building feature. Graphical builderssuch as Navicat Query Builder have been commonly used as base-line systems in database usability research [35, 38, 7].
7.1 Experimental DesignParticipants. We recruited 12 participants from our university
through advertisements posted to mailing lists at our institution. Allwere graduate students who had taken at least one database courseor had industry experience using database systems. The partici-pants rated their experience in SQL, averaging at a score of 4.67using a 7-point Likert scale (ranged from 3 to 6) with 1 being “hav-ing no knowledge” and 7 being “expert”, which means most partic-ipants considered themselves non-expert database users. None ofthem had used the graphical query builder before. Each participantwas compensated with a $15 gift card.2https://d3js.org/3http://www.navicat.com/
Data set. We used an academic publication data set used through-out this paper, which we collected from DBLP4 and ACM DigitalLibrary.5 It contains about 38,000 papers from 19 top conferencesin the areas of databases (e.g., SIGMOD), data mining (e.g,. KDD),and human-computer interaction (e.g., CHI), since 2000. A rela-tional schema was designed using standard design principles, re-sulting in 7 relations with 7 foreign keys as depicted in Figure 3.As the main focus of this evaluation is on ETable’s usability, thisdata set creates a sufficiently large and complex database for suchpurpose.
Procedure. Our study followed a within-subjects design withtwo conditions: the ETable and Navicat conditions. Every partici-pant first completed six tasks in one condition and then completedanother six tasks in the remaining condition. The orders of the con-ditions were counterbalanced, resulting in 6 participants in each or-dering. We generated two matched sets of tasks (6 tasks in each set)differing only in their specific values used for parameters such asthe title of the paper. Before the participants were given the tasks tocarry out for each condition, they went through a 10-minute tutorialfor the tool they would use. For each task, the participants could askclarifying questions before starting, and they had a maximum of 5minutes to complete each task. After the study, they completed aquestionnaire for subjective ratings and qualitative feedback. Eachstudy lasted for about 70 minutes. Participants completed the studyusing Chrome browser, running on a Windows desktop machine,with a 24-inch monitor at a 1920x1200 resolution.
Tasks. We carefully generated two matched sets of 6 tasks thatcover many database exploration and querying tasks. Table 2 showsone set (the other set is similar). The tasks fall into three categories:finding attribute values (Tasks 1 & 2); filtering (Tasks 3 & 4); ag-gregation (Tasks 5 & 6). The tasks were designed based on priorresearch studies and their categorization of tasks. Specifically, ourcategories are based on those used in database and HCI research [5,34], and our tasks vary in difficulty as in [33].
Measurements. We measured participants’ task completion times.If a participant failed to complete a task within 5 minutes, the ex-perimenter stopped the participant and recorded 300 seconds as thetask completion time. After completing tasks for both conditions,the participants filled out a post-questionnaire that asked for theirsubjective ratings about ETable (10 questions) and their subjectivepreference between two conditions (7 questions).
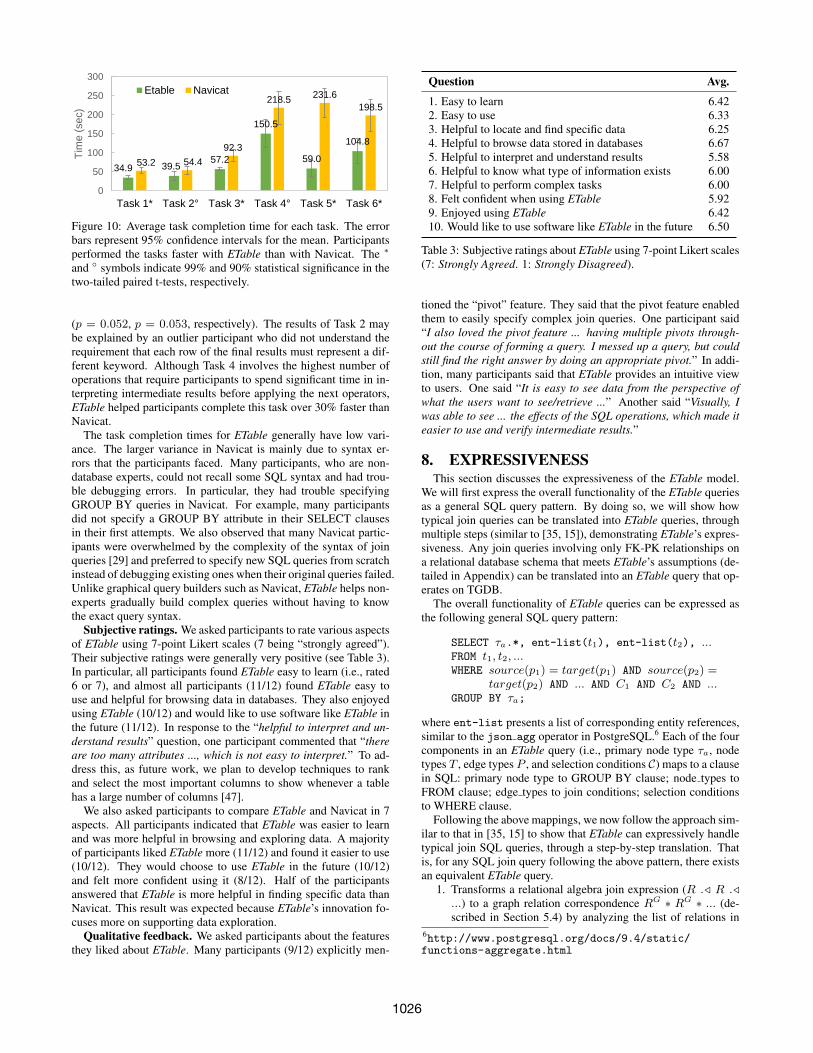
7.2 ResultsTask completion times. The average task times for ETable were
faster than those for Navicat for all six tasks. Figure 10 sum-marizes the task time results. We performed two-tailed paired t-tests. The differences were statistically significant for Tasks 1, 3,5, and 6 (p < 0.005) and marginally significant for Tasks 2 and 4
4http://dblp.uni-trier.de/5http://dl.acm.org/
1025
34.9 39.5 57.2
150.5
59.0
104.8
53.2 54.4
92.3
218.5 231.6
198.5
0
50
100
150
200
250
300
Task 1* Task 2° Task 3* Task 4° Task 5* Task 6*
Tim
e (
sec)
Average Task Completion Time (sec)
Etable Navicat
Figure 10: Average task completion time for each task. The errorbars represent 95% confidence intervals for the mean. Participantsperformed the tasks faster with ETable than with Navicat. The ∗
and ◦ symbols indicate 99% and 90% statistical significance in thetwo-tailed paired t-tests, respectively.
(p = 0.052, p = 0.053, respectively). The results of Task 2 maybe explained by an outlier participant who did not understand therequirement that each row of the final results must represent a dif-ferent keyword. Although Task 4 involves the highest number ofoperations that require participants to spend significant time in in-terpreting intermediate results before applying the next operators,ETable helped participants complete this task over 30% faster thanNavicat.
The task completion times for ETable generally have low vari-ance. The larger variance in Navicat is mainly due to syntax er-rors that the participants faced. Many participants, who are non-database experts, could not recall some SQL syntax and had trou-ble debugging errors. In particular, they had trouble specifyingGROUP BY queries in Navicat. For example, many participantsdid not specify a GROUP BY attribute in their SELECT clausesin their first attempts. We also observed that many Navicat partic-ipants were overwhelmed by the complexity of the syntax of joinqueries [29] and preferred to specify new SQL queries from scratchinstead of debugging existing ones when their original queries failed.Unlike graphical query builders such as Navicat, ETable helps non-experts gradually build complex queries without having to knowthe exact query syntax.
Subjective ratings. We asked participants to rate various aspectsof ETable using 7-point Likert scales (7 being “strongly agreed”).Their subjective ratings were generally very positive (see Table 3).In particular, all participants found ETable easy to learn (i.e., rated6 or 7), and almost all participants (11/12) found ETable easy touse and helpful for browsing data in databases. They also enjoyedusing ETable (10/12) and would like to use software like ETable inthe future (11/12). In response to the “helpful to interpret and un-derstand results” question, one participant commented that “thereare too many attributes ..., which is not easy to interpret.” To ad-dress this, as future work, we plan to develop techniques to rankand select the most important columns to show whenever a tablehas a large number of columns [47].
We also asked participants to compare ETable and Navicat in 7aspects. All participants indicated that ETable was easier to learnand was more helpful in browsing and exploring data. A majorityof participants liked ETable more (11/12) and found it easier to use(10/12). They would choose to use ETable in the future (10/12)and felt more confident using it (8/12). Half of the participantsanswered that ETable is more helpful in finding specific data thanNavicat. This result was expected because ETable’s innovation fo-cuses more on supporting data exploration.
Qualitative feedback. We asked participants about the featuresthey liked about ETable. Many participants (9/12) explicitly men-
Question Avg.
1. Easy to learn 6.422. Easy to use 6.333. Helpful to locate and find specific data 6.254. Helpful to browse data stored in databases 6.675. Helpful to interpret and understand results 5.586. Helpful to know what type of information exists 6.007. Helpful to perform complex tasks 6.008. Felt confident when using ETable 5.929. Enjoyed using ETable 6.4210. Would like to use software like ETable in the future 6.50
Table 3: Subjective ratings about ETable using 7-point Likert scales(7: Strongly Agreed. 1: Strongly Disagreed).
tioned the “pivot” feature. They said that the pivot feature enabledthem to easily specify complex join queries. One participant said“I also loved the pivot feature ... having multiple pivots through-out the course of forming a query. I messed up a query, but couldstill find the right answer by doing an appropriate pivot.” In addi-tion, many participants said that ETable provides an intuitive viewto users. One said “It is easy to see data from the perspective ofwhat the users want to see/retrieve ...” Another said “Visually, Iwas able to see ... the effects of the SQL operations, which made iteasier to use and verify intermediate results.”
8. EXPRESSIVENESSThis section discusses the expressiveness of the ETable model.
We will first express the overall functionality of the ETable queriesas a general SQL query pattern. By doing so, we will show howtypical join queries can be translated into ETable queries, throughmultiple steps (similar to [35, 15]), demonstrating ETable’s expres-siveness. Any join queries involving only FK-PK relationships ona relational database schema that meets ETable’s assumptions (de-tailed in Appendix) can be translated into an ETable query that op-erates on TGDB.
The overall functionality of ETable queries can be expressed asthe following general SQL query pattern:
SELECT τa.*, ent-list(t1), ent-list(t2), ...FROM t1, t2, ...WHERE source(p1) = target(p1) AND source(p2) =
target(p2) AND ... AND C1 AND C2 AND ...GROUP BY τa;
where ent-list presents a list of corresponding entity references,similar to the json agg operator in PostgreSQL.6 Each of the fourcomponents in an ETable query (i.e., primary node type τa, nodetypes T , edge types P , and selection conditions C) maps to a clausein SQL: primary node type to GROUP BY clause; node types toFROM clause; edge types to join conditions; selection conditionsto WHERE clause.
Following the above mappings, we now follow the approach sim-ilar to that in [35, 15] to show that ETable can expressively handletypical join SQL queries, through a step-by-step translation. Thatis, for any SQL join query following the above pattern, there existsan equivalent ETable query.
1. Transforms a relational algebra join expression (R ./ R ./...) to a graph relation correspondence RG ∗ RG ∗ ... (de-scribed in Section 5.4) by analyzing the list of relations in
6http://www.postgresql.org/docs/9.4/static/functions-aggregate.html
1026

the FROM clause, and the join conditions in the WHEREclause. (Each RG is a node type; each ∗ an edge type.)
2. Applies the original selection conditions to the TGDB’s nodetypes;
3. If there is a group by attribute, transform it to the graph’sprimary node type; otherwise, if no group by attribute exists,arbitrarily set a primary node type.
ETable can express typical join queries consisting of the corerelational algebra (i.e., relational algebra expression that does notcontain set operations), which accounts for a large number of thedatabase workloads. ETable additionally lets users choose a pri-mary node type from the list of selected relations, and introducesthe entity-reference columns (i.e., represented as ent-list in theabove SQL pattern) to effectively present join queries. This paperfocuses on the critical usability challenge that arises when join-ing several tables. In our future work, we plan to further increaseETable’s expressiveness of the presentation model to the full set ofoperators in the relational algebra, through introducing additionaloperators to support more complex queries (e.g., set operations,complex aggregations, etc.).
9. CONCLUSIONSWe proposed ETable, a new presentation data model for interac-
tively exploring relational databases. The enriched table represen-tation of ETable generates a holistic, interactive view of databasesthat helps users browse relevant information at an entity-relationshiplevel. By directly interacting with the interface, users can itera-tively specify operators, enabling them to incrementally build com-plex queries and navigate databases. ETable outperformed a com-mercial graphical query builder in a user study, in both speed andsubjective ratings across a range of database querying tasks.
This work takes a first step towards developing a practically us-able, interactive interface for relational databases, and opens upmany interesting opportunities. Future research directions include:(1) incorporating more operations to further improve expressivepower (e.g., set operations); (2) accelerating the execution speedof updated queries (e.g., by reusing intermediate results); (3) lever-aging machine learning techniques to rank and select importantcolumns to display. The above ideas could usher a new genera-tion of interactive database exploration tools that will benefit alldatabase users.
10. ACKNOWLEDGMENTSThis material is based upon work supported by the NSF Graduate
Research Fellowship Program under Grant No. DGE-1148903 andthe NSF under Grant No. IIS-1563816.
11. REFERENCES[1] D. Abadi, R. Agrawal, A. Ailamaki, M. Balazinska, P. A. Bernstein,
M. J. Carey, S. Chaudhuri, J. Dean, A. Doan, M. J. Franklin, et al.The beckman report on database research. ACM SIGMOD Record,43(3):61–70, 2014.
[2] S. Abiteboul, R. Agrawal, P. Bernstein, M. Carey, S. Ceri, B. Croft,D. DeWitt, M. Franklin, H. G. Molina, D. Gawlick, et al. The lowelldatabase research self-assessment. CACM, 48(5):111–118, 2005.
[3] A. Abouzied, J. Hellerstein, and A. Silberschatz. Dataplay:interactive tweaking and example-driven correction of graphicaldatabase queries. In UIST, pages 207–218. ACM, 2012.
[4] S. Agrawal, S. Chaudhuri, and G. Das. Dbxplorer: A system forkeyword-based search over relational databases. In ICDE, pages5–16. IEEE, 2002.
[5] R. Amar, J. Eagan, and J. Stasko. Low-level components of analyticactivity in information visualization. In IEEE INFOVIS, pages111–117. IEEE, 2005.
[6] R. Angles and C. Gutierrez. Survey of graph database models. ACMComputing Surveys, 40(1):1, 2008.
[7] E. Bakke and D. Karger. Expressive query construction throughdirect manipulation of nested relational results. In SIGMOD, pages1377–1392. ACM, 2016.
[8] E. Bakke, D. R. Karger, and R. C. Miller. Automatic layout ofstructured hierarchical reports. IEEE TVCG, 19(12):2586–2595,2013.
[9] C. Batini, S. Ceri, and S. B. Navathe. Conceptual Database Design:An Entity-Relationship Approach. Benjamin Cummings, 1992.
[10] G. Bhalotia, A. Hulgeri, C. Nakhe, S. Chakrabarti, and S. Sudarshan.Keyword searching and browsing in databases using banks. In ICDE,pages 431–440. IEEE, 2002.
[11] M. Buoncristiano, G. Mecca, E. Quintarelli, M. Roveri, D. Santoro,and L. Tanca. Database challenges for exploratory computing. ACMSIGMOD Record, 44(2):17–22, 2015.
[12] T. Catarci. What happened when database researchers met usability.Information Systems, 25(3):177–212, 2000.
[13] T. Catarci, M. F. Costabile, S. Levialdi, and C. Batini. Visual querysystems for databases: A survey. Journal of Visual Languages &Computing, 8(2):215–260, 1997.
[14] T. Catarci, G. Santucci, and M. Angelaccio. Fundamental graphicalprimitives for visual query languages. Information Systems,18(2):75–98, 1993.
[15] T. Catarci, G. Santucci, and J. Cardiff. Graphical interaction withheterogeneous databases. The VLDB journal, 6(2):97–120, 1997.
[16] U. Cetintemel, M. Cherniack, J. DeBrabant, Y. Diao, K. Dimitriadou,A. Kalinin, O. Papaemmanouil, and S. B. Zdonik. Query steering forinteractive data exploration. In CIDR, 2013.
[17] K. S.-P. Chang and B. A. Myers. Using and exploring hierarchicaldata in spreadsheets. In CHI, pages 2497–2507. ACM, 2016.
[18] P. P.-S. Chen. The entity-relationship model: toward a unified view ofdata. ACM TODS, 1(1):9–36, 1976.
[19] Y. Chen, W. Wang, Z. Liu, and X. Lin. Keyword search on structuredand semi-structured data. In SIGMOD, pages 1005–1010. ACM,2009.
[20] R. H. Chiang, T. M. Barron, and V. C. Storey. Reverse engineering ofrelational databases: Extraction of an eer model from a relationaldatabase. Data & Knowledge Engineering, 12(2):107–142, 1994.
[21] M. Dork, N. H. Riche, G. Ramos, and S. Dumais. Pivotpaths:Strolling through faceted information spaces. IEEE TVCG,18(12):2709–2718, 2012.
[22] C. Dunne, N. Henry Riche, B. Lee, R. Metoyer, and G. Robertson.Graphtrail: Analyzing large multivariate, heterogeneous networkswhile supporting exploration history. In CHI, pages 1663–1672.ACM, 2012.
[23] J. Fan, G. Li, and L. Zhou. Interactive sql query suggestion: Makingdatabases user-friendly. In ICDE, pages 351–362. IEEE, 2011.
[24] S. Few. Show me the numbers: Designing tables and graphs toenlighten. Analytics Press Oakland, CA, 2004.
[25] H. Gonzalez, A. Y. Halevy, C. S. Jensen, A. Langen, J. Madhavan,R. Shapley, W. Shen, and J. Goldberg-Kidon. Google fusion tables:web-centered data management and collaboration. In SIGMOD,pages 1061–1066. ACM, 2010.
[26] M. Gyssens, J. Paredaens, J. Van den Bussche, and D. V. Gucht. Agraph-oriented object database model. IEEE TKDE, 6(4):572–586,1994.
[27] V. Hristidis and Y. Papakonstantinou. Discover: Keyword search inrelational databases. In VLDB, pages 670–681, 2002.
[28] S. Idreos, O. Papaemmanouil, and S. Chaudhuri. Overview of dataexploration techniques. In SIGMOD, pages 277–281. ACM, 2015.
[29] H. V. Jagadish, A. Chapman, A. Elkiss, M. Jayapandian, Y. Li,A. Nandi, and C. Yu. Making database systems usable. In SIGMOD,pages 13–24. ACM, 2007.
[30] H. V. Jagadish, A. Nandi, and L. Qian. Organic databases. InDatabases in Networked Information Systems, pages 49–63.Springer, 2011.
[31] M. Jayapandian and H. V. Jagadish. Automated creation of aforms-based database query interface. PVLDB, 1(1):695–709, 2008.
[32] H. Kang, C. Plaisant, B. Lee, and B. B. Bederson. Netlens: iterativeexploration of content-actor network data. Information Visualization,
1027
6(1):18–31, 2007.[33] F. Li and H. V. Jagadish. Constructing an interactive natural language
interface for relational databases. PVLDB, 8(1):73–84, 2014.[34] F. Li, T. Pan, and H. V. Jagadish. Schema-free sql. In SIGMOD,
pages 1051–1062. ACM, 2014.[35] B. Liu and H. V. Jagadish. A spreadsheet algebra for a direct data
manipulation query interface. In ICDE, pages 417–428. IEEE, 2009.[36] Z. Liu, S. B. Navathe, and J. T. Stasko. Network-based visual
analysis of tabular data. In IEEE Conf. Visual Analytics Science &Technology, pages 41–50. IEEE, 2011.
[37] A. Nandi and H. V. Jagadish. Guided interaction: Rethinking thequery-result paradigm. PVLDB, 4(12):1466–1469, 2011.
[38] A. Nandi, L. Jiang, and M. Mandel. Gestural query specification.PVLDB, 7(4):289–300, 2013.
[39] M. A. Roth, H. F. Korth, and A. Silberschatz. Extended algebra andcalculus for nested relational databases. ACM TODS, 13(4):389–417,1988.
[40] H.-J. Schek and M. H. Scholl. The relational model withrelation-valued attributes. Information systems, 11(2):137–147, 1986.
[41] J. F. Sequeda, M. Arenas, and D. P. Miranker. On directly mappingrelational databases to rdf and owl. In WWW, pages 649–658. ACM,2012.
[42] B. Shneiderman. Direct manipulation: A step beyond programminglanguages. IEEE Computer, 16:57–69, 1983.
[43] M. Singh, M. J. Cafarella, and H. V. Jagadish. Dbexplorer:Exploratory search in databases. In EDBT, pages 89–100, 2016.
[44] M. Stonebraker and D. Moore. Object Relational DBMSs: The NextGreat Wave. Morgan Kaufmann Publishers Inc., 1995.
[45] Y. Sun and J. Han. Mining heterogeneous information networks:principles and methodologies. Synthesis Lectures on Data Mining &Knowledge Discovery, 3(2):1–159, 2012.
[46] J. Tyszkiewicz. Spreadsheet as a relational database engine. InSIGMOD, pages 195–206. ACM, 2010.
[47] X. Yang, C. M. Procopiuc, and D. Srivastava. Summarizing relationaldatabases. PVLDB, 2(1):634–645, 2009.
[48] M. M. Zloof. Query-by-example: A data base language. IBM SystemsJournal, 16(4):324–343, 1977.
APPENDIXA. DATABASE TRANSLATION
This section describes a procedure for translating relational data-bases into database schema and instance graphs in the typed graphmodel. Our approach is based on the reverse engineering litera-ture [9, 20, 15, 41]. We note that the following process cannotbe applied to any relational schema, as relational schema do notcontain all the semantics, but is a guideline for translations. Wemake several assumptions as in the literature [15, 9]. First, all therelations are in BCNF or 3NF. Second, there are no ternary rela-tionships: all the relationships are binary. Third, for relationshiprelations, we assume that all attributes are foreign keys of the re-lations that participate in the relationship. Any attributes of therelationship itself are ignored. Finally, a relation representing amultivalued attribute always consists of two columns.Identifying entity relations. This step identifies entity relationsfrom a set of relations. Informally, entity relations refer to relationsconstructed from entity types in the entity-relationship model. Wedefine an entity relation as a relation whose primary key does notcontain a foreign key or a key inclusion dependent on any otherattribute in any other relation [15, 9]. For each of the identifiedentity relations, the following process is performed.
1. A relation becomes a node type in the schema graph.2. The relation name becomes the name of the node type.3. All the attributes of the relation become the attributes of the
node type.4. One attribute selected by users becomes a label attribute for
the node type.
We currently determine the label attribute based on a combi-nation of heuristics, such as data type (e.g., text generally moreinterpretable than numbers) and cardinality. However, this labelselection task is hard to fully automate. Thus, we also allow usersto manually pick a desired label attribute. In our future work, weplan to investigate mixed-initiative approaches that allow humanand computer to work together, so that we would provide an initialguess and recommend possible alternatives based on the heuristics,and allow the users to select attributes that are most meaningful tothem.Identifying 1:1 and 1:n relationships. Foreign keys, which areused to represent one-to-one and one-to-many relationships betweenentity relations in the relational model, are used to identify relation-ships between entity relations found above. For each foreign key,the following process is performed.
1. Each foreign key becomes an edge type in the schema graph.The source node would be a node type representing a relationcontaining the foreign key. The target node would be a nodetype representing a relation which the foreign key refers to.
2. Unless the source and target node types are the same, the edgetypes are duplicated with a reverse direction.
3. The label is defined as the name of the target node type. If thelabel is used by another edge type, a slightly different labelwill be created.
Identifying many-to-many relationships. Many-to-many rela-tionships are represented as a separate table in the relational model.We identify these tables whose primary key is a concatenation ofprimary keys of two other entity relations. For each of the identifiedrelationship relations, the following process is performed.
1. Each relationship relation becomes an edge type in the schemagraph. The two other associated entity relations become sourceand target nodes.
2. The remaining steps are the same as above (i.e., Steps 2 & 3)Identifying multivalued attributes. The relational model storesmultivalued attributes in separate relations. We identify such re-lations. We assume these relations consist of only two attributeswhere both attributes make up the primary key and the first attributeis a foreign key to an entity relation. For each of this case, the fol-lowing process is performed.
1. The second attribute becomes a node type in the schema graph.2. The node type has one attribute which refers to itself. The
label column is this only attribute.3. An edge type is also created from the node type representing
the entity relation to the newly created node type. It will beduplicated in a reverse direction.
Identifying categorical attributes. This step of identifying cat-egorical attributes is optional, but we find it useful. People oftenperform GROUP BY operations over categorical attributes, and thisstep helps them perform such analysis. Any of the attributes of theentity relations could be selected by users. Often, attributes withlow cardinality (e.g., less than 30) can be candidates for categoricalattributes. For each of the selected attributes, the following processis performed.
1. Each attribute becomes a node type in the schema graph.2. It has one attribute which refers to itself. The label column is
this only attribute.3. An edge type is also created from the node type representing
the relation to the newly created node type. It will be dupli-cated in a reverse direction.
This creates a TGDB schema graph. Under the assumptions wemade, the schema graph contains all the information in the originalrelational schema. Once the schema is translated, it is straightfor-ward to create the corresponding TGDB instance graph.
1028