intentions for doing good matter for doing well: the ... · intentions for doing good matter for...
TRANSCRIPT

Intentions for Doing Good Matter for Doing Well:The Negative Effects of Prosocial Incentives∗
Lea Cassar† and Stephan Meier‡
October 19, 2018
Abstract
Many firms consider prosocial initiatives to be an effective tool to motivate work-ers. However, despite some initial supportive evidence, little is known about when andhow prosocial incentives work. We argue that if prosocial incentives are used instru-mentally, i.e., firm’s perceived motive is to extract more effort from the workers, theycan be perceived as unkind and, thus, can backfire. We test our predictions in a fieldexperiment where we varied whether a charitable donation made by the firm was con-ditional or unconditional on workers’ performance. Consistent with our theory we findthat performance-based donations, which are, by construction, more instrumental thanunconditional donations, lead to lower effort. As predicted, the negative effect is partic-ularly strong for workers who do not care about charities and, thus, who do not face thecountervailing effect of working harder in order to benefit the charity. Finally, we alsofind that the donations backfire even compared to a baseline with no incentives. Thesefindings highlight some serious limitations of prosocial incentives: firms’ perceived motivesand pool of employees will be crucial for their effectiveness.
Keywords: prosocial incentives, Corporate Social Responsibility, monetary incen-tives, effort, experiment
JEL: D03, C93, M52
∗We thank Vanessa Burbano, Robert Dur, Constanca Esteves-Sorenson, Florian Engl, Sebastian Fehrler, RayFisman, Matthias Heinz, Alex Imas, Karine Nyborg, Dirk Sliwka, Mirco Tonin and participants at seminarsand conference at Munich, Bonn, Frankfurt, Chicago, Yale, and Uber for valuable comments. Stephan Meierthanks Columbia Business School for funding this research project. This RCT was registered in the AmericanEconomic Association Registry for randomized control trials under Trial number AEARCTR-0001962.†University of Cologne and CESifo. [email protected]‡Columbia University, IZA, and NBER. 3022 Broadway, New York, NY 10025. USA.
1
1. Introduction
Prosocial incentives and Corporate Social Responsibility (CSR) initiatives are becoming impor-
tant wide-spread tools within firms’ HR strategies (Kitzmueller and Shimshack, 2012; Cassar
and Meier, 2018). 67% of CEOs think that prosocial incentives are crucial in motivating and at-
tracting top talent (PricewaterhouseCoopers, 2016, p. 13). A number of early findings seem in
line with these positive expectations: prosocial incentives and CSR initiatives have been found
to increase, for example, effort and productivity (e.g., Tonin and Vlassopoulos, 2015, 2010; Gos-
nell et al., 2016; DellaVigna and Pope, 2016; Hedblom et al., 2016; Cassar, 2017a)–sometimes
even more than monetary incentives (Imas, 2014; Charness et al., 2014)–lower reservation wages
(e.g., Nyborg and Zhang, 2013; Burbano, 2016), and increase retention (e.g., Bode et al., 2015;
Carnahan et al., 2016). The theoretical argument (e.g. Brekke and Nyborg, 2008; Benabou and
Tirole, 2010; Cassar, 2017b) behind these empirical results is that workers who are motivated
by the underlying social cause of the prosocial incentives, e.g., a donation to a charitable foun-
dation, work harder or lower their reservation wage in order to support the cause.1 Importantly,
according to this argument, prosocial incentives should never lower effort and potentially harm
the firm. Worst case, these incentives will be ineffective if workers do not care enough about
the social cause. Not surprisingly then, a large number of companies are engaged in CSR by,
for example, having charitable foundations that donate a percentage of the firms’ profit to good
causes. And many more are considering instrumentally adding prosocial incentives (i.e., doing
good) to the mix of HR tools in order to reap the economic benefits (i.e., doing well) (see, e.g.
Bhattacharya et al., 2008).
In this paper, we present evidence from a field experiment that illustrate the limits and
potential negative effects of prosocial incentives. At the core of the argument is the idea that
prosocial incentives and CSR activities can affect workers’ effort not only because workers may
want to contribute to the social cause underlying the incentives but also because the employer’s
1For additional theoretical contributions on the desirability of CSR see Bagnoli and Watts (2003); Kotchen(2006); Besley and Ghatak (2007).
2
choice of these incentives can be perceived as a kind (or unkind) action by the workers. Workers
behave more nicely towards employers that are genuinely kind towards them and generous in
general (for similar theoretical arguments, see, e.g. Levine, 1998; Ellingsen and Johannesson,
2008; Dur, 2009) for at least two reasons: i) intrinsic reciprocity (Sobel, 2005), i.e., because
workers may derive intrinsic utility from benefiting (harming) a kind (unkind) employer; and/or
ii) instrumental/extrinsic reciprocity (Sobel, 2005), i.e., because the employer’s kindness may
determine how the workers will be treated in the future and, thus, how much the workers value
the contract.2
Whether the employer’s choice of prosocial incentives is perceived to be kind by the workers
depends then critically on the perceived motives of the employer for choosing those incentives,
and not just on the impact that the incentive has for the social cause. In particular, if prosocial
incentives are used instrumentally, i.e., firm’s perceived motive is to extract more effort from the
workers, they can be perceived as less kind (or unkind) and thus backfire. Consistent with this
view, evidence suggests that prosocial acts with an instrumental benefit are indeed perceived
as being less kind (e.g. Newman and Cain, 2014; Berman et al., 2015). Similarly, Orhun (2018)
shows that the same beneficial action in an interpersonal interaction triggers lower positive
reciprocal action when the counterparts’ action is more likely to be motivated by strategic
rather than altruistic motives. That perceived motives matter for reciprocal behavior is not
only recognized by economists (see, e.g., Sobel, 2005; Cabral et al., 2014; Johnsen and Kvaloy,
2016) but also by biologists: “there is ample evidence to support the notion that humans
respond to altruistic acts according to their perception of the motives of the altruist. They
tend to respond more altruistically when they perceive the other as acting ‘genuinely’ altruistic”
Trivers as cited in (Sobel, 2005, p. 424).3 Crucial for our predictions, while the negative effect of
2Even for simple jobs, e.g. micro jobs on M-Turk, workers depend on firms treating them nicely by payingbaseline payment as promised (i.e. approving their work at all and in a timely fashion), being honest aboutrequired time and effort to complete job, and rewarding them potentially with bonuses.
3Relatedly, there is a well-established literature in economics that emphasizes the role of intentions in recipro-cal behavior (Rabin, 1993; Dufwenberg and Kirchsteiger, 2004; Falk and Fischbacher, 2006, see, e.g.). Accordingto this literature the extent to which one’s action induces reciprocal behavior depends on the perceived kindnessof one’s intentions, where the perceived kindness typically depends on the voluntariness of the action and/or onthe person’s expectations of the consequences of that action. We discuss how intentions can differ from motivesin the next section.
3

the strategic use of prosocial incentives might be offset by a positive motivating effect for agents
who want to contribute to the social cause, the effect is expected to be particularly negative
for workers who do not care about the social cause. Using prosocial incentives strategically can
therefore backfire – especially for non-motivated agents.
The experiment is run in collaboration with an Italian firm. The firm hires around 3,000
workers on Amazon Mechanical Turk (M-Turk) to create taglines for products of the firm that
they want to use for their English website. Workers are asked to come up with three slogans as
the baseline. The treatments vary the nature of the incentives for an additional three slogans
on two dimensions:
First, we vary whether incentives are private, monetary bonuses or prosocial in the form of
a donation to charity. Second, we vary whether incentives (monetary or prosocial) are more or
less instrumental for the firm. The difference between a more or less instrumental incentive has
to do with the perceived motive of the firm for using such incentive, i.e, the extent to which the
choice of the incentive is clearly driven by the firm’s desire to increase effort and profitability.
In our experiment, we vary whether the incentives (monetary or prosocial) are performance-
based or not. That is, we vary whether the extra incentive is conditional or unconditional on
workers doing three more slogans.4 Given that conditional incentives are paid if and only if they
lead to higher effort, it is pretty clear that the firm’s choice of offering this type of incentives
is driven by instrumental motives. On the contrary, given that unconditional incentives are
paid independently on their effects on effort and, thus, on the firm’s profit, workers can not
rule out that this choice was also, at least partly, motivated by the genuine altruistic desire
of supporting the charity. Exactly as a social mission is “a concrete goal or objective for the
firm that reaches beyond profit maximization” (Henderson and Van den Steen, 2015, p. 327),
the unconditional incentives are less instrumental than conditional incentives because they risk
being not profitable.5
4Throughout the paper, we will call the extra bonus/transfer “incentive” – whether it is conditional orunconditional on performance.
5We want to emphasize once more that we are not claiming that unconditional incentives cannot be instru-mental. Also unconditional incentives can be driven by purely selfish motives if they are offered mainly becausethe firm expects that the workers will react positively to them. In fact, according to our story, unconditional
4
Note that this 2-by-2 design allows to compare the effect of charitable incentives that are
more or less instrumental against a benchmark, namely, monetary incentives that are also
more or less instrumental. The presence of a benchmark allows to control for any effect that
is specific to the environment or type of subjects. In fact, while the employer’s choice of
performance-based monetary incentives can also be perceived as less kind by the workers than
the choice of unconditional monetary incentives, we expect that the motivation of earning
more money by performing better will largely dominate the negative effect on the employer’s
perceived motives. Hence, contrary to charitable incentives, for monetary incentives we predict
the standard result, namely, that performance-based monetary bonuses lead to higher effort
than unconditional monetary bonuses.
The results of the experiment are as follows. First, consistent with our predictions, we
find that charitable incentives work very differently from monetary incentives. While making
monetary incentives conditional on performance increases effort substantially, conditioning the
donation on performance marginally backfires. The proportion of workers who do more than
three slogans increases by 11 percentage points if monetary incentives are made performance-
based (p < 0.01). On the contrary, the proportion of workers who do more than the basic
three slogans actually decreases by 5 percentage points when charitable incentives are made
performance-based compared to unconditional (p = 0.10). These findings unequivocally prove
that the negative effect of performance-based incentives on effort is specific to prosocial in-
centives and not true in general. We show that even in an environment in which conditional
monetary incentives substantially increase effort, a charitable incentive of the same size can
backfire.
Second, as we predicted, the effect of performance-based compared to unconditional char-
itable incentives highly depends on the workers’ charity-motivation. For charity-motivated
incentives could even turn out to be more profitable than conditional incentives if they are perceived to be morekind than conditional incentives. We are just stating that compared to unconditional incentives, conditionalincentives provides a stronger signal that the firm is driven by instrumental motives. Finally, note that inthis paper we only investigate the agent’s behavior while abstracting from the principal’s behavior (given thatwe exogenously manipulate the behavior of the firm in the experiment) and, thus, from any equilibrium oroptimality analysis.
5
workers, for whom the two countervailing effects might cancel each other out, making charita-
ble incentives performance-based has only a marginally positive effect. However, for workers
who are not charity-motivated, the effect of making charitable incentives performance-based
is clearly negative. The proportion of workers that create more than three slogans decreases
by 11 percentage points (p < 0.01). Using a similar IV approach as in (Haggag and Pope,
2016), we then show that, consistent with our story, workers are significantly less satisfied with
the employer’s choice of offering performance-based donations than with the choice of offer-
ing unconditional donations and that this relative dissatisfaction is the mechanism behind the
backfiring effect for non-motivated workers.
Third, we compare charitable and monetary incentives to a baseline without any extra in-
centives for more slogans. Note that we did not make any prediction on the effectiveness of
charitable incentives relative to no incentives because our baseline treatment was very uninfor-
mative about the employer’s actions and motives. Workers in our baseline treatment did not
observe whether the “no-incentive” was the result of the firm choosing not to make charitable
donations or whether the firm was actually making charitable donations but just not revealing
it in this context (e.g., for fear of being perceived as strategic Carlos and Lewis, 2017). The
(perceived) motives behind each of these potential actions can be very different and, thus, have
opposite implications on how kind or unkind the action is perceived to be by the workers. As
a consequence, we decided to take an explorative approach in answering this question.
Again, we find that monetary and charitable incentives work very differently. While mon-
etary incentives increase effort compared to the baseline, charitable incentives backfire. The
proportion of workers doing more than three slogans increases by 23 percentage points when
the monetary private incentive is conditional on performance (p < 0.01) and by 9 percentage
point when it is unconditional (p < 0.01). On the contrary, the proportion of workers doing
more than three slogans decreases by 12 percentage points when the charitable incentive is
conditional on performance (p < 0.01) and by 8 percentage point when it is unconditional
(p < 0.05). Hence, our experiment shows that even unconditional prosocial incentives can neg-
atively affect workers’ motivation and thus be detrimental for the firm. This result should not
6
be seen as too surprising given that, as we already stated, even unconditional incentives can
be used instrumentally by an employer to increase workers’ effort. Making an unconditional
donation can be driven by purely profit-maximizing motives if the employer believes that the
worker will react to it with higher effort. This argument is all the more valid in our setting
where the size of the extra incentive (namely, the bonus or the donation) was half the baseline
pay and, therefore, it was cheaper than to hire a new worker, pay the baseline pay and get
three slogans this way. Finally, it could also be that the workers in the unconditional donation
treatment perceived the employer’s choice of donating to a charity as unkind because they
would have preferred if the firm gave this extra money to them. While this argument cannot
explain the difference between the conditional and unconditional donation treatment, it can
explain the difference between the unconditional donation and the baseline treatment (where
the workers were unaware that the firm had this extra-budget available).
These findings shed light on the serious limitations of prosocial incentives as a tool to mo-
tivate workers. Prosocial incentives that are used strategically to increase profit can not only
be ineffective, they can actually harm the firm. The negative effect is particulary strong for
performance-based prosocial incentives, which are, by construction, more instrumental than
unconditional incentives. Our findings also highlight the importance of taking into account
the firm’s pool of employees when choosing whether to offer performance-based prosocial in-
centives: while for mission-motivated agents the negative effect of the instrumental nature
of performance-based prosocial incentives might be offset by a positive motivating effect, for
workers who do not care to support the social cause, the overall effect will be particularly
negative.
The paper proceeds in the following: Section 2 highlights the differences from previous
studies and the contribution to the related literature. Section 3 presents our theoretical frame-
work and derives the behavioral predictions. Section 4 provides details about the experimental
setting and design. Section 5 presents the main results. Section 6 concludes.
7
2. Contribution to related literature
The paper makes contributions to several strands of literatures. First, a fast growing experi-
mental literature investigates, both in the lab and in the field, the effect of prosocial incentives
on workers’ effort and productivity (for a review, see Cassar and Meier, 2018). As in our paper,
the prosocial incentives in these studies take the form of charitable donations linked to work
activity, where the financial reward is not paid to the worker but rather donated to a charity.
However, differently from our paper, the results of these studies have been mainly positive. For
example, in an online real-effort experiment, Tonin and Vlassopoulos (2015) finds that proso-
cial incentives lead to a 13 percent rise in productivity, regardless of their form (lump sum
or related to performance) or strength. A positive effect of charitable donations on workers’
effort is also found in Imas (2014); Charness et al. (2014); Gerhards (2015); Cassar (2017a);
DellaVigna and Pope (2016). In particular, Imas (2014); Charness et al. (2014) also show that
when stakes are low, prosocial incentives lead to higher performance than standard monetary
incentives schemes. The only exception to these positive findings are the studies by Fehrler
and Kosfeld (2014) and List and Momeni (2017). Fehrler and Kosfeld (2014) finds in a lab
experiment that charitable donations only increase effort of subjects that self-select into a more
prosocial environment, while they have a null effect on aggregate. List and Momeni (2017)
is the only other experiment we are aware off, that shows negative effects of charitable dona-
tions on workers’ behavior. Consistent with a moral licensing story, the authors find in a field
experiment on MTurk that prosocial incentives lead to more cheating.
We contribute to this literature by showing that prosocial incentives do not only impact
workers’ effort through the standard channel of prosocial motivation, but also through their
effect on workers’ perception about the employer’s motives and thus on their willingness to
reciprocate. We thereby reveal previously unknown limitations and negative effects of prosocial
incentives as an instrumental tool to motivate effort. Naturally, in our context the presence
of a real employer–i.e, a real company rather than the experimenter–that hires the workers
becomes crucial for the predictions. In fact, the lack of a real employer in all the previous
8
studies (with the exception of List and Momeni (2017) which also finds a negative result) and
the consequent awareness of being in an experiment is likely to explain why we find different
results from the previous literature. Finally, one other difference compared to the previous
studies which could partially account for the difference in results is the nature of the effort
task. Our task consisted of creating new slogan for the firm’s product and, therefore, could
be considered as more intellectually stimulating than the tasks used in previous studies, where
subjects had to enter data (Tonin and Vlassopoulos, 2015; Charness et al., 2014), squeeze a
hand dynamometer (Imas, 2014), alternately press the“a” and “b” buttons on their keyboards
as quickly as possible (DellaVigna and Pope, 2016) or where their effort costs took the form of a
monetary investment (Gerhards, 2015; Fehrler and Kosfeld, 2014; Cassar, 2017a). In particular,
the high level of engagement in our task–as it was also reported by many workers in the survey
at the end of the experiment–could explain the already high level of effort in the baseline,
and therefore, the relative small effect of the additional “mission motivation” generated by the
charity, which was then outweighed by the negative perception effect.
Second, while there is a substantial literature on the detrimental effects of monetary incen-
tives (for a review, see Gneezy et al., 2011), our results show that non-monetary incentives are
even more problematic (if not more delicate) if used the wrong way. Gneezy and Rey-Biel (2014)
show that small monetary incentives can lower effort compared to no incentives when made
conditional on effort. Our paper is able to compare monetary and non-monetary incentives.
We show that even in an environment in which conditional monetary incentives substantially
increase effort, a charitable incentive of the same size can backfire. Comparing monetary and
non-monetary incentives allows to control for general aversion to being controlled (e.g. Gneezy
and Rustichini, 2000; Carpenter and Dolifka, 2013; Falk and Kosfeld, 2006), and illustrate the
difference between the two types of incentives.
Third, our paper draws from the large and well-known literature on reciprocity. This liter-
ature has identified at least three determinants of reciprocal behavior: distributional concerns
or outcome-based preferences (Fehr and Schmidt, 1999; Bolton and Ockenfels, 2000), perceived
kindness of one’s intentions (Rabin, 1993; Dufwenberg and Kirchsteiger, 2004; Falk and Fis-
9

chbacher, 2006) and, although much less prominently, perceived motives behind one’s action
(Sobel, 2005; Cabral et al., 2014; Johnsen and Kvaloy, 2016; Orhun, 2018). Motives differ
from intentions in that, while the latter refers to what an individual meant his or her action
to yield as a consequence, motives refer to why the individual wanted to achieve the intended
consequence (Orhun, 2018).6 Note that in our setting this distinction is irrelevant because the
employer’s choice of offering conditional rather than unconditional incentives can vary both her
perceived intentions and her perceived motives. We nevertheless contribute to this literature by
showing, for the first time, that an employer’s intentions/motives for using prosocial incentives
are crucial for their effect on effort, even more than for monetary incentives. Furthermore,
the paper informs the more specific literature on gift-exchange in job settings (Akerlof, 1982;
Fehr et al., 1993). While the evidence from laboratory studies show quite strong reciprocity
to monetary gifts, the evidence from the field is rather mixed (e.g., Gneezy and List, 2006;
Hennig-Schmidt et al., 2010; Esteves-Sorenson, 2017). The results in our paper provide sup-
portive evidence for gift exchange in the field. We do find that an unconditional monetary
bonus, i.e. a gift, increases effort significantly compared to a baseline with no bonus. This
is all the more remarkable given that the baseline pay was already very generous – compared
to the wage paid on average on M-Turk – and that workers also enjoyed very much the task
given their comments to us. While, as we already claimed, we cannot disentangle whether this
positive effect of gift was driven by intrinsic or extrinsic reciprocity, it speaks clearly in favor
of reciprocal relationships in the workplace.
Fourth, our paper contributes to the growing literature on the importance and functioning
of CSR in motivating and selecting workers (for a review about the management literature on
CSR as a HR tool, see, e.g., Flammer and Luo, 2017).7 Our findings contribute to this literature
by suggesting that the intention behind any CSR activity is very important – and not just the
6The same intent can be driven by different motives. For example, a firm can invest in CSR with the intentof making its workers happier because happier workers work harder (strategic/instrumental motive) or becauseit genuinely cares about the well-being of its workers (altruistic motive).
7There is a also related literature about the effect of CSR on consumers (e.g. Elfenbein et al., 2012; Bartlinget al., 2015; Singh et al., 2016). There is also a literature that looks at the negative effect of using CSR to hideother problems, like “greenwashing” (see, e.g., Delmas and Burbano, 2011).
10

outcome as in how much good in the world they achieve. If CSR is used instrumentally in order
to increase a firm’s profit, it may negatively affect workers’ perception about the firm’s kindness
and the positive effect of CSR will diminish (if not backfire). Our result point to a substantial
limitation of CSR and what types of firms can effectively enjoy the benefits of it: firms cannot
use CSR as another traditional HR tool, but have to think about how it affects their perceived
motives. If CSR is not perceived as genuine and sincere, the benefits will disappear. In fact,
a small literature points out–consistent with our results–that certain firms are reluctant to
measure the impact of CSR or even publicize it initiatives (e.g. Carlos and Lewis, 2017) in
order to avoid being seen as strategic. For firms that are not genuinely interested in socially
responsibly behavior, instrumental CSR can be worse than ineffective–it can backfire.
3. Behavioral Predictions
Consider the following environment, which closely follows the design of our experiment. An
agent (he) is employed by principal (she). The employment contract specifies the task to be
executed and the fixed wage w paid to the agent. Furthermore, the principal can use monetary
or charitable incentives to motivate the agent to put extra effort e into the task. In our
experiment, the monetary incentives take the form of a financial bonus b paid to the agent,
while the charitable incentives take the form of a donation d made to a charity. Both types of
incentives can have either of the following two characteristics: they can be unconditional on
the agent’s performance (i.e., b = b and d = d), or they can be performance-based, namely
conditional on the agent’s effort (i.e., b = b(e) and d = d(e)).8 At the core of our model is the
idea that the employer’s choice of the incentive can be perceived as a more or less kind action
by the agent and, thus, affects if and to what extent, he wants to reciprocate the employer
with higher or lower effort. More specifically, the agent’s preferences can be represented by the
8Note that while for sake of illustrative simplicity here we assume the functions b(e) and d(e) to be continuous,in our experiment they take the following form: b = b and d = d iff e ≥ e and b = d = 0 iff e < e). However,this minor difference does not have any fundamental effect on our predictions.
11

following utility function:
Ua = w + b+ θd+ λkp(b, d)Φ(e)− C(e) (1)
In words, the agent’s preferences are characterized by three elements: i) his monetary payoff,
given by w+ b ; ii) the donation made to the charity, captured by the term θd, where 0 ≤ θ < 1
measures the agent’s charity-motivation, and iii) a reciprocal term, Φ(e), which is an increasing
function of the agent’s effort.9 The extent to which the agent cares to reciprocate depends on
an exogenous parameter 0 ≤ λ < 1 and, crucially for our model, on the perceived kindness of
the employer’s actions, kp, which we assume to lie in the interval [−1, 1]. A more kind action is
associated with a higher positive value of kp and, thus, with a higher willingness to positively
reciprocate. Note that kp can also take negative values if the employer’s actions are perceived
as unkind, leading the worker to reduce his effort. In our experiment, the only action of the
employer that we vary is the type of incentives offered to the worker. Hence, we assume kp to
be a function of b and d.
According to this utility function, the agent will exert more effort when working for a
principal who acted more kindly. Hence, crucial for our predictions, is how different forms of
incentives influence kp. We conjecture that the motives of an employer who offers performance-
based rather than unconditional incentives are perceived as being more instrumental by the
agent, with a consequent negative effect on the perceived kindness of the employer’s choice.
Formally, we expect:
kp|d=d(e) < kp|d=d(2)
kp|b=b(e) < kp|b=b (3)
9There are at least two potential microfoundations for Φ(e). If the workers are intrinsically reciprocal (Sobel,2005), Φ(e) could capture the principal’s revenue. Workers derive intrinsic value from increasing or decreasingthe principal’s revenue based on the perceived kindness of her actions. If the workers reciprocate for extrinsicreasons (Sobel, 2005)–because they expect future interactions with the employer–then Φ(e) could capture theagent’s future utility derived form the contract. For the remaining of analysis we abstract from this distinctionas there is no way to disentangle intrinsic from extrinsic reciprocity in the experiment.
12

The main intuition behind this conjecture is that while the employer’s motives for offering
unconditional incentives are less clear (i.e., the employer may be doing so strategically to
increase effort but she may very well do so because she cares about the agent or about society),
performance-based incentives give a stronger signal that the employer’s main motive is to
extract higher effort from the agent given that the bonus or the donation is paid if and only
if it increases effort and, thus, profit. In other words, the strategic side of performance-based
incentives is more salient than the one of unconditional incentives. As a consequence, the
principal’s choice of offering performance-based incentives is perceived as less kind than the
choice of offering unconditional incentives.
We now use conjectures (2) and (3) to make predictions about the agent’s effort under
different types of incentives. Given the focus of the paper, we start by looking at the different
effects of conditional versus unconditional charitable incentives. We will then compare these
predictions with the ones for monetary incentives.
Consider the FOCs of the agent’s problem when the principal offers the unconditional
donation and when she offers the performance-based donation, respectively:
λkp|d=dΦ′(e∗) = C ′(e∗) (4)
θd′(e∗) + λkp|d=d(e)Φ′(e∗) = C ′(e∗) (5)
The comparison between equation (4) and equation (5) clearly depends on the parameter θ,
the agent’s charity-motivation. As a consequence of conjecture (2), agents with θ close to
zero (whom we define as “non-motivated”) will exert lower effort under the performance-based
donation than under the unconditional donation. For agents with positive θ (whom we define
as “charity-motivated”), however, the prediction is less clear because it depends on which
of the two countervailing effects dominates: On the one hand, via the reciprocity channel, a
performance-based donation reduces the incentive to exert effort compared to the unconditional
donation. On the other hand, it creates the incentive of generating a higher donation to
13
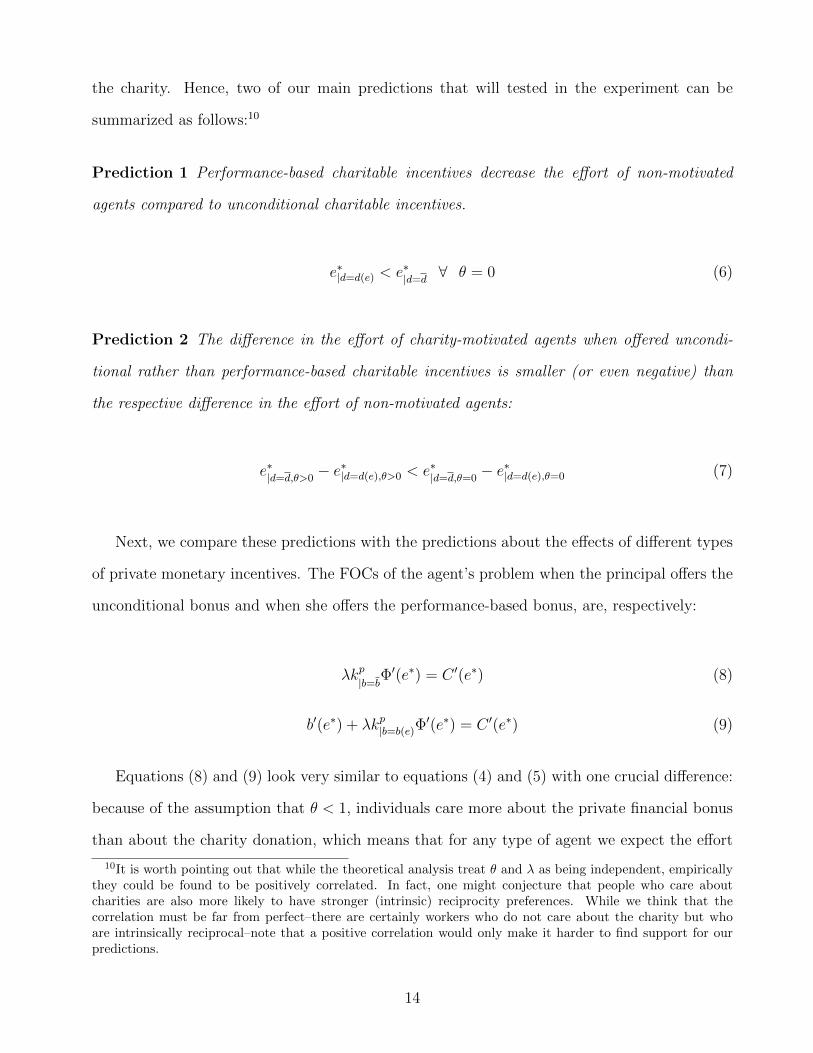
the charity. Hence, two of our main predictions that will tested in the experiment can be
summarized as follows:10
Prediction 1 Performance-based charitable incentives decrease the effort of non-motivated
agents compared to unconditional charitable incentives.
e∗|d=d(e) < e∗|d=d∀ θ = 0 (6)
Prediction 2 The difference in the effort of charity-motivated agents when offered uncondi-
tional rather than performance-based charitable incentives is smaller (or even negative) than
the respective difference in the effort of non-motivated agents:
e∗|d=d,θ>0− e∗|d=d(e),θ>0 < e∗|d=d,θ=0
− e∗|d=d(e),θ=0 (7)
Next, we compare these predictions with the predictions about the effects of different types
of private monetary incentives. The FOCs of the agent’s problem when the principal offers the
unconditional bonus and when she offers the performance-based bonus, are, respectively:
λkp|b=bΦ′(e∗) = C ′(e∗) (8)
b′(e∗) + λkp|b=b(e)Φ′(e∗) = C ′(e∗) (9)
Equations (8) and (9) look very similar to equations (4) and (5) with one crucial difference:
because of the assumption that θ < 1, individuals care more about the private financial bonus
than about the charity donation, which means that for any type of agent we expect the effort
10It is worth pointing out that while the theoretical analysis treat θ and λ as being independent, empiricallythey could be found to be positively correlated. In fact, one might conjecture that people who care aboutcharities are also more likely to have stronger (intrinsic) reciprocity preferences. While we think that thecorrelation must be far from perfect–there are certainly workers who do not care about the charity but whoare intrinsically reciprocal–note that a positive correlation would only make it harder to find support for ourpredictions.
14

difference between performance-based incentives and unconditional incentives to be larger (and
most likely positive) for monetary incentives than for charitable incentives. Formally, we test
the following theoretical prediction in the experiment:
Prediction 3 The effect on effort of performance-based incentives relative to unconditional
incentives is higher when the incentives are monetary rather than charitable:
e∗|d=d(e) − e∗|d=d< e∗|b=b(e) − e∗|b=b (10)
Finally, note that any other standard model of workers’ preferences cannot generate all of
our three predictions. It is straightforward to show that if agents are purely profit-maximizers,
they will exert the same (minimum) amount of effort under any of the charitable incentives.
On the contrary, they will react positively to the monetary performance-based incentives by
exerting more effort than under the unconditional bonus. Hence, Predictions 1 and 2 would
not hold. Similarly, if the agents were only motivated by the charity but not by reciprocity,
Prediction 1 would not hold.
4. Study Design
4.1. Description of Intervention
We designed an experiment in collaboration with an Italian company, named PharmaGIC S.R.L,
which distributes pharmaceutical products in Italy and abroad. PharmaGIC is looking for
suggestions on how to improve their English website. We partnered with them to recruit workers
on Amazon Mechanical Turk (henceforth, M-Turk)11 with the task of generating marketing
11M-Turk is an online platform where companies and researchers can recruit cheap labor force to perform quickand easy tasks, called Human Intelligence Task (HIT). This platform is being increasingly used by economists(see, e.g., DellaVigna and Pope (2016); Ambuehl et al. (2015)). Goodman et al. (2013); Imas (2016); Imas etal. (2016) discuss that M-Turk participants behave very similarly to other samples in many (classical) decision-making tasks and differ little on many other dimensions. Interestingly for our study, M-Turkers apparently do
15

slogans for the products sold by PharmaGIC. These slogans are then considered for potential
use in the English version of their website. All communication with the workers came from
PharmaGIC.12 Workers were directed to a webpage that informed them about the company
and the main task (see Appendix A.2 for all the instructions).
Task and base payment: The main task of workers was to create slogans for different prod-
ucts. We explained what a slogan or tagline is and that they have to create at least three
slogans (but that we would appreciate more). It was clearly explained that the task is consid-
ered completed if they create at least three slogans and that they would receive a fixed wage
of $1.50.
Treatments: After reading the basic information about the firm and the task, workers were
randomly assigned to different treatments which varied the type of incentives to motivate them
to create more than three slogans. More specifically, in addition to a baseline treatment where
no additional incentive was offered, we had a 2× 2 between-subjects design which varied:
1. Nature of incentive: We varied whether workers were offered a) a private monetary in-
centive that was a financial bonus of 75 cents, or b) a charitable incentives that was a
donation of 75 cents made to the charity “Doctors without Borders”.13
2. Performance-based: Additionally, we varied whether the incentive was i) conditional on
performance, namely it was given if and only if the worker would create a least three more
slogans (for a total of six slogans), or ii) unconditional on performance, namely it was
given independently on whether the worker would create three more slogans. Importantly,
to keep the reference-point of expected slogans fixed across treatments, also within the
unconditional treatments we mentioned that we would appreciate if they could do at least
three more slogans.
not differ in their attitudes about money compared to a student sample, but they care more about money thana community sample (Goodman et al., 2013).
12We also got permission from IRB to waive the typical consent form.13We chose this specific charity because it was rated as one “the ten best charities everyone has heard
of” by Charity Navigator, the American largest and most utilized charity evaluator. For more details visithttps://www.charitynavigator.org/. Last time accessed: 21 June 2018. Furthermore, it was the charity thatwas most frequently chosen by subjects in previous studies (Cassar (2017a), Koppel and Regner (2015)).
16

We also created two versions for each of those treatments that varied whether the workers
were given an explanation for the choice of the incentives or not. In the conditional incentives
treatments the explanation emphasized the instrumental nature of the conditional incentive by
adding the following sentence: “Why do we give you (make) the bonus (donation)? The bonus
(donation) is profitable for us: you doing at least three extra slogans for a wage (donation)
of 75 cents is less costly for us than hiring another worker to do at least three slogans for a
wage of $1.50.”14 In the unconditional incentives treatments the explanation emphasized a non-
instrumental reason for offering an unconditional incentive: “Why do we give you (make) the
bonus (donation)? We are strongly committed to be an employee-friendly company (socially
responsible company–e.g. helping the larger community), even if this implies sacrificing some
profit.”15 In the no-explanation treatments nothing was stated regarding the motive why the
company offered a bonus or a donation.
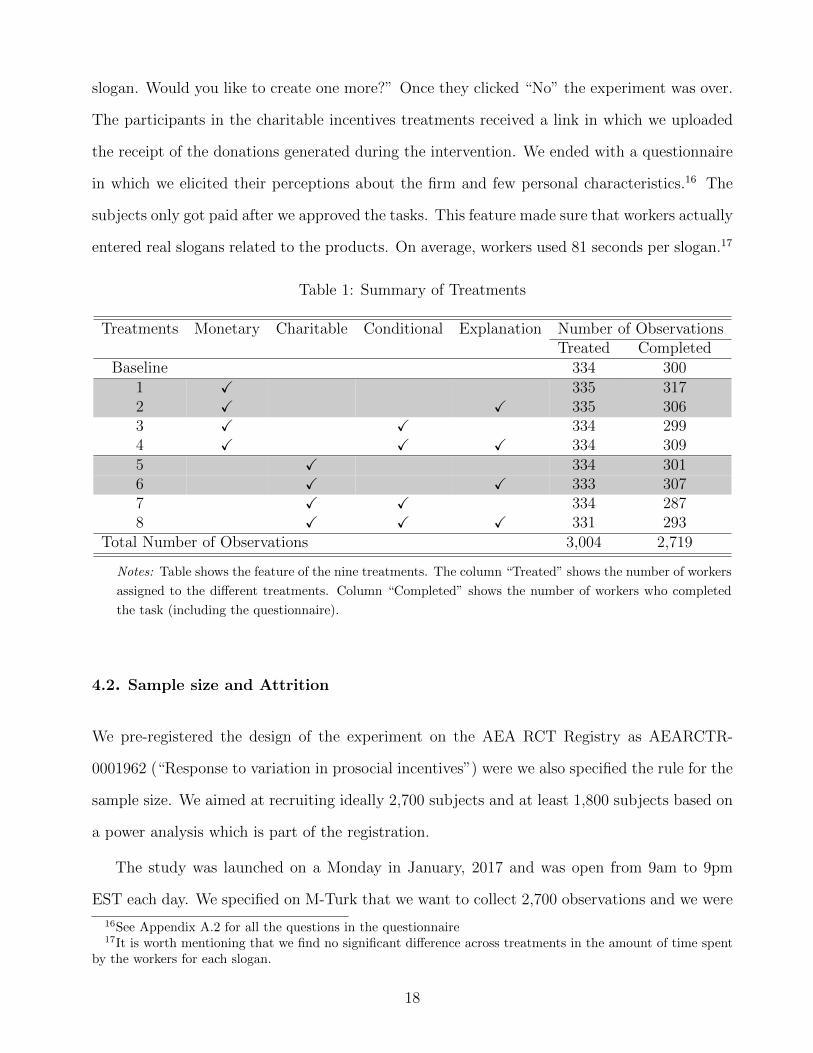
Table 1 summarizes the nine treatments that vary whether the treatment had a monetary or
charitable incentive, whether the incentive was conditional on performance or not and whether
an explanation for the choice of incentive was provided. In most of the analysis, we pool the
treatments with and without explanation together. However, we do explore whether giving an
explanation makes a difference.
After seeing the description of the task and the incentive scheme, workers started working
on the slogans. The products were shown in sequence and only if workers finished one slogan,
they were shown the next product. After they had created three slogans we thanked them for
completing the task and, depending on the treatment, we summarized the payments (plus the
bonus or donation) and then we asked everybody: “Would you like to do any more slogans?
We would really appreciate if you could create at least three more slogans. Yes OR No” If they
clicked ”yes” in the previous page, they were shown again the slogans in sequence. After each
new slogan created, they were shown a screen with sentence: “Thank you for creating this extra
14It might seem unnatural (and unwise) for a firm to explain an action as profit-maximizing. Some firms noteven publicize their efforts (e.g. Carlos and Lewis, 2017). However, such an open communication strategy couldalso be seen as very transparent and potentially minimizing suspicion (Johnson et al., 2016).
15Note, however, that the explanation is pure cheap talk and, therefore, it cannot rule out that even uncon-ditional incentives can be perceived as instrumental.
17
slogan. Would you like to create one more?” Once they clicked “No” the experiment was over.
The participants in the charitable incentives treatments received a link in which we uploaded
the receipt of the donations generated during the intervention. We ended with a questionnaire
in which we elicited their perceptions about the firm and few personal characteristics.16 The
subjects only got paid after we approved the tasks. This feature made sure that workers actually
entered real slogans related to the products. On average, workers used 81 seconds per slogan.17
Table 1: Summary of Treatments
Treatments Monetary Charitable Conditional Explanation Number of ObservationsTreated Completed
Baseline 334 3001 X 335 3172 X X 335 3063 X X 334 2994 X X X 334 3095 X 334 3016 X X 333 3077 X X 334 2878 X X X 331 293
Total Number of Observations 3,004 2,719
Notes: Table shows the feature of the nine treatments. The column “Treated” shows the number of workers
assigned to the different treatments. Column “Completed” shows the number of workers who completed
the task (including the questionnaire).
4.2. Sample size and Attrition
We pre-registered the design of the experiment on the AEA RCT Registry as AEARCTR-
0001962 (“Response to variation in prosocial incentives”) were we also specified the rule for the
sample size. We aimed at recruiting ideally 2,700 subjects and at least 1,800 subjects based on
a power analysis which is part of the registration.
The study was launched on a Monday in January, 2017 and was open from 9am to 9pm
EST each day. We specified on M-Turk that we want to collect 2,700 observations and we were
16See Appendix A.2 for all the questions in the questionnaire17It is worth mentioning that we find no significant difference across treatments in the amount of time spent
by the workers for each slogan.
18
able to collect 2,719 in less than two full days. Important for our study is the process of how
workers are recruited and remain in the task: Workers see the advertisement for the job on
M-Turk. When they ‘accept’ the job, the workers gets re-directed to a Qualtrics survey which
explains the task and then randomizes workers into the different treatments so that there is
the same number of observation per treatment. After they are informed about all the details
(especially the incentive schemes) of the job, workers start working or stop doing it. We record
who started seeing the instructions and who worked and completed the task.
Table 1 shows that 3,004 workers started the job and saw the treatments. Not surpris-
ingly, Qualtrics is able to randomize workers equally into the nine treatments. 285 (9.49 %)
of workers decide not to complete the task (they either did no slogan or stop after a couple
of slogans without completing the survey or submitting a completion code on M-Turk) after
seeing the instructions and the incentive schemes. While the attrition rate is relatively low, it
is important to realize that there is differential attrition by treatment. Most striking is the fact
that attrition is higher in the two treatments with conditional charitable incentives, (12.78%),
than in the treatment with unconditional charitable incentives (8.85%). The difference is sig-
nificant in a Mann-Whitney test (Z =-2.312, p <0.05). For monetary incentives, there is no
significant difference between conditional, 8.98%, and unconditional incentives, 7.01%, (Z =-
1.326, p =0.185). Consistent with our story about instrumental use of prosocial incentives, this
selected attrition already suggests that conditional charitable incentives may harm the firm by
making it less attractive to potential employees.
In most of the analysis we include all the 3,004 workers that were treated, i.e., that saw the
incentive scheme and then decided to put in either no effort or a positive effort. For some of
the analysis, however, we do not have important information from workers that leave the job.
We discuss how this attrition can affect our results.
4.3. Outcome variables and sub-group definition
We will focus on two main outcome variables: 1) The main outcome variable is the proportion
of workers who created more than three slogans (the extensive margin). 2) We also analyze the
19

number of created slogans (intensive margin). On average, 64.2% of workers create more than
three slogans and the average number of slogan is 5.11 (s.d. of 2.89).
Finally, we elicited worker’s charity-motivation. The literature has shown that people typi-
cally contribute to the social good by making donations and/or by volunteering, and that both
dimensions capture workers’ prosociality. In fact, some people will have a preference for donat-
ing money, other for volunteering, and others still will prefer a bit of both (see, e.g., Dur and
Lent, 2016). Therefore, we asked subjects a) “How often do you donate money to a charitable
organization?”, and b) “How often do you volunteer for a good cause?” To both questions,
subjects could answer with “never”, “rarely”, “sometimes”, “often” and “regularly”. Table 2
shows the distribution of answers to these two questions.
Table 2: Workers’ charity-motivationVolunteer
“never or rarely” “sometimes” “often or regularly” Total“never or rarely” 706 251 50 1,007
Donation “sometimes” 372 694 153 1,219“often or regularly” 84 196 213 493
Total 1,162 1,141 416 2,719
Notes: The table shows the number of workers in terms of their volunteering (“How often do you volunteer for
a good cause?”) and donating (“How often do you donate money to a charitable organization?”). The workers
indicated in bold are labeled “charity-motivated” workers and the rest are “non-motivated”.
We used the answers to these questions to divide workers into two categories: “non-
motivated” and “charity-motivated”. In order to ensure an approximately equal number of
people in each category, we categorized as charity-motivated all subjects who either donate or
volunteer “often-regularly” or who both donate and volunteer “sometimes” (bold in Table 2).
This categorization leads to 1,390 charity-motivated types and to 1,329 non-motivated.18
18The results are robust to another categorization of workers into “non-motivated” and “charity-motivated”,which only categorizes workers who either donate or volunteer “often-regularly” as charity-motivated, while the694 workers who both donate and volunteer sometime were now categorized as non-motivated.
20

5. Results
We present the results in three steps: first, we investigate the effect of performance-based
versus unconditional incentives for both monetary and charitable incentives. In doing so, the
section explores a) the impact on effort, b) whether providing an explanation for the choice
of incentive has a differential effect, and c) how satisfied were the workers with the different
types of incentives. Second, we explore whether non-motivated and motivated workers react
differently to the two types of incentives as predicted by our model. Third, we compare the
two types of incentives to a situation in which we do not offer any incentive at all.
5.1. Conditional vs. Unconditional (Charitable and Monetary) Incentives
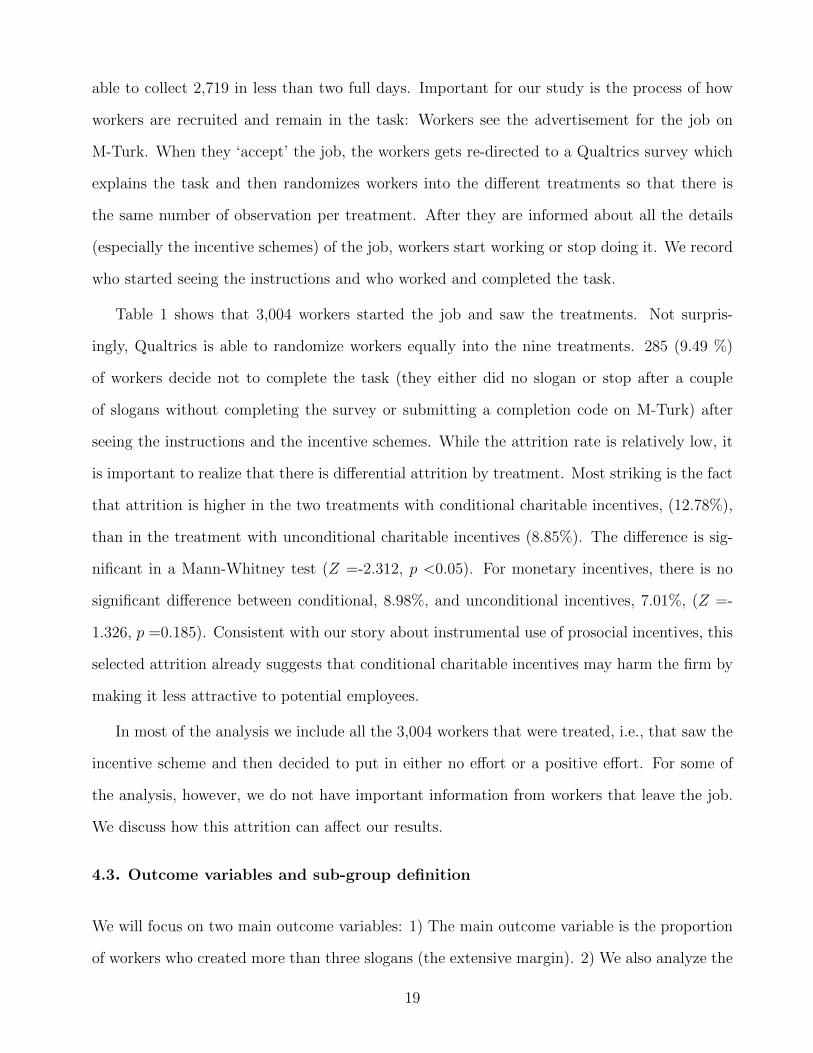
Figure 1 shows the effect of performance-based (“Conditional”) and not performance-based
(“Unconditional”) incentives (both monetary and charitable incentives) on effort. Panel A
shows the effect on the proportion of workers who do more than three slogans and Panel B
shows the effect on the average number of slogans.
Figure 1 clearly shows that making incentives conditional on performance has very different
effects on effort depending on whether the incentive is private and monetary or charitable.
As expected, making monetary incentives conditional on performance significantly increases
effort: the proportion of workers who are willing to create more than three slogans increases
13 percentage points when monetary incentives are made conditional on effort. The difference
is statistically significant in a Mann-Whitney test (Z = −6.06, p < 0.01).19 Also, the average
number of slogans increases around 11 percent when monetary incentives are conditional on
effort compared to when monetary incentives are unconditional (Z = −6.67, p < 0.01).
The effect of making charitable incentives performance-based is quite different from the
results for monetary incentives. Making charitable incentives performance-based lowers effort:
The proportion of workers who are willing to do more than three slogans decreases from 54
percent to 49 percent (Z = 1.64, p = 0.10). It also has a slight negative effect on the number
19We will use Mann-Whitney tests to compare means – unless otherwise noted.
21
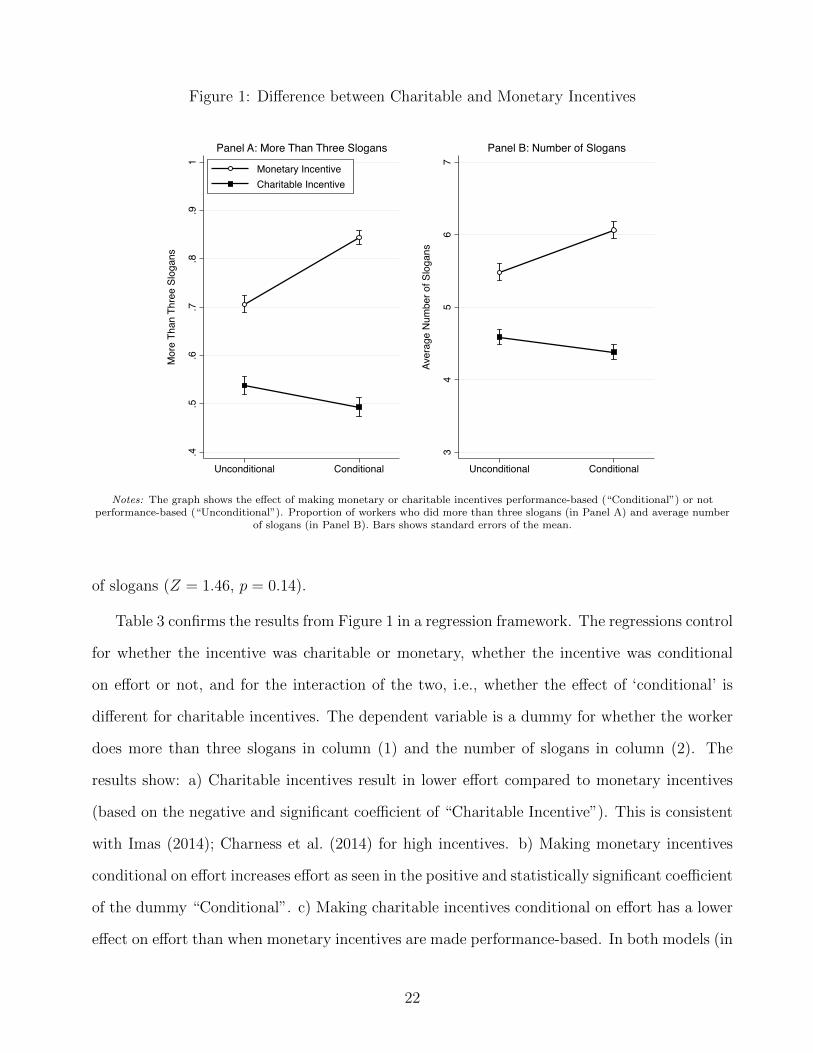
Figure 1: Difference between Charitable and Monetary Incentives
.4.5
.6.7
.8.9
1
Mor
e Th
an T
hree
Slo
gans
Unconditional Conditional
Monetary IncentiveCharitable Incentive
Panel A: More Than Three Slogans
34
56
7
Aver
age
Num
ber o
f Slo
gans
Unconditional Conditional
Panel B: Number of Slogans
Notes: The graph shows the effect of making monetary or charitable incentives performance-based (“Conditional”) or notperformance-based (“Unconditional”). Proportion of workers who did more than three slogans (in Panel A) and average number
of slogans (in Panel B). Bars shows standard errors of the mean.
of slogans (Z = 1.46, p = 0.14).
Table 3 confirms the results from Figure 1 in a regression framework. The regressions control
for whether the incentive was charitable or monetary, whether the incentive was conditional
on effort or not, and for the interaction of the two, i.e., whether the effect of ‘conditional’ is
different for charitable incentives. The dependent variable is a dummy for whether the worker
does more than three slogans in column (1) and the number of slogans in column (2). The
results show: a) Charitable incentives result in lower effort compared to monetary incentives
(based on the negative and significant coefficient of “Charitable Incentive”). This is consistent
with Imas (2014); Charness et al. (2014) for high incentives. b) Making monetary incentives
conditional on effort increases effort as seen in the positive and statistically significant coefficient
of the dummy “Conditional”. c) Making charitable incentives conditional on effort has a lower
effect on effort than when monetary incentives are made performance-based. In both models (in
22
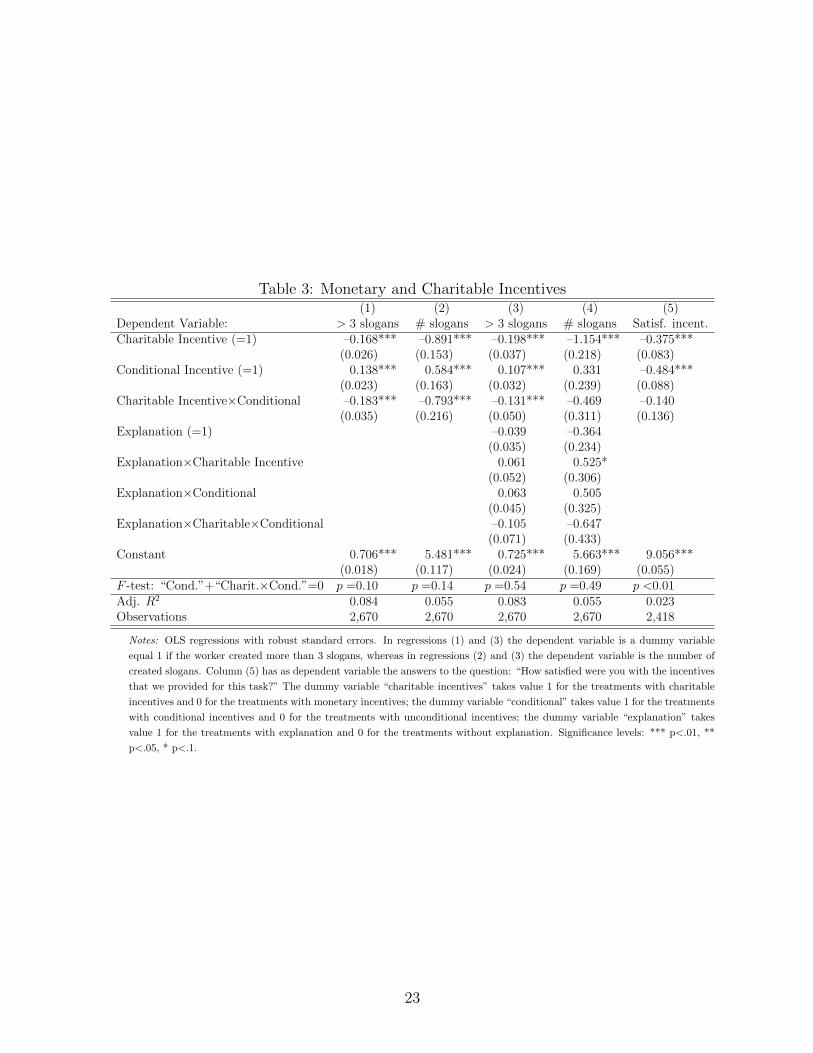
Table 3: Monetary and Charitable Incentives(1) (2) (3) (4) (5)
Dependent Variable: > 3 slogans # slogans > 3 slogans # slogans Satisf. incent.Charitable Incentive (=1) –0.168*** –0.891*** –0.198*** –1.154*** –0.375***
(0.026) (0.153) (0.037) (0.218) (0.083)Conditional Incentive (=1) 0.138*** 0.584*** 0.107*** 0.331 –0.484***
(0.023) (0.163) (0.032) (0.239) (0.088)Charitable Incentive×Conditional –0.183*** –0.793*** –0.131*** –0.469 –0.140
(0.035) (0.216) (0.050) (0.311) (0.136)Explanation (=1) –0.039 –0.364
(0.035) (0.234)Explanation×Charitable Incentive 0.061 0.525*
(0.052) (0.306)Explanation×Conditional 0.063 0.505
(0.045) (0.325)Explanation×Charitable×Conditional –0.105 –0.647
(0.071) (0.433)Constant 0.706*** 5.481*** 0.725*** 5.663*** 9.056***
(0.018) (0.117) (0.024) (0.169) (0.055)F -test: “Cond.”+“Charit.×Cond.”=0 p =0.10 p =0.14 p =0.54 p =0.49 p <0.01Adj. R2 0.084 0.055 0.083 0.055 0.023Observations 2,670 2,670 2,670 2,670 2,418
Notes: OLS regressions with robust standard errors. In regressions (1) and (3) the dependent variable is a dummy variable
equal 1 if the worker created more than 3 slogans, whereas in regressions (2) and (3) the dependent variable is the number of
created slogans. Column (5) has as dependent variable the answers to the question: “How satisfied were you with the incentives
that we provided for this task?” The dummy variable “charitable incentives” takes value 1 for the treatments with charitable
incentives and 0 for the treatments with monetary incentives; the dummy variable “conditional” takes value 1 for the treatments
with conditional incentives and 0 for the treatments with unconditional incentives; the dummy variable “explanation” takes
value 1 for the treatments with explanation and 0 for the treatments without explanation. Significance levels: *** p<.01, **
p<.05, * p<.1.
23
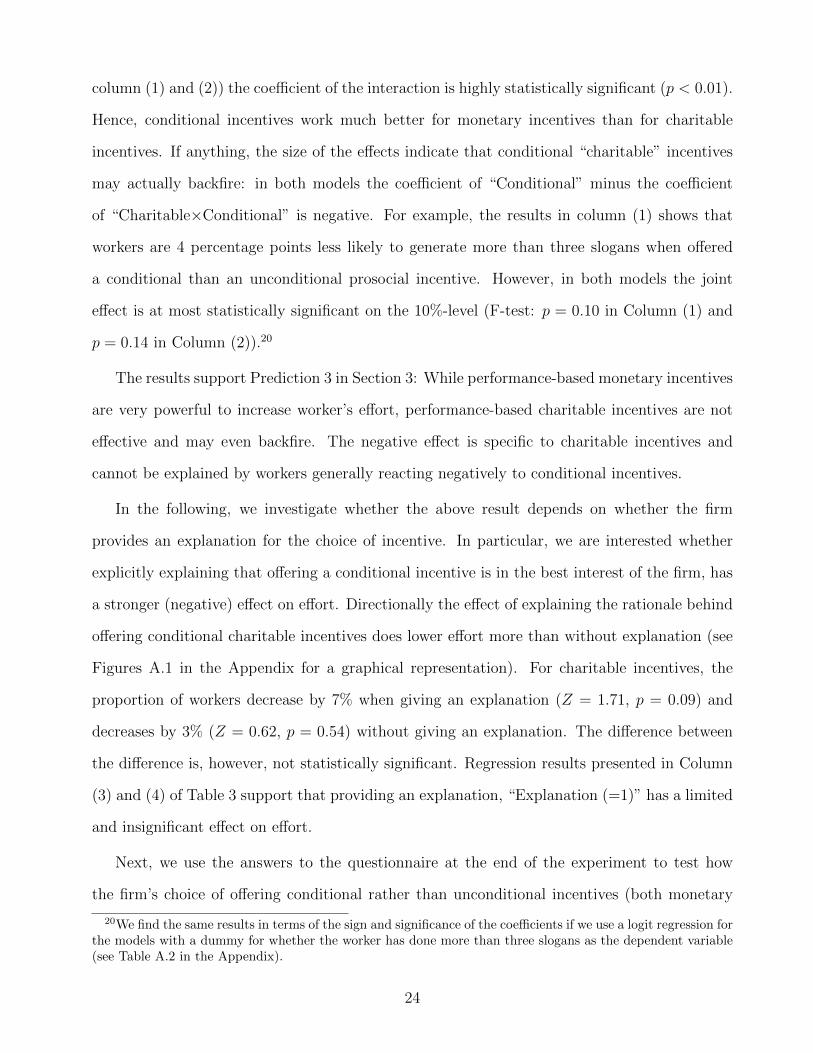
column (1) and (2)) the coefficient of the interaction is highly statistically significant (p < 0.01).
Hence, conditional incentives work much better for monetary incentives than for charitable
incentives. If anything, the size of the effects indicate that conditional “charitable” incentives
may actually backfire: in both models the coefficient of “Conditional” minus the coefficient
of “Charitable×Conditional” is negative. For example, the results in column (1) shows that
workers are 4 percentage points less likely to generate more than three slogans when offered
a conditional than an unconditional prosocial incentive. However, in both models the joint
effect is at most statistically significant on the 10%-level (F-test: p = 0.10 in Column (1) and
p = 0.14 in Column (2)).20
The results support Prediction 3 in Section 3: While performance-based monetary incentives
are very powerful to increase worker’s effort, performance-based charitable incentives are not
effective and may even backfire. The negative effect is specific to charitable incentives and
cannot be explained by workers generally reacting negatively to conditional incentives.
In the following, we investigate whether the above result depends on whether the firm
provides an explanation for the choice of incentive. In particular, we are interested whether
explicitly explaining that offering a conditional incentive is in the best interest of the firm, has
a stronger (negative) effect on effort. Directionally the effect of explaining the rationale behind
offering conditional charitable incentives does lower effort more than without explanation (see
Figures A.1 in the Appendix for a graphical representation). For charitable incentives, the
proportion of workers decrease by 7% when giving an explanation (Z = 1.71, p = 0.09) and
decreases by 3% (Z = 0.62, p = 0.54) without giving an explanation. The difference between
the difference is, however, not statistically significant. Regression results presented in Column
(3) and (4) of Table 3 support that providing an explanation, “Explanation (=1)” has a limited
and insignificant effect on effort.
Next, we use the answers to the questionnaire at the end of the experiment to test how
the firm’s choice of offering conditional rather than unconditional incentives (both monetary
20We find the same results in terms of the sign and significance of the coefficients if we use a logit regression forthe models with a dummy for whether the worker has done more than three slogans as the dependent variable(see Table A.2 in the Appendix).
24

and charitable) was perceived by the workers. The questionnaire asked workers “How satisfied
were you (from 1 to 10) with the incentives that we provided for this task?”. Consistent
with our argument that conditional incentives are likely to be perceived as less kind than
unconditional incentives, we find that the workers were significantly less satisfied with the
employer’s choice of offering performance-based than the choice of unconditional incentives
(p ≤ 0.014 for both monetary and charitable)21. Column (5) in Table 3 show a model with the
answers to the question about the satisfaction with the incentive as dependent variable. The
results confirm that the workers are less satisfied with the firm’s choice of offering conditional
incentives (p < 0.01).22 This finding supports equations (2) and (3), which are at the core of
our model.
In sum, while performance-based monetary incentives are very powerful to increase worker’s
effort, performance-based charitable incentives are not effective and may even backfire. The
negative effect is specific to charitable incentives and cannot be explained by workers generally
reacting negatively to conditional incentives. We also find empirical support for the mechanism
predicted by our theory, namely, that workers are less satisfied with performance-based incen-
tives than with unconditional incentives. Hence, consistent with our behavioral predictions,
it seems that performance-based incentives have two countervailing effects. On the one hand,
they motivate workers to exert higher effort in order to earn more money as a bonus or to
increase the donation for the charity. On the other hand, they discourage effort because they
are perceived as being less kind. While the motivating effect clearly dominates for monetary
incentives, for charitable incentives the negative effect only marginally dominates. Hence, if
our theory is correct, we should expect heterogeneous effects of performance-based charitable
incentives depending on the charity-motivation of the workers. We investigate this question in
the next section.
21See Figure A.1 for a graphical representation.22Table A.3 show the results for the other relevant survey questions. Throughout, the results show that
workers who were offered performance-based incentives i) see the company as being less attractive for a potentialemployee; ii) see the company less socially responsible and iii) perceive the motives behind the choice of theincentives as being more “calculated”.
25
5.2. Non-motivated vs. Charity-motivated Workers
Our model makes clear predictions in how performance-based incentives should affect non-
motivated and charity-motivated workers. Workers who care about charities (who we label
‘charity-motivated’) face the two countervailing effects of a performance-based charitable in-
centives: performance-based charitable incentives make them work harder because they want
to give to charity. However, also for them the conditionality of the incentive is perceived as
being less kind. The net effect will be unclear. However, the positive motivating effect should
be largely absent for workers who do not care about charities (who we label ‘non-motivated’).
Hence, according to our theory, for non-motivated workers conditional charitable incentives
should unambiguously reduce effort compared to unconditional charitable incentives.
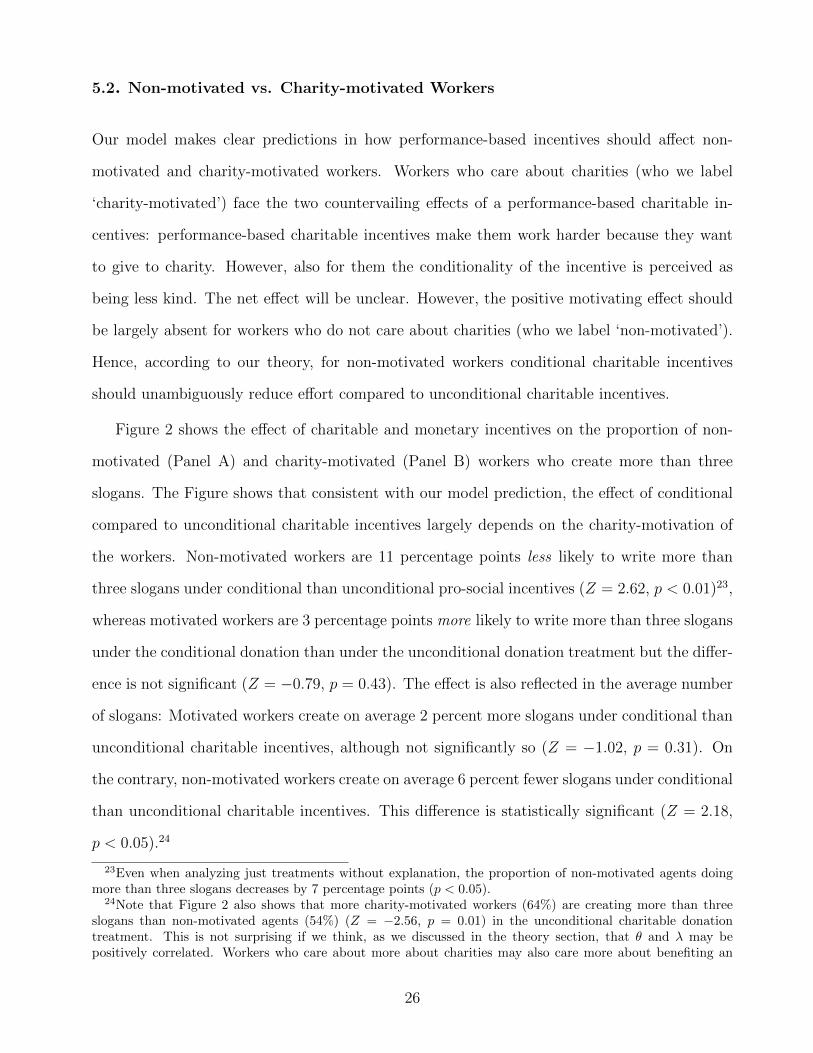
Figure 2 shows the effect of charitable and monetary incentives on the proportion of non-
motivated (Panel A) and charity-motivated (Panel B) workers who create more than three
slogans. The Figure shows that consistent with our model prediction, the effect of conditional
compared to unconditional charitable incentives largely depends on the charity-motivation of
the workers. Non-motivated workers are 11 percentage points less likely to write more than
three slogans under conditional than unconditional pro-social incentives (Z = 2.62, p < 0.01)23,
whereas motivated workers are 3 percentage points more likely to write more than three slogans
under the conditional donation than under the unconditional donation treatment but the differ-
ence is not significant (Z = −0.79, p = 0.43). The effect is also reflected in the average number
of slogans: Motivated workers create on average 2 percent more slogans under conditional than
unconditional charitable incentives, although not significantly so (Z = −1.02, p = 0.31). On
the contrary, non-motivated workers create on average 6 percent fewer slogans under conditional
than unconditional charitable incentives. This difference is statistically significant (Z = 2.18,
p < 0.05).24
23Even when analyzing just treatments without explanation, the proportion of non-motivated agents doingmore than three slogans decreases by 7 percentage points (p < 0.05).
24Note that Figure 2 also shows that more charity-motivated workers (64%) are creating more than threeslogans than non-motivated agents (54%) (Z = −2.56, p = 0.01) in the unconditional charitable donationtreatment. This is not surprising if we think, as we discussed in the theory section, that θ and λ may bepositively correlated. Workers who care about more about charities may also care more about benefiting an
26

Figure 2: Non-motivated vs. Charity-motivated Workers
.3.4
.5.6
.7.8
.91
Mor
e T
han
Thr
ee S
loga
ns
Unconditional Conditional
Monetary Incentive
Charitable Incentive
Panel A: Non-motivated
.3.4
.5.6
.7.8
.91
Mor
e T
han
Thr
ee S
loga
ns
Unconditional Conditional
Panel B: Charity-motivated
Notes: The graph shows the effect of making monetary or charitable incentives performance-based (“Conditional”) or notperformance-based (“Unconditional”) on the proportion of workers who created more than three slogans. The panels show the
effect for non-motivated workers in Panel A and charity-motivated workers in Panel B. Bars shows standard errors of the mean.
Table 4 show the results for the two subsamples in a regression framework. Columns (1) and
(3) focus on non-motivated workers while columns (2) and (4) focus on the charity-motivated
workers. As can be seen, for the non-motivated workers the interaction between the conditional
and the charitable incentive treatment in each regression is negative and highly significant
(p < 0.01 in both regressions). Furthermore, an F-test shows that the proportion of workers
who create more than three slogans is significantly lower under conditional than unconditional
charitable incentives–the coefficient of the interaction term is significantly higher in absolute
terms than the coefficient on the conditional variable– revealing an overall significant negative
effect (F-test: p < 0.01).
The results in Column (2) and (4) show that the effect is different for charity-motivated
workers. The interaction term “Charitable Incentives×Conditional” is negative but only signif-
icant in regression (2) (p = 0.02). F-test additionally show that the probability and the number
employer who acted kindly. But, despite this positive correlation, we find evidence supporting our predictions.
27
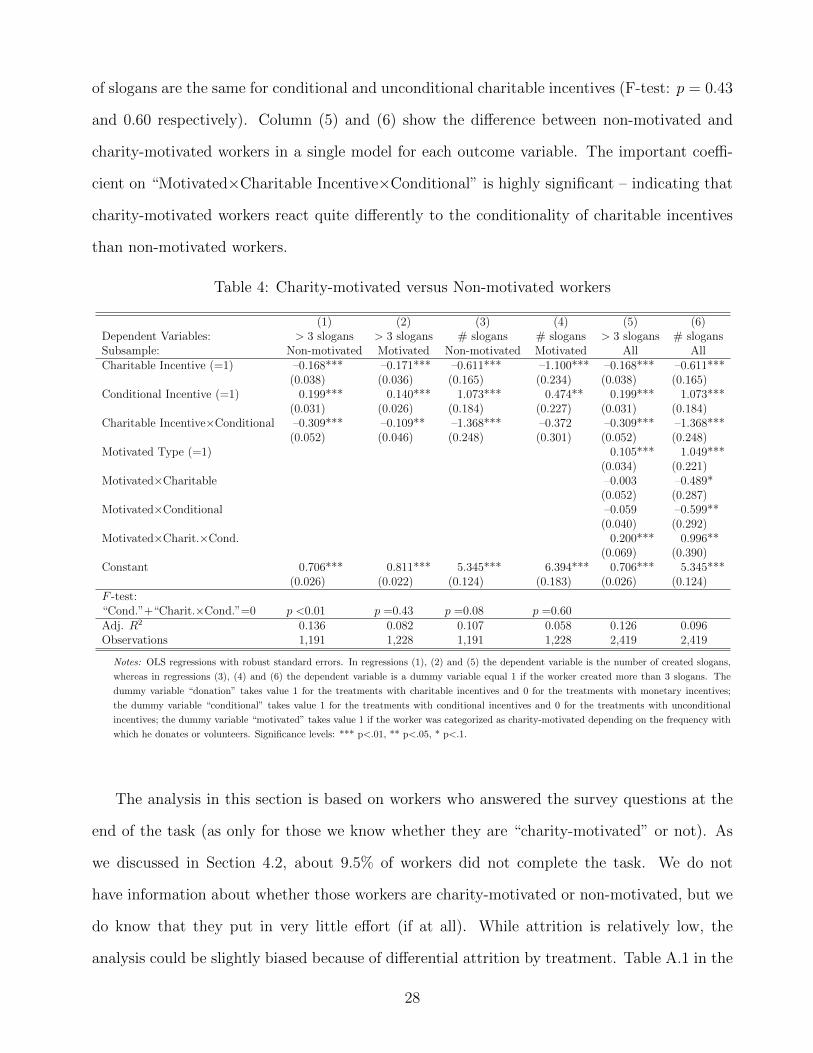
of slogans are the same for conditional and unconditional charitable incentives (F-test: p = 0.43
and 0.60 respectively). Column (5) and (6) show the difference between non-motivated and
charity-motivated workers in a single model for each outcome variable. The important coeffi-
cient on “Motivated×Charitable Incentive×Conditional” is highly significant – indicating that
charity-motivated workers react quite differently to the conditionality of charitable incentives
than non-motivated workers.
Table 4: Charity-motivated versus Non-motivated workers
(1) (2) (3) (4) (5) (6)Dependent Variables: > 3 slogans > 3 slogans # slogans # slogans > 3 slogans # slogansSubsample: Non-motivated Motivated Non-motivated Motivated All AllCharitable Incentive (=1) –0.168*** –0.171*** –0.611*** –1.100*** –0.168*** –0.611***
(0.038) (0.036) (0.165) (0.234) (0.038) (0.165)Conditional Incentive (=1) 0.199*** 0.140*** 1.073*** 0.474** 0.199*** 1.073***
(0.031) (0.026) (0.184) (0.227) (0.031) (0.184)Charitable Incentive×Conditional –0.309*** –0.109** –1.368*** –0.372 –0.309*** –1.368***
(0.052) (0.046) (0.248) (0.301) (0.052) (0.248)Motivated Type (=1) 0.105*** 1.049***
(0.034) (0.221)Motivated×Charitable –0.003 –0.489*
(0.052) (0.287)Motivated×Conditional –0.059 –0.599**
(0.040) (0.292)Motivated×Charit.×Cond. 0.200*** 0.996**
(0.069) (0.390)Constant 0.706*** 0.811*** 5.345*** 6.394*** 0.706*** 5.345***
(0.026) (0.022) (0.124) (0.183) (0.026) (0.124)F -test:“Cond.”+“Charit.×Cond.”=0 p <0.01 p =0.43 p =0.08 p =0.60Adj. R2 0.136 0.082 0.107 0.058 0.126 0.096Observations 1,191 1,228 1,191 1,228 2,419 2,419
Notes: OLS regressions with robust standard errors. In regressions (1), (2) and (5) the dependent variable is the number of created slogans,
whereas in regressions (3), (4) and (6) the dependent variable is a dummy variable equal 1 if the worker created more than 3 slogans. The
dummy variable “donation” takes value 1 for the treatments with charitable incentives and 0 for the treatments with monetary incentives;
the dummy variable “conditional” takes value 1 for the treatments with conditional incentives and 0 for the treatments with unconditional
incentives; the dummy variable “motivated” takes value 1 if the worker was categorized as charity-motivated depending on the frequency with
which he donates or volunteers. Significance levels: *** p<.01, ** p<.05, * p<.1.
The analysis in this section is based on workers who answered the survey questions at the
end of the task (as only for those we know whether they are “charity-motivated” or not). As
we discussed in Section 4.2, about 9.5% of workers did not complete the task. We do not
have information about whether those workers are charity-motivated or non-motivated, but we
do know that they put in very little effort (if at all). While attrition is relatively low, the
analysis could be slightly biased because of differential attrition by treatment. Table A.1 in the
28
Appendix shows that differential attrition lead to different distribution of charity-motivated
and non-motivated workers in the different treatments. It looks like that more non-motivated
agents decided not to work after being informed about the conditional charitable incentives
(there is no significant difference between all the other treatments). Therefore, if we assume
that all the workers who decided not to work are non-motivated, the effects that we report
are biased downwards. However, even if we assume that all of them are charity-motivated, our
results still hold that non-motivated workers react negatively to conditional prosocial incentives
(see Table A.4 in the Appendix).
As a final piece, we try to directly test if workers’ satisfaction with the incentives explains
why conditional charitable incentives backfire for non-motivated workers. For these agents,
we can use the treatment as an instrument for their satisfaction with the incentive and then
estimate its effect on their effort (for a similar approach, see Haggag and Pope, 2016). For
charity-motivated agents, we cannot use the treatment as an instrument as effort is directly af-
fected by conditional charitable incentives. Those agents work harder because this will increase
the donation to a cause they support. Therefore, the exclusion restriction is only met when
θ is close to zero. The results reported in Table 5 confirms our theory that making charita-
ble incentives conditional on performance are less satisfying for non-motivated workers. Using
the instrumented satisfaction variable indicates that an 1-point reduction in the satisfaction
with the incentive reduces the probability of doing more than three slogans by 0.276 points
(p = 0.03) and the number of slogans by 0.815 (p = 0.06).
In sum, our results support our Predictions 1 and 2 that performance-based charitable in-
centives have heterogeneous effects on effort depending on the charity-motivation of the worker.
For charity-motivated workers we observe a net effect of two countervailing forces: an incentive
effect that increases workers motivation to work more (and donate more as a result) and the
negative effect on effort because performance-based charitable incentives are perceived as less
kind. In our setting, the two effects seem to cancel each other out. For non-motivated workers,
however, the positive incentive effect is largely absent. The negative effect of making charitable
incentives performance-based dominates. As a result, performance-based charitable incentives
29

Table 5: IV Regressions
(1) (2)
First-stage regression: DV=Satisfaction choice incentiveConditional Charitable Incentive -0.444*** -0.444***
(0.15) (0.15)Constant 8.631*** 8.631***
(0.09) (0.09)First-Stage R2 0.0151 0.0151First-Stage F-Stat 8.17 8.17
Instrumental variables (2SLS) regression > 3 slogans # slogansSatisfaction with choice of incentives 0.276** 0.815*
(0.12) (0.44)Constant -1.837* -2.28
(1.05) (3.70)Wald χ2 4.90 3.45Observations 563 563
Notes: Table shows results of a 2SLS Regression for non-motivated agents in the charita-
ble incentives treatments. Dependent variable is 1 if worker did more than three slogans
and 0 otherwise (in Column 1) and the number of slogans (in Column 2). Significance
levels: *** p<.01, ** p<.05, * p<.1.
backfire.
5.3. Comparison to Baseline
Finally, a natural question is how workers react to performance-based and unconditional in-
centives relative to a baseline with no additional incentives. Note that our model in section 3
was not developed to make predictions on how, in our experiment, charitable incentives would
perform compared to a baseline with no incentives. One reason is that the workers in our
baseline treatment do not observe whether the “no-incentive” is the result of the firm choosing
not to make charitable donations or whether the firm is actually making charitable donations
but just not revealing it to the workers. These two possible scenarios can have almost opposite
implications on how workers perceive the firm’s motives and thus the kindness of the choice.
Another reason is that even unconditional incentives can be used instrumentally by an em-
ployer to increase workers’ effort. Making an unconditional donation can be the result of a
pure profit-maximizing strategy if this was done only because the employer expects that the
30
worker will react to it with higher effort. This argument is all the more valid in our experiment
where the size of the extra incentive (namely, the bonus or the donation) was half the baseline
pay and, therefore, it was clearly profit maximizing for the firm to get three more slogans with
the donation than to hire a new worker, pay the baseline pay and get three slogans this way.
Because of these arguments, it was not clear to us ex-ante how workers would react to chari-
table incentives, especially if unconditional, compared to no incentives. We, therefore, decided
to take an explorative approach in answering this question.
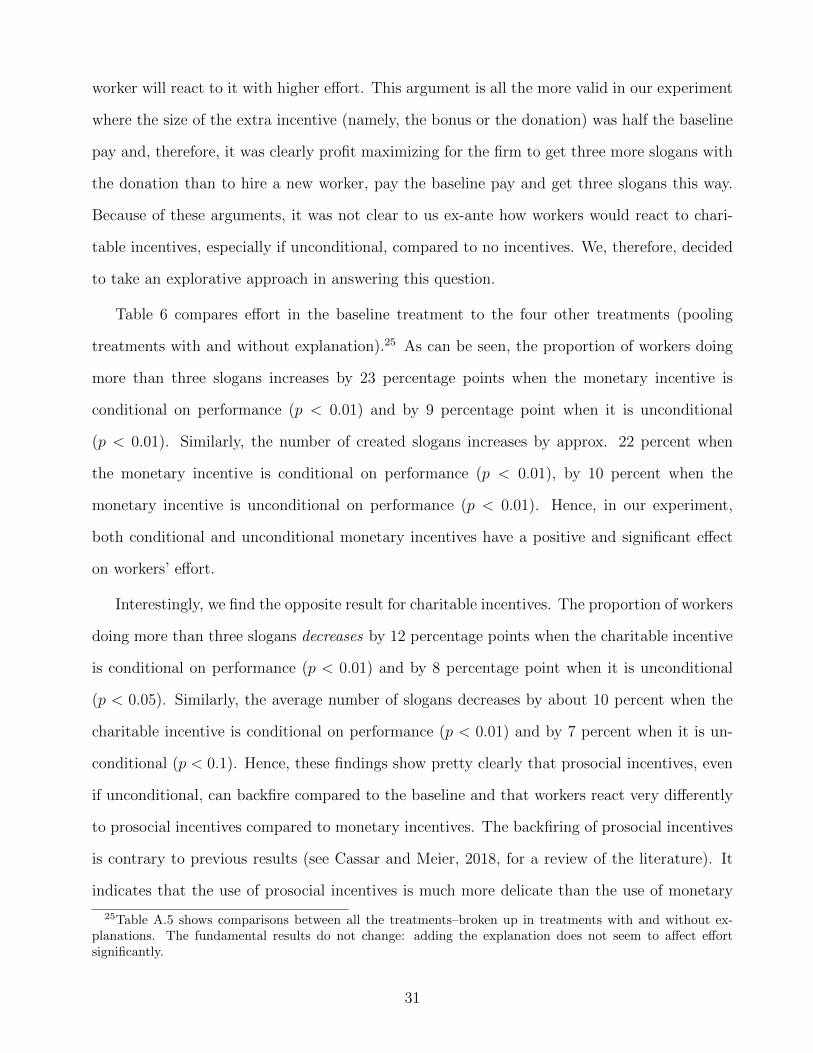
Table 6 compares effort in the baseline treatment to the four other treatments (pooling
treatments with and without explanation).25 As can be seen, the proportion of workers doing
more than three slogans increases by 23 percentage points when the monetary incentive is
conditional on performance (p < 0.01) and by 9 percentage point when it is unconditional
(p < 0.01). Similarly, the number of created slogans increases by approx. 22 percent when
the monetary incentive is conditional on performance (p < 0.01), by 10 percent when the
monetary incentive is unconditional on performance (p < 0.01). Hence, in our experiment,
both conditional and unconditional monetary incentives have a positive and significant effect
on workers’ effort.
Interestingly, we find the opposite result for charitable incentives. The proportion of workers
doing more than three slogans decreases by 12 percentage points when the charitable incentive
is conditional on performance (p < 0.01) and by 8 percentage point when it is unconditional
(p < 0.05). Similarly, the average number of slogans decreases by about 10 percent when the
charitable incentive is conditional on performance (p < 0.01) and by 7 percent when it is un-
conditional (p < 0.1). Hence, these findings show pretty clearly that prosocial incentives, even
if unconditional, can backfire compared to the baseline and that workers react very differently
to prosocial incentives compared to monetary incentives. The backfiring of prosocial incentives
is contrary to previous results (see Cassar and Meier, 2018, for a review of the literature). It
indicates that the use of prosocial incentives is much more delicate than the use of monetary
25Table A.5 shows comparisons between all the treatments–broken up in treatments with and without ex-planations. The fundamental results do not change: adding the explanation does not seem to affect effortsignificantly.
31
incentives and that firms should be careful in using prosocial incentives with the instrumental
goal of increasing effort.
Table 6: Comparison to Baseline
(1) (2)Dependent Variables: > 3 slogans # slogans
Constant (Baseline) 0.614*** 4.934***(0.027) (0.166)
Unconditional Monetary 0.092*** 0.546***(0.032) (0.203)
Conditional Monetary 0.231*** 1.130***(0.030) (0.200)
Unconditional Charitable –0.076** –0.345*(0.033) (0.193)
Conditional Charitable –0.121*** –0.554***(0.033) (0.195)
Adj. R2 0.074 0.048Observations 3,004 3,004
Notes: OLS regressions with robust standard errors. Depen-
dent variables: dummy variable equal 1 if the worker created
more than 3 slogans and 0 otherwise in (1), and the number
of created slogans in (2). Significance levels: *** p<.01, **
p<.05, * p<.1.
6. Conclusions
This paper investigates the limits of prosocial incentives by providing a mechanism through
which prosocial incentives can backfire. The important ingredient of our argument is that
workers’ response to prosocial incentives is not only based on the social cause underlying the
incentives but also on the employer’s perceived motive for offering those incentives. The em-
ployer’s motives matter because they affect how kind or unkind the choice of the incentive is
perceived to be, which, in turn, affects workers’ intrinsic or extrinsic incentive to reciprocate. In
particular, when prosocial incentives are used instrumentally, they are perceived as being less
kind by the workers and can, therefore, backfire. This is especially true for performance-based
32

prosocial incentives that are by construction more instrumental than unconditional incentives,
and for non-motivated workers who do not care to support the social cause underlying the
prosocial incentive.
We test these predictions in an experiment with around 3,000 workers, where we varied
whether the firm offered a private monetary bonus or a donation to a charity, and whether
these incentives were conditional or unconditional on workers’ performance. Consistent with
our theory we find that i) monetary and charitable incentives work very differently: while
performance-based monetary incentives increase effort compared to unconditional incentives,
the opposite is true for charitable incentives; ii) charitable incentives have heterogeneous effects
depending on the charity motivation of the workers: performance-based charitable incentives
largely backfire for agents who do not care about the charity; iii) workers are less satisfied
with the employer’s choice of offering conditional rather than unconditional incentives and this
relative dissatisfaction explains why performance-based donations backfire for non-motivated
agents. Finally, we also find that contrary to monetary incentives, conditional and unconditional
charitable incentives backfire even compared to a baseline with no incentives.
These findings reveal that prosocial incentives are much more delicate than previously
thought and firms cannot just instrumentally use prosocial incentives or CSR initiatives as
another tool in their HR strategy. According to our results, the argument that firms should
align their CSR strategy with their business interest (e.g. Porter and Kramer, 2007) or use CSR
instrumentally to motivate workers (e.g. Bhattacharya et al., 2008), misses the negative impact
this will have on their perceived motives. This is especially true for CSR initiatives that are
directly linked to employees’ effort, such as charitable giving as a reward for high performance
or as a share of firms’ sales and revenues. The benefits of CSR are likely to disappear when
used strategically. For firms that are not genuinely interested in socially responsibly behavior,
instrumental CSR can be worse than ineffective–it can backfire.
The effect of prosocial incentives will depend on the pool of workers in a firm. Past research
stressed rightly so that the presence of prosocial workers is crucial for the effectiveness of
prosocial incentives (see, e.g., Nyborg, 2014). Past studies, however, disregarded the role of
33
non-motivated agents as they expected no effect of prosocial incentives for those workers. We
show that focusing only on mission-motivated agents can be misleading for our understanding of
how prosocial incentives work, as it is missing that non-motivated agents react most negatively
to the instrumental use of prosocial incentives. Our experiment did not allow for sorting.
Selection by mission-motivated and non-motivated workers into different firms is, however, an
important issue that should be explored further.
34
References
Akerlof, George A, “Labor contracts as partial gift exchange,” The quarterly journal ofeconomics, 1982, 97 (4), 543–569.
Ambuehl, Sandro, Muriel Niederle, and Alvin E Roth, “More Money, More Problems?Can High Pay be Coercive and Repugnant?,” The American Economic Review, 2015,105 (5), 357–360.
Bagnoli, Mark and Susan G. Watts, “Selling to Socially Responsible Consumers: Competi-tion and The Private Provision of Public Goods,” Journal of Economics & ManagementStrategy, 2003, 12 (3), 419–445.
Bartling, Bjorn, Roberto A Weber, and Lan Yao, “Do markets erode social responsibil-ity?,” The Quarterly Journal of Economics, 2015, 130 (1), 219–266.
Benabou, Roland and Jean Tirole, “Individual and corporate social responsibility,” Eco-nomica, 2010, 77 (305), 1–19.
Berman, Jonathan Z, Emma E Levine, Alixandra Barasch, and Deborah A Small,“The braggart’s dilemma: On the social rewards and penalties of advertising prosocialbehavior,” Journal of Marketing Research, 2015, 52 (1), 90–104.
Besley, Timothy and Maitreesh Ghatak, “Retailing public goods: The economics of cor-porate social responsibility,” Journal of Public Economics, 2007, 91 (9), 1645–1663.
Bhattacharya, Chitra B, Sankar Sen, and Daniel Korschun, “Using corporate socialresponsibility to win the war for talent,” MIT Sloan Management Review, 2008, (2),37–44.
Bode, Christiane, Jasjit Singh, and Michelle Rogan, “Corporate social initiatives andemployee retention,” Organization Science, 2015, 26 (6), 1702–1720.
Bolton, Gary E. and Axel Ockenfels, “ERC: A Theory of Equity, Reciprocity, and Com-petition,” American Economic Review, March 2000, 90 (1), 166–193.
Brekke, Kjell Arne and Karine Nyborg, “Attracting responsible employees: Green produc-tion as labor market screening,” Resource and Energy Economics, 2008, 30 (4), 509–526.
Burbano, Vanessa, “Corporate Social Responsibility and Firm Performance: Field Experi-mental Evidence from Online Labor Marketplaces on the Role of Employee Salary Re-quirements,” Organization Science, 2016, (4), 1010–1028.
Cabral, Luis, Erkut Y. Ozbay, and Andrew Schotter, “Intrinsic and instrumental reci-procity: An experimental study,” Games and Economic Behavior, 2014, 87, 100 – 121.
Carlos, W Chad and Ben W Lewis, “Strategic Silence: Withholding Certification Status asa Hypocrisy Avoidance Tactic,” Administrative Science Quarterly, 2017, p. Forthcoming.
Carnahan, Seth, David Kryscynski, and Daniel Olson, “When Does Corporate SocialResponsibility Reduce Employee Turnover? Evidence from Attorneys Before and After9/11,” Academy of Management Journal, 2016, pp. amj–2015.
Carpenter, Jeffrey and David Dolifka, “Exploitation Aversion: When Financial IncentivesFail to Motivate Agents,” IZA Discussion Papers, 2013.
Cassar, Lea, “Job Mission as a Substitute for Monetary Incentives: Benefits and Limits,”Forthcoming in Management Science, 2017.
, “Optimal Contracting with Endogenous Project Mission,” CESifo WP 6181, 2017.
35
and Stephan Meier, “Nonmonetary Incentives and the Implications of Work as aSource of Meaning,” Journal of Economic Perspectives, 2018, 32 (3), 215–238.
Charness, Gary, Ramon Cobo-Reyes, and Angela Sanchez, “The effect of charitablegiving on workers’ performance. Experimental evidence,” 2014. Working Paper.
DellaVigna, Stefano and Devin Pope, “What Motivates Effort? Evidence and ExpertForecasts,” Review of Economic Studies, 2016, p. Forthcoming.
Delmas, Magali A and Vanessa Cuerel Burbano, “The drivers of greenwashing,” Cali-fornia Management Review, 2011, 54 (1), 64–87.
Dufwenberg, Martin and Georg Kirchsteiger, “A theory of sequential reciprocity,” Gamesand Economic Behavior, 2004, 47 (2), 268 – 298.
Dur, Robert, “Gift exchange in the workplace: Money or attention?,” Journal of the EuropeanEconomic Association, 2009, 7 (2-3), 550–560.
and Max van Lent, “Serving the Public Interest in Several Ways: Theory and Em-pirics,” Working Paper, 2016.
Elfenbein, Daniel W, Ray Fisman, and Brian McManus, “Charity as a substitute forreputation: Evidence from an online marketplace,” The Review of Economic Studies,2012, 79 (4), 1441–1468.
Ellingsen, Tore and Magnus Johannesson, “Pride and prejudice: The human side ofincentive theory,” The American Economic Review, 2008, 98 (3), 990–1008.
Esteves-Sorenson, Constanca, “Gift exchange in the workplace: Addressing the conflictingevidence with a careful test,” Management Science, 2017.
Falk, Armin and Michael Kosfeld, “The Hidden Costs of Control,” The American Eco-nomic Review, 2006, 96 (5), pp. 1611–1630.
and Urs Fischbacher, “A theory of reciprocity,” Games and Economic Behavior,2006, 54 (2), 293 – 315.
Fehr, Ernst and Klaus M. Schmidt, “A Theory Of Fairness, Competition, And Coopera-tion,” The Quarterly Journal of Economics, 1999, 114 (3), 817–868.
, Georg Kirchsteiger, and Arno Riedl, “Does fairness prevent market clearing? Anexperimental investigation,” The quarterly journal of economics, 1993, 108 (2), 437–459.
Fehrler, Sebastian and Michael Kosfeld, “Pro-Social Missions and Worker Motivation:An Experimental Study,” Journal of Economics Behavior and Organization, 2014, 100,99 – 110.
Flammer, Caroline and Jiao Luo, “Corporate social responsibility as an employee gover-nance tool: Evidence from a quasi-experiment,” Strategic Management Journal, 2017,38 (2), 163–183.
Gerhards, Leonie, “The incentive effects of missionsEvidence from experiments with NGOemployees and students,” European Economic Review, 2015, 79, 252 – 262.
Gneezy, Uri and Aldo Rustichini, “Pay enough or don’t pay at all,” The Quarterly Journalof Economics, 2000, 115 (3), 791–810.
and John A List, “Putting behavioral economics to work: Testing for gift exchangein labor markets using field experiments,” Econometrica, 2006, 74 (5), 1365–1384.
and Pedro Rey-Biel, “On the relative efficiency of performance pay and noncontingentincentives,” Journal of the European Economic Association, 2014, 12 (1), 62–72.
36
, Stephan Meier, and Pedro Rey-Biel, “When and why incentives (don’t) work tomodify behavior,” The Journal of Economic Perspectives, 2011, 25 (4), 191–209.
Goodman, Joseph K, Cynthia E Cryder, and Amar Cheema, “Data collection ina flat world: The strengths and weaknesses of Mechanical Turk samples,” Journal ofBehavioral Decision Making, 2013, 26 (3), 213–224.
Gosnell, Greer K, John A List, and Robert Metcalfe, “A new approach to an age-oldproblem: solving externalities by incenting workers directly,” NBER Working Paper,2016.
Haggag, Kareem and Devin G Pope, “Attribution Bias in Consumer Choice,” WorkingPaper, 2016.
Hedblom, Daniel, Brent R Hickman, and John A List, “Toward an Understanding ofCorporate Social Responsibility: Theory and Field Experimental Evidence,” 2016.
Henderson, Rebecca and Eric Van den Steen, “Why Do Firms Have “Purpose”? TheFirm’s Role as a Carrier of Identity and Reputation,” The American Economic Review,2015, 105 (5), 326–330.
Hennig-Schmidt, Heike, Abdolkarim Sadrieh, and Bettina Rockenbach, “In searchof workers’ real effort reciprocity?a field and a laboratory experiment,” Journal of theEuropean Economic Association, 2010, 8 (4), 817–837.
Imas, Alex, “Working for the “warm glow”: On the benefits and limits of prosocial incentives,”Journal of Public Economics, 2014, 114, 14 – 18.
, “The realization effect: Risk-taking after realized versus paper losses,” The AmericanEconomic Review, 2016, 106 (8), 2086–2109.
, Michael Kuhn, and Vera Mironova, “Waiting to Choose,” Working Paper, 2016.
Johnsen, Ashild A. and Ola Kvaloy, “Does strategic kindness crowd out prosocial behav-ior?,” Journal of Economic Behavior & Organization, 2016, 132, 1 – 11.
Johnson, Eric, Stephan Meier, and Olivier Toubia, “What’s The Catch? Exploringsluggish mortgage refinancing using administrative data, surveys, and field experiments,”Working Paper, 2016.
Kitzmueller, Markus and Jay Shimshack, “Economic Perspectives on Corporate SocialResponsibility,” Journal of Economic Literature, March 2012, 50 (1), 51–84.
Koppel, Hannes and Tobias Regner, “What drives motivated agents? The ”right” missionor sharing it with the principal,” Jena Economic Research Papers 2015.
Kotchen, Matthew J., “Green Markets and Private Provision of Public Goods,” Journal ofPolitical Economy, 2006, 114 (4), 816–834.
Levine, David K, “Modeling altruism and spitefulness in experiments,” Review of economicdynamics, 1998, 1 (3), 593–622.
List, John A and Fatemeh Momeni, “When Corporate Social Responsibility Backfires:Theory and Evidence from a Natural Field Experiment,” NBER Working Paper, 2017.
Newman, George E and Daylian M Cain, “Tainted altruism: When doing some goodis evaluated as worse than doing no good at all,” Psychological science, 2014, 25 (3),648–655.
Nyborg, Karine, “Do responsible employers attract responsible employees?,” IZA World ofLabor, 2014.
37
and Tao Zhang, “Is Corporate Social Responsibility Associated with Lower Wages?,”Environmental and Resource Economics, 2013, 55 (1), 107–117.
Orhun, A Yesim, “Perceived motives and reciprocity,” Games and Economic Behavior, 2018,109, 436–451.
Porter, Michael E and Mark R Kramer, “The Link Between Competitive Advantage andCorporate Social Responsibility,” Harvard business review, 2007.
PricewaterhouseCoopers, “Redefining business success in a changing world: CEO Survey,”Technical Report, PricewaterhouseCoopers 19th Annual Global CEO Survey 2016.
Rabin, M., “Incorporating fairness into game theory and economics,” American EconomicReview, 1993, 83 (5), 1281–1302.
Singh, Jasjit, Nina Teng, and Serguei Netessine, “Philanthropic Campaigns and Cus-tomer Behavior: Field Experiments in an Online Taxi Booking Company,” 2016.
Sobel, Joel, “Interdependent Preferences and Reciprocity,” Journal of Economic Literature,June 2005, 43 (2), 392–436.
Tonin, Micro and Michael Vlassopoulos, “Disentangling the sources of pro-socially mo-tivated effort: A field experiment,” Journal of Public Economics, 2010, 94 (11-12),1086–1092.
Tonin, Mirco and Michael Vlassopoulos, “Corporate philanthropy and productivity: Ev-idence from an online real effort experiment,” Management Science, 2015, 61 (8), 1795–1811.
38

A. Online Appendix
A.1. Additional Tables and Figures
Table A.1: Non-motivated and Charity-motivated Types by Treatment
Treatment Non-motivated Charity-motivated TotalUnconditional Monetary 163 154 317
51.42% 48.58%Unconditional Monetary w/ Explanation 153 153 306
50% 50%Conditional Monetary 149 150 299
49.83% 50.17%Unconditional Monetary w/ Explanation 155 154 309
50.16% 49.84%Unconditional Charitable 154 147 301
51.16% 48.84%Unconditional Charitable w/ Explanation 162 145 307
52.77% 47.23%Conditional Charitable 127 160 287
44.25% 55.75%Conditional Charitable w/ Explanation 128 165 293
43.69% 56.31%Baseline 138 162 300
46% 54%Total 1,329 1,390 2,719
48.88% 51.12% 100%
39
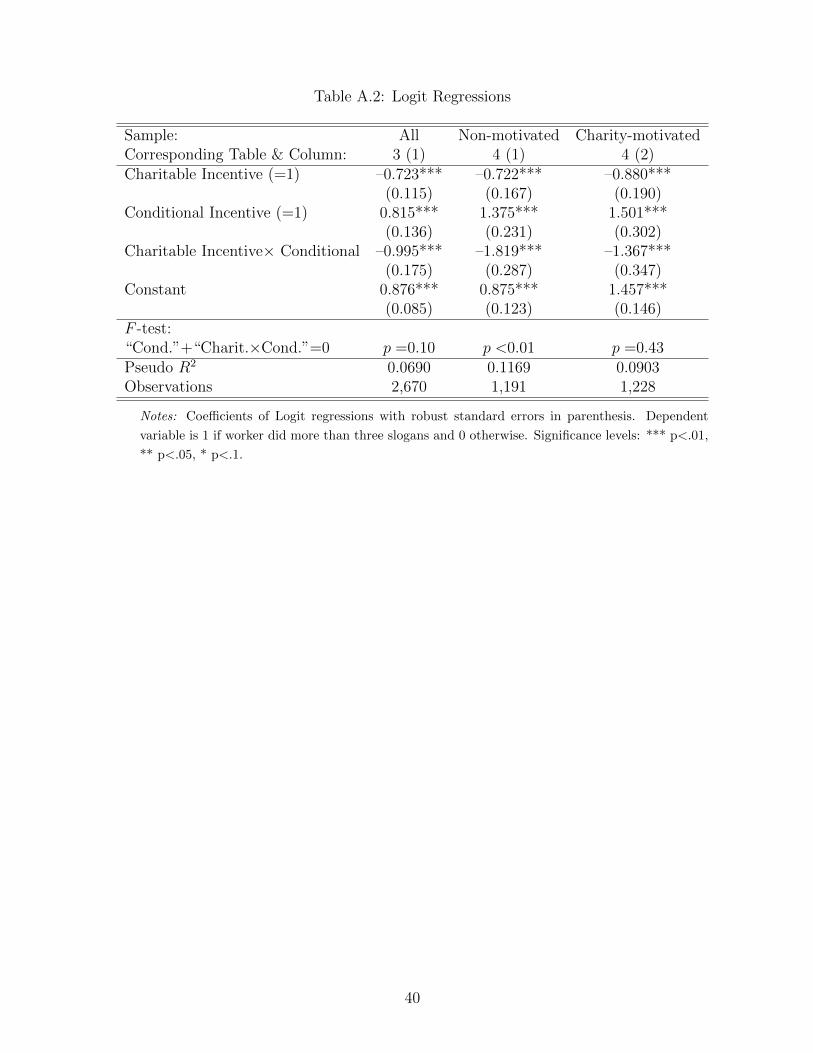
Table A.2: Logit Regressions
Sample: All Non-motivated Charity-motivatedCorresponding Table & Column: 3 (1) 4 (1) 4 (2)Charitable Incentive (=1) –0.723*** –0.722*** –0.880***
(0.115) (0.167) (0.190)Conditional Incentive (=1) 0.815*** 1.375*** 1.501***
(0.136) (0.231) (0.302)Charitable Incentive× Conditional –0.995*** –1.819*** –1.367***
(0.175) (0.287) (0.347)Constant 0.876*** 0.875*** 1.457***
(0.085) (0.123) (0.146)F -test:“Cond.”+“Charit.×Cond.”=0 p =0.10 p <0.01 p =0.43Pseudo R2 0.0690 0.1169 0.0903Observations 2,670 1,191 1,228
Notes: Coefficients of Logit regressions with robust standard errors in parenthesis. Dependent
variable is 1 if worker did more than three slogans and 0 otherwise. Significance levels: *** p<.01,
** p<.05, * p<.1.
40

Table A.3: Self-Reported Perception of Firm and Incentives
Soc. resp. Attractive Satisfied CalculatedCharitable Incentive (=1) 0.405*** –0.255** –0.375*** –0.131
(0.102) (0.104) (0.083) (0.114)Conditional Incentive (=1) –0.343*** –0.074 –0.484*** 0.139
(0.105) (0.105) (0.088) (0.116)Charitable Incentive× Conditional –0.003 –0.099 0.140 –0.266
(0.149) (0.151) (0.136) (0.168)Constant 7.239*** 7.482*** 9.056*** 7.741***
(0.072) (0.073) (0.055) (0.083)F -test:“Cond.”+“Charit.×Cond.”=0 p <0.01 p =0.11 p <0.01 p =0.29Adj. R2 0.020 0.007 0.023 0.004Observations 2,418 2,420 2,418 2,418
Notes: Coefficients of OLS regressions with robust standard errors in parenthesis. Dependent
variables are answers on 10-point scale to four questions about the firm (see Section A.2 for details).
“Soc. resp.”: Please rate PharmaGIC on a scale from 0 “Not at all socially responsible” to 10 “Very
socially responsible”; “Attractive”: How attractive would our company be as a potential employee? ;
“Satisfied”: How satisfied were you with the incentives that we provided for this task? ; “Calculated”:
How calculated do you think was our choice of incentives?. Significance levels: *** p<.01, ** p<.05,
* p<.1.
41

Table A.4: Non-motivated vs. Charity-motivated Workers – Robustness
(1) (2) (2)Classifying workers who drop out: excluded all non-motivated all charity-motivatedCharitable Incentive (=1) –0.168*** –0.158*** –0.168***
(0.038) (0.036) (0.038)Conditional Incentive (=1) 0.199*** 0.138*** 0.199***
(0.031) (0.034) (0.031)Charitable Incentive× Conditional –0.309*** –0.274*** –0.309***
(0.052) (0.050) (0.052)Motivated Type (=1) 0.105*** 0.194*** 0.001
(0.034) (0.034) (0.035)Motivated× Charitable –0.003 –0.012 –0.000
(0.052) (0.051) (0.052)Motivated× Conditional –0.059 0.001 –0.111**
(0.040) (0.043) (0.045)Motivated× Charitable×Conditional 0.200*** 0.164** 0.217***
(0.069) (0.068) (0.071)Constant 0.706*** 0.617*** 0.706***
(0.026) (0.026) (0.026)F -test:“Cond.”+“Charit.×Cond.”=0 p <0.01 p <0.01 p <0.01Adj. R2 0.126 0.145 0.089Observations 2,419 2,670 2,670
Notes: Table shows the robustness of our results to different classifications into charity-motivated and non-
motivated workers for workers who dropped out before indicating their charity-motivation. Column (1)
shows the main result in the paper that excludes those workers from the analysis. Column (2) assumes
that all workers who drop out are non-motivated. Column (3) assumes that all workers who drop out are
charity-motivated. Significance levels: *** p<.01, ** p<.05, * p<.1.
42
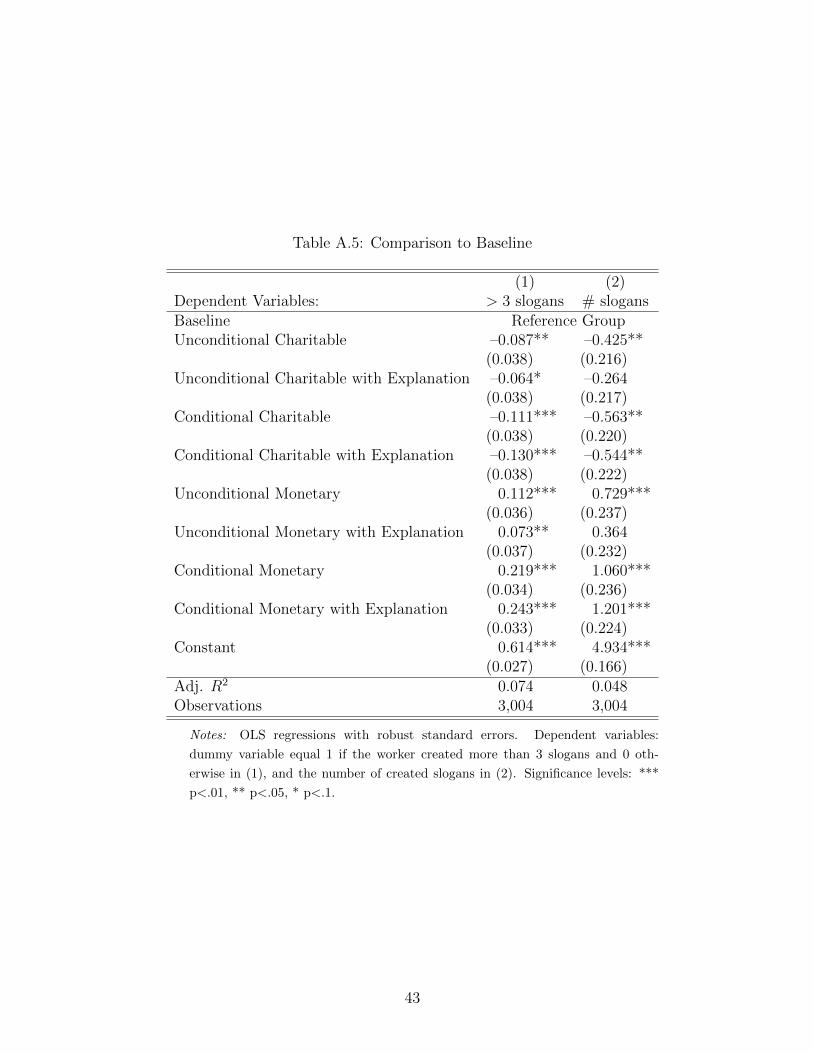
Table A.5: Comparison to Baseline
(1) (2)Dependent Variables: > 3 slogans # slogansBaseline Reference GroupUnconditional Charitable –0.087** –0.425**
(0.038) (0.216)Unconditional Charitable with Explanation –0.064* –0.264
(0.038) (0.217)Conditional Charitable –0.111*** –0.563**
(0.038) (0.220)Conditional Charitable with Explanation –0.130*** –0.544**
(0.038) (0.222)Unconditional Monetary 0.112*** 0.729***
(0.036) (0.237)Unconditional Monetary with Explanation 0.073** 0.364
(0.037) (0.232)Conditional Monetary 0.219*** 1.060***
(0.034) (0.236)Conditional Monetary with Explanation 0.243*** 1.201***
(0.033) (0.224)Constant 0.614*** 4.934***
(0.027) (0.166)Adj. R2 0.074 0.048Observations 3,004 3,004
Notes: OLS regressions with robust standard errors. Dependent variables:
dummy variable equal 1 if the worker created more than 3 slogans and 0 oth-
erwise in (1), and the number of created slogans in (2). Significance levels: ***
p<.01, ** p<.05, * p<.1.
43

Figure A.1: With and Without Explanation
.4.5
.6.7
.8.9
1
Mor
e Th
an T
hree
Slo
gans
Unconditional Conditional
Monetary IncentiveCharitable Incentive
Panel A: Without explanation
.4.5
.6.7
.8.9
1
Mor
e Th
an T
hree
Slo
gans
Unconditional Conditional
Panel B: With explanation
Notes: The graph shows the effect of making monetary or charitable incentives performance-based (“Conditional”) or notperformance-based (“Unconditional”) on the proportion of workers creating more than three slogans. The panels show the effect
for the treatments without explanation (Panel A) and with explanation (Panel B). Bars shows standard errors of the mean.
44

7.5
88.
59
9.5
Sat
isfa
ctio
n w
ith th
e in
cent
ive
Unconditional Conditional
Monetary IncentiveCharitable Incentive
Satisfaction with the incentive
Notes: The graph shows the effect of making monetary or charitable incentives performance-based (“Conditional”) or not performance-based(“Unconditional”) decrease the workers’ satisfaction. Bars shows standard errors of the mean.
45
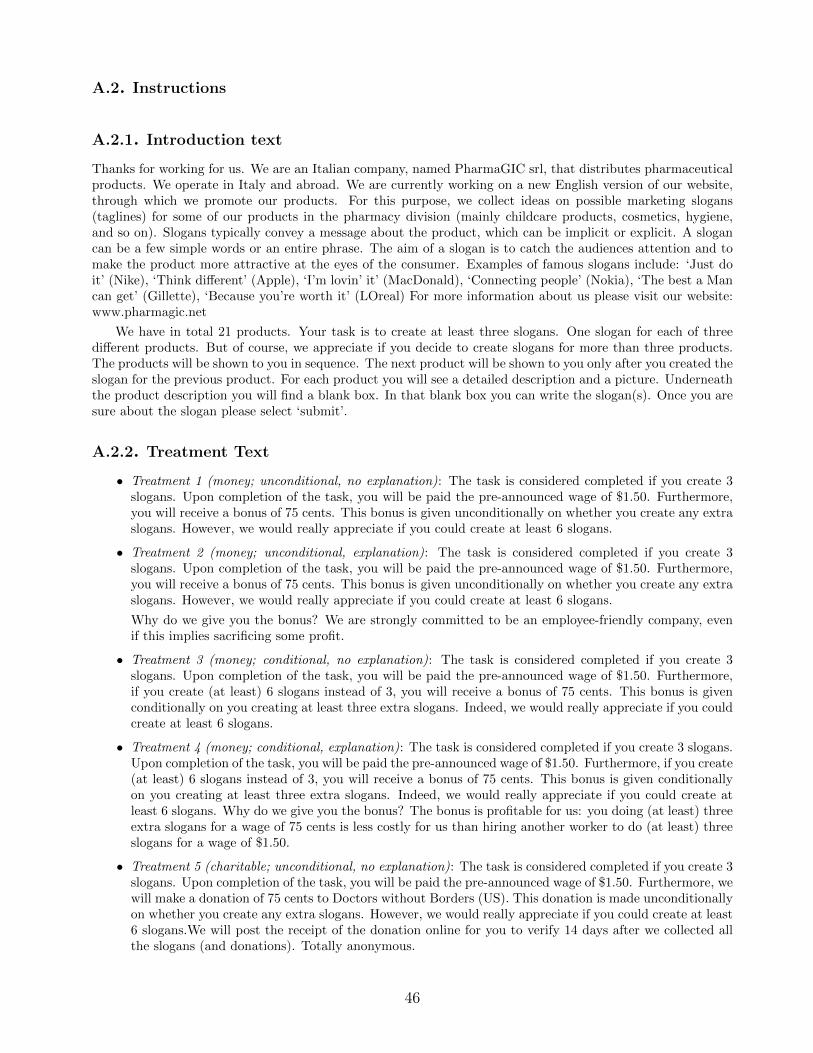
A.2. Instructions
A.2.1. Introduction text
Thanks for working for us. We are an Italian company, named PharmaGIC srl, that distributes pharmaceuticalproducts. We operate in Italy and abroad. We are currently working on a new English version of our website,through which we promote our products. For this purpose, we collect ideas on possible marketing slogans(taglines) for some of our products in the pharmacy division (mainly childcare products, cosmetics, hygiene,and so on). Slogans typically convey a message about the product, which can be implicit or explicit. A slogancan be a few simple words or an entire phrase. The aim of a slogan is to catch the audiences attention and tomake the product more attractive at the eyes of the consumer. Examples of famous slogans include: ‘Just doit’ (Nike), ‘Think different’ (Apple), ‘I’m lovin’ it’ (MacDonald), ‘Connecting people’ (Nokia), ‘The best a Mancan get’ (Gillette), ‘Because you’re worth it’ (LOreal) For more information about us please visit our website:www.pharmagic.net
We have in total 21 products. Your task is to create at least three slogans. One slogan for each of threedifferent products. But of course, we appreciate if you decide to create slogans for more than three products.The products will be shown to you in sequence. The next product will be shown to you only after you created theslogan for the previous product. For each product you will see a detailed description and a picture. Underneaththe product description you will find a blank box. In that blank box you can write the slogan(s). Once you aresure about the slogan please select ‘submit’.
A.2.2. Treatment Text
• Treatment 1 (money; unconditional, no explanation): The task is considered completed if you create 3slogans. Upon completion of the task, you will be paid the pre-announced wage of $1.50. Furthermore,you will receive a bonus of 75 cents. This bonus is given unconditionally on whether you create any extraslogans. However, we would really appreciate if you could create at least 6 slogans.
• Treatment 2 (money; unconditional, explanation): The task is considered completed if you create 3slogans. Upon completion of the task, you will be paid the pre-announced wage of $1.50. Furthermore,you will receive a bonus of 75 cents. This bonus is given unconditionally on whether you create any extraslogans. However, we would really appreciate if you could create at least 6 slogans.
Why do we give you the bonus? We are strongly committed to be an employee-friendly company, evenif this implies sacrificing some profit.
• Treatment 3 (money; conditional, no explanation): The task is considered completed if you create 3slogans. Upon completion of the task, you will be paid the pre-announced wage of $1.50. Furthermore,if you create (at least) 6 slogans instead of 3, you will receive a bonus of 75 cents. This bonus is givenconditionally on you creating at least three extra slogans. Indeed, we would really appreciate if you couldcreate at least 6 slogans.
• Treatment 4 (money; conditional, explanation): The task is considered completed if you create 3 slogans.Upon completion of the task, you will be paid the pre-announced wage of $1.50. Furthermore, if you create(at least) 6 slogans instead of 3, you will receive a bonus of 75 cents. This bonus is given conditionallyon you creating at least three extra slogans. Indeed, we would really appreciate if you could create atleast 6 slogans. Why do we give you the bonus? The bonus is profitable for us: you doing (at least) threeextra slogans for a wage of 75 cents is less costly for us than hiring another worker to do (at least) threeslogans for a wage of $1.50.
• Treatment 5 (charitable; unconditional, no explanation): The task is considered completed if you create 3slogans. Upon completion of the task, you will be paid the pre-announced wage of $1.50. Furthermore, wewill make a donation of 75 cents to Doctors without Borders (US). This donation is made unconditionallyon whether you create any extra slogans. However, we would really appreciate if you could create at least6 slogans.We will post the receipt of the donation online for you to verify 14 days after we collected allthe slogans (and donations). Totally anonymous.
46
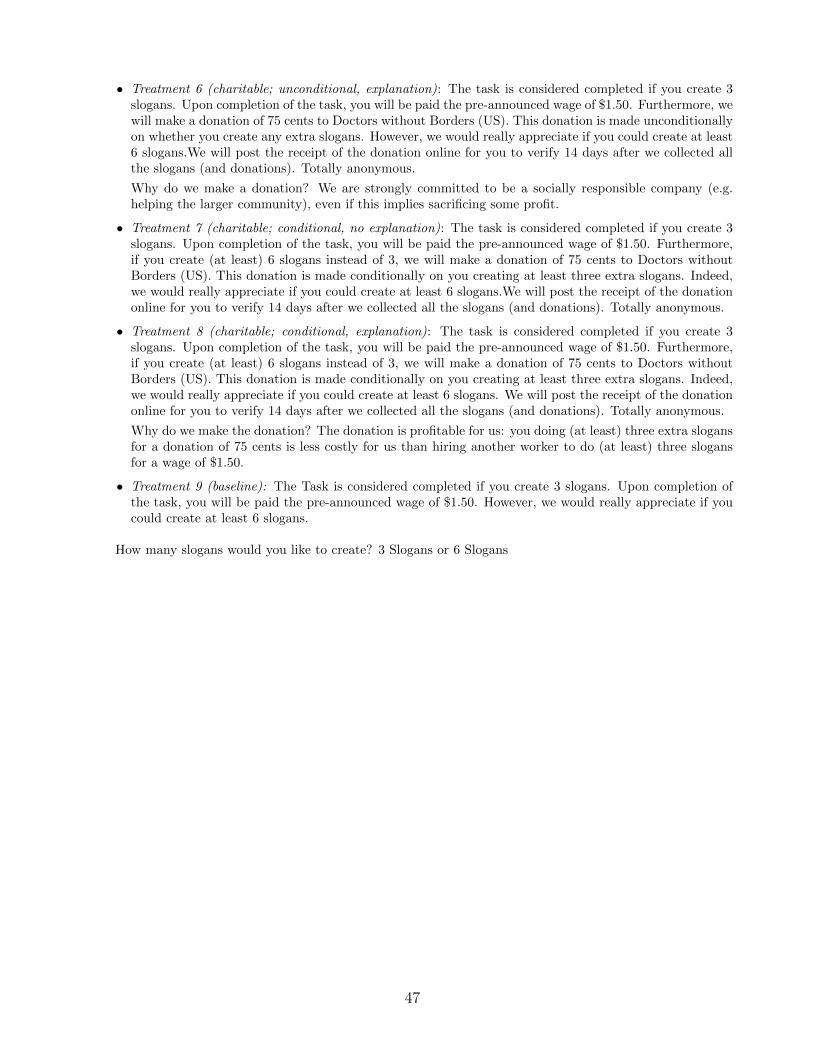
• Treatment 6 (charitable; unconditional, explanation): The task is considered completed if you create 3slogans. Upon completion of the task, you will be paid the pre-announced wage of $1.50. Furthermore, wewill make a donation of 75 cents to Doctors without Borders (US). This donation is made unconditionallyon whether you create any extra slogans. However, we would really appreciate if you could create at least6 slogans.We will post the receipt of the donation online for you to verify 14 days after we collected allthe slogans (and donations). Totally anonymous.
Why do we make a donation? We are strongly committed to be a socially responsible company (e.g.helping the larger community), even if this implies sacrificing some profit.
• Treatment 7 (charitable; conditional, no explanation): The task is considered completed if you create 3slogans. Upon completion of the task, you will be paid the pre-announced wage of $1.50. Furthermore,if you create (at least) 6 slogans instead of 3, we will make a donation of 75 cents to Doctors withoutBorders (US). This donation is made conditionally on you creating at least three extra slogans. Indeed,we would really appreciate if you could create at least 6 slogans.We will post the receipt of the donationonline for you to verify 14 days after we collected all the slogans (and donations). Totally anonymous.
• Treatment 8 (charitable; conditional, explanation): The task is considered completed if you create 3slogans. Upon completion of the task, you will be paid the pre-announced wage of $1.50. Furthermore,if you create (at least) 6 slogans instead of 3, we will make a donation of 75 cents to Doctors withoutBorders (US). This donation is made conditionally on you creating at least three extra slogans. Indeed,we would really appreciate if you could create at least 6 slogans. We will post the receipt of the donationonline for you to verify 14 days after we collected all the slogans (and donations). Totally anonymous.
Why do we make the donation? The donation is profitable for us: you doing (at least) three extra slogansfor a donation of 75 cents is less costly for us than hiring another worker to do (at least) three slogansfor a wage of $1.50.
• Treatment 9 (baseline): The Task is considered completed if you create 3 slogans. Upon completion ofthe task, you will be paid the pre-announced wage of $1.50. However, we would really appreciate if youcould create at least 6 slogans.
How many slogans would you like to create? 3 Slogans or 6 Slogans
47

A.2.3. Example Product
A.2.4. Survey Questions
In order to understand your experience with us, we kindly ask you to fill a short survey.
• What is your gender?Male, Female, Other
• How attractive would our company be as a potential employee?“Not attractive at all” 0- 10 “Very attractive”
• Please rate PharmaGIC on a scale from 0 “Not at all socially responsible” to 10 “Very socially responsible”“Not at all socially responsible” 0- 10 “Very socially responsible”
• How satisfied were you with the incentives that we provided for this task?“Not at all satisfied” 0- 10 “Very satisfied”
• What do you think:
1. How many other M-Turkers did more than 3 slogans? (0% - 100%)
2. How many other M-Turkers did more than 6 slogans? (0% - 100%)
48

3. How many slogans did the others do on average?
• How satisfying are the incentives for other M-Turkers?“Not at all satisfied” 0- 10 “Very satisfied”
• How calculated do you think was our choice of incentives?“Not at all calculated” 0- 10 “Very calculated”
• How often do you donate money to a charitable organization?Never, Rarely, Sometimes, Often, Regularly
• How often do you volunteer for a good cause?Never, Rarely, Sometimes, Often, Regularly
• Let us know your opinion about our task and our incentives:
49