intentionally blank slide. the epri supergrid initiative -update- paul m. grant visiting scholar in...
TRANSCRIPT

Intentionally Blank Slide

The EPRI SuperGrid Initiative-Update-
Paul M. GrantVisiting Scholar in Applied Physics, Stanford University
EPRI Science Fellow (retired)IBM Research Staff Member Emeritus
Principal, W2AGZ [email protected]
www.w2agz.com
Chauncey Starr2000 George E. Pake Prize, American Physical Society
National Medal of Engineering, 1990Legion d’Honneur, Republique Francais
Founder, Electric Power Research [email protected]
Steve EckroadProject Manager, EPRI Superconductivity Destinations 122
5th EPRI Superconductivity Conference & Task Force Meeting20 - 21 September 2005, Albany, NY
www.w2agz.com/epri-sctf5.htm

“A Thread Across the Ocean”
“The Story of the Trans-Atlantic Cable (1854 – 1866)”
John Steele Gordon

Atlantic Cable Timeline & Designs
1857“Broke” 1858
“Worked for a Month”
1865“Parted”
(Recovered in 1866)1866
Success!
2 $/m(2005)
200 A @ 10
$/kAm
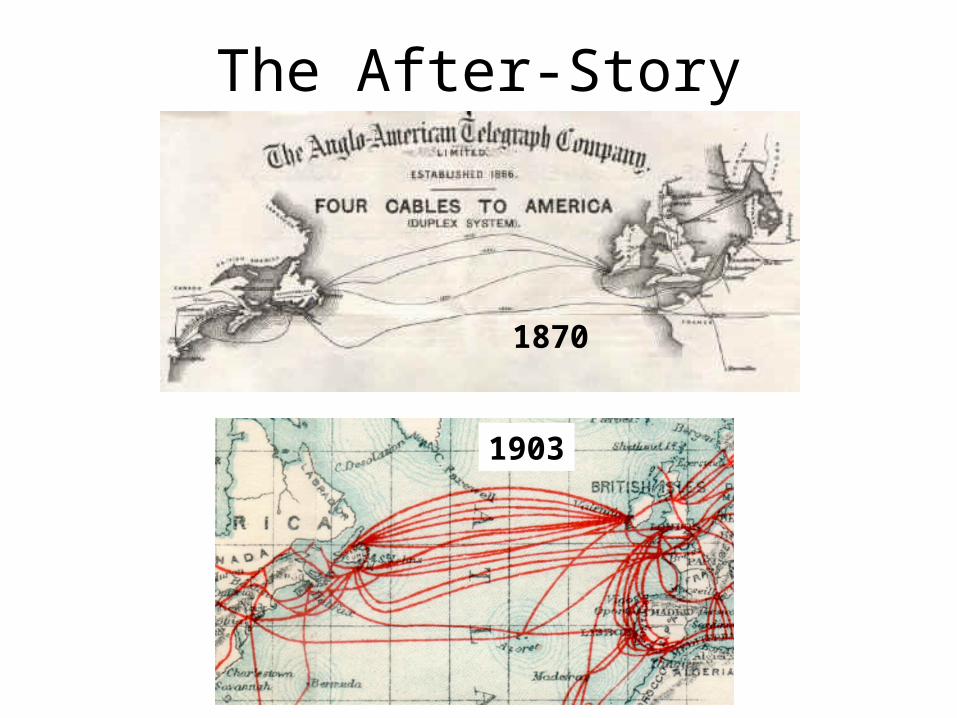
The After-Story
1870
1903

What Kept Them Going?
• The investors knew, that if communications with Europe could be cut from 2 weeks to 2 minutes, they’d all get…
• FILTHY RICH!– Estimates are that the total cost of the
project in 2005 dollars was $100 M– 1867 revenue in 2005 dollars was $10 M– Go figure…

A Symbiosis of
Nuclear/Hydrogen/Superconductivity
Technologies supplying Carbon-free, Non-Intrusive Energy for all
Inhabitants of Planet Earth
The SuperGrid Vision
SuperCities & SuperGrids
SuperCables !
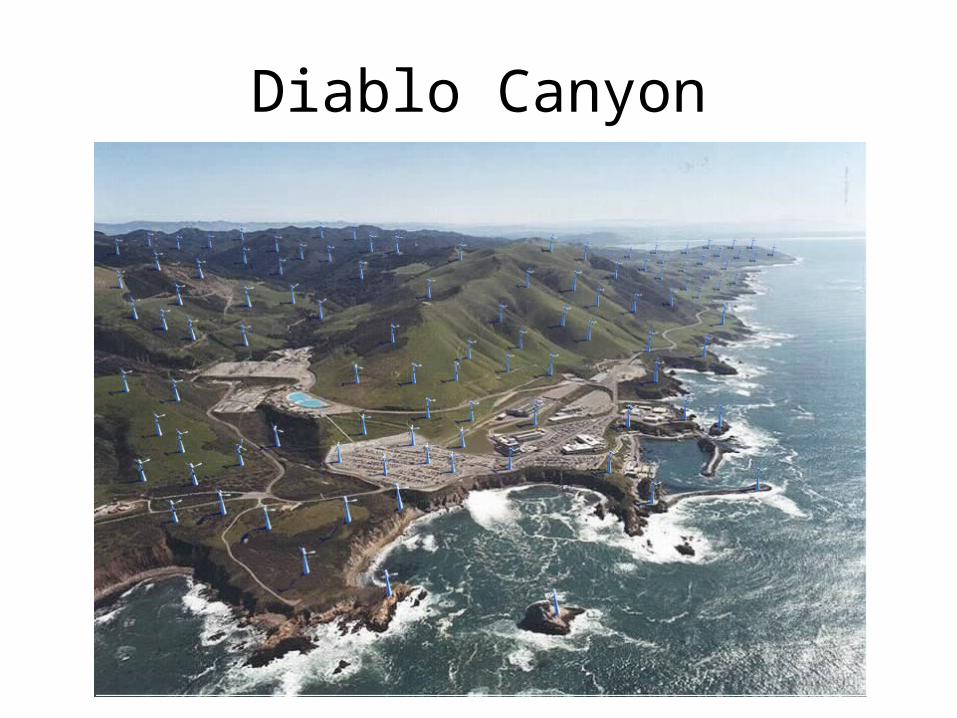
Diablo Canyon

California Coast Power
Diablo Canyon
2200 MWPower Plant
Wind FarmEquivalent
5 Miles

Co-Production of Hydrogen and Electricity
Source: INEL & General Atomics
ReactorVessel
O2

“Hydricity” SuperCables
+v I-v
I
H2 H2
Circuit #1 +v I-v
I
H2 H2
Circuit #2
Multiple circuitscan be laid in single trench
Bartlit, Edeskuty, & Hammel (1972)

SuperCable MonopoleHV Insulation
“Super-Insulation”
Superconductor
Hydrogen
DO
DH2
tsc
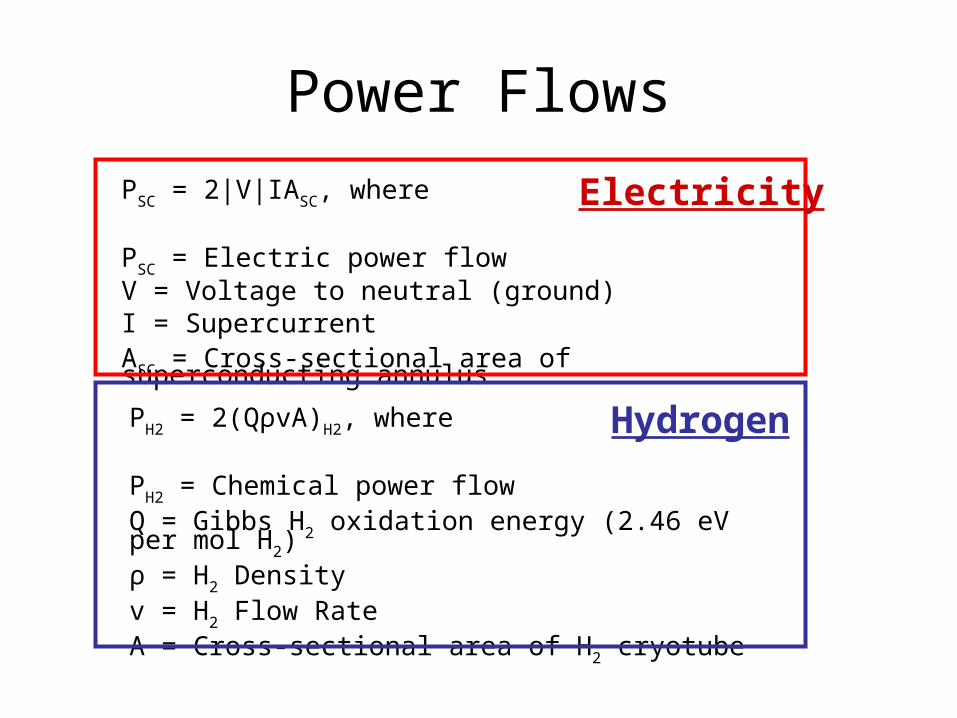
Power Flows
PSC = 2|V|IASC, where PSC = Electric power flowV = Voltage to neutral (ground)I = SupercurrentASC = Cross-sectional area of superconducting annulus
Electricity
PH2 = 2(QρvA)H2, where PH2 = Chemical power flow Q = Gibbs H2 oxidation energy (2.46 eV per mol H2)ρ = H2 Density v = H2 Flow Rate A = Cross-sectional area of H2 cryotube
Hydrogen

Hydricity Scaling Factor
/ /e/hR J Q V
Dimensionless, geometry-independent scaling factor defines relative amounts of electricity/hydrogen power flow in the SuperCable:
“Energy Density” “Pressure”

Electric & H2 Power
0.12525,000100,000+/- 50001000
Annular Wall
Thickness (cm)
Critical Current Density (A/cm2)
Current (A)
Voltage (V)
Power (MW)
Electricity
3183.8110500
“Equivalent” Current
Density (A/cm2)
H2 Flow Rate (m/sec)
Inner Pipe Diameter, DH2
(cm)
Power (MW)
Hydrogen (LH2, 20 K)

SuperCable H2 Storage
Some Storage Factoids
Power (GW)
Storage (hrs) Energy (GWh)
TVA Raccoon Mountain
1.6 20 32
Alabama CAES 1 20 20
Scaled ETM SMES 1 8 8
One Raccoon Mountain = 13,800 cubic meters of LH2
LH2 in 10 cm diameter, 250 mile bipolar SuperCable = Raccoon Mountain

H2 Gas at 77 K and 1850 psia has 50% of the energy content of liquid H2
and 100% at 6800 psia
Relative Density of H2 as a Function of Pressure at 77 K wrt LH2 at 1 atm
0
0.2
0.4
0.6
0.8
1
1.2
0 2000 4000 6000 8000 10000
Pressure (psia)
Rh
o(H
2)/R
ho
(LH
2)
Vapor
Supercritical
50% LH2
100% LH2

Supercritical H2 SuperCable
Electrical Insulation
“Super-Insulation”
Superconductor
Supercritical Hydrogen @ 77 K1000 – 7000 psia
Liquid Nitrogen @ 77 K

A Canadian’s View of the World

Electrical Insulation
“Super-Insulation”
Superconductor
LNG @ 105 K1 atm (14.7 psia)
Liquid Nitrogen @ 77 K
Thermal Barrier to
LNG
LNG SuperCable
Design for eventual conversion to high pressure cold or liquid H2
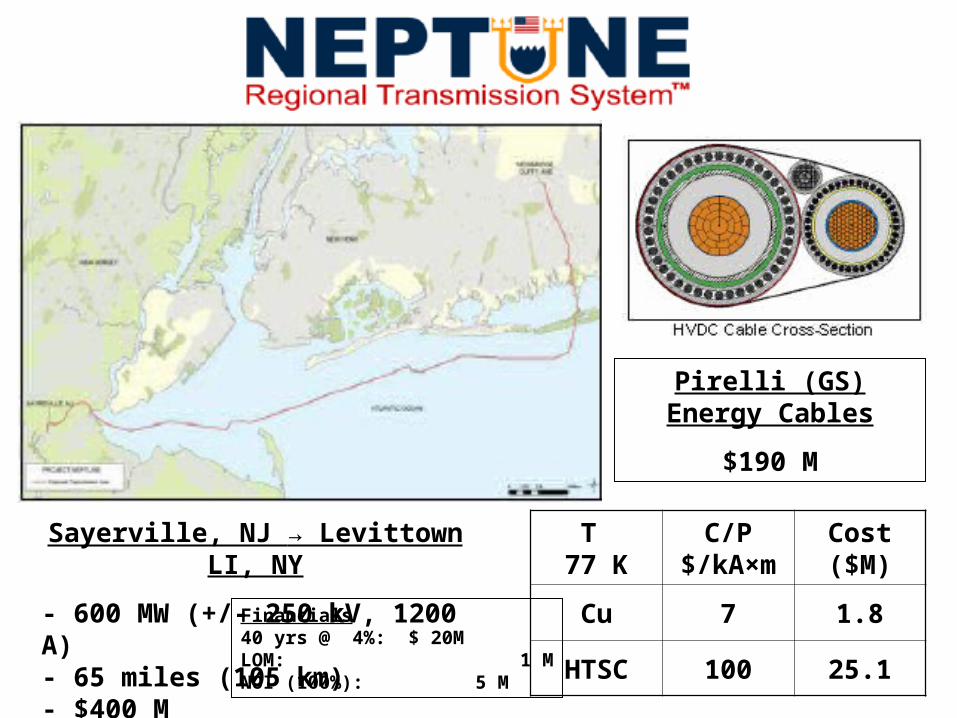
Sayerville, NJ → Levittown LI, NY
- 600 MW (+/- 250 kV, 1200 A)- 65 miles (105 km)- $400 M- 2007
Pirelli (GS)Energy Cables
$190 M
T 77 K
C/P$/
kA×m
Cost ($M)
Cu 7 1.8
HTSC 100 25.1
Financials40 yrs @ 4%: $ 20MLOM: 1 MNOI (100%): 5 M

Financials
$750 M ($400 M “VC”, $350 M “Futures”)
• Loan Payment (4%, 40 yrs, 750 M$) = 35 M$/yr
• Labor, Overhead, Maintenance = 5 M$/yr• Tariff = 0.5 ¢/kWh• Profit (NOI) @ 50% Capacity = 4 M$/yr• Profit (NOI) @ Full Capacity = 48 M$/yr
Specifications
2-1000 MW HVDC Bipolar Circuits
• Circuit 1: 130 miles, Greene County → Bronx County• Circuit 2: 140 miles, Albany County → New York County• Each Circuit: +/- 500 kV, 1000 A Bipolar (2 cables ea.)
Why didn’t it go forward?HTSC Cost = $87 M

“JC’s” of Common Metals (77 K)

Could dc Cables be the HTSC “Thread?”
• Advantages of dc– Only dc can go long distances– Allows asynchronous connection of ac
grids– Power flow can be controlled quickly
(HTSC?)
• Advantages of HTSC dc– Can wheel enormous amounts of power
over very long distances with minimal loss

Two IBM Physicists (1967)
• Nb3Sn (TC = 18 K) @ 4.2 K
• 100 GW (+/- 100 kV, 500 kA)• 1000 km• Cost: $800 M ($8/kW) (1967)
$4.7 B Today!

G-M Specs

LASL SPTL (1972-79)
Specifications• 5 GW
(+/- 50 kV, 50 kA)
• PECO Study (100 km, 10 GW)

BICC HTSC dc Cable (1995)
Design Target• 400 MW, 100 km• Flowing He, 0.2 kg/s, 2
MPa, 15 – 65 K• Cooling Losses: 150
kW
Prototype Specs• 400 MW
– +/- 20 kV, 10 kA
• Length: 1.4 m• Diameter: 4 cm• He (4.2 – 40 K)

e-Pipe
I-V
Ground
Structural Support
SuperconductingElectricityPipeline
ThermalInsulation
ElectricalInsulation
Superconductor(-V)
Superconductor(+V)
+VI
LiquidNitrogen

e-Pipe Specs (EPRI, 1997)
Capacity5 GW (+/- 50 kV,50 kA)
Length 1610 km
Temperature Specs: - 1 K/10 km @ 65 K - 1 W/m heat input
- 21.6 kliters LN2/hr
- 100 kW coolers- 120 gal/min
Vacuum: - 10-5 – 10-4 torr
- 10 stations- 10 km spaced- 200 kW each

Marginal Cost of Electricity (Mid Value Fuel Costs)
0.60
0.80
1.00
1.20
1.40
1.60
1.80
2.00
2.20
0 500 1000 1500 2000 2500
Miles
c/k
Wh
LVDC ($5.5/kA-m @ 65K)
LVDC ($10/kA-m @ 77K)
HVDC
gas pipeline
e-Pipe/Gas/HVDC Cost Comparison
Marginal Cost of Electricity (Mid Value Fuel Costs)
0.60
0.80
1.00
1.20
1.40
1.60
1.80
2.00
2.20
0 500 1000 1500 2000 2500
Miles
c/k
Wh
LVDC ($5.5/kA-m @ 65K)
LVDC ($10/kA-m @ 77K)
HVDC
gas pipeline
US
ce
nts
/kW
h
Miles
HTSC ($5/kA-m @ 65 K) beats HVDC and Gas!

I I
HV Insulation
“Super-Insulation”
Superconductor
Liquid Nitrogen
DO
Dcryo
tsc
HTSC SuperCable
Garwin – Matisoo
Revisited !
Why Monaxial?- Simple- Known Dielectric- Easy to Install & Service

SuperCable Parameters• Power = 5 GW• Voltage = 25 +/- kV• Current = 100 kA• Jc = 25000 A/cm^2• Dcryo = 5 cm• A* = 3.629 cm^2• t(sc) = 0.243 cm• R* = 1.075 cm• B = 0.8 T

AMSC Tape Jc(T, B)
Parallel
De-ratingFactor
0.8 T
I’m not going to show you the perpendicular data!

High Amplitude Transient Current Losses (ac & energize)
Io (A) F (Hz) H (W/m)
100,000 60 2.4 × 10⁵
100,000 1/hour 0.3
100,000 1/day 0.01
Possibly could reverse line in one hour!
“Bean Model”

Small Amplitude Losses(Load Fluctuations)
Δ (%) ΔI (A) ΔP (MW) H (W/m)
1 1000 50 4 × 10⁻⁷
10 10000 500 4 × 10⁻⁴
20 20000 1000 3 × 10⁻³
30 30000 1500 1 × 10⁻²
Load Fluctuation Losses over a 1 hour period
OK, as long as changes occur slowly!

Small Amplitude Losses(Load Fluctuations)
…and sometimes even when they’re fast!
Consider 1 MW worth of customers coming in and out every millisecond, (e.g., 10,000 teenagers simultaneously switching 100 W light bulbs on and off) resulting in ΔI = 20 A, but a heat load of only 10 μW/m

Small Amplitude Losses(Ripple)
Δ (%) ΔI (A) ΔP (MW) H (W/m)
1 1000 50 0.50
2 2000 100 3.99
3 3000 150 13.46
4 4000 200 31.91
5 5000 250 62.32
3-Phase Converter: F = 360 Hz

Radiative Heat In-Leak
WR = 0.5εσ (T4amb – T
4SC)/(n-1), where
WR = Power radiated in as watts/unit area
σ = 5.67×10⁻¹² W/cm2K4
Tamb = 300 K
TSC = 65 - 77 K
ε = 0.05 per inner and outer tube surface
DSC = 5 cm
n = number of layers of superinsulation (10)
Then WR = 0.2 W/m

Fluid Dynamics of Liquid Nitrogen Flow through a 5-cm Diameter Pipe at 1
bar
T K
kg/m3
Pa×s
2/ndyne
Vm/s
Re106
77 808 163 3290 4 9.91
65 860 280 9148 4 12.3
Inertial Forces
Viscous ForcesRe /VD
Thus, it takes about 30 - 100 dynes “push” on an object to overcome viscous forces exerted by the liquid nitrogen
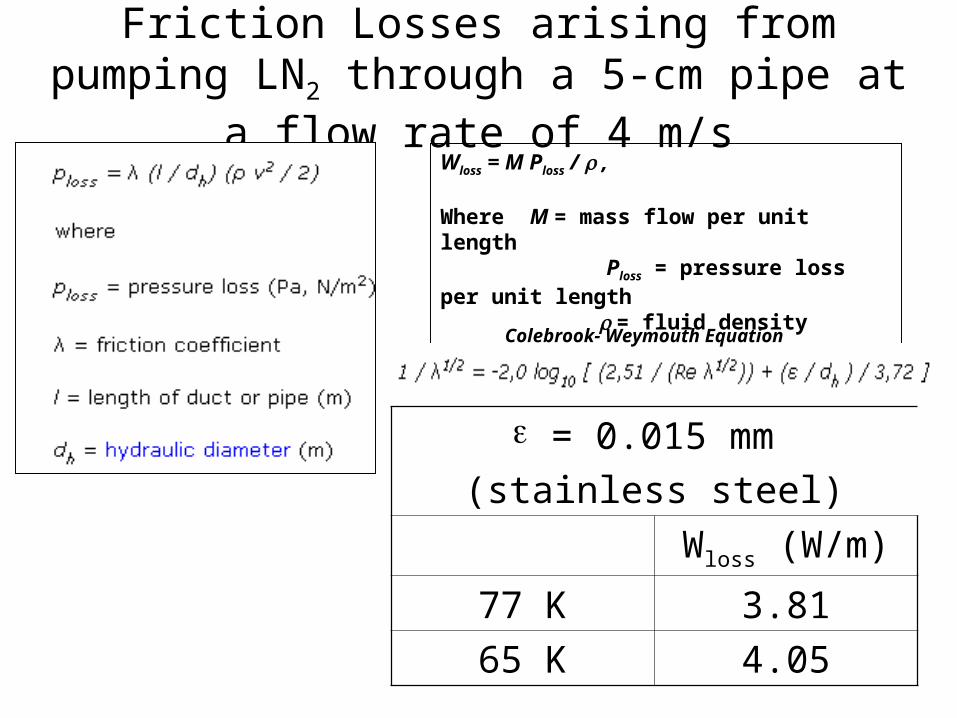
Friction Losses arising from pumping LN2 through a 5-cm pipe at a flow rate of 4
m/sWloss = M Ploss / ,
Where M = mass flow per unit length Ploss = pressure loss per unit length = fluid density
= 0.015 mm (stainless steel)
Wloss (W/m)
77 K 3.81
65 K 4.05
Colebrook- Weymouth Equation
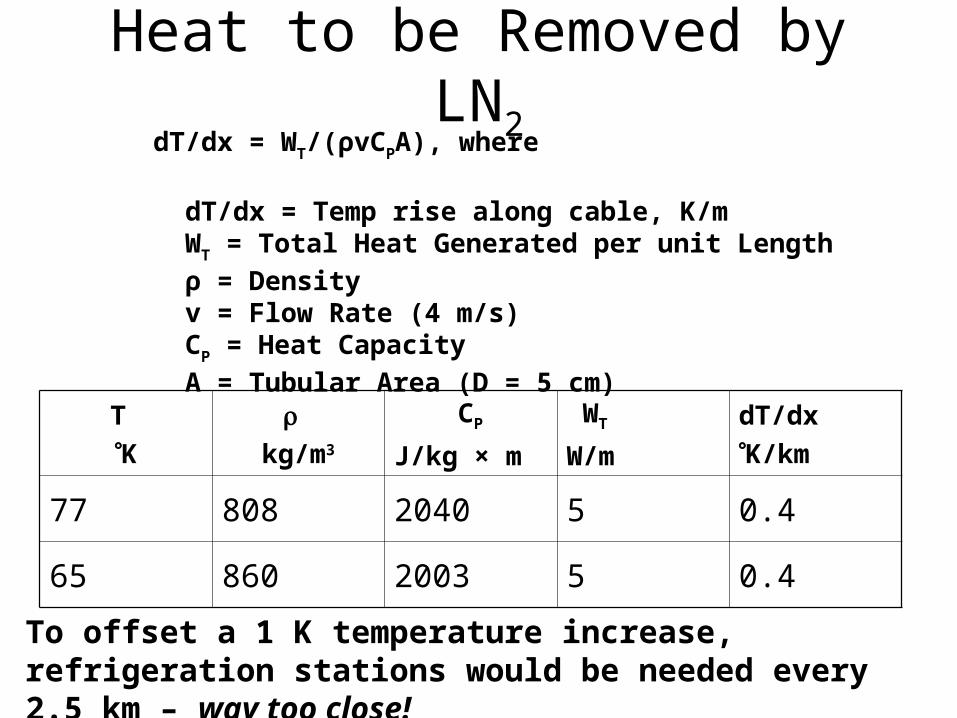
Heat to be Removed by LN2
dT/dx = WT/(ρvCPA), where dT/dx = Temp rise along cable, K/m WT = Total Heat Generated per unit Length ρ = Density v = Flow Rate (4 m/s) CP = Heat Capacity A = Tubular Area (D = 5 cm)
T K
kg/m3
CP
J/kg × m
WT
W/m
dT/dxK/km
77 808 2040 5 0.4
65 860 2003 5 0.4
To offset a 1 K temperature increase, refrigeration stations would be needed every 2.5 km – way too close!
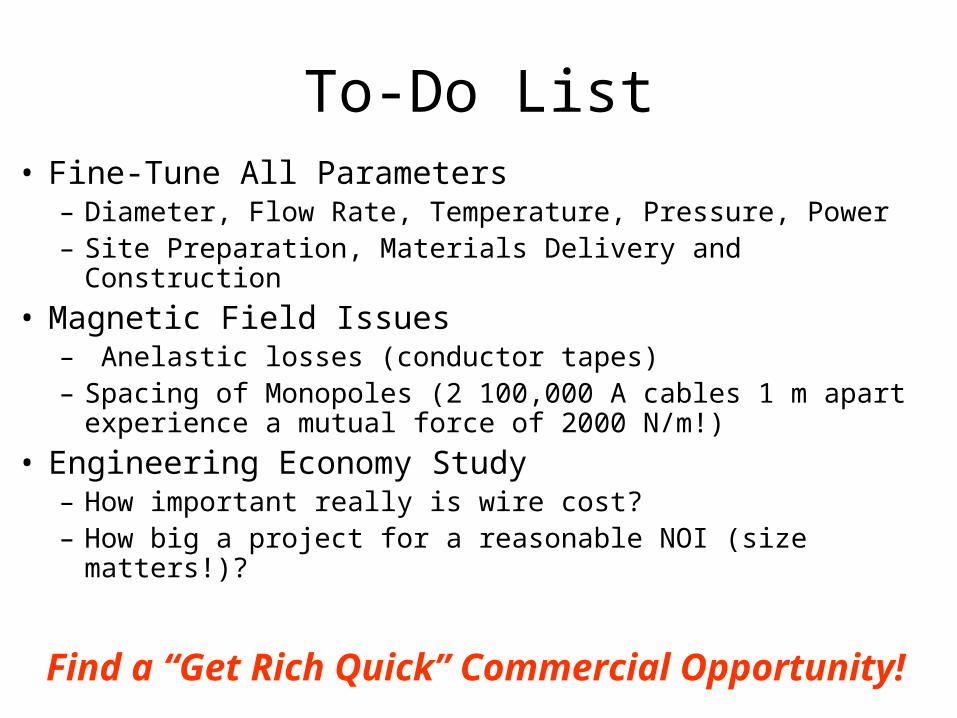
To-Do List• Fine-Tune All Parameters
– Diameter, Flow Rate, Temperature, Pressure, Power – Site Preparation, Materials Delivery and Construction
• Magnetic Field Issues– Anelastic losses (conductor tapes)– Spacing of Monopoles (2 100,000 A cables 1 m apart
experience a mutual force of 2000 N/m!)
• Engineering Economy Study– How important really is wire cost?– How big a project for a reasonable NOI (size matters!)?
Find a “Get Rich Quick” Commercial Opportunity!

EPRI Handouts(See Steve Eckroad)
• White Paper (Chauncey Starr)
• “Maulbetsch Report” (John Maulbetsch)

Visits
Department of Energy (July 2005)
– Jim Daley & Kevin Kolevar (Electricity, etc.)
– Ray Orbach & Tom Vanek (Science)
– Shane Johnson (Nuclear)
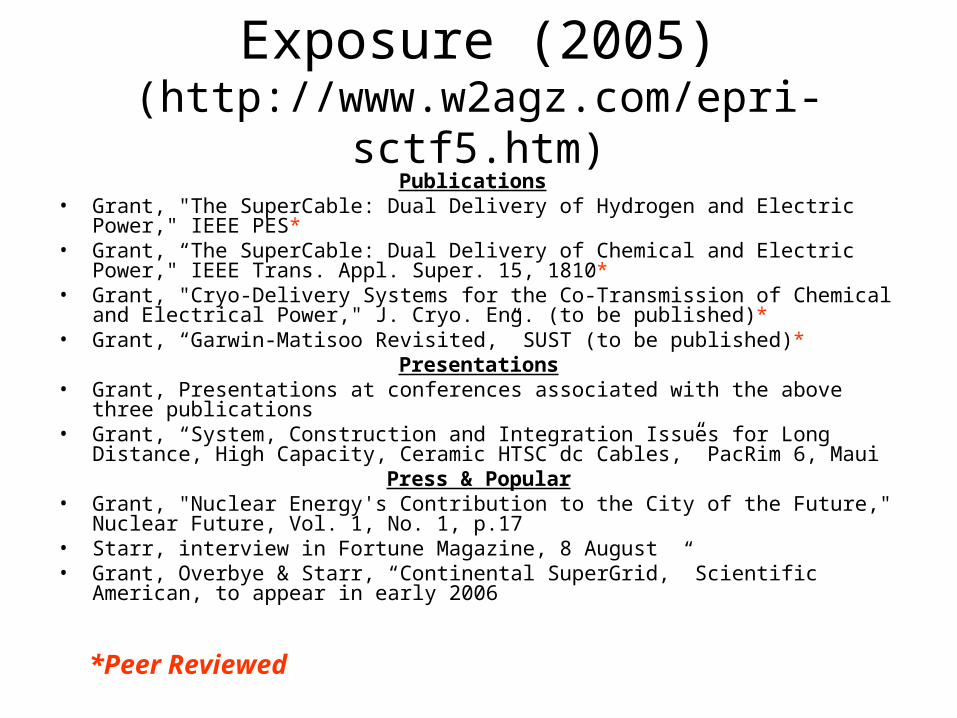
Exposure (2005)(http://www.w2agz.com/epri-sctf5.htm)
Publications • Grant, "The SuperCable: Dual Delivery of Hydrogen and Electric Power,"
IEEE PES*• Grant, “The SuperCable: Dual Delivery of Chemical and Electric Power,"
IEEE Trans. Appl. Super. 15, 1810*• Grant, "Cryo-Delivery Systems for the Co-Transmission of Chemical and
Electrical Power," J. Cryo. Eng. (to be published)*• Grant, “Garwin-Matisoo Revisited,” SUST (to be published)*
Presentations• Grant, Presentations at conferences associated with the above three
publications• Grant, “System, Construction and Integration Issues for Long Distance,
High Capacity, Ceramic HTSC dc Cables,” PacRim 6, MauiPress & Popular
• Grant, "Nuclear Energy's Contribution to the City of the Future," Nuclear Future, Vol. 1, No. 1, p.17
• Starr, interview in Fortune Magazine, 8 August• Grant, Overbye & Starr, “Continental SuperGrid,” Scientific American, to
appear in early 2006
*Peer Reviewed

Take-Home Reading Assignment
1. Garwin and Matisoo, 1967 (100 GW on Nb3Sn)2. Edeskuty, 1972 (LASL dc SPTL, 5 GW, PECO)3. Lasseter, et al., 1994 (HTSC dc Networks)4. Beale, et al., 1996 (BICC HTSC dc, 400 MW)5. Grant, 1996 (Promises, promises…ASC 96)6. Schoenung, Hassenzahl and Grant, 1997 (5 GW on
HTSC @ LN2, 1000 km)7. Proceedings, SuperGrid Workshops, 2002 & 2004
(be sure to open Bibliography page !)8. Neptune HVDC Cable, 20059. Grant, “London Calling,” Nature review of “Thread
Across the Ocean.”
www.w2agz.com/epri-sctf5.htm
…and there will be a quiz next time I see you all!