intensive care unit scoring systems
TRANSCRIPT

Intensive Care Unit Scoring Systems

Review Article
INTRODUCTION
Clinical outcome is the important measure of thecritical care activity. It is the end result of all therapeuticinterventions applied to the patient. It can be measuredfrom the perspective of the patients, care-takers orvarious health care personnel. It is the end point of theresearch, audit benchmarks performance and makingcomparisons, and helps in allocation of funds as resourcesare scant in comparison to the number of patients.Intensive care given to the non-survivors costs twice asmuch survivors [1] a major determinant of this wastedexpenditure is prognostic uncertainty [2]. Prognostic toolsmay help physicians in difficult task of redirecting theresources to the patient who are more likely to benefit withthe more chance of long term survival. Accurate and reliabledata helps the health managers, economists and politiciansto resolve the conflicts concern-ing areas of health care, notonly with in the hospital but establish appropriate balancebetween primary and secon-dary health care as their tasksinvolves distributive justice to maximize good for whole ofthe society. Such data are lacking in our country in spite ofthe large number of patient population and widespreadhealthcare facilities.
NEED OF SCORING SYSTEMS
(i) Prognosis
(ii) Cost-benefit analysis
(iii) Withdrawal of treatment
(iv) Comparison between different centres
INTENSIVE CARE UNIT SCORING SYSTEMS
Chitra Chatterji* and Anupam Raj***Consultant, **Registrar, Department of Anesthesiology, Indraprastha Apollo Hospitals,
Sarita Vihar, New Delhi 110 076, India.Correspondence to: Dr Anupam Raj, Registrar, Department of Anesthesiology, Indraprastha Apollo Hospitals,
Sarita Vihar, New Delhi 110 076, India.E-mail: [email protected]
Severity of illness scoring systems have been developed to evaluate delivery of care and provide prediction ofoutcome of groups of critically ill patients who are admitted to the intensive care units. This prediction isachieved by collating routinely measured data specific to the patient. This article reviews the variouscommonly used ICU scoring systems, the characteristics of the ideal scoring system, the various methodsused for validating the scoring systems.
Key word: ICU scoring systems.
(v) Monitoring and assessment of new therapies
(vi) Population sample collection in studies
MEASUREMENT OF OUTCOME
All outcome measures have limitations, as the resultsfor outcome structures and data concerning the outcomecould be over interpreted. Most important clinical outcomemeasures from patient’s perspective are:
Survival – long term survival is most important to thepatients. But in case the patient is undergoing a surgicalprocedure will also want to know the risk of interventionand hence the short term mortality.
Functional outcome – depicts the physical and mentalcapabilities after recovery. Patients will desire anindependent life atleast to a level of their previous level ofactivity.
Quality of life – includes patient’s sense of well being andsatisfaction, which are important components of quality oflife.
PREDICTION OF OUTCOME
It is the probabilistic estimation of binary outcome(death or survival) usually at hospital discharge. Theseverity of scores can be classified according to their aim:(a) To measure the severity by assigning points according tothe severity of illness, (b) To predict outcome by assigning anumerical estimate of probability of outcome (hospitalmortality) to a group of similar patients.
89 Apollo Medicine, Vol. 8, No. 2, June 2011

Review Article
Apollo Medicine, Vol. 8, No. 2, June 2011 90
Severity scoring systems are not perfect. They havetheir false positives and false negatives. These scores donot apply to predict the outcome of specific individual.
Outcome prediction can be made using generaloutcome prediction models such models aim to predictclinical status at hospital discharge based on given set ofvariables evaluated on ICU admission or within 24 hrs. Sothe rationale behind the construction is that derangementof homeostasis has an adverse effect on mortality and themagnitude of change from normal for physiological andlaboratory variables is proportional to their effect onoutcome. Using logistic regression equation these predictthe outcome in the patients having a particular pastmedical history and acute medical condition (defined bythese values of predictive variation) and receivingtreatment in a (theoretical) reference ICU. Such modelswere developed based on the multicenter database. Ideallythese should be [3].
(i) Time insensitive i.e. provide an accurate mortalityprediction when used prospectively as well asretrospectively.
(ii) A true estimate of presenting risk of death i.e. themeasure of severity of illness from data which is notinfluenced by therapy. Assessment of severity ofillness from data within first 24 hrs (APACHE II)may become a measure of suboptimal care thanseverity of illness.
(iii) Calculated from data collected in usual care ofpatient, e.g., pulse rate, blood pressure, temperatureetc. If weight is given to data gained from the use ofcomplex and expensive equipment, hospitals will berewarded from using more tests regardless of theappro-priateness or quality of care.
(iv) Calculated from objective data that cannot bemanipulated ( unlike the subjective data).
(v) Accurate at all levels of the scale i.e. the system musthave an accurate calibration. Current mortalitysystems use regression technique that tend tounderestimate the likelihood of death from moresevere patients and over estimate from less severepatients.
(vi) Simple, reliable, easily obtainable and not markedlyadd to the administrative cost.
(vii) All components of the system should be open toreview, i.e. the system (particularly the predictionequations) must be able to be scrutinized and tested.
(viii) Wide patient applicability: different ICUs, all age
groups, all levels and types of ICUs.
VALIDITY OF PREDICTIVE SCORES
All statistical models need validation. This evaluationshould be performed on regional and national levels and itshould consists of (a) Overall fitness of good(discrimination and calibration), (b) Uniformity of fit.
Overall fitness of good
Can be divided into discrimination and calibration
Discrimination [4]: it is the ability of the score todistinguish survivors from non-survivors and is usuallyevaluated using the area under receiver operatingcharacteristic (ROC) curve. Interpretation ofdiscrimination is easy, a perfect model will have areaunder ROC curve of 1.0 and a model whose discriminativecapabilities is no greater than the chance has an area of0.5. For most models this value should be greater than 0.8.greater the area under ROC curve better the discriminationof the model.
Calibration [4]: it is the correspondence of degree ofprobabilities assigned by the model or observedmortalities. It is usually evaluated by two statistical testsproposed by Hosmer and Lemeshow ( the C test and the Htest), which divides the population of deciles of risk andcompare the expected with the actual number of survivorsand non- survivors in each deciles. A more intuitiveevaluation although less formal can be made by the use ofcalibration curves. Greater the agreement between theobserved and predicted mortality, the better the calibrationof the model.
Uniformity of fit
It reflects the models performance in the subgroup ofpatients. The rationale of this evaluation is similar to thatof general regression, where influential observation thatcan have important impact in the overall performance ofmodel are specifically explored. Although no consensusexists but the best technique for identifying these subgroups, we can use discrimination and calibration in sub-groups of patients. The most influential factors are thoserelated with major case mix components:
• Location in hospital before ICU admission
• Patient type (emergency surgery, non-operative,scheduled surgery)
• Degree of physiological dysfunction
• Physiological reserve ( age, chronic diagnosis)
• Acute diagnosis
Review Article
91 Apollo Medicine, Vol. 8, No. 2, June 2011
HISTORY OF SCORING SYSTEMS
1953- APGAR score by Virginia apgar
1973- glasglow coma score
1981- APACHE (acute physiology and chronic healthevaluation) and SAP ( simplified acute physiologyscore)
1991- APAHE III
1993- SAPS II
2005- SAPS III
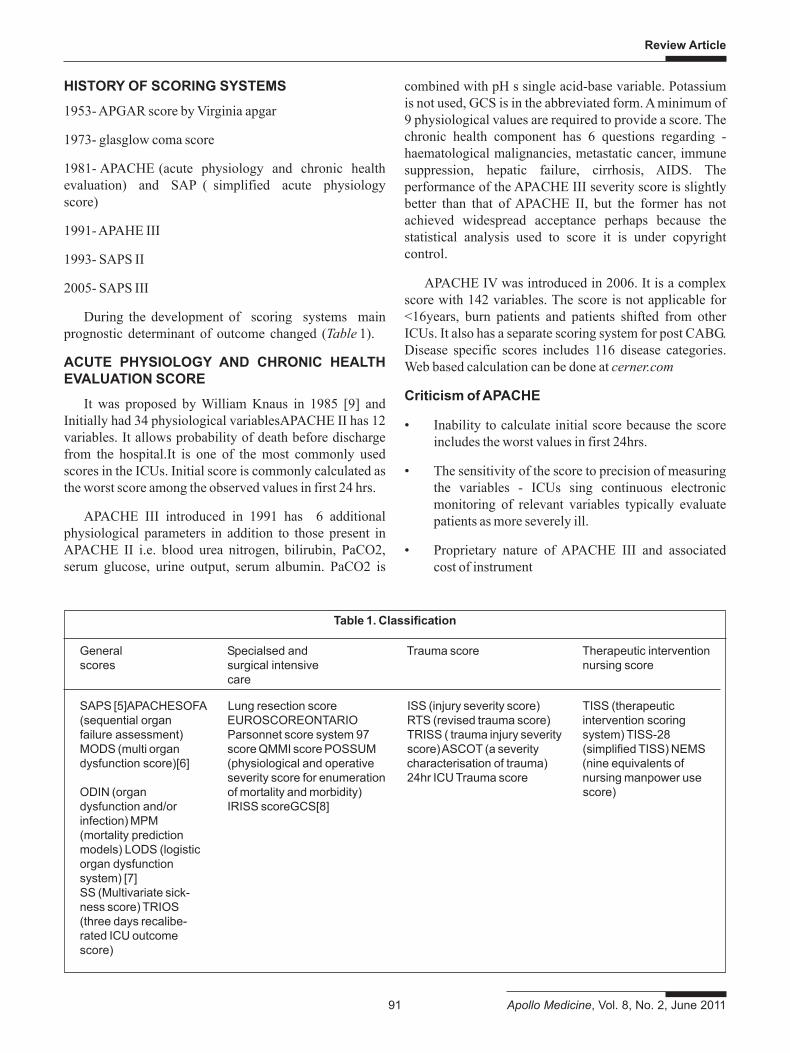
During the development of scoring systems mainprognostic determinant of outcome changed (Table 1).
ACUTE PHYSIOLOGY AND CHRONIC HEALTHEVALUATION SCORE
It was proposed by William Knaus in 1985 [9] andInitially had 34 physiological variablesAPACHE II has 12variables. It allows probability of death before dischargefrom the hospital.It is one of the most commonly usedscores in the ICUs. Initial score is commonly calculated asthe worst score among the observed values in first 24 hrs.
APACHE III introduced in 1991 has 6 additionalphysiological parameters in addition to those present inAPACHE II i.e. blood urea nitrogen, bilirubin, PaCO2,serum glucose, urine output, serum albumin. PaCO2 is
combined with pH s single acid-base variable. Potassiumis not used, GCS is in the abbreviated form. A minimum of9 physiological values are required to provide a score. Thechronic health component has 6 questions regarding -haematological malignancies, metastatic cancer, immunesuppression, hepatic failure, cirrhosis, AIDS. Theperformance of the APACHE III severity score is slightlybetter than that of APACHE II, but the former has notachieved widespread acceptance perhaps because thestatistical analysis used to score it is under copyrightcontrol.
APACHE IV was introduced in 2006. It is a complexscore with 142 variables. The score is not applicable for<16years, burn patients and patients shifted from otherICUs. It also has a separate scoring system for post CABG.Disease specific scores includes 116 disease categories.Web based calculation can be done at cerner.com
Criticism of APACHE
• Inability to calculate initial score because the scoreincludes the worst values in first 24hrs.
• The sensitivity of the score to precision of measuringthe variables - ICUs sing continuous electronicmonitoring of relevant variables typically evaluatepatients as more severely ill.
• Proprietary nature of APACHE III and associatedcost of instrument
Table 1. Classification
General Specialsed and Trauma score Therapeutic interventionscores surgical intensive nursing score
care
SAPS [5]APACHESOFA Lung resection score ISS (injury severity score) TISS (therapeutic(sequential organ EUROSCOREONTARIO RTS (revised trauma score) intervention scoringfailure assessment) Parsonnet score system 97 TRISS ( trauma injury severity system) TISS-28MODS (multi organ score QMMI score POSSUM score) ASCOT (a severity (simplified TISS) NEMSdysfunction score)[6] (physiological and operative characterisation of trauma) (nine equivalents of
severity score for enumeration 24hr ICU Trauma score nursing manpower useODIN (organ of mortality and morbidity) score)dysfunction and/or IRISS scoreGCS[8]infection) MPM(mortality predictionmodels) LODS (logisticorgan dysfunctionsystem) [7]SS (Multivariate sick-ness score) TRIOS(three days recalibe-rated ICU outcomescore)

Review Article
Apollo Medicine, Vol. 8, No. 2, June 2011 92
• Complicated scoring system for specific element inchronic disease
• Exaggerated penalty to old age
• Complexity of APACHE IV with 142 variables
SIMPLIFIED ACUTE PHYSIOLOGY SCORE SAPS
SAPS was first introduced in 1984 to simplify thediagnostic data collection in APACHE, focusing only onprognostic measures easily and typically measured in ICUpatients. The SAPS II was introduced in 1993 following acombined European and North American study.
• 12 physiological variables
• Age
• Type of admission (non-operative, emergencysurgery, elective surgery)
• Prior health record (AIDS, metastatic cancerhaematological cancer)
SAPS III has been recently introduced in 2005. Itincludes the prognostic variables which were missing inprevious scores ( such as diagnostic information orpresence of infection). Access file with calculation sheetand tables for data management are free and can bedownloaded from www.saps3.org
MORTALITY PROBABILITY MODELS II
MPM was developed by Stanely Lemeshow [10,11].
MPM II models were described in1993 to 1994 andwere based on same data as used for the SAPS II withadditional data from 6 other ICUs from North America. Inthese models the final result is only given as theprobability of death rather than as a score. It comprised of4 different models.
The MPM II admission (MPM0) computed within onehour of admission to the ICU. The model contains 15variables. It is the only general model which independentof the treatment is provided in the ICU, so therefore can beused for the patient stratification at the time of admissionto the ICU.
The MPM II 24 hr model - it comprises of 13 variablescollected 24hrs after the admission to the ICU.
MPM II 48hr model- it is computed after 48 hrs of ICUadmission.
MPM II 72 hrs model- computed at 72 hrs of theadmission to ICU.
All physiological variables are calculated based on theworst values in the first 24 hrs of admission. MPM II 48hrsand MPM II 72hrs models use the same variables as that ofMPM II 24hrs model, with different weight for risk ofdeath calculation. Both are based on the worst valuespresented in the previous 24 hrs.
SEQUENTIAL ORGAN FAILURE ASSESMENT
The SOFA [12] was produced by a group from theEuropean Society of Intensive Care Medicine to describethe degree of organ dysfunction associated with sepsis.However, it has since been validated to describe thedegree of organ dysfunction in patient groups with organdysfunctions not due to sepsis. Six organ systems–respiratory (paO2/fiO2), cardiovascular (blood pressure),central nervous systems (GCS), renal (creatinine or urineoutput), coagulation (platelet count), and liver (bilirubin)–are weighted (each 1-4) to give a final score (6-24(maximum)). SOFA, correlates well with both ICU andnon-ICU in-hospital mortality rates [13,14]. SOFA scoringsystem has been proposed for use as a tool for triage inmass casualty scenarios when critical care resources areextremely taxed. [15]
Difference between commonly used scores and theSOFA score
Scoring systems SOFA score
Evaluate risk of mortality Evaluate morbidityAim- prediction Aim - descriptionOften complex Simple, easily calculatedDoes not individualize Does individualize thethe degree of dysfunction/ degree of dysfunction/failure of each organ failure of each organ
MULTIPLE ORGAN DYSFUNCTION SCORE
The MODS [16] scores six organ systems: respiratory(Po2: FIO2 ratio in arterial blood); renal (measurement ofserum creatinine); hepatic (serum bilirubinconcentration); cardiovascular (pressure-adjusted heartrate); haemato-logical (platelet count); and centralnervous system (Glasgow Coma Score) with weightedscores (0-4) awarded for increasing abnormality of eachorgan systems. Scoring is performed on a daily basis andso allows a day-by-day prediction for patients.
CONCLUSION
APACHE II, APACHE III, SAPS II, MPM II givecomparable results.
All have good discrimination but poor calibration.

Review Article
93 Apollo Medicine, Vol. 8, No. 2, June 2011
Can be used to compare study population in RCTs,assess ICU. While assessing the performance of the ICUthe results may be confounded by the fact that ICU thatadmit sicker patients will have higher than predictedmortality.
Patient selection can be made for therapeuticinterventions eg: indication for XIGRIS in severe sepsisdepending upon the number of organ system involvement.
Decision of withdrawal of support cannot be based inthe current scoring systems as their area under ROC(discrimination) is far less than 0.99.
REFRENCES
1. Sage WM, Rosenthal MH, Silverman JF. Is intensive areworth it? An assessment of input and outcome of criticallyill. Crit Care Med. 1986; 14: 777-782.
2. Detsky AS, Stricker SC, Mulley AG, Thibault GE.Prognosis, survival and the expenditure of hospitalresourses for patients in intensive care unit. N Eng JMed. 1981; 305: 667-672.
3. Selker HP. Systems for comparing actual and predictedmortality rates; chaaterstics to promote cooperation inimproving hospital care. Ann Intern Med. 1993; 118: 820-822.
4. Moreno R, Morais P. Outcome prediction in intensivecare. Results of prospective, multicenter, portuguesestudy. Intensive care Med. 1997; 23:177-186 .
5. Le-Gall JR, Loirat P, Alperovitch A, et al. A simplifiedacute physiology score for ICU. Cric care Med. 1984; 12:975-977.
6. Lemeshow S, Teres D, Avurunin JS, Gage RW. Refiningintensive care outcome prediction using changingprobabilities of mortality. Criti Care.1988; 16: 470-477.
7. Le-Gall JR, Lemeshow S, saulneir F, Alberti C, Teres D.For the ICU scoring group. The logistic organ dysfunction
system. A new way to assess organ dysfunction in ICU.JAMA.1996; 276: 802-810.
8. Baker SP, O’ Neill B, Haddon W, Long WB. The injuryseverity score, a method of describing patients withmultiple injuries and evaluating emergency care. JTrauma. 1974; 14: 187-196.
9. Knaus WA, Draper EA, Wagner DP, Zimmerman JE.“APACHE II: a severity of disease classificationsystem”. Critical Care Medicine.1985; 13(10): 818-829.
10. Lemeshow S, et al. Mortality probability models (MPM II)based on an international cohort of intensive carepatients. JAMA. 1993; 270: 2478-2486.
11. Lemeshow S, Le Gall JR. Modeling the severity of illnessof ICU patients. A systems update. JAMA 1994;272:1049-1055.
12. Vincent JL, Moreno R, Takala J, et al. The SOFA (Sepsis-related organ failure assessment) score to describeorgan dysfunction/failure. On behalf of the WorkingGroup on Sepsis-Related Problems of the EuropeanSociety of Intensive Care Medicine. Intens CareMed.1996; 22: 707-710.
13. Kajdacsy-Balla Amaral AC, Andrade FM, Moreno R, et al.Use of the sequential organ failure assessment score asa severity score. Intensive Care Med. 2005; 31: 243-249.
14. Ferreira FL, Bota DP, Bross A, Melot C, Vincent JL. Serialevaluation of the SOFA score to predict outcome incritically ill patients. JAMA. 2001; 286: 1754-1758.
15. Centers for Disease Control and Prevention. Interimguidance for protection of persons involved in U.S. Avianinfluenza outbreak disease control and eradicationactivities. http://www.cdc.gov/flu/avian/professional/protect-guid.htm Accessed February 20, 2008.
16. Marshall JC, Cook DJ, Christou NV, Bernard GR, SpringCL, Sibbald WJ. Multiple organ dysfunction score: areliable descriptor of a complex clinical outcome. CritCare Med. 1995; 23: 1638-1652.

Apollo hospitals: http://www.apollohospitals.com/Twitter: https://twitter.com/HospitalsApolloYoutube: http://www.youtube.com/apollohospitalsindiaFacebook: http://www.facebook.com/TheApolloHospitalsSlideshare: http://www.slideshare.net/Apollo_HospitalsLinkedin: http://www.linkedin.com/company/apollo-hospitalsBlog:Blog: http://www.letstalkhealth.in/