intelligent qos for emc storage by …...intelligent qos for emc storage by leveraging big data...
TRANSCRIPT
INTELLIGENT QOS FOR EMC STORAGE BY LEVERAGING BIG DATA ANALYTICSYangbo JiangSoftware Engineer, EMC [email protected]

2014 EMC Proven Professional Knowledge Sharing 2
Table of Contents
Introduction ..................................................................................................................... 3
What is Storage QoS? ..................................................................................................... 4
The Challenge of Storage QoS ....................................................................................... 5
Why use Big Data Analytics to enhance QoS? ................................................................ 6
A Framework to Provide Intelligent QoS .......................................................................... 7
Framework Introduction ............................................................................................... 7
Key Technique 1: QoS data collecting ......................................................................... 9
Key Technique 2: Predict future QoS value ............................................................... 10
Application of Framework .............................................................................................. 16
Apply to UQM ............................................................................................................ 16
Apply to FAST VP ...................................................................................................... 17
Conclusion .................................................................................................................... 19
Appendix ....................................................................................................................... 20
Disclaimer: The views, processes, or methodologies published in this article are those of
the author. They do not necessarily reflect EMC Corporation’s views, processes, or
methodologies.

2014 EMC Proven Professional Knowledge Sharing 3
Introduction
In the storage industry, Quality of Service (QoS) is defined as the ability to provide
different priorities to different applications and LUNs, or to guarantee a certain level of
performance to an application. QoS is critical for preventing workloads or tenants from
adversely affecting one another and for meeting service-level objectives for storage
performance. While most storage vendors have already implemented this feature in their
product—such as EMC Unisphere® Quality of Service Manager (UQM)—present QoS
implementations are inflexible and mechanized. Since we are now in the “Big Data” era,
why not take full advantage of it to make QoS intelligent and prospective?
Storage environments generate a large amount of data which may contain hidden useful
information that may prove valuable. Predicting customer behavior patterns and
monitoring emergencies using Big Data analytic techniques could help storage
administrators automatically adjust QoS values for applications proactively in real-time.
This article describes how to build a QoS analysis framework by analyzing massive data
retrieved from existing data collection in storage and interacting with the existing QoS
feature in storage. For better analysis on such massive data, we adopt some popular Big
Data analysis methods, for instance, using time series analysis techniques on these
discrete data to uncover user behavior patterns and predict future behavior, then interact
with storage to set QoS value proactively.
This article will be of interest to those wishing to enhance current QoS capability in their
storage product. Easily implemented, the analysis method in this article could be
adopted to build intelligent QoS to make storage more perfect.

2014 EMC Proven Professional Knowledge Sharing 4
What is Storage QoS?
Storage Quality of Service (QoS) refers to the ability to provide different priorities to
different applications, LUNs, or to guarantee a certain level of performance to an
application.
The importance of storage QoS is depicted in Figure 1. Suppose that your workday
begins at 9:00 AM and the first thing you do is check your email. During that hour,
Exchange server would be very busy and will be the highest priority application.
However, in the same time a movie application occupies a lot of storage bandwidth,
resulting in low performance of the Exchange application. This condition is exactly what
QoS aims to resolve. With QoS, storage is able to guarantee the performance of
Exchange server at a certain level bandwidth, such as 25MB/s during that hour.
There are many established storage companies that offer the implementation of QoS
feature, such as IBM’s DS8000 series and Oracle’s Pillar Axiom. For mid-tier storage,
EMC VNX® series provides a feature called Unisphere® Quality-of-Service Manager
(UQM). UQM provides a capability to achieve “ideal” system response for multiple
applications based on pre-defined QoS policy by customer. The performance metrics
include “Response time (ms)”, “Bandwidth (MB/s)” and “Throughput (IO/s)”.
Figure 1: UQM application example
2014 EMC Proven Professional Knowledge Sharing 5
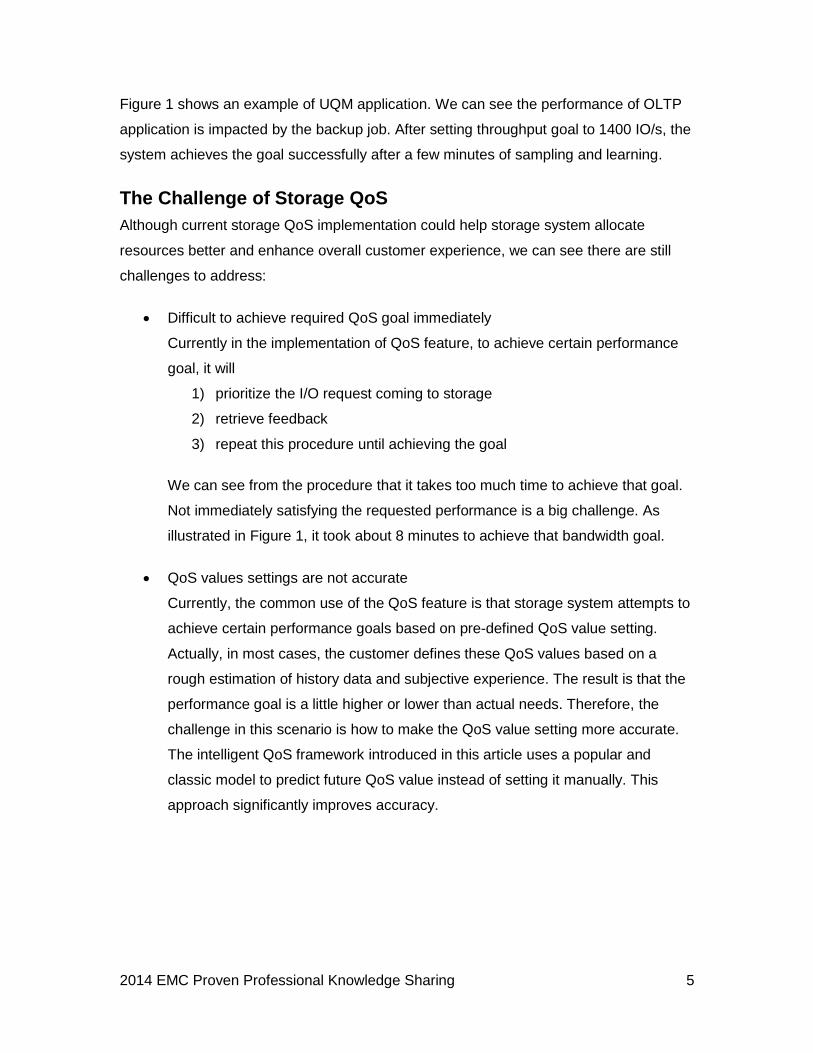
Figure 1 shows an example of UQM application. We can see the performance of OLTP
application is impacted by the backup job. After setting throughput goal to 1400 IO/s, the
system achieves the goal successfully after a few minutes of sampling and learning.
The Challenge of Storage QoS
Although current storage QoS implementation could help storage system allocate
resources better and enhance overall customer experience, we can see there are still
challenges to address:
Difficult to achieve required QoS goal immediately
Currently in the implementation of QoS feature, to achieve certain performance
goal, it will
1) prioritize the I/O request coming to storage
2) retrieve feedback
3) repeat this procedure until achieving the goal
We can see from the procedure that it takes too much time to achieve that goal.
Not immediately satisfying the requested performance is a big challenge. As
illustrated in Figure 1, it took about 8 minutes to achieve that bandwidth goal.
QoS values settings are not accurate
Currently, the common use of the QoS feature is that storage system attempts to
achieve certain performance goals based on pre-defined QoS value setting.
Actually, in most cases, the customer defines these QoS values based on a
rough estimation of history data and subjective experience. The result is that the
performance goal is a little higher or lower than actual needs. Therefore, the
challenge in this scenario is how to make the QoS value setting more accurate.
The intelligent QoS framework introduced in this article uses a popular and
classic model to predict future QoS value instead of setting it manually. This
approach significantly improves accuracy.

2014 EMC Proven Professional Knowledge Sharing 6
Why use Big Data Analytics to enhance QoS?
Big Data is high-volume, high-velocity, and high-variety information assets that demand
cost-effective, innovative forms of information processing for enhanced insight and
decision making1. It could be defined with 3 Vs – volume, variety, velocity, as shown in
Figure 2.
Figure 2: The 3 Vs of Big Data
Big data analytics is the process of examining large amounts of data of a variety of types
to uncover hidden patterns, unknown correlations and other useful information2. It helps
companies make better business decisions by enabling data scientists and other users
to analyze volumes of transaction data as well as other data sources that may be left
untapped by conventional business intelligence programs.
There are many popular analytical techniques used for Big Data analytics. Figure 3 lists
the typical business questions and corresponding classic analytical methods.
The Problem to Solve The Category of Techniques Classic Method
I want to group items by similarity.
I want to find structure in the data
Clustering K-means clustering
I want to discover relationships
between actions or items
Association Rules Apriori

2014 EMC Proven Professional Knowledge Sharing 7
I want to determine the
relationship between the outcome
and the input variables
Regression Linear Regression
Logistic Regression
I want to assign (known) labels to
objects
Classification Naïve Bayes
Decision Trees
I want to forecast the behavior of
a temporal process
Time Series Analysis ACF, PACF, ARIMA
I want to analyze my text data Text Analysis Regular expression, TF-IDF
Figure 3: Typical business problem and methods
Storage system generates millions of performance data every day, much of which is
valuable but untapped. Big data analytics provide the “Time Series Analysis” technique
to predict near-future performance value.
Time series analysis is the analysis of data organized across units of time. It concerns
the analysis of data collected over time – weekly values, monthly values, quarterly
values, yearly values, etc. Usually the intent is to discern whether there is some pattern
in the values collected to data, with the intention of short-term forecasting3.
Among various time series analysis methods, Box Jenkins methodology enables
forecasting with time series data with both high accuracy and low computational
requirements. The technique could be applied to quickly predict the next few
observations in a time series based on the last few observations.
In this article, we use some techniques of Box Jenkins methodology to build the
intelligent QoS framework. Details regarding how to use it will be discussed in the
Framework section.
A Framework to Provide Intelligent QoS
Framework Introduction
To address the challenges mentioned above, this article proposes an intelligent QoS
framework for EMC storage to provide predict capability of storage QoS performance
value. The framework is able to collect system performance data and predict future
value. The predicted result could be leveraged by other features within the storage
2014 EMC Proven Professional Knowledge Sharing 8
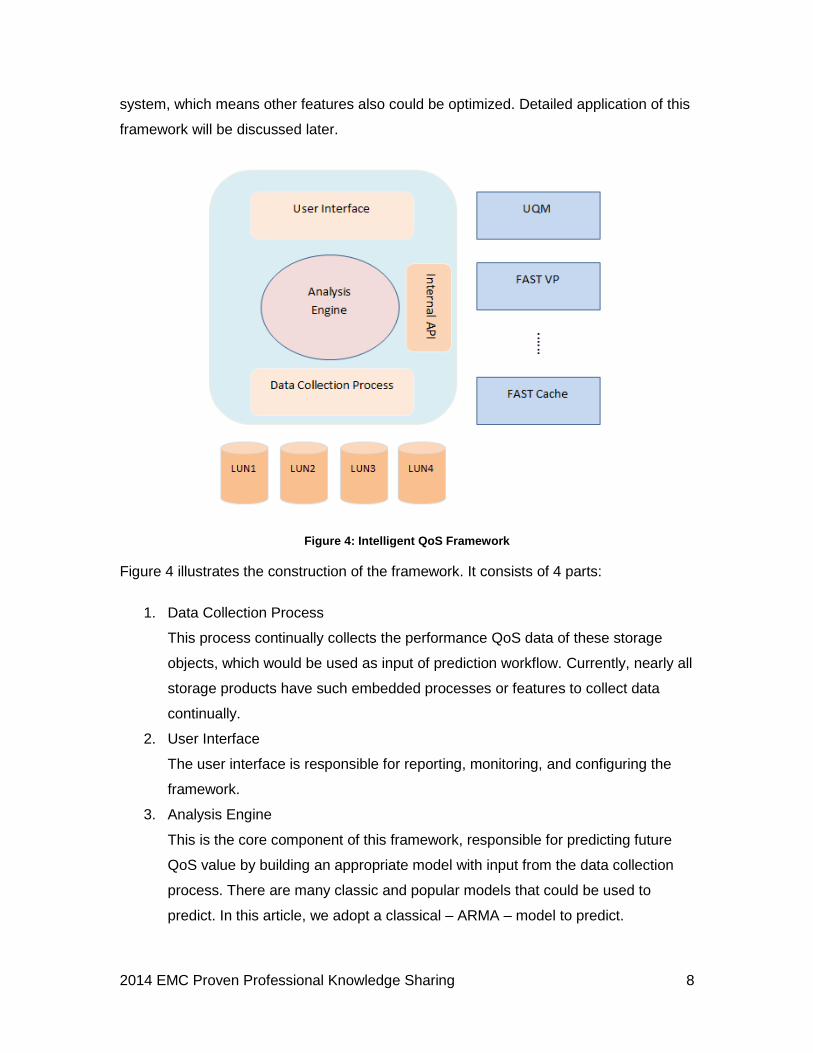
system, which means other features also could be optimized. Detailed application of this
framework will be discussed later.
Figure 4: Intelligent QoS Framework
Figure 4 illustrates the construction of the framework. It consists of 4 parts:
1. Data Collection Process
This process continually collects the performance QoS data of these storage
objects, which would be used as input of prediction workflow. Currently, nearly all
storage products have such embedded processes or features to collect data
continually.
2. User Interface
The user interface is responsible for reporting, monitoring, and configuring the
framework.
3. Analysis Engine
This is the core component of this framework, responsible for predicting future
QoS value by building an appropriate model with input from the data collection
process. There are many classic and popular models that could be used to
predict. In this article, we adopt a classical – ARMA – model to predict.

2014 EMC Proven Professional Knowledge Sharing 9
4. Internal API
The internal API is accessed by internal features such as FAST VP, UQM, and
FAST Cache, leveraging analysis engine output to help optimize feature
performance.
Key Technique 1: QoS data collecting
The first step to predict is collecting history data. Most storage systems have
implemented such a process or feature to continually collect data from the bottom.
The current EMC mid-tier VNX storage provides “Unisphere Analyzer”, a tool used to
monitor and analyze current VNX/CLARiiON® storage performance, enabling a customer
to know current storage workload4. It continually collects the performance data of each
object in the system, including SP utilization, SP Cache Prefetch Bandwidth, Write
Bandwidth-Nonoptimal, Queue Length-Optimal, etc. Figure 5 shows a partial output
example of Unisphere Analyzer.
Figure 5: Partial output example of Unisphere Analyzer
In this framework, we use 3 types of QoS values from the output of Unisphere Analyzer:
1. Bandwidth (MB/s)
2. Throughput (IO/s)
3. Response Time (ms)
2014 EMC Proven Professional Knowledge Sharing 10
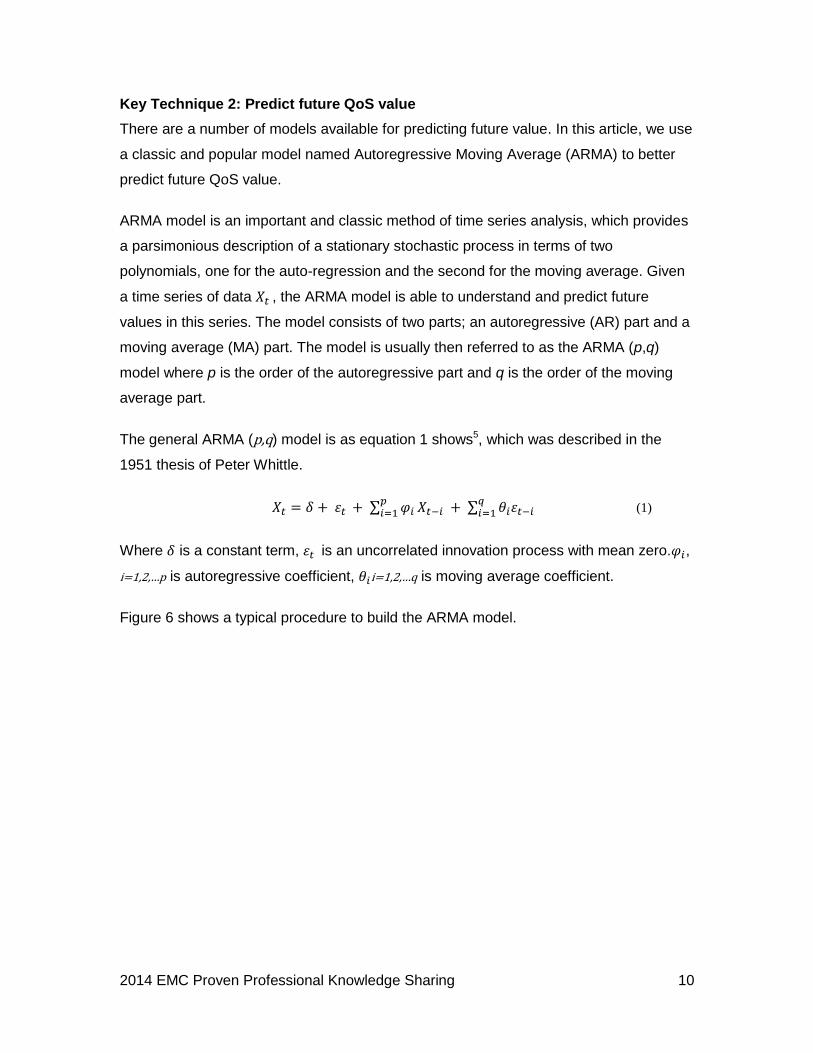
Key Technique 2: Predict future QoS value
There are a number of models available for predicting future value. In this article, we use
a classic and popular model named Autoregressive Moving Average (ARMA) to better
predict future QoS value.
ARMA model is an important and classic method of time series analysis, which provides
a parsimonious description of a stationary stochastic process in terms of two
polynomials, one for the auto-regression and the second for the moving average. Given
a time series of data 𝑋𝑡 , the ARMA model is able to understand and predict future
values in this series. The model consists of two parts; an autoregressive (AR) part and a
moving average (MA) part. The model is usually then referred to as the ARMA (p,q)
model where p is the order of the autoregressive part and q is the order of the moving
average part.
The general ARMA (p,q) model is as equation 1 shows5, which was described in the
1951 thesis of Peter Whittle.
𝑋𝑡 = 𝛿 + 휀𝑡 + ∑ 𝜑𝑖𝑝𝑖=1 𝑋𝑡−𝑖 + ∑ 𝜃𝑖휀𝑡−𝑖
𝑞𝑖=1 (1)
Where 𝛿 is a constant term, 휀𝑡 is an uncorrelated innovation process with mean zero.𝜑𝑖,
i=1,2,…p is autoregressive coefficient, 𝜃𝑖i=1,2,…q is moving average coefficient.
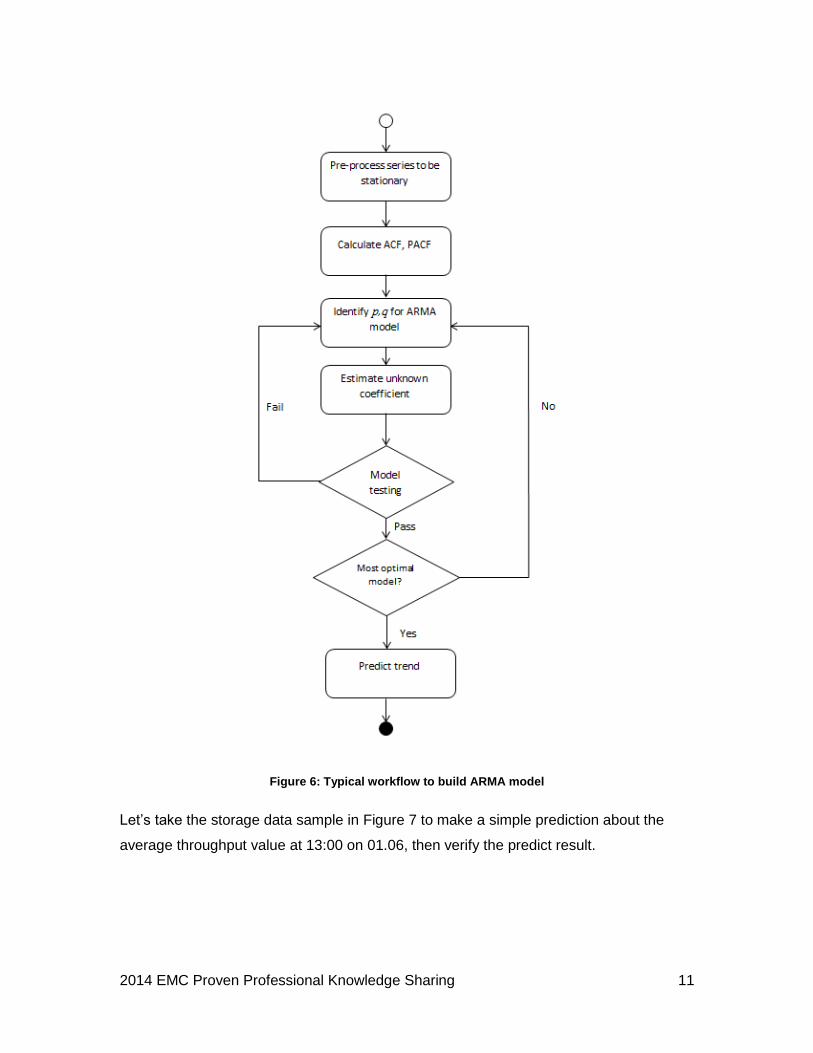
Figure 6 shows a typical procedure to build the ARMA model.
2014 EMC Proven Professional Knowledge Sharing 11
Figure 6: Typical workflow to build ARMA model
Let’s take the storage data sample in Figure 7 to make a simple prediction about the
average throughput value at 13:00 on 01.06, then verify the predict result.

2014 EMC Proven Professional Knowledge Sharing 12
Time Throughput
(IO/s)
Time Throughput
(IO/s)
Time Throughput
(IO/s)
01.03 08:00 1300 01.04 10:00 3498 01.05 12:00 3356
01.03 09:00 4412 01.04 11:00 4168 01.05 13:00 2373
01.03 10:00 3800 01.04 12:00 2976 01.05 14:00 3519
01.03 11:00 4013 01.04 13:00 2791 01.05 15:00 3901
01.03 12:00 3204 01.04 14:00 3481 01.05 16:00 3131
01.03 13:00 2412 01.04 15:00 3961 01.05 17:00 4001
01.03 14:00 3567 01.04 16:00 3191 01.05 18:00 4142
01.03 15:00 3813 01.04 17:00 3897 01.05 19:00 3500
01.03 16:00 3087 01.04 18:00 4160 01.05 20:00 2605
01.03 17:00 3908 01.04 19:00 3379 01.05 21:00 1910
01.03 18:00 4290 01.04 20:00 2721 01.06 08:00 1280
01.03 19:00 3401 01.04 21:00 2094 01.06 09:00 4390
01.03 20:00 1904 01.05 08:00 1511 01.06 10:00 3712
01.03 21:00 1807 01.05 09:00 3904 01.06 11:00 3971
01.04 08:00 1221 01.05 10:00 4011 01.06 12:00 2894
01.04 09:00 4516 01.05 11:00 3871 01.06 13:00 2582
Figure 7: Storage performance data sample
2014 EMC Proven Professional Knowledge Sharing 13
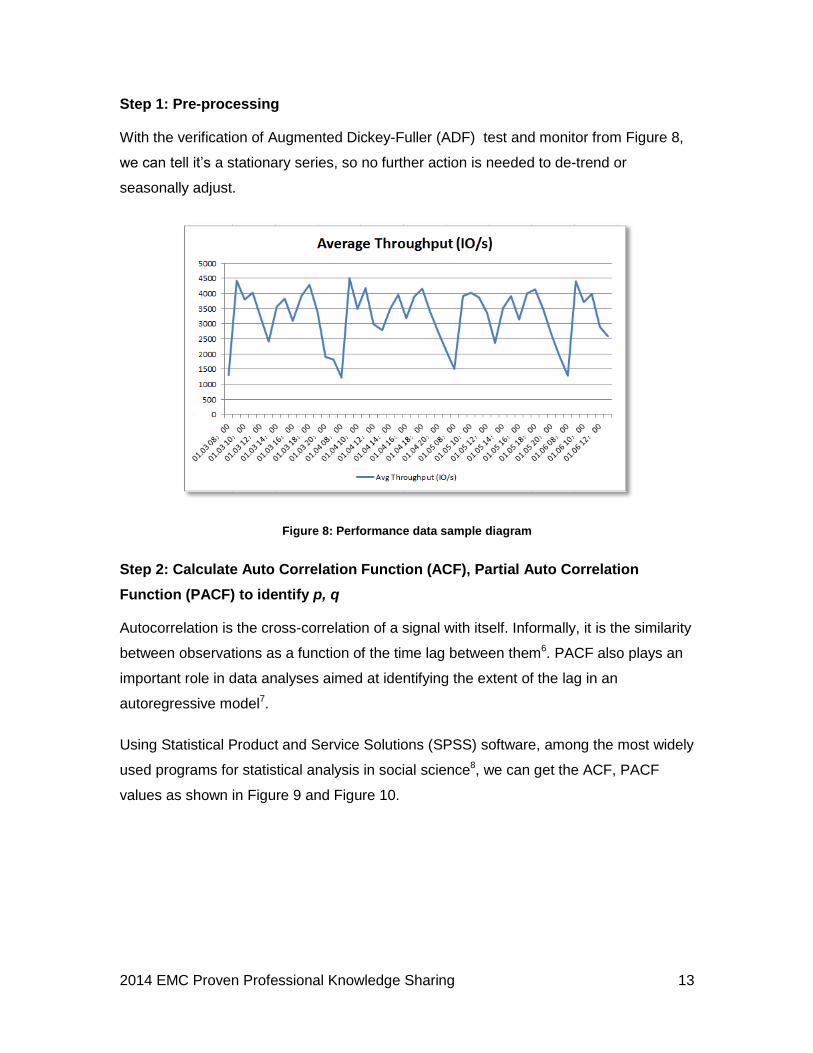
Step 1: Pre-processing
With the verification of Augmented Dickey-Fuller (ADF) test and monitor from Figure 8,
we can tell it’s a stationary series, so no further action is needed to de-trend or
seasonally adjust.
Figure 8: Performance data sample diagram
Step 2: Calculate Auto Correlation Function (ACF), Partial Auto Correlation
Function (PACF) to identify p, q
Autocorrelation is the cross-correlation of a signal with itself. Informally, it is the similarity
between observations as a function of the time lag between them6. PACF also plays an
important role in data analyses aimed at identifying the extent of the lag in an
autoregressive model7.
Using Statistical Product and Service Solutions (SPSS) software, among the most widely
used programs for statistical analysis in social science8, we can get the ACF, PACF
values as shown in Figure 9 and Figure 10.

2014 EMC Proven Professional Knowledge Sharing 14
Figure 9: ACF value graph of 𝐗𝐭
Figure 10: PACF value graph of 𝐗𝐭
From the ACF and PACF figures, we can see that both ACF and PACF starts to decay
from lag=3, so we can determine p=3, q=3.

2014 EMC Proven Professional Knowledge Sharing 15
Step 3: Estimate coefficient
Among many popular methods to estimate parameter, in most cases the method of least
squares is a good option to estimate these unknown coefficients.
Using SPSS software, we could get the estimation of coefficient as Figure 11 shows.
Figure 11: Coefficient estimation result
Figure 12: Fitting result
Figure 12 shows the comparison of fitting result and observation. We can see the effect
and accuracy is very good.
With the estimated coefficient values, we get the ARMA (3,3) model as Equation 2
shows.
2014 EMC Proven Professional Knowledge Sharing 16
𝑋𝑡=3259.312+1.124𝑋𝑡−1 − 1.160𝑋𝑡−2+0.543𝑋𝑡−3+1.112휀𝑡 –1 −
1.075휀𝑡 –2+0.963휀𝑡 –3+휀𝑡 (2)
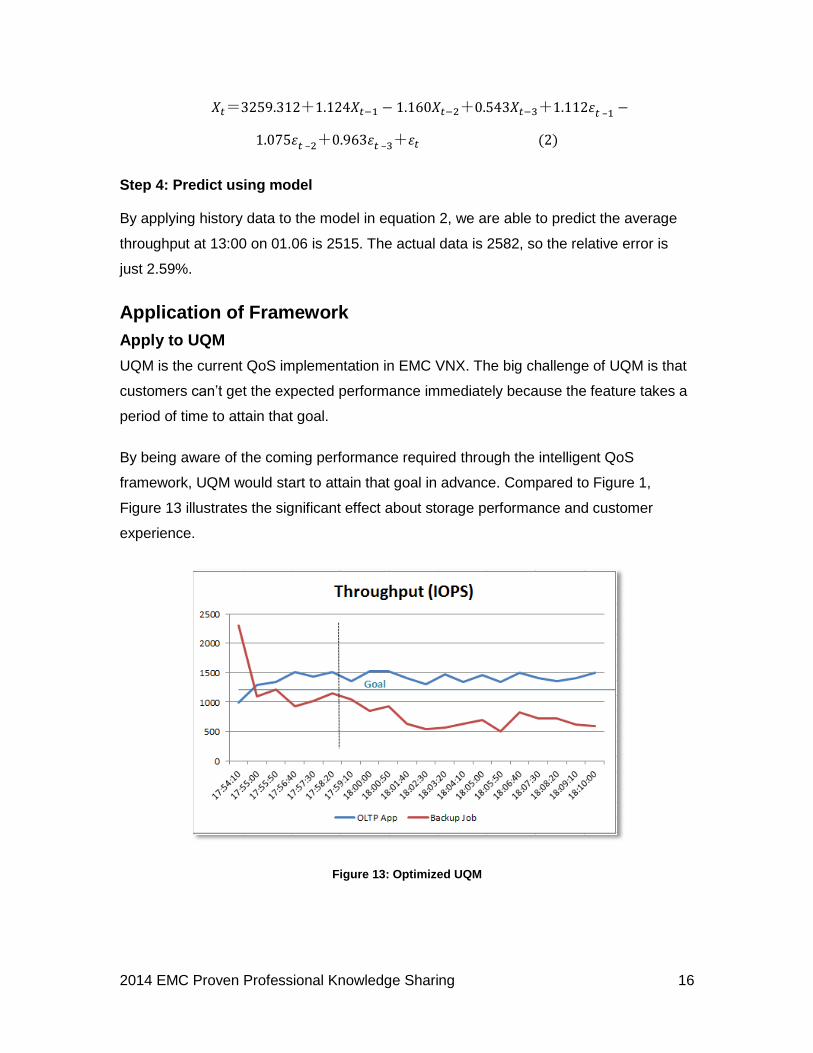
Step 4: Predict using model
By applying history data to the model in equation 2, we are able to predict the average
throughput at 13:00 on 01.06 is 2515. The actual data is 2582, so the relative error is
just 2.59%.
Application of Framework
Apply to UQM
UQM is the current QoS implementation in EMC VNX. The big challenge of UQM is that
customers can’t get the expected performance immediately because the feature takes a
period of time to attain that goal.
By being aware of the coming performance required through the intelligent QoS
framework, UQM would start to attain that goal in advance. Compared to Figure 1,
Figure 13 illustrates the significant effect about storage performance and customer
experience.
Figure 13: Optimized UQM
2014 EMC Proven Professional Knowledge Sharing 17
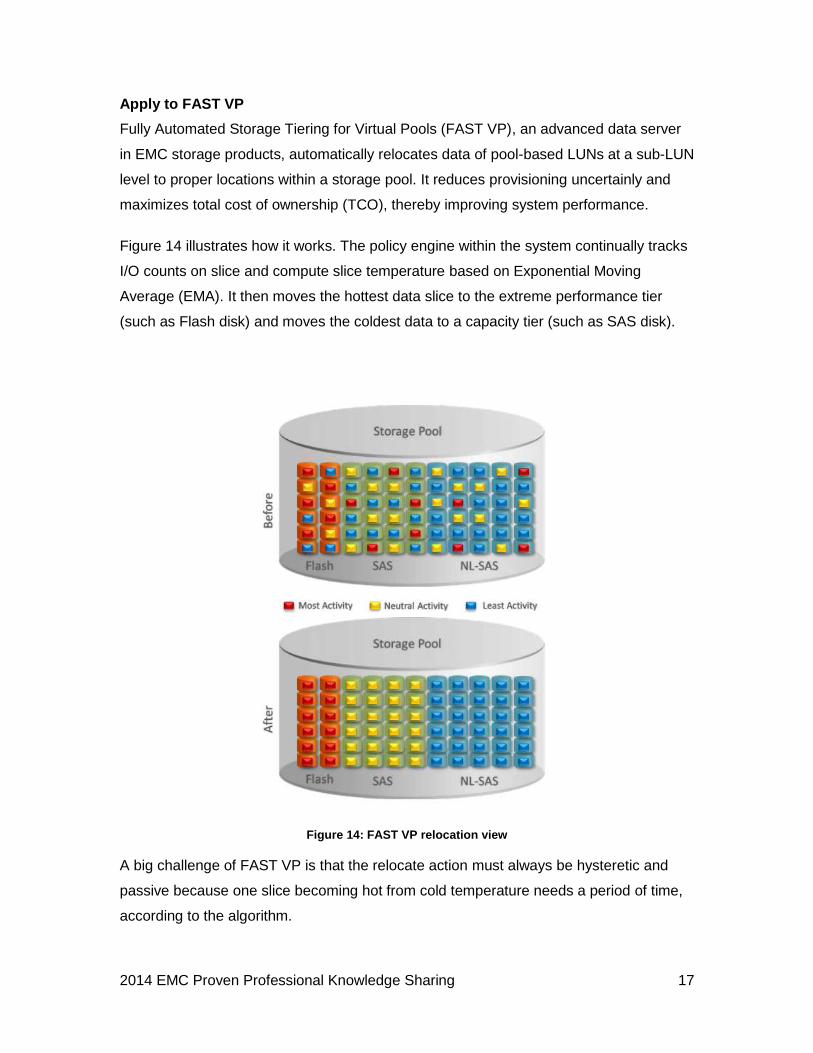
Apply to FAST VP
Fully Automated Storage Tiering for Virtual Pools (FAST VP), an advanced data server
in EMC storage products, automatically relocates data of pool-based LUNs at a sub-LUN
level to proper locations within a storage pool. It reduces provisioning uncertainly and
maximizes total cost of ownership (TCO), thereby improving system performance.
Figure 14 illustrates how it works. The policy engine within the system continually tracks
I/O counts on slice and compute slice temperature based on Exponential Moving
Average (EMA). It then moves the hottest data slice to the extreme performance tier
(such as Flash disk) and moves the coldest data to a capacity tier (such as SAS disk).
Figure 14: FAST VP relocation view
A big challenge of FAST VP is that the relocate action must always be hysteretic and
passive because one slice becoming hot from cold temperature needs a period of time,
according to the algorithm.
2014 EMC Proven Professional Knowledge Sharing 18
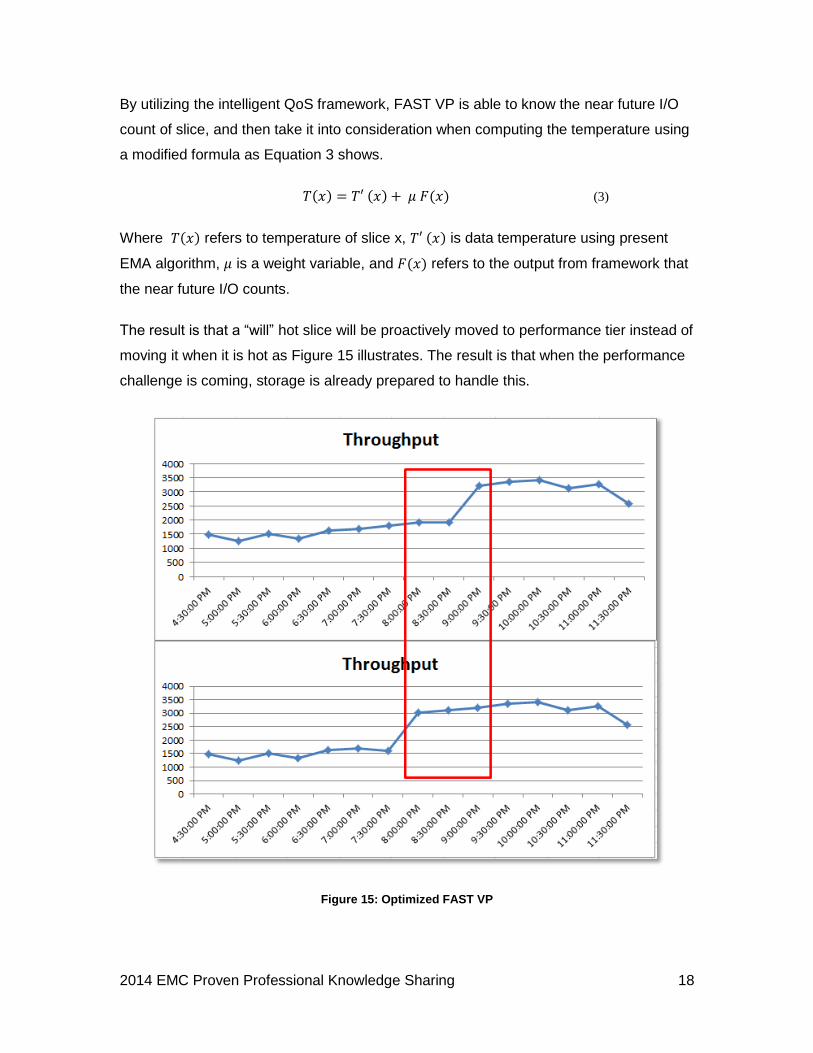
By utilizing the intelligent QoS framework, FAST VP is able to know the near future I/O
count of slice, and then take it into consideration when computing the temperature using
a modified formula as Equation 3 shows.
𝑇(𝑥) = 𝑇′ (𝑥) + 𝜇 𝐹(𝑥) (3)
Where 𝑇(𝑥) refers to temperature of slice x, 𝑇′ (𝑥) is data temperature using present
EMA algorithm, 𝜇 is a weight variable, and 𝐹(𝑥) refers to the output from framework that
the near future I/O counts.
The result is that a “will” hot slice will be proactively moved to performance tier instead of
moving it when it is hot as Figure 15 illustrates. The result is that when the performance
challenge is coming, storage is already prepared to handle this.
Figure 15: Optimized FAST VP

2014 EMC Proven Professional Knowledge Sharing 19
Conclusion
Storage QoS is an important consideration for customers wishing to improve overall
storage performance and customer experience. Doing so, it’s necessary to address the
challenges of current QoS implementation.
In this article, we proposed an intelligent QoS framework by leveraging big data analytics.
This enables predicting future QoS performance value, thereby helping features within
the storage system to become more intelligent. There are many popular prediction
methods based on actual situations. In this article, we adopted ARMA model to predict.
At last we can see some applications of this framework: 1) UQM is able to proactively
adjust performance by the prediction; 2) FAST VP could smartly calculate the
temperature by taking future performance into consideration.
The framework introduced in this article could be easily implemented and applied to
current storage systems to make them more intelligent.

2014 EMC Proven Professional Knowledge Sharing 20
Appendix
1. http://www.gartner.com/it-glossary/big-data/
2. http://searchbusinessanalytics.techtarget.com/definition/big-data-analytics
3. http://en.wikipedia.org/wiki/Time_series
4. https://community.emc.com/videos/3722
5. http://en.wikipedia.org/wiki/Autoregressive%E2%80%93moving-average_model
6. http://en.wikipedia.org/wiki/Autocorrelation
7. http://en.wikipedia.org/wiki/Partial_autocorrelation_function
8. http://en.wikipedia.org/wiki/SPSS
EMC believes the information in this publication is accurate as of its publication date.
The information is subject to change without notice.
THE INFORMATION IN THIS PUBLICATION IS PROVIDED “AS IS.” EMC
CORPORATION MAKES NO RESPRESENTATIONS OR WARRANTIES OF ANY KIND
WITH RESPECT TO THE INFORMATION IN THIS PUBLICATION, AND
SPECIFICALLY DISCLAIMS IMPLIED WARRANTIES OF MERCHANTABILITY OR
FITNESS FOR A PARTICULAR PURPOSE.
Use, copying, and distribution of any EMC software described in this publication requires
an applicable software license.