intel® guide for developing multithreaded applications · intel® guide for developing...
TRANSCRIPT

Intel® Guide for Developing Multithreaded Applications Part 2: Memory Management and Programming Tools
Summary
The Intel® Guide for Developing Multithreaded Applications provides a reference to design and
optimization guidelines for developing efficient multithreaded applications across Intel-based
symmetric multiprocessors (SMP) and/or systems with Intel® Hyper-Threading Technology. An
application developer can source this technical guide to improve multithreading performance
and minimize unexpected performance variations on current and future SMP architectures
built with Intel processors.
Part 2 is a collection of technical papers providing software developers with the most current
technical information on memory management approaches and programming tools that help
speed development and streamline parallel programming. Part 1 covers application threading
and synchronization techniques for multithreaded applications.
Each topic contains a standalone discussion of important threading issues, and complementary
topics are cross-referenced throughout the guide for easy links to deeper knowledge.
This guide provides general advice on multithreaded performance; is not intended to serve
as a textbook on multithreading nor is it a porting guide to Intel platforms. Hardware-specific
optimizations were deliberately kept to a minimum. Future versions of this guide will include
topics covering hardware-specific optimizations for developers willing to sacrifice portability
for higher performance.
Prerequisites
Readers should have programming experience in a high-level language, preferably C, C++,
and/or Fortran, though many recommendations in this document also apply to Java, C#, and
Perl. Readers must also understand basic concurrent programming and be familiar with one or
more threading methods, preferably OpenMP*, POSIX threads (also referred to as Pthreads),
or the Win32* threading API.
Developers are invited participate in online discussions on these topics at:
Threading on Intel® Parallel Architectures forum.
For online versions of individual articles, see: Intel Guide for Developing Multithreaded Applications
Get more news for developers at: Intel® Software Network News
Brought to you by Intel® Software Dispatch Delivering the latest tools, techniques, and best practices for leading-edge software infrastructure, platform software, and developer resources.

2 Copyright © 2010 Intel Corporation. All rights reserved. *Other names and brands may be claimed as the property of others.
Table of Contents
Memory Management
Threads add another dimension to memory management that should not be ignored. This chapter covers memory issues that are unique to multithreaded applications.
3.1 - Avoiding Heap Contention Among Threads ...................................................................................p. 3
3.2 - Use Thread-local Storage to Reduce Synchronization .............................................................p. 8
3.3 - Detecting Memory Bandwidth Saturation in Threaded Applications ...............................p. 12
3.4 - Avoiding and Identifying False Sharing Among Threads ........................................................p. 16
Programming Tools
This chapter describes how to use Intel software products to develop, debug, and optimize multithreaded applications.
4.1 - Automatic Parallelization with Intel® Compilers ...........................................................................p. 21
4.2 - Parallelism in the Intel® Math Kernel Library ..................................................................................p. 25
4.3 - Threading and Intel® Integrated Performance Primitives .......................................................p. 28
4.4 - Use Intel® Parallel Inspector to Find Race Conditions in OpenMP*-based Multithreaded Code......................................................................................................................................p. 34
4.5 - Curing Thread Imbalance Using Intel® Parallel Amplifier .........................................................p. 40
4.6 - Getting Code Ready for Parallel Execution with Intel® Parallel Composer ....................p. 46

Intel Guide for Developing Multithreaded Applications | Memory Management
3 Copyright © 2010 Intel Corporation. All rights reserved. *Other names and brands may be claimed as the property of others.
3.1 – Avoiding Heap Contention Among Threads
Abstract
Allocating memory from the system heap can be an expensive operation due to a lock used by system runtime libraries to
synchronize access to the heap. Contention on this lock can limit the performance benefits from multithreading. To solve this
problem, apply an allocation strategy that avoids using shared locks, or use third party heap managers.
This article is part of the larger series, “Intel Guide for Developing Multithreaded Applications,” which provides guidelines for
developing efficient multithreaded applications for Intel® platforms.
Background
The system heap (as used by malloc) is a shared resource. To make it safe to use by multiple threads, it is necessary to add
synchronization to gate access to the shared heap. Synchronization (in this case lock acquisition), requires two interactions
(i.e., locking and unlocking) with the operating system, which is an expensive overhead. Serialization of all memory allocations
is an even bigger problem, as threads spend a great deal time waiting on the lock, rather than doing useful work.
The screenshots from Intel® Parallel Amplifier in Figures 1 and 2 illustrate the heap contention problem in a multithreaded CAD
application.
Figure 1. Heap allocation routines and kernel functions called from them are the bottleneck consuming most of the application
execution time.
Intel Guide for Developing Multithreaded Applications | Memory Management
4 Copyright © 2010 Intel Corporation. All rights reserved. *Other names and brands may be claimed as the property of others.
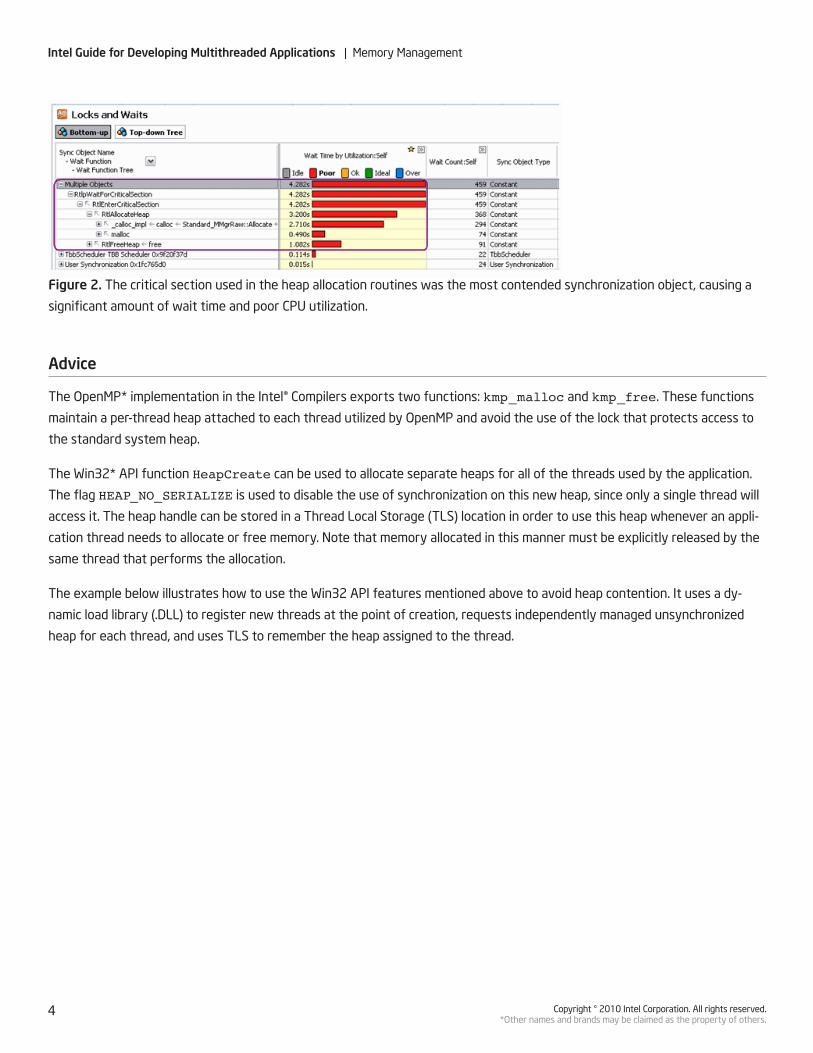
Figure 2. The critical section used in the heap allocation routines was the most contended synchronization object, causing a
significant amount of wait time and poor CPU utilization.
Advice
The OpenMP* implementation in the Intel® Compilers exports two functions: kmp_malloc and kmp_free. These functions
maintain a per-thread heap attached to each thread utilized by OpenMP and avoid the use of the lock that protects access to
the standard system heap.
The Win32* API function HeapCreate can be used to allocate separate heaps for all of the threads used by the application.
The flag HEAP_NO_SERIALIZE is used to disable the use of synchronization on this new heap, since only a single thread will
access it. The heap handle can be stored in a Thread Local Storage (TLS) location in order to use this heap whenever an appli-
cation thread needs to allocate or free memory. Note that memory allocated in this manner must be explicitly released by the
same thread that performs the allocation.
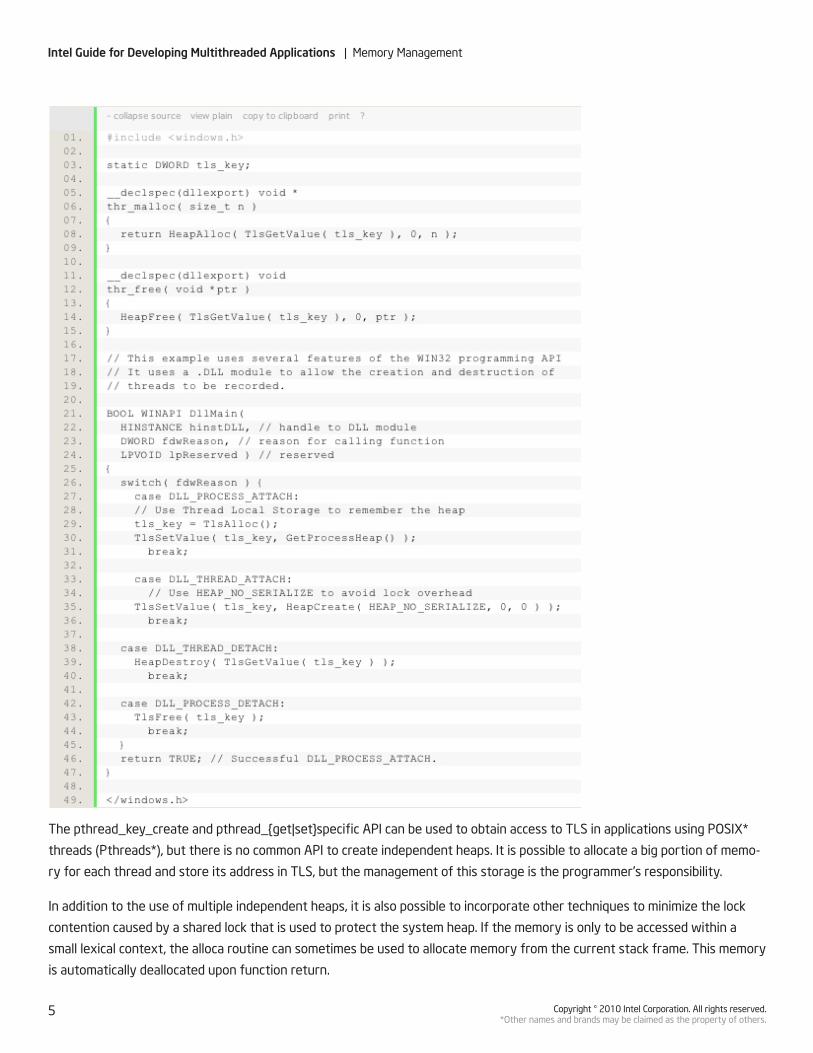
The example below illustrates how to use the Win32 API features mentioned above to avoid heap contention. It uses a dy-
namic load library (.DLL) to register new threads at the point of creation, requests independently managed unsynchronized
heap for each thread, and uses TLS to remember the heap assigned to the thread.
Intel Guide for Developing Multithreaded Applications | Memory Management
5 Copyright © 2010 Intel Corporation. All rights reserved. *Other names and brands may be claimed as the property of others.
The pthread_key_create and pthread_{get|set}specific API can be used to obtain access to TLS in applications using POSIX*
threads (Pthreads*), but there is no common API to create independent heaps. It is possible to allocate a big portion of memo-
ry for each thread and store its address in TLS, but the management of this storage is the programmer’s responsibility.
In addition to the use of multiple independent heaps, it is also possible to incorporate other techniques to minimize the lock
contention caused by a shared lock that is used to protect the system heap. If the memory is only to be accessed within a
small lexical context, the alloca routine can sometimes be used to allocate memory from the current stack frame. This memory
is automatically deallocated upon function return.

Intel Guide for Developing Multithreaded Applications | Memory Management
6 Copyright © 2010 Intel Corporation. All rights reserved. *Other names and brands may be claimed as the property of others.
Note, however that Microsoft has deprecated _alloca and recommends using the security enhanced routine called _mal-
loca instead. It allocates either from the stack or from the heap depending on the requested size; therefore, the memory
obtained from _malloca should be released with _freea.
A per-thread free list is another technique. Initially, memory is allocated from the system heap with malloc. When the memo-
Intel Guide for Developing Multithreaded Applications | Memory Management
7 Copyright © 2010 Intel Corporation. All rights reserved. *Other names and brands may be claimed as the property of others.
ry would normally be released, it is added to a per-thread linked list. If the thread needs to reallocate memory of the same size,
it can immediately retrieve the stored allocation from the list without going back to the system heap.
If the described techniques are not applicable (e.g., the thread that allocates the memory is not necessarily the thread that
releases the memory) or memory management still remains a bottleneck, then it may be more appropriate to look into using
a third party replacement to the heap manager. Intel® Threading Building Blocks (Intel® TBB) offers a multithreading-friendly
memory manager than can be used with Intel TBB-enabled applications as well as with OpenMP and manually threaded appli-
cations. Some other third-party heap managers are listed in the Additional Resources section at the end of this article.
Usage Guidelines
With any optimization, you encounter trade-offs. In this case, the trade-off is in exchanging lower contention on the system
heap for higher memory usage. When each thread is maintaining its own private heap or collection of objects, these areas are
not available to other threads. This may result in a memory imbalance between the threads, similar to the load imbalance you
encounter when threads are performing varying amounts of work. The memory imbalance may cause the working set size
and the total memory usage by the application to increase. The increase in memory usage usually has a minimal performance
impact. An exception occurs when the increase in memory usage exhausts the available memory. If this happens, it may cause
the application to either abort or swap to disk.
Additional Resources
Intel® Software Network Parallel Programming Community
Microsoft Developer Network: HeapAlloc, HeapCreate, HeapFree
Microsoft Developer Network: TlsAlloc, TlsGetValue, TlsSetValue
Microsoft Developer Network: _alloca, _malloca, _freea
MicroQuill SmartHeap for SMP
The HOARD memory allocator
Intel® Threading Building Blocks
Intel Threading Building Blocks for Open Source
James Reinders, Intel Threading Building Blocks: Outfitting C++ for Multi-core Processor Parallelism. O’Reilly Media, Inc. Sebas-topol, CA, 2007.
Intel Guide for Developing Multithreaded Applications | Memory Management
8 Copyright © 2010 Intel Corporation. All rights reserved. *Other names and brands may be claimed as the property of others.
3.2 – Use Thread-local Storage to Reduce Synchronization
Abstract
Synchronization is often an expensive operation that can limit the performance of a multi-threaded program. Using thread-
local data structures instead of data structures shared by the threads can reduce synchronization in certain cases, allowing a
program to run faster.
Background
When data structures are shared by a group of threads and at least one thread is writing into them, synchronization between
the threads is sometimes necessary to make sure that all threads see a consistent view of the shared data. A typical synchro-
nized access regime for threads in this situation is for a thread to acquire a lock, read or write the shared data structures, then
release the lock.
All forms of locking have overhead to maintain the lock data structures, and they use atomic instructions that slow down mod-
ern processors. Synchronization also slows down the program, because it eliminates parallel execution inside the synchronized
code, forming a serial execution bottleneck. Therefore, when synchronization occurs within a time-critical section of code,
code performance can suffer.
The synchronization can be eliminated from the multithreaded, time-critical code sections if the program can be re-written
to use thread-local storage instead of shared data structures. This is possible if the nature of the code is such that real-time
ordering of the accesses to the shared data is unimportant. Synchronization can also be eliminated when the ordering of ac-
cesses is important, if the ordering can be safely postponed to execute during infrequent, non-time-critical sections of code.
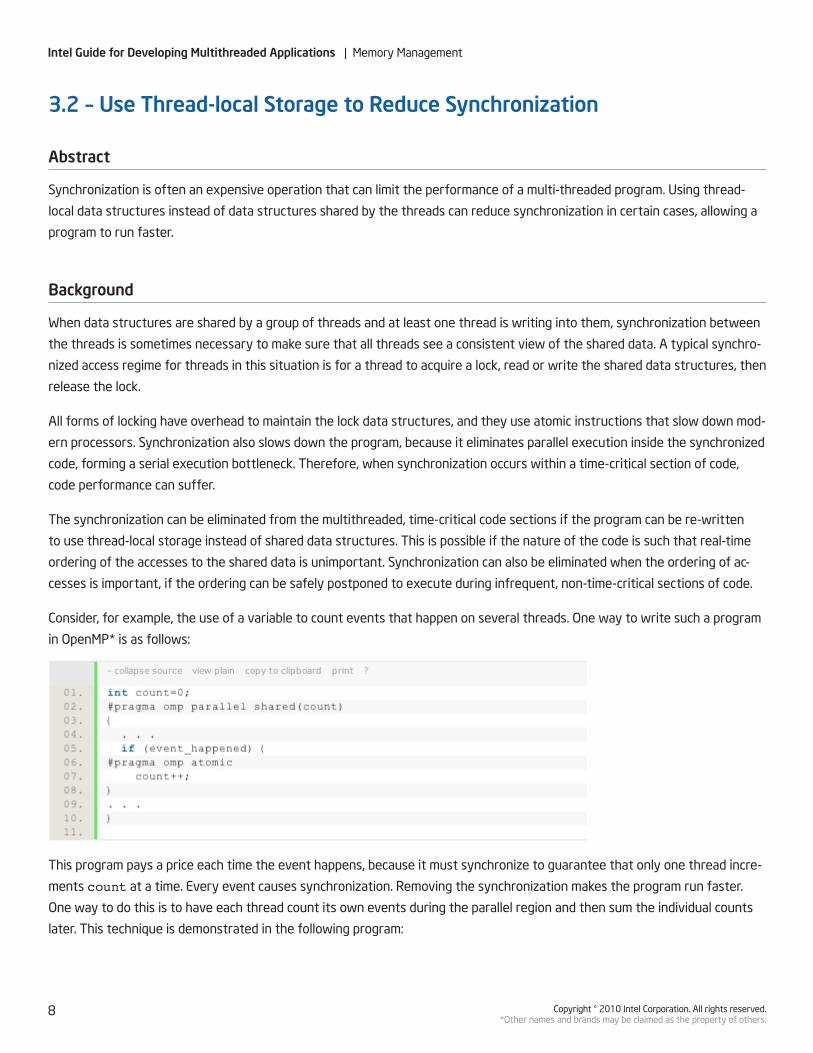
Consider, for example, the use of a variable to count events that happen on several threads. One way to write such a program
in OpenMP* is as follows:
This program pays a price each time the event happens, because it must synchronize to guarantee that only one thread incre-
ments count at a time. Every event causes synchronization. Removing the synchronization makes the program run faster.
One way to do this is to have each thread count its own events during the parallel region and then sum the individual counts
later. This technique is demonstrated in the following program:
Intel Guide for Developing Multithreaded Applications | Memory Management
9 Copyright © 2010 Intel Corporation. All rights reserved. *Other names and brands may be claimed as the property of others.
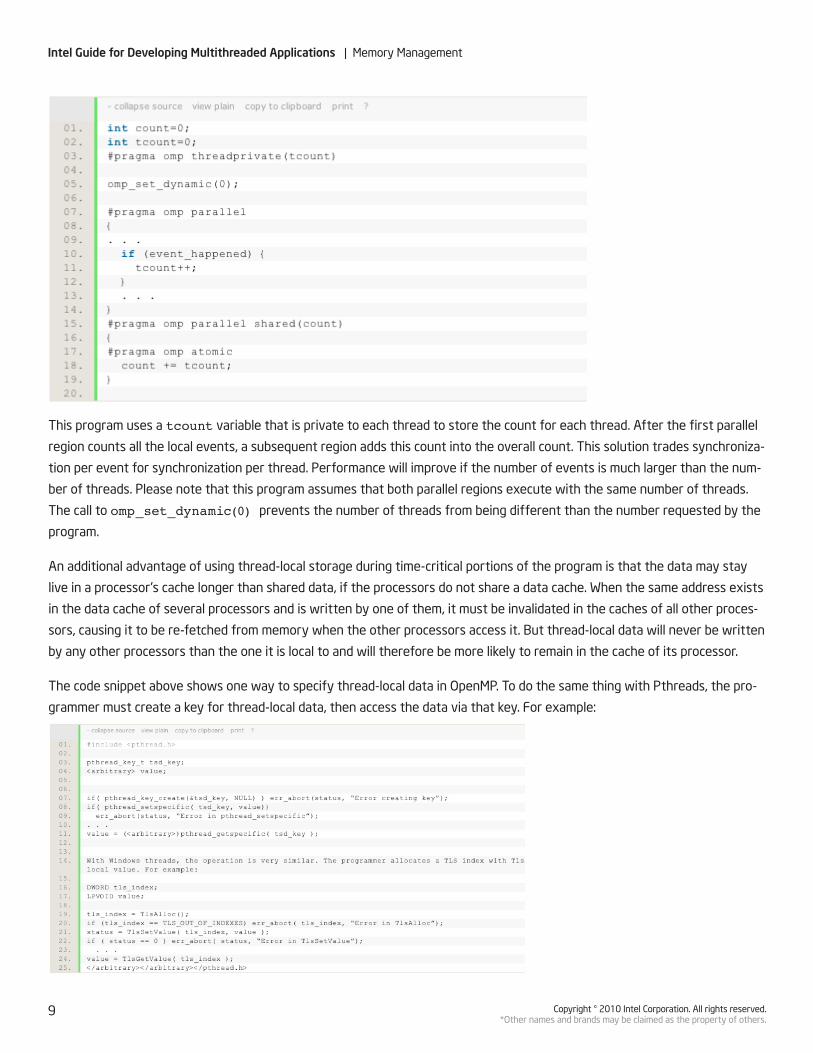
This program uses a tcount variable that is private to each thread to store the count for each thread. After the first parallel
region counts all the local events, a subsequent region adds this count into the overall count. This solution trades synchroniza-
tion per event for synchronization per thread. Performance will improve if the number of events is much larger than the num-
ber of threads. Please note that this program assumes that both parallel regions execute with the same number of threads.
The call to omp_set_dynamic(0) prevents the number of threads from being different than the number requested by the
program.
An additional advantage of using thread-local storage during time-critical portions of the program is that the data may stay
live in a processor’s cache longer than shared data, if the processors do not share a data cache. When the same address exists
in the data cache of several processors and is written by one of them, it must be invalidated in the caches of all other proces-
sors, causing it to be re-fetched from memory when the other processors access it. But thread-local data will never be written
by any other processors than the one it is local to and will therefore be more likely to remain in the cache of its processor.
The code snippet above shows one way to specify thread-local data in OpenMP. To do the same thing with Pthreads, the pro-
grammer must create a key for thread-local data, then access the data via that key. For example:

Intel Guide for Developing Multithreaded Applications | Memory Management
10 Copyright © 2010 Intel Corporation. All rights reserved. *Other names and brands may be claimed as the property of others.
In OpenMP, one can also create thread-local variables by specifying them in a private clause on the parallel pragma. These
variables are automatically deallocated at the end of the parallel region. Of course, another way to specify thread-local data,
regardless of the threading model, is to use variables allocated on the stack in a given scope. Such variables are deallocated at
the end of the scope.
Advice
The technique of thread-local storage is applicable if synchronization is coded within a time-critical section of code, and if the
operations being synchronized need not be ordered in real-time. If the real-time order of the operations is important, then the
technique can still be applied if enough information can be captured during the time-critical section to reproduce the ordering
later, during a non-time-critical section of code.
Consider, for example, the following example, where threads write data into a shared buffer:
Assume that time is some monotonically increasing value and the only real requirement of the program for this buffer data is
that it be written to a file occasionally, sorted according to time. Synchronization can be eliminated in the update_log routine
by using thread-local buffers. Each thread would allocate a separate copy of tpbuffer and tpcurrent_ptr. This allows the
elimination of the critical section in update_log. The entries from the various thread-private buffers can be merged later,
according to the time values, in a non-time-critical portion of the program.
Intel Guide for Developing Multithreaded Applications | Memory Management
11 Copyright © 2010 Intel Corporation. All rights reserved. *Other names and brands may be claimed as the property of others.
Usage Guidelines
One must be careful about the trade-offs involved in this technique. The technique does not remove the need for synchroni-
zation, but only moves the synchronization from a time-critical section of the code to a non-time-critical section of the code.
First, determine whether the original section of code containing the synchronization is actually being slowed down •
significantly by the synchronization. Intel® Parallel Amplifier and/or Intel® VTune ™ Performance Analyzer can be used to
check each section of code for performance problems.
Second, determine whether the time ordering of the operations is critical to the application. If not, synchronization can •
be removed, as in the event-counting code. If time ordering is critical, can the ordering be correctly reconstructed later?
Third, verify that moving synchronization to another place in the code will not cause similar performance problems in •
the new location. One way to do this is to show that the number of synchronizations will decrease dramatically because
of your work (such as in the event-counting example above).
Additional Resources
Intel® Software Network Parallel Programming Community
OpenMP* Specifications
David R. Butenhof, Programming with POSIX Threads, Addison-Wesley, 1997.
Johnson M. Hart, Win32 System Programming (2nd Edition), Addison-Wesley, 2001.
Jim Beveridge and Robert Weiner, Multithreading Applications in Win32, Addison-Wesley, 1997.

Intel Guide for Developing Multithreaded Applications | Memory Management
12 Copyright © 2010 Intel Corporation. All rights reserved. *Other names and brands may be claimed as the property of others.
3.3 – Detecting Memory Bandwidth Saturation in Threaded Applications
Abstract
Memory sub-system components contribute significantly to the performance characteristics of an application. As an increas-
ing number of threads or processes share the limited resources of cache capacity and memory bandwidth, the scalability of
a threaded application can become constrained. Memory-intensive threaded applications can suffer from memory bandwidth
saturation as more threads are introduced. In such cases, the threaded application won’t scale as expected, and performance
can be reduced. This article introduces techniques to detect memory bandwidth saturation in threaded applications.
This article is part of the larger series, “Intel Guide for Developing Multithreaded Applications,” which provides guidelines for
developing efficient multithreaded applications for Intel® platforms.
Background
As modern processors include more cores and bigger caches, they become faster at a higher rate than the memory sub-sys-
tem components. The increasing core count on a per-die basis has put pressure on the cache capacity and memory bandwidth.
As a result, optimally utilizing the available cache and memory bandwidth to each core is essential in developing forward-
scaling applications. If a system isn’t capable of moving data from main memory to the cores fast enough, the cores will sit idle
as they wait for the data to arrive. An idle core during computation is a wasted resource that increases the overall execution
time of the computation and will negate some of the benefits of more cores.
The current generation of Intel® processors based on the Nehalem architecture moved from the traditional front-side-bus
(FSB) approach to non-uniform memory access/architecture (NUMA) model to increase the available memory bandwidth to the
cores and reduce the bandwidth saturation issues mentioned above. Figure 1 depicts the FSB to NUMA transition.
Figure 1. Transition from FSB to NUMA.
The clear symptom of bandwidth saturation for any parallel application is non-scaling behavior. In other words, an application
that has saturated the available memory bandwidth will not scale effectively to more threads or cores. However, there are
many causes for multi-threaded applications not to scale and some of these performance inhibiting factors include threading
overhead, synchronization overhead, load imbalance, and inappropriate granularity. Intel® Thread Profiler is designed to iden-
tify such performance issues at the application level.

Intel Guide for Developing Multithreaded Applications | Memory Management
13 Copyright © 2010 Intel Corporation. All rights reserved. *Other names and brands may be claimed as the property of others.
The following results are taken after running the STREAM benchmark version 5.6 with various numbers of threads (only triad
scores are shown).
It is easy to see that STREAM does not benefit from having more threads on this particular platform (a single-socket Intel®
Core™ 2 Quad-based system). Closer inspection of the results shows that even though there was a slight increase in the triad
score for the two-thread version, the four-thread version performed even worse than the single threaded run.
Figure 2 shows Intel Thread Profiler analysis of the benchmark. The timeline view reveals that all threads are perfectly bal-
anced and have no synchronization overheads. While it is a powerful tool for identifying threading performance issues at appli-
cation level, Intel Thread Profiler will not detect memory bandwidth saturation in threaded applications.
Figure 2. Intel Thread Profiler timeline view of the STREAM benchmark using four OpenMP* threads.
Advice
Intel® VTune™ Performance Analyzer and Performance Tuning Utility (PTU) used in combination with event-based sampling
(EBS), can help developers measure application bandwidth usage, which can then be checked against the achievable (or theo-
retical) bandwidth on the system. Event-based sampling relies on the performance monitoring unit (PMU) supported by the
processors.
VTune analyzer and PTU can help developers estimate the memory bandwidth usage of a particular application by using EBS.
On Intel® Core™ 2 microarchitecture CPU_CLK_UNHALTED.CORE and BUS_TRANS_MEM.ALL_AGENTS performance events
can be used to estimate the memory bandwidth.
The • CPU_CLK_UNHALTED.CORE event counts the number of core cycles while the core is not in a halt state. The core
enters the halt state when it is running the HLT instruction.
The • BUS_TRANS_MEM.ALL_AGENTS event counts activity initiated by any agent on the bus. In systems where each
processor is attached to a different bus, the count reflects only the activity for the bus on which the processor resides.
On Core 2-based systems memory bandwidth can be estimated by using the following formula:
(64 * BUS_TRANS_MEM.ALL_AGENTS * CPU Frequency) / CPU_CLK_UNHALTED.CORE

Intel Guide for Developing Multithreaded Applications | Memory Management
14 Copyright © 2010 Intel Corporation. All rights reserved. *Other names and brands may be claimed as the property of others.
Figure 3. VTune analyzer EBS analysis of STREAM with four threads.
Figure 3 shows the EBS results of the STREAM benchmark when four threads were used. By using the above formula, it is
possible to estimate the memory bandwidth usage of STREAM as 7.6Gb/sec.
Memory Bandwidth = (64 * 1,419,200,000 * 2.9GHz) / 35,576,000,000 = 7.6GB/sec
The STREAM-reported sustainable Triad score was 7.7GB/seconds, so the VTune analyzer-based calculation is quite reason-
able. The STREAM benchmark was chosen to demonstrate how memory bandwidth measured using EBS can approximately
measure the achievable memory bandwidth on a particular system.
If an application doesn’t scale when more threads are added to take advantage of the available cores, and if Intel Thread Pro-
filer doesn’t show any application-level threading problems as mentioned above, then the following three steps can help the
user determine whether or not a particular application is saturating the available memory bandwidth:
Run STREAM or similar benchmarks to get an idea of the sustainable memory bandwidth on the target system. •
Run the target application under VTune analyzer or PTU and collect the appropriate performance counters using EBS. •
For Core 2 microarchitecture, these events are again CPU_CLK_UNHALTED.CORE and BUS_TRANS_MEM.ALL_AGENTS
(Formula 1).
Compare VTune analyzer-measured memory bandwidth numbers to the sustainable or achievable memory bandwidth •
measured in step 1. If the application is saturating the available bandwidth, then this particular application won’t scale
with more cores.
Generally speaking, a memory-bound application (one whose performance is limited by the memory access speed) won’t ben-
efit from having more threads.
Usage Guidelines
The new Intel® Core™ i7 and Xeon® 5500 series processors are referred to as having an “uncore, “ which is that part of the
processor that is external to all the individual cores. For example, the Intel Core i7 processor has four cores that share an L3
cache and a memory interface. The L3 and memory interface are considered to be part of the uncore (see Figure 4).
Neither the VTune analyzer nor PTU support the sampling of events that are triggered in the uncore of the processor, and the
memory bandwidth measurement must be performed differently. The relevant performance events used for measuring band-
width are not sampled using EBS as is usual with VTune analyzer or PTU; rather, they are counted using time-based sampling.
This means that the bandwidth is measured for the entire system over a designated time range, and it isn’t possible to see
how much of the bandwidth usage comes from specific functions, processes, and modules.

Intel Guide for Developing Multithreaded Applications | Memory Management
15 Copyright © 2010 Intel Corporation. All rights reserved. *Other names and brands may be claimed as the property of others.
Figure 4. Simplified block diagram of a 4 core Nehalem processor.
The formula given above can be used to measure the memory bandwidth usage of any application, module, or function on
Core 2 based systems except on Core 2 based Xeon MP processors, which also have uncore parts. The basic formula for mea-
suring the memory bandwidth on Nehalem architecture-based systems can be given as follows:
Memory Bandwidth = 1.0e-9 * (UNC_IMC_NORMAL_READS.ANY+UNC_IMC_WRITES.FULL.ANY)*64 / (wall
clock time in seconds)
Additional Resources
Intel® Software Network Parallel Programming Community
Intel® VTune™ Performance Analyzer
STREAM: Sustainable Memory Bandwidth in High Performance Computers
Intel® Performance Tuning Utility
How Do I Measure Memory Bandwidth on an Intel® Core™ i7 or Intel® Xeon® Processor 5500 Series Platform Using Intel® VTune™ Performance Analyzer?

Intel Guide for Developing Multithreaded Applications | Memory Management
16 Copyright © 2010 Intel Corporation. All rights reserved. *Other names and brands may be claimed as the property of others.
3.4 – Avoiding and Identifying False Sharing Among Threads
Abstract
In symmetric multiprocessor (SMP) systems, each processor has a local cache. The memory system must guarantee cache co-
herence. False sharing occurs when threads on different processors modify variables that reside on the same cache line. This
invalidates the cache line and forces an update, which hurts performance. This article covers methods to detect and correct
false sharing.
Background
False sharing is a well-known performance issue on SMP systems, where each processor has a local cache. It occurs when
threads on different processors modify variables that reside on the same cache line, as illustrated in Figure 1. This circum-
stance is called false sharing because each thread is not actually sharing access to the same variable. Access to the same vari-
able, or true sharing, would require programmatic synchronization constructs to ensure ordered data access.
The source line shown in red in the following example code causes false sharing:
There is a potential for false sharing on array sum_local. This array is dimensioned according to the number of threads and is
small enough to fit in a single cache line. When executed in parallel, the threads modify different, but adjacent, elements of
sum_local (the source line shown in red), which invalidates the cache line for all processors.
Intel Guide for Developing Multithreaded Applications | Memory Management
17 Copyright © 2010 Intel Corporation. All rights reserved. *Other names and brands may be claimed as the property of others.
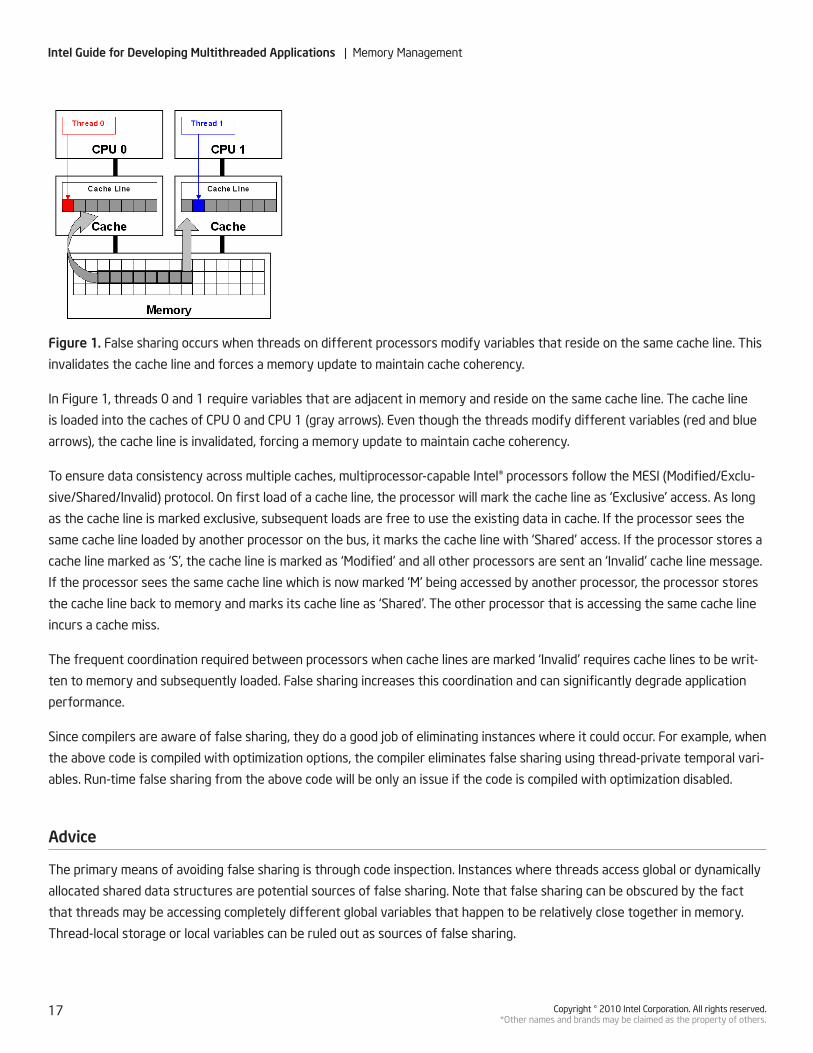
Figure 1. False sharing occurs when threads on different processors modify variables that reside on the same cache line. This
invalidates the cache line and forces a memory update to maintain cache coherency.
In Figure 1, threads 0 and 1 require variables that are adjacent in memory and reside on the same cache line. The cache line
is loaded into the caches of CPU 0 and CPU 1 (gray arrows). Even though the threads modify different variables (red and blue
arrows), the cache line is invalidated, forcing a memory update to maintain cache coherency.
To ensure data consistency across multiple caches, multiprocessor-capable Intel® processors follow the MESI (Modified/Exclu-
sive/Shared/Invalid) protocol. On first load of a cache line, the processor will mark the cache line as ‘Exclusive’ access. As long
as the cache line is marked exclusive, subsequent loads are free to use the existing data in cache. If the processor sees the
same cache line loaded by another processor on the bus, it marks the cache line with ‘Shared’ access. If the processor stores a
cache line marked as ‘S’, the cache line is marked as ‘Modified’ and all other processors are sent an ‘Invalid’ cache line message.
If the processor sees the same cache line which is now marked ‘M’ being accessed by another processor, the processor stores
the cache line back to memory and marks its cache line as ‘Shared’. The other processor that is accessing the same cache line
incurs a cache miss.
The frequent coordination required between processors when cache lines are marked ‘Invalid’ requires cache lines to be writ-
ten to memory and subsequently loaded. False sharing increases this coordination and can significantly degrade application
performance.
Since compilers are aware of false sharing, they do a good job of eliminating instances where it could occur. For example, when
the above code is compiled with optimization options, the compiler eliminates false sharing using thread-private temporal vari-
ables. Run-time false sharing from the above code will be only an issue if the code is compiled with optimization disabled.
Advice
The primary means of avoiding false sharing is through code inspection. Instances where threads access global or dynamically
allocated shared data structures are potential sources of false sharing. Note that false sharing can be obscured by the fact
that threads may be accessing completely different global variables that happen to be relatively close together in memory.
Thread-local storage or local variables can be ruled out as sources of false sharing.

Intel Guide for Developing Multithreaded Applications | Memory Management
18 Copyright © 2010 Intel Corporation. All rights reserved. *Other names and brands may be claimed as the property of others.
The run-time detection method is to use the Intel® VTune™ Performance Analyzer or Intel® Performance Tuning Utility (Intel
PTU, available at http://software.intel.com/en-us/articles/intel-performance-tuning-utility/). This method relies on event-based
sampling that discovers places where cacheline sharing exposes performance visible effects. However, such effects don’t
distinguish between true and false sharing.
For systems based on the Intel® Core™ 2 processor, configure VTune analyzer or Intel PTU to sample the MEM_LOAD_RE-
TIRED.L2_LINE_MISS and EXT_SNOOP.ALL_AGENTS.HITM events. For systems based on the Intel® Core i7 processor,
configure to sample MEM_UNCORE_RETIRED.OTHER_CORE_L2_HITM. If you see a high occurrence of EXT_SNOOP.ALL_
AGENTS.HITM events, such that it is a fraction of percent or more of INST_RETIRED.ANY events at some code regions
on Intel® Core™ 2 processor family CPUs, or a high occurrence of MEM_UNCORE_RETIRED.OTHER_CORE_L2_HITM events
on Intel® Core i7 processor family CPU, you have true or false sharing. Inspect the code of concentration of MEM_LOAD_RE-
TIRED.L2_LINE_MISS and MEM_UNCORE_RETIRED.OTHER_CORE_L2_HITM events at the corresponding system at
or near load/store instructions within threads to determine the likelihood that the memory locations reside on the same cache
line and causing false sharing.
Intel PTU comes with predefined profile configurations to collect events that will help to locate false sharing. These configura-
tions are “Intel® Core™ 2 processor family – Contested Usage” and “Intel® Core™ i7 processor family – False-True Sharing.” Intel
PTU Data Access analysis identifies false sharing candidates by monitoring different offsets of the same cacheline accessed
by different threads. When you open the profiling results in Data Access View, the Memory Hotspot pane will have hints about
false sharing at the cacheline granularity, as illustrated in Figure 2.
Figure 2. False sharing shown in Intel PTU Memory Hotspots pane.
In Figure 2, memory offsets 32 and 48 (of the cacheline at address 0x00498180) were accessed by the ID=59 thread and the
ID=62 thread at the work function. There is also some true sharing due to array initialization done by the ID=59 thread.
The pink color is used to hint about false sharing at a cacheline. Note the high figures for MEM_UNCORE_RETIRED.OTHER_
CORE_L2_HITM associated with the cacheline and its corresponding offsets.
Once detected, there are several techniques to correct false sharing. The goal is to ensure that variables causing false sharing
are spaced far enough apart in memory that they cannot reside on the same cache line. While the following is not an exhaus-
tive list three possible methods are discussed below.
One technique is to use compiler directives to force individual variable alignment. The following source code demonstrates the
compiler technique using __declspec (align(n)) where n equals 64 (64 byte boundary) to align the individual variables on cache
line boundaries.

Intel Guide for Developing Multithreaded Applications | Memory Management
19 Copyright © 2010 Intel Corporation. All rights reserved. *Other names and brands may be claimed as the property of others.
__declspec (align(64)) int thread1_global_variable;
__declspec (align(64)) int thread2_global_variable;
When using an array of data structures, pad the structure to the end of a cache line to ensure that the array elements begin
on a cache line boundary. If you cannot ensure that the array is aligned on a cache line boundary, pad the data structure to
twice the size of a cache line. The following source code demonstrates padding a data structure to a cache line boundary
and ensuring the array is also aligned using the compiler __declspec (align(n)) statement where n equals 64 (64 byte
boundary). If the array is dynamically allocated, you can increase the allocation size and adjust the pointer to align with a cache
line boundary.
It is also possible to reduce the frequency of false sharing by using thread-local copies of data. The thread-local copy can be
read and modified frequently and only when complete, copy the result back to the data structure. The following source code
demonstrates using a local copy to avoid false sharing.

Intel Guide for Developing Multithreaded Applications | Memory Management
20 Copyright © 2010 Intel Corporation. All rights reserved. *Other names and brands may be claimed as the property of others.
Usage Guidelines
Avoid false sharing but use these techniques sparingly. Overuse can hinder the effective use of the processor’s available
cache. Even with multiprocessor shared-cache designs, avoiding false sharing is recommended. The small potential gain for try-
ing to maximize cache utilization on multi-processor shared cache designs does not generally outweigh the software mainte-
nance costs required to support multiple code paths for different cache architectures.
Additional Resources
Intel® Software Network Parallel Programming Community
Intel® VTune™ Performance Analyzer
Intel® Performance Tuning Utility

Intel Guide for Developing Multithreaded Applications | Memory Management
21 Copyright © 2010 Intel Corporation. All rights reserved. *Other names and brands may be claimed as the property of others.
4.1 – Automatic Parallelization with Intel® Compilers
Abstract
Multithreading an application to improve performance can be a time-consuming activity. For applications where most of the
computation is carried out in simple loops, the Intel® compilers may be able to generate a multithreaded version automatically.
In addition to high-level code optimizations, the Intel Compilers also enable threading through automatic parallelization and
OpenMP* support. With automatic parallelization, the compiler detects loops that can be safely and efficiently executed in
parallel and generates multithreaded code. OpenMP allows programmers to express parallelism using compiler directives and
C/C++ pragmas.
This article is part of the larger series, “Intel Guide for Developing Multithreaded Applications,” which provides guidelines for
developing efficient multithreaded applications for Intel® platforms.
Background
The Intel® C++ and Fortran Compilers have the ability to analyze the dataflow in loops to determine which loops can be safely
and efficiently executed in parallel. Automatic parallelization can sometimes result in shorter execution times on multicore
systems. It also relieves the programmer from:
Searching for loops that are good candidates for parallel execution •
Performing dataflow analysis to verify correct parallel execution •
Adding parallel compiler directives manually. •
Adding the -Qparallel (Windows*) or -parallel (Linux* or Mac OS* X) option to the compile command is the only action required
of the programmer. However, successful parallelization is subject to certain conditions that are described in the next section.
The following Fortran program contains a loop with a high iteration count:
Dataflow analysis confirms that the loop does not contain data dependencies. The compiler will generate code that divides the
iterations as evenly as possible among the threads at runtime. The number of threads defaults to the total number of proces-
sor cores (which may be greater than the number of physical cores if Intel® Hyper Threading Technology is enabled), but may
be set independently via the OMP_NUM_THREADS environment variable. The parallel speed-up for a given loop depends on
the amount of work, the load balance among threads, the overhead of thread creation and synchronization, etc., but it will
generally be less than linear relative to the number of threads used. For a whole program, speed-up depends on the ratio of
parallel to serial computation (see any good textbook on parallel computing for a description of Amdahl’s Law).

Intel Guide for Developing Multithreaded Applications | Programming Tools
22 Copyright © 2010 Intel Corporation. All rights reserved. *Other names and brands may be claimed as the property of others.
Advice
Three requirements must be met for the compiler to parallelize a loop. First, the number of iterations must be known be-
fore entry into a loop so that the work can be divided in advance. A while-loop, for example, usually cannot be made parallel.
Second, there can be no jumps into or out of the loop. Third, and most important, the loop iterations must be independent. In
other words, correct results most not logically depend on the order in which the iterations are executed. There may, however,
be slight variations in the accumulated rounding error, as, for example, when the same quantities are added in a different
order. In some cases, such as summing an array or other uses of temporary scalars, the compiler may be able to remove an ap-
parent dependency by a simple transformation.
Potential aliasing of pointers or array references is another common impediment to safe parallelization. Two pointers are
aliased if both point to the same memory location. The compiler may not be able to determine whether two pointers or array
references point to the same memory location, for example, if they depend on function arguments, run-time data, or the
results of complex calculations. If the compiler cannot prove that pointers or array references are safe and that iterations are
independent, it will not parallelize the loop, except in limited cases when it is deemed worthwhile to generate alternative code
paths to test explicitly for aliasing at run-time. If the programmer knows that parallelization of a particular loop is safe, and
that potential aliases can be ignored, this fact can be communicated to the compiler with a C pragma (#pragma parallel)
or Fortran directive (!DIR$ PARALLEL). An alternative way in C to assert that a pointer is not aliased is to use the restrict
keyword in the pointer declaration, along with the -Qrestrict (Windows) or -restrict (Linux or Mac OS* X) command-line
option. However, the compiler will never parallelize a loop that it can prove to be unsafe.
The compiler can only effectively analyze loops with a relatively simple structure. For example, it cannot determine the
thread-safety of a loop containing external function calls because it does not know whether the function call has side effects
that introduce dependences. Fortran 90 programmers can use the PURE attribute to assert that subroutines and functions
contain no side effects. Another way, in C or Fortran, is to invoke inter-procedural optimization with the -Qipo (Windows) or
-ipo (Linux or Mac OS X) compiler option. This gives the compiler the opportunity to inline or analyze the called function for
side effects.
When the compiler is unable to automatically parallelize complex loops that the programmer knows could safely be executed
in parallel, OpenMP is the preferred solution. The programmer typically understands the code better than the compiler and
can express parallelism at a coarser granularity. On the other hand, automatic parallelization can be effective for nested loops,
such as those in a matrix multiply. Moderately coarse-grained parallelism results from threading of the outer loop, allowing the
inner loops to be optimized for fine grained parallelism using vectorization or software pipelining.
Just because a loop can be parallelized does not mean that it should be parallelized. The compiler uses a cost model with a
threshold parameter to decide whether to parallelize a loop. The -Qpar-threshold[n] (Windows) and -par-threshold[n] (Linux)
compiler options adjust this parameter. The value of n ranges from 0 to 100, where 0 means to always parallelize a safe loop,
irrespective of the cost model, and 100 tells the compiler to only parallelize those loops for which a performance gain is highly
probable. The default value of n is conservatively set to 100; sometimes, reducing the threshold to 99 may result in a signifi-
cant increase in the number of loops parallelized. The pragma #parallel always (!DIR$ PARALLEL ALWAYS in Fortran)
may be used to override the cost model for an individual loop.
The switches -Qpar-report[n] (Windows) or -par-report[n] (Linux), where n is 1 to 3, show which loops were parallel-
ized. Look for messages such as:
Intel Guide for Developing Multithreaded Applications | Programming Tools
23 Copyright © 2010 Intel Corporation. All rights reserved. *Other names and brands may be claimed as the property of others.
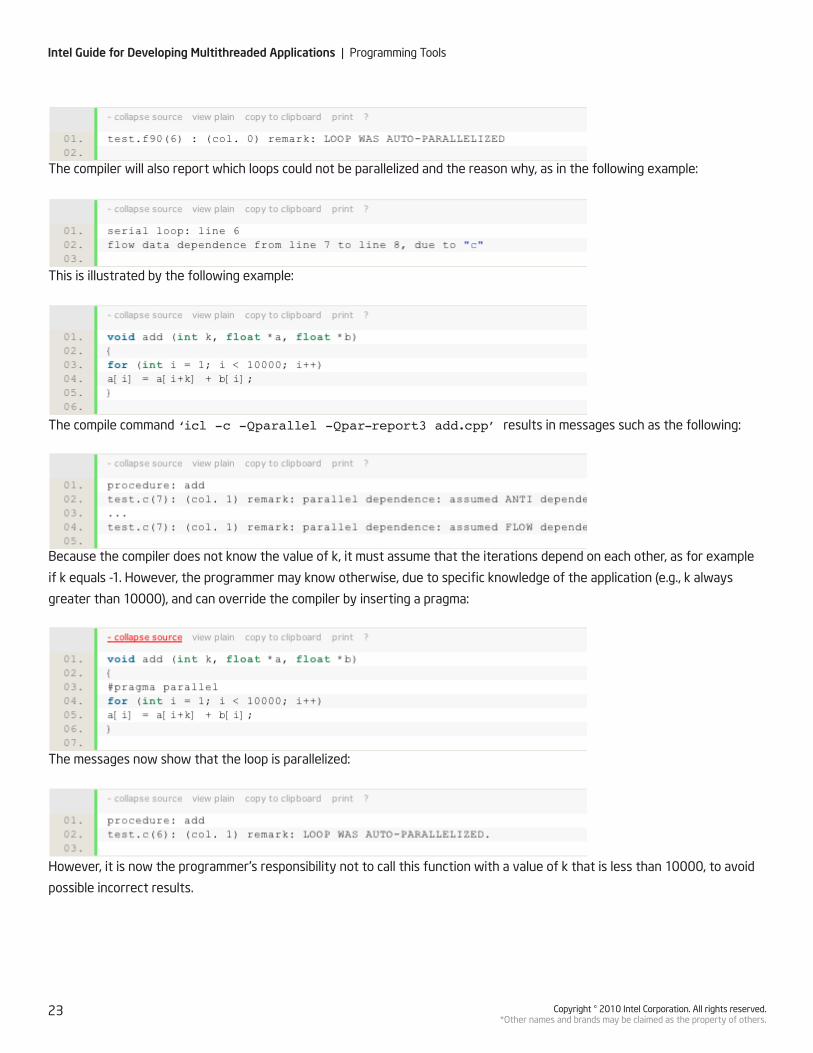
The compiler will also report which loops could not be parallelized and the reason why, as in the following example:
This is illustrated by the following example:
The compile command ‘icl -c -Qparallel -Qpar-report3 add.cpp’ results in messages such as the following:
Because the compiler does not know the value of k, it must assume that the iterations depend on each other, as for example
if k equals -1. However, the programmer may know otherwise, due to specific knowledge of the application (e.g., k always
greater than 10000), and can override the compiler by inserting a pragma:
The messages now show that the loop is parallelized:
However, it is now the programmer’s responsibility not to call this function with a value of k that is less than 10000, to avoid
possible incorrect results.
Intel Guide for Developing Multithreaded Applications | Programming Tools
24 Copyright © 2010 Intel Corporation. All rights reserved. *Other names and brands may be claimed as the property of others.
Usage Guidelines
Try building the computationally intensive kernel of your application with the -parallel (Linux or Mac OS X) or -Qparal-
lel (Windows) compiler switch. Enable reporting with -par-report3 (Linux) or -Qpar-report3 (Windows) to find out
which loops were parallelized and which loops could not be parallelized. For the latter, try to remove data dependencies and/
or help the compiler disambiguate potentially aliased memory references. Compiling at -O3 enables additional high-level loop
optimizations (such as loop fusion) that may sometimes help autoparallelization. Such additional optimizations are reported in
the compiler optimization report generated with -opt-report-phase hlo. Always measure performance with and without
parallelization to verify that a useful speedup is being achieved. If -openmp and -parallel are both specified on the same
command line, the compiler will only attempt to parallelize those loops that do not contain OpenMP directives. For builds with
separate compiling and linking steps, be sure to link the OpenMP runtime library when using automatic parallelization. The
easiest way to do this is to use the compiler driver for linking, by means, for example, of icl -Qparallel (Windows) or ifort
-parallel (Linux or Mac OS X). On Mac OS X systems, you may need to set the DYLD_LIBRARY_PATH environment vari-
able within Xcode to ensure that the OpenMP dynamic library is found at runtime.
Additional Resources
Intel® Software Network Parallel Programming Community
“Optimizing Applications/Using Parallelism: Automatic Parallelization” in the Intel® C++ Compiler User and Reference Guides or The Intel® Fortran Compiler User and Reference Guides
Efficient Exploitation of Parallelism on Pentium® III and Pentium® 4 Processor-Based Systems
An Overview of the Parallelization Implementation Methods in Intel® Parallel Composer

Intel Guide for Developing Multithreaded Applications | Programming Tools
25 Copyright © 2010 Intel Corporation. All rights reserved. *Other names and brands may be claimed as the property of others.
4.2 – Parallelism in the Intel® Math Kernel
Abstract
Software libraries provide a simple way to get immediate performance benefits on multicore, multiprocessor, and cluster
computing systems. The Intel® Math Kernel Library (Intel® MKL) contains a large collection of functions that can benefit
math-intensive applications. This chapter will describe how Intel MKL can help programmers achieve superb serial and parallel
performance in common application areas. This material is applicable to IA-32 and Intel® 64 processors on Windows*, Linux*,
and Mac OS* X operating systems.
Background
Optimal performance on modern multicore and multiprocessor systems is typically attained only when opportunities for paral-
lelism are well exploited and the memory characteristics underlying the architecture are expertly managed. Sequential codes
must rely heavily on instruction and register level SIMD parallelism and cache blocking to achieve best performance. Threaded
programs must employ advanced blocking strategies to ensure that multiple cores and processors are efficiently used and the
parallel tasks evenly distributed. In some instances, out-of-core implementations can be used to deal with large problems that
do not fit in memory.
Advice
One of the easiest ways to add parallelism to a math-intensive application is to use a threaded, optimized library. Not only will
this save the programmer a substantial amount of development time, it will also reduce the amount of test and evaluation ef-
fort required. Standardized APIs also help to make the resulting code more portable.
Intel MKL provides a comprehensive set of math functions that are optimized and threaded to exploit all the features of the
latest Intel® processors. The first time a function from the library is called, a runtime check is performed to identify the hard-
ware on which the program is running. Based on this check, a code path is chosen to maximize use of instruction- and-register
level SIMD parallelism and to choose the best cache-blocking strategy. Intel MKL is also designed to be threadsafe, which
means that its functions operate correctly when simultaneously called from multiple application threads.
Intel MKL is built using the Intel® C++ and Fortran Compilers and threaded using OpenMP*. Its algorithms are constructed to
balance data and tasks for efficient use of multiple cores and processors. The following table shows the math domains that
contain threaded functions (this information is based on Intel MKL 10.2 Update 3):

Intel Guide for Developing Multithreaded Applications | Programming Tools
26 Copyright © 2010 Intel Corporation. All rights reserved. *Other names and brands may be claimed as the property of others.
Because there is some overhead involved in the creation and management of threads, it is not always worthwhile to use mul-
tiple threads. Consequently, Intel MKL does not create threads for small problems. The size that is considered small is relative
to the domain and function. For level 3 BLAS functions, threading may occur for a dimension as small as 20, whereas level 1
BLAS and VML functions will not thread for vectors much smaller than 1000.
Intel MKL should run on a single thread when called from a threaded region of an application to avoid over-subscription of sys-
tem resources. For applications that are threaded using OpenMP, this should happen automatically. If other means are used to
thread the application, Intel MKL behavior should be set using the controls described below. In cases where the library is used
sequentially from multiple threads, Intel MKL may have functionality that can be helpful. As an example, the Vector Statistical
Library (VSL) provides a set of vectorized random number generators that are not threaded, but which offer a means of divid-
ing a stream of random numbers among application threads. The SkipAheadStream() function divides a random number
stream into separate blocks, one for each thread. The LeapFrogStream() function will divide a stream so that each
thread gets a subsequence of the original stream. For example, to divide a stream between two threads, the Leapfrog method
would provide numbers with odd indices to one thread and even indices to the other.
Performance
Figure 1 provides an example of the kind of performance a user could expect from DGEMM, the double precision, general
matrix-matrix multiply function included in Intel MKL. This BLAS function plays an important role in the performance of many
applications. The graph shows the performance in Gflops for a variety of rectangular sizes. It demonstrates how performance
scales across processors (speedups of up to 1.9x on two threads, 3.8x on four threads, and 7.9x on eight threads), as well as
achieving nearly 94.3% of peak performance at 96.5 Gflops.

Intel Guide for Developing Multithreaded Applications | Programming Tools
27 Copyright © 2010 Intel Corporation. All rights reserved. *Other names and brands may be claimed as the property of others.
Figure 1. Performance and scalability of the BLAS matrix-matrix multiply function.
Usage Guidelines
Since Intel MKL is threaded using OpenMP, its behavior can be affected by OpenMP controls. For added control over threading
behavior, Intel MKL provides a number of service functions that mirror the OpenMP controls. These functions allow the user to
control the number of threads the library uses, either as a whole or per domain (i.e., separate controls for BLAS, LAPACK, etc.).
One application of these independent controls is the ability to allow nested parallelism. For example, behavior of an application
threaded using OpenMP could be set using the OMP_NUM_THREADS environment variable or omp_set_num_threads() func-
tion, while Intel MKL threading behavior was set independently using the Intel MKL specific controls: MKL_NUM_THREADS or
mkl_set_num_threads() as appropriate. Finally, for those who must always run Intel MKL functions on a single thread, a
sequential library is provided that is free of all dependencies on the threading runtime.
Intel® Hyper-Threading Technology is most effective when each thread performs different types of operations and there are
under-utilized resources on the processor. However, Intel MKL fits neither of these criteria, because the threaded portions of
the library execute at high efficiency using most of the available resources and perform identical operations on each thread.
Because of that, Intel MKL will by default use only as many threads as there are physical cores.
Additional Resources
Intel® Software Network Parallel Programming Community
Intel® Math Kernel Library
Netlib: Information about BLAS, LAPACK, and ScaLAPACK

Intel Guide for Developing Multithreaded Applications | Programming Tools
28 Copyright © 2010 Intel Corporation. All rights reserved. *Other names and brands may be claimed as the property of others.
4.3 – Threading and Intel® Integrated Performance Primitives
Abstract
There is no universal threading solution that works for all applications. Likewise, there are multiple ways for applications built
with Intel® Integrated Performance Primitives (Intel® IPP) to utilize multiple threads of execution. Threading can be imple-
mented at the low primitive level (within the Intel IPP library) or at the high operating system level. This chapter will describe
some of the ways in which an application that utilizes Intel IPP can safely and successfully take advantage of multiple threads
of execution.
Background
Intel IPP is a collection of highly optimized functions for digital media and data-processing applications. The library includes
optimized functions for frequently used fundamental algorithms found in a variety of domains, including signal processing, im-
age, audio, and video encode/decode, data compression, string processing, and encryption. The library takes advantage of the
extensive SIMD (single instruction multiple data) and SSE (streaming SIMD extensions) instruction sets and multiple hardware
execution threads available in modern Intel® processors. Many of the SSE instructions found in today’s processors are modeled
after those on DSPs (digital signal processors) and are ideal for optimizing algorithms that operate on arrays and vectors of
data.
The Intel IPP library is available for applications built for the Windows*, Linux*, Mac OS* X, QNX*, and VxWorks* operating
systems. It is compatible with the Intel® C and Fortran Compilers, the Microsoft Visual Studio* C/C++ compilers, and the gcc
compilers included with most Linux distributions. The library has been validated for use with multiple generations of Intel and
compatible AMD processors, including the Intel® Core™ and Intel® Atom™ processors. Both 32-bit and 64-bit operating systems
and architectures are supported.
Introduction
The Intel IPP library has been constructed to accommodate a variety of approaches to multithreading. The library is thread-
safe by design, meaning that the library functions can be safely called from multiple threads within a single application. Ad-
ditionally, variants of the library are provided with multithreading built in, by way of the Intel OpenMP* library, giving you an
immediate performance boost without requiring that your application be rewritten as a multithreaded application.
The Intel IPP primitives (the low-level functions that comprise the base Intel IPP library) are a collection of algorithmic ele-
ments designed to operate repetitively on data vectors and arrays, an ideal condition for the implementation of multithreaded
applications. The primitives are independent of the underlying operating system; they do not utilize locks, semaphores,
or global variables, and they rely only on the standard C library memory allocation routines (malloc/realloc/calloc/free) for
temporary and state memory storage. To further reduce dependency on external system functions, you can use the i_malloc
interface to substitute your own memory allocation routines for the standard C routines.
In addition to the low-level algorithmic primitives, the Intel IPP library includes a collection of industry-standard, high-level
applications and tools that implement image, media and speech codecs (encoders and decoders), data compression libraries,

Intel Guide for Developing Multithreaded Applications | Programming Tools
29 Copyright © 2010 Intel Corporation. All rights reserved. *Other names and brands may be claimed as the property of others.
string processing functions, and cryptography tools. Many of these high-level tools use multiple threads to divide the work
between two or more hardware threads.
Even within a singled-threaded application, the Intel IPP library provides a significant performance boost by providing easy
access to SIMD instructions (MMX, SSE, etc.) through a set of functions designed to meet the needs of numerically intensive
algorithms.
Figure 1 shows relative average performance improvements measured for the various Intel IPP product domains, as compared
to the equivalent functions implemented without the aid of MMX/SSE instructions. Actual performance improvement will vary.
Figure 1. Relative performance improvements for various Intel® IPP product domains.
System configuration: Intel® Xeon® Quad-Core Processor, 2.8GHz, 2GB using Windows* XP and the Intel IPP 6.0 library
Advice
The simplest and quickest way to take advantage of multiple hardware threads with the Intel IPP library is to use a multi-
threaded variant of the library or to incorporate one of the many threaded sample applications provided with the library. This
requires no significant code rework and can provide additional performance improvements beyond those that result simply
from the use of Intel IPP.
Three fundamental variants of the library are delivered (as of version 6.1): a single-threaded static library; a multithreaded
static library; and a multithreaded dynamic library. All three variants of the library are thread-safe. The single-threaded static
library should be used in kernel-mode applications or in those cases where the use of the OpenMP library either cannot be
tolerated or is not supported (as may be the case with a real-time operating system).
Two Threading Choices: OpenMP Threading and Intel IPP
The low-level primitives within Intel IPP are basic atomic operations, which limits the amount of parallelism that can be ex-
ploited to approximately 15% of the library functions. The Intel OpenMP library has been utilized to implement this “behind the
scenes” parallelism and is enabled by default when using one of the multi-threaded variants of the library.
A complete list of the multi-threaded primitives is provided in the ThreadedFunctionsList.txt file located in the Intel IPP docu-
mentation directory.

Intel Guide for Developing Multithreaded Applications | Programming Tools
30 Copyright © 2010 Intel Corporation. All rights reserved. *Other names and brands may be claimed as the property of others.
Note: the fact that the Intel IPP library is built with the Intel C compiler and OpenMP does not require that applications must
also be built using these tools. The Intel IPP library primitives are delivered in a binary format compatible with the C compiler
for the relevant operating system (OS) platform and are ready to link with applications. Programmers can build applications
that use Intel IPP application with Intel tools or other preferred development tools.
Controlling OpenMP Threading in the Intel IPP Primitives
The default number of OpenMP threads used by the threaded Intel IPP primitives is equal to the number of hardware threads
in the system, which is determined by the number and type of CPUs present. For example, a quad-core processor that sup-
ports Intel® Hyper-Threading Technology (Intel® HT Technology) has eight hardware threads (each of four cores supports two
threads). A dual-core CPU that does not include Intel HT Technology has two hardware threads.
Two Intel IPP primitives provide universal control and status regarding OpenMP threading within the multi-threaded variants
of the Intel IPP library: ippSetNumThreads() and ippGetNumThreads(). Call ippGetNumThreads to determine the
current thread cap and use ippSetNumThreads to change the thread cap. ippSetNumThreads will not allow you to set the
thread cap beyond the number of available hardware threads. This thread cap serves as an upper bound on the number of
OpenMP software threads that can be used within a multi-threaded primitive. Some Intel IPP functions may use fewer threads
than specified by the thread cap in order to achieve their optimum parallel efficiency, but they will never use more than the
thread cap allows.
To disable OpenMP within a threaded variant of the Intel IPP library, call ippSetNumThreads(1) near the beginning of the
application, or link the application with the Intel IPP single-threaded static library.
The OpenMP library references several configuration environment variables. In particular, OMP_NUM_THREADS sets the
default number of threads (the thread cap) to be used by the OpenMP library at run time. However, the Intel IPP library will
override this setting by limiting the number of OpenMP threads used by an application to be either the number of hardware
threads in the system, as described above, or the value specified by a call to ippSetNumThreads, whichever is lower. OpenMP
applications that do not use the Intel IPP library may still be affected by the OMP_NUM_THREADS environment variable. Like-
wise, such OpenMP applications are not affected by a call to the ippSetNumThreads function within Intel IPP applications.
Nested OpenMP
If an Intel IPP application also implements multithreading using OpenMP, the threaded Intel IPP primitives the application calls
may execute as single-threaded primitives. This happens if the Intel IPP primitive is called within an OpenMP parallelized sec-
tion of code and if nested parallelization has been disabled (which is the default case) within the Intel OpenMP library.
Nesting of parallel OpenMP regions risks creating a large number of threads that effectively oversubscribe the number of
hardware threads available. Creating parallel region always incurs overhead, and the overhead associated with the nesting of
parallel OpenMP regions may outweigh the benefit. In general, OpenMP threaded applications that use the Intel IPP primitives
should disable multi-threading within the Intel IPP library either by calling ippSetNumThreads(1) or by using the single-
threaded static Intel IPP library.

Intel Guide for Developing Multithreaded Applications | Programming Tools
31 Copyright © 2010 Intel Corporation. All rights reserved. *Other names and brands may be claimed as the property of others.
Core Affinity
Some of the Intel IPP primitives in the signal-processing domain are designed to execute parallel threads that exploit a merged
L2 cache. These functions (single and double precision FFT, Div, Sqrt, etc.) need a shared cache to achieve their maximum
multi-threaded performance. In other words, the threads within these primitives should execute on cores located on a single
die with a shared cache. To ensure that this condition is met, the following OpenMP environment variable should be set before
an application using the Intel IPP library runs:
On processors with two or more cores on a single die, this condition is satisfied automatically and the environment variable
is superfluous. However, for those systems with more than two dies (e.g., a Pentium® D processor or a multi-socket mother-
board), where the cache serving each die is not shared, failing to set this OpenMP environmental variable may result in signifi-
cant performance degradation for this class of multi-threaded Intel IPP primitives.
Usage Guidelines
Threading Within an Intel IPP Application
Many multithreaded examples of applications that use the Intel IPP primitives are provided as part of the Intel IPP library.
Source code is included with all of these samples. Some of the examples implement threading at the application level, and
some use the threading built into the Intel IPP library. In most cases, the performance gain due to multithreading is substantial.
When using the primitives in a multithreaded application, disabling the Intel IPP library’s built-in threading is recommended, us-
ing any of the techniques described in the previous section. Doing so ensures that there is no competition between the built-in
threading of the library and the application’s threading mechanism, helping to avoid an oversubscription of software threads
to the available hardware threads.
Most of the library primitives emphasize operations on arrays of data, because the Intel IPP library takes advantage of the
processor’s SIMD instructions, which are well suited to vector operations. Threading is natural for operations on multiple data
elements that are largely independent. In general, the easiest way to thread with the library is by using data decomposition, or
splitting large blocks of data into smaller blocks and working on those blocks with multiple identical parallel threads of execution.
Memory and Cache Alignment
When working with large blocks of data, improperly aligned data will typically reduce throughput. The library includes a set of
memory allocation and alignment functions to address this issue. Additionally, most compilers can be configured to pad struc-
tures to ensure bus-efficient alignment of data.
Cache alignment and the spacing of data relative to cache lines is very important when implementing parallel threads. This is
especially true for parallel threads that contain constructs of looping Intel IPP primitives. If the operations of multiple parallel
threads frequently utilize coincident or shared data structures, the write operations of one thread may invalidate the cache
lines associated with the data structures of a “neighboring” thread.
Intel Guide for Developing Multithreaded Applications | Programming Tools
32 Copyright © 2010 Intel Corporation. All rights reserved. *Other names and brands may be claimed as the property of others.
When building parallel threads of identical Intel IPP operations (data decomposition), be sure to consider the relative spacing of
the decomposed data blocks being operated on by the parallel threads and the spacing of any control data structures used by
the primitives within those threads. Take especial care when the control structures hold state information that is updated on
each iteration of the Intel IPP functions. If these control structures share a cache line, an update to one control structure may
invalidate a neighboring structure.
The simplest solution is to allocate these control data structures so they occupy a multiple of the processor’s cache line size
(typically 64 bytes). Developers can also use the compiler’s align operators to insure these structures, and arrays of such
structures, always align with cache line boundaries. Any wasted bytes used to pad control structures will more than make up
for the lost bus cycles required to refresh a cache line on each iteration of the primitives.
Pipelined Processing with DMIP
In an ideal world, applications would adapt at run-time to optimize their use of the SIMD instructions available, the number of
hardware threads present, and the size of the high-speed cache. Optimum use of these three key resources might achieve
near perfect parallel operation of the application, which is the essential aim behind the DMIP library that is part of Intel IPP.
The DMIP approach to parallelization, building parallel sequences of Intel IPP primitives that are executed on cache-optimal
sized data blocks, enables application performance gains of several factors over those that operate sequentially over an entire
data set with each function call.
For example, rather than operate over an entire image, break the image into cacheable segments and perform multiple opera-
tions on each segment, while it remains in the cache. The sequence of operations is a calculation pipeline and is applied to each
tile until the entire data set is processed. Multiple pipelines running in parallel can then be built to amplify the performance.
To find out more detail about this technique, see “A Landmark in Image Processing: DMIP.”
Threaded Performance Results
Additional high-level threaded library tools included with Intel IPP offer significant performance improvements when used
in multicore environments. For example, the Intel IPP data compression library provides drop-in compatibility for the popular
ZLIB, BZIP2, GZIP and LZO lossless data-compression libraries. The Intel IPP versions of the BZIP2 and GZIP libraries take ad-
vantage of a multithreading environment by using native threads to divide large files into many multiple blocks to be com-
pressed in parallel, or by processing multiple files in separate threads. Using this technique, the GZIP library is able to achieve
as much as a 10x performance gain on a quad-core processor, when compared to equivalent single-threaded implementation
without Intel IPP.
In the area of multi-media (e.g., video and image processing), an Intel IPP version of H.264 and VC 1 decoding is able to achieve
near theoretical maximum scaling to the available hardware threads by using multiple native threads to parallelize decoding,
reconstruction, and de-blocking operations on the video frames. Executing this Intel IPP enhanced H.264 decoder on a quad-
core processor results in performance gains of between 3x and 4x for a high-definition bit stream.
Intel Guide for Developing Multithreaded Applications | Programming Tools
33 Copyright © 2010 Intel Corporation. All rights reserved. *Other names and brands may be claimed as the property of others.
Final Remarks
There is no single approach that is guaranteed to provide the best performance for all situations. The performance improve-
ments achieved through the use of threading and the Intel IPP library depend on the nature of the application (e.g., how easily
it can be threaded), the specific mix of Intel IPP primitives it can use (threaded versus non-threaded primitives, frequency of
use, etc.), and the hardware platform on which it runs (number of cores, memory bandwidth, cache size and type, etc.).
Additional Resources
Intel® Software Network Parallel Programming Community
Intel IPP Product website
Taylor, Stewart. Optimizing Applications for Multi-Core Processors: Using the Intel® Integrated Performance Primitives, Second Edition. Intel Press, 2007.
User’s Guide, Intel® Integrated Performance Primitives for Windows* OS on IA-32 Architecture, Document Number 318254-007US, March 2009. (pdf)
Reference Manual, Intel® Integrated Performance Primitives for Intel® Architecture: Deferred Mode Image Processing Library, Document Number: 319226-002US, January 2009.
Intel IPP i_malloc sample code, located in advanced-usage samples in linkage section
Wikipedia article on OpenMP*
OpenMP.org
A Landmark in Image Processing: DMIP
Intel Guide for Developing Multithreaded Applications | Programming Tools
34 Copyright © 2010 Intel Corporation. All rights reserved. *Other names and brands may be claimed as the property of others.
4.4 – Use Intel® Parallel Inspector to Find Race Conditions in OpenMP*- based Multithreaded Code
Abstract
Intel® Parallel Inspector, one of the tools within Intel® Parallel Studio, is used to debug multithreading errors in applications that
use Win32*, Intel® Threading Building Blocks (Intel® TBB) or OpenMP* threading models. Intel Parallel Inspector automatically
finds storage conflicts, deadlocks (or conditions that could lead to deadlocks), thread stalls, and more. Some specific issues as-
sociated with debugging OpenMP threaded applications will be discussed in this article. This article is part of the larger series,
“Intel Guide for Developing Multithreaded Applications,” which provides guidelines for developing efficient multithreaded ap-
plications for Intel® platforms.
Background
The OpenMP Application Program Interface (API) supports multi-platform shared-memory parallel programming in C/C++ and
Fortran on all architectures, including UNIX* and Windows* platforms. OpenMP is a portable, scalable model that gives shared-
memory parallel programmers a simple and flexible interface to develop parallel applications for platforms that range from
desktop machines to supercomputers.
Debugging threaded applications can be very complex, because debuggers change runtime performance, which can mask race
conditions. Even print statements can mask issues, because they use synchronization and operating system functions. Open-
MP adds even more complications. OpenMP inserts private variables, shared variables, and additional code that is impossible to
examine and step through without a specialized OpenMP-aware debugger.
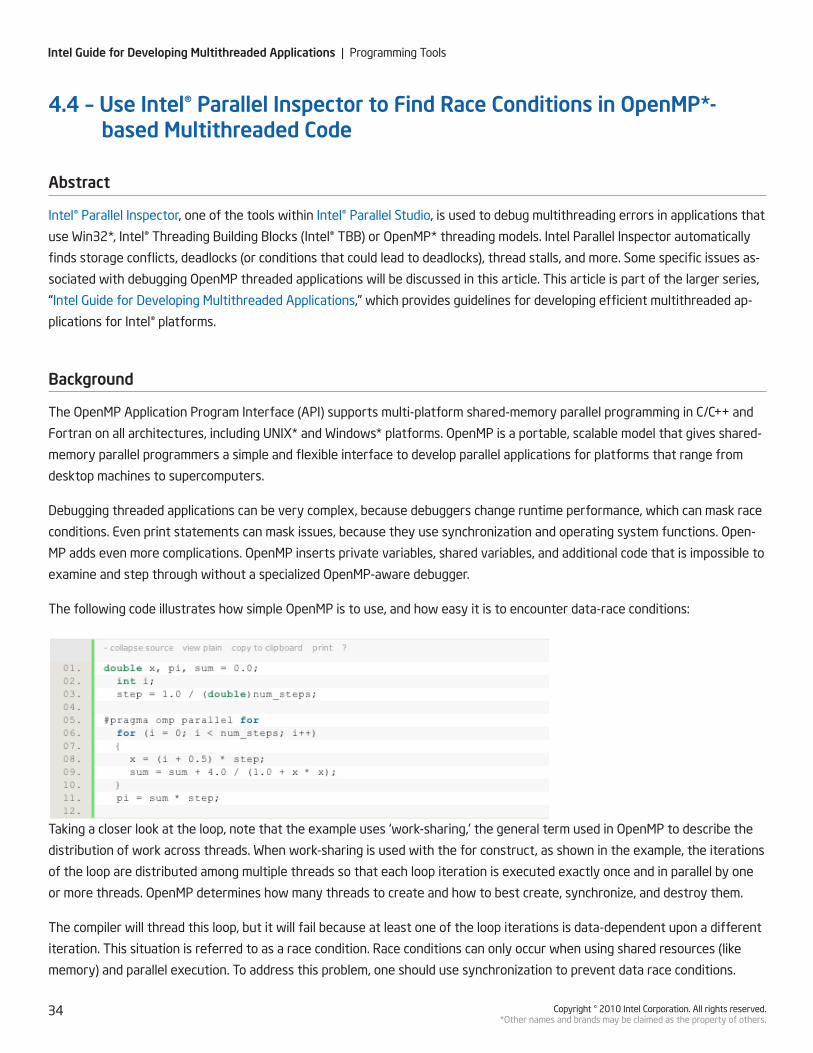
The following code illustrates how simple OpenMP is to use, and how easy it is to encounter data-race conditions:
Taking a closer look at the loop, note that the example uses ‘work-sharing,’ the general term used in OpenMP to describe the
distribution of work across threads. When work-sharing is used with the for construct, as shown in the example, the iterations
of the loop are distributed among multiple threads so that each loop iteration is executed exactly once and in parallel by one
or more threads. OpenMP determines how many threads to create and how to best create, synchronize, and destroy them.
The compiler will thread this loop, but it will fail because at least one of the loop iterations is data-dependent upon a different
iteration. This situation is referred to as a race condition. Race conditions can only occur when using shared resources (like
memory) and parallel execution. To address this problem, one should use synchronization to prevent data race conditions.

Intel Guide for Developing Multithreaded Applications | Programming Tools
35 Copyright © 2010 Intel Corporation. All rights reserved. *Other names and brands may be claimed as the property of others.
Race conditions are difficult to detect because, in a given instance, the variables might “win the race” in the order that hap-
pens to make the program function correctly. Just because a program works once doesn’t mean that it will always work.
Testing a program on various machines, some of which support Intel® Hyper-Threading Technology and some of which have
multiple physical processors, is a good starting point. Tools such as Intel Parallel Inspector can also help. Traditional debuggers
are useless for detecting race conditions, because they cause one thread to stop the “race” while the other threads continue
to significantly change the runtime behavior.
Advice
Use Intel Parallel Inspector to facilitate debugging of OpenMP, Intel TBB, and Win32 multithreaded applications. Intel Parallel
Inspector provides very valuable parallel execution information and debugging hints. Using a dynamic binary instrumentation,
Intel Parallel Inspector monitors OpenMP pragmas, Win32 threading APIs, and all memory accesses in an attempt to identify
coding errors. It is particularly useful in detecting the potential for infrequent errors that may not occur during testing. It is
important when using the tool to exercise all the code paths while accessing the least amount of memory possible, which will
speed up the data-collection process. Usually, a small change to the source code or data set is required to reduce the amount
of data processed by the application.
To prepare a program for Intel Parallel Inspector analysis, compile with optimization disabled and debugging symbols enabled.
Intel Parallel Inspector works as a plug-in for Microsoft Visual Studio*. Find the appropriate tool bar or menu command to
launch Intel Parallel Inspector and select Inspect: Threading Errors from the analysis types drop-down menu. Intel Parallel
Inspector provides four levels of analysis, depending on the desired depth and expected overhead. The tool will launch the ap-
plication compiled in the current Microsoft Visual Studio project.
In Figure 1, Intel Parallel Inspector identifies the data race errors against the source line where x variable is modified, as well
as the next source line with supping up the partial sums for each iteration. These errors are quite evident, as the globally
defined variables x and sum are being accessed for read and write from the different threads. In addition, Intel Parallel Inspec-
tor produces the ‘Potential privacy infringement’ warning, which indicates that a variable allocated on the stack of the main
thread was accessed in the worker threads.
Figure 1. Problem set overview in the Intel Parallel Inspector

Intel Guide for Developing Multithreaded Applications | Programming Tools
36 Copyright © 2010 Intel Corporation. All rights reserved. *Other names and brands may be claimed as the property of others.
For further problem investigation, Intel Parallel Inspector provides detailed errors information, facilitated with function call
stacks and reach filtering tools. A quick reference to the source code helps to identify the code range where the error was
detected. The ‘Sources’ tab, shown in (Figure 2), shows the detailed twofold source code window, reflecting the different
threads’ access to the shared variables, including detailed information and the ability to navigate to native source code with a
double-click.
Figure 2. Source view in the Intel Parallel Inspector
Once the error report is obtained and the root cause is identified with the help of Intel Parallel Inspector, developers can con-
sider approaches to fixing the problems. General considerations for avoiding data race conditions in parallel OpenMP loops are
given below, along with advice about how to fix problems in the examined code.
Managing Shared and Private Data
Nearly every useful loop reads or writes memory, and it’s the programmer’s job to tell the compiler which pieces of memory
should be shared among the threads and which pieces should be kept private. When memory is identified as shared, all threads
access the exact same memory location. When memory is identified as private, however, a separate copy of the variable is
made for each thread to access in private. When the loop ends, these private copies are destroyed. By default, all variables are
shared except the loop variable, which is private. Memory can be declared as private in the following two ways.
Declare the variable inside the loop (actually inside the parallel OpenMP directive) without the static keyword. •
Specify the private clause on an OpenMP directive. •
The loop in the example above fails to function correctly because of two problems, and one of them is because the variable x
is shared, whereas it needs to be private. The following pragma expression declares the variable x as private memory, which
corrects the problem:

Intel Guide for Developing Multithreaded Applications | Programming Tools
37 Copyright © 2010 Intel Corporation. All rights reserved. *Other names and brands may be claimed as the property of others.
Critical Sections
The second reason for the failure of the example to function correctly is sharing the global variable sum between threads.
The variable sum can’t be made private for threads, as it collects all the partial sums calculated for each iteration in each
thread. The solution is to use critical sections.
A critical section protects against multiple accesses to a block of code. When a thread encounters a critical section, it only en-
ters when no other threads are in any critical section, including that one and others. The following example uses an unnamed
critical section:
Global, or unnamed, critical sections may unnecessarily impact performance, because every thread must effectively compete
for the same global critical section. For that reason, OpenMP has named critical sections. Named critical sections allow for
more fine-grained synchronization, so only the threads that need to block on a particular section will block. The following
example improves on the previous one:
With named critical sections, applications can have multiple critical sections, and threads can be in more than one critical sec-
tion at a time. It is important to remember that entering nested critical sections runs the risk of deadlock, which OpenMP does
not detect. When using multiple critical sections, be extra careful to examine those that may be concealed in subroutines.
Atomic Operations
Using critical sections is known to be performance effective until high threading contention for the protected piece of code.
When a thread needs to wait before entering a critical section, the operating system launches kernel-level synchronization
mechanisms that send the thread into sleeping mode and wakes it up when the resource is signaled. This introduces additional
overhead to program execution, which can be addressed using approaches such as atomic operations.
Atomic operations, by definition, are guaranteed not to be interrupted and are useful for statements that update a shared
memory location to avoid some race conditions. In the line of code below, the programmer has determined that it’s important
for variables to remain constant for the duration of the statement:
While execution of an individual assembly instruction is never interrupted, statements in high-level languages, such as C/C++
may translate into multiple assembly instructions, making interruption possible. In the above example, the value of a[i] has the
chance of changing between the assembly statements for reading the value, adding the variable x, and writing the value back
Intel Guide for Developing Multithreaded Applications | Programming Tools
38 Copyright © 2010 Intel Corporation. All rights reserved. *Other names and brands may be claimed as the property of others.
to memory. The following OpenMP construct ensures that the statement will be executed atomically without possibility of
interruption:
OpenMP selects the most efficient method to implement the statement, given operating system features and hardware
capabilities. However, atomic operations can be one of the simple basic operations like increment/decrement or multiply/divide
combined with assign operator and incorporating only two expressions in the operation. This will make unusable atomic opera-
tions for protecting the sum variable in the example.
Reductions
Loops that accumulate a value are fairly common, and OpenMP has a specific clause to accommodate them. Consider a loop
that calculates the sum of partial sums of doubles. The variable sum must be shared to generate the correct result, but it also
must be private to permit access by multiple threads. To solve this case, OpenMP provides the reduction clause that is used
to efficiently combine the mathematical reduction of one or more variables in a loop. The following loop uses the reduction
clause to generate the correct results.
Under the hood, OpenMP provides private copies of the variable sum for each thread, and when the threads exit, it adds the
values together and places the result in the one global copy of the variable.
Usage Guidelines
Intel Parallel Inspector supports OpenMP, the Win32 threading API, and the Intel TBB threading API. Intel® Compilers are
required for OpenMP support. It is possible to use Microsoft’s OpenMP implementation, however, the Intel OpenMP run-time
libraries should be linked to the project in the compatibility mode. For better support and most detailed analysis consider using
the latest OpenMP run-time libraries available from Intel Compilers.
Note that the Intel Parallel Inspector performs dynamic analysis, not static analysis. Intel Parallel Inspector only analyzes code
that is executed. Therefore, multiple analyses exercising different parts of the program may be necessary to ensure adequate
code coverage.

Intel Guide for Developing Multithreaded Applications | Programming Tools
39 Copyright © 2010 Intel Corporation. All rights reserved. *Other names and brands may be claimed as the property of others.
Intel Parallel Inspector instrumentation increases the CPU and memory requirements of an application, so choosing a small but
representative test problem is very important. Workloads with runtimes of a few seconds are best. Workloads do not have to
be realistic; they simply must exercise the relevant sections of multithreaded code.
Additional Resources
Intel® Software Network Parallel Programming Community
Intel® Parallel Inspector
OpenMP* Specifications
Getting Started With OpenMP

Intel Guide for Developing Multithreaded Applications | Programming Tools
40 Copyright © 2010 Intel Corporation. All rights reserved. *Other names and brands may be claimed as the property of others.
4.5 – Curing Thread Imbalance Using Intel® Parallel Amplifier
Abstract
One of the performance-inhibiting factors in threaded applications is load imbalance. Balancing the workload among threads
is critical to application performance. The key objective for load balancing is to minimize idle time on threads and share the
workload equally across all threads with minimal work sharing overheads. Intel® Parallel Amplifier, an Intel® Parallel Studio
product, assists in fine-tuning parallel applications for optimal performance on multicore processors. Intel Parallel Amplifier
makes it simple to quickly find multicore performance bottlenecks and can help developers speed up the process of identifying
and fixing such problems. Achieving perfect load balance is non-trivial and depends on the parallelism within the application,
workload, and the threading implementation.
Background
Generally speaking, mapping or scheduling of independent tasks (loads) to threads can happen in two ways: static and dy-
namic. When all tasks are the same length, a simple static division of tasks among available threads, dividing the total number
of tasks into equal-sized groups assigned to each thread, is the best solution. Alternately, when the lengths of individual tasks
differ, dynamic assignment of tasks to threads yields a better solution.
Concurrency analysis provided by Intel Parallel Amplifier measures how the application utilizes the available cores on a given
system. During the analysis, Parallel Amplifier collects and provides information on how many threads are active, meaning
threads which are either running or queued and are not waiting at a defined waiting or blocking API. The number of running
threads corresponds to the concurrency level of an application. By comparing the concurrency level with the number of pro-
cessors, Intel Parallel Amplifier classifies how the application utilizes the processors in the system.
To demonstrate how Intel Parallel Amplifier can identify hotspots and load imbalance issues, a sample program written in C is
used here. This program computes the potential energy of a system of particles based on the distance in three dimensions.
This is a multithreaded application that uses native Win32* threads and creates the number of threads specified by the NUM_
THREADS variable. The scope of this discussion does not include the introduction of Win32 threads, threading methodologies,
or how to introduce threads. Rather, it demonstrates how Intel Parallel Amplifier can significantly help identify load imbalance
and help in the development of scalable parallel applications.
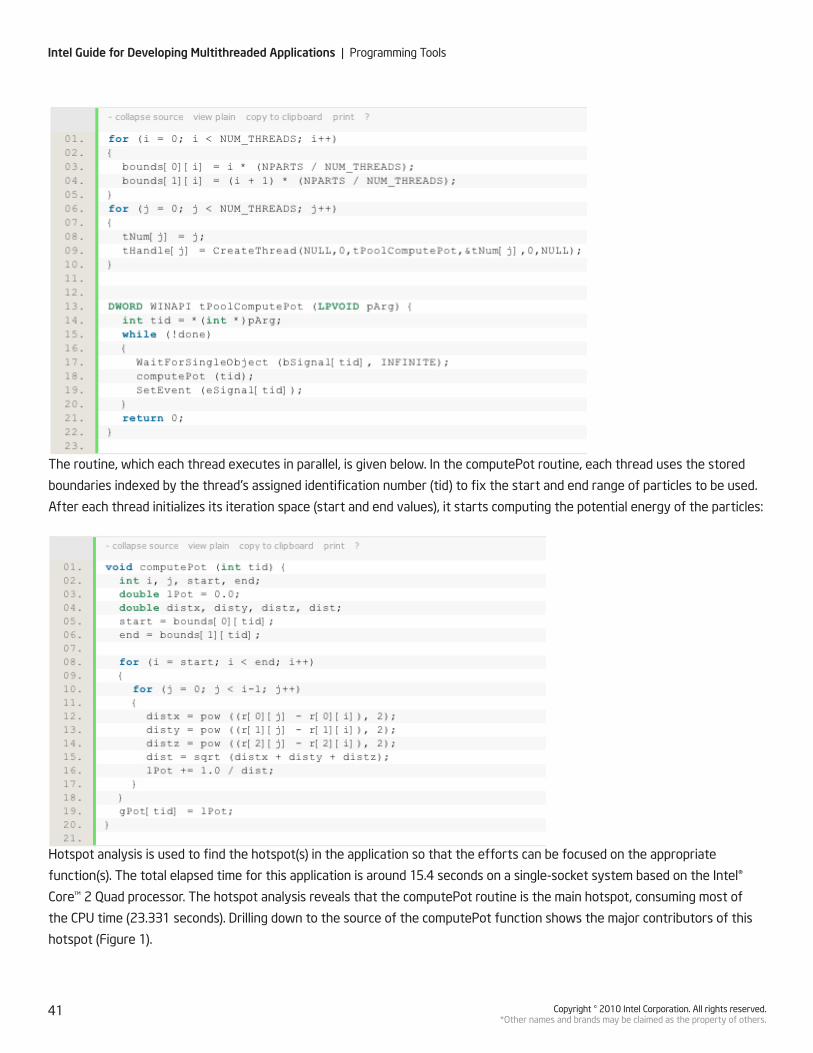
Intel Guide for Developing Multithreaded Applications | Programming Tools
41 Copyright © 2010 Intel Corporation. All rights reserved. *Other names and brands may be claimed as the property of others.
The routine, which each thread executes in parallel, is given below. In the computePot routine, each thread uses the stored
boundaries indexed by the thread’s assigned identification number (tid) to fix the start and end range of particles to be used.
After each thread initializes its iteration space (start and end values), it starts computing the potential energy of the particles:
Hotspot analysis is used to find the hotspot(s) in the application so that the efforts can be focused on the appropriate
function(s). The total elapsed time for this application is around 15.4 seconds on a single-socket system based on the Intel®
Core™ 2 Quad processor. The hotspot analysis reveals that the computePot routine is the main hotspot, consuming most of
the CPU time (23.331 seconds). Drilling down to the source of the computePot function shows the major contributors of this
hotspot (Figure 1).

Intel Guide for Developing Multithreaded Applications | Programming Tools
42 Copyright © 2010 Intel Corporation. All rights reserved. *Other names and brands may be claimed as the property of others.
Figure 1. Source code view of the hotspot analysis.
The concurrency analysis reveals that the CPU utilization on the same routine is poor (Figure 2) and the application uses 2.28
cores on average (Figure 3). The main hotspot is not utilizing all available cores; the CPU utilization is either poor (utilizing only
one core) or OK (utilizing two to three cores) most of the time. The next question is whether there are any load imbalances
that are contributing to the poor CPU utilization. The easiest way to find the answer is to select either Function-Thread-Bot-
tom-up Tree or Thread-Function-Bottom-up Tree as the new granularity, as shown in Figure 4.
Figure 2. Concurrency analysis results.
Figure 3. Summary view of the concurrency results.

Intel Guide for Developing Multithreaded Applications | Programming Tools
43 Copyright © 2010 Intel Corporation. All rights reserved. *Other names and brands may be claimed as the property of others.
The time values in the concurrency analysis results correspond to the following utilization types:
Figure 4. Concurrency analysis results showing Function->Thread grouping.
It is clear from Figure 4 that four worker threads executing this routine in parallel are not doing the same amount of work
and thus contributing to the load imbalance and poor CPU utilization. Such behavior will prevent any multi-threaded applica-
tion from scaling properly. A closer look at the source code reveals that the outer loop within the main routine statically
divides up the particle iterations based on the number of worker threads that will be created within the thread pool (start
= bounds[0][tid], end = bound[1][tid]). The inner loop within this routine uses the outer index as the exit condition.
Thus, the larger the particle number used in the outer loop, the more iterations of the inner loop will be executed. This is done
so that each pair of particles contributes only once to the potential energy calculation. This static distribution clearly assigns
different amounts of computation.
One way to fix this load imbalance issue is to use a more dynamic assignment of particles to threads. For example, rather than
assigning consecutive groups of particles, as in the original version, each thread, starting with the particle indexed by the
thread id (tid), can compute all particles whose particle number differs from the number of threads. For example, when using
two threads, one thread handles the even-numbered particles, while the other thread handles the odd-numbered particles.

Intel Guide for Developing Multithreaded Applications | Programming Tools
44 Copyright © 2010 Intel Corporation. All rights reserved. *Other names and brands may be claimed as the property of others.
Analyzing the concurrency of the application after this change shows that the hotspot function is now fully utilizing all the
cores available (Figure 5).
Figure 5. Concurrency analysis results after the change.
The summary pane (Figure 6) provides a quick review of the result and the effect of the change. Elapsed time dropped to ~9.0
seconds from ~15.4 seconds, and the average CPU utilization increased to 3.9 from 2.28. Simply enabling worker threads to
perform equal amounts of computation enabled a 1.7x speedup, reducing the elapsed time by ~41.5%.
Figure 6. Summary view of the load-balanced version.
As can be seen from the summary and concurrency results, the new version of the application utilizes almost all of the
available cores and both the serial code segments (poor utilization) and underutilization segments have disappeared.
Advice
There are various threading methods, and each method provides a different mechanism for handling the distribution of tasks
to the threads. Some common threading methods include the following:
Explicit or native threading methods (e.g., Win32 and POSIX* threads) •
Threading Abstraction •
Intel® Threading Building Blocks •
OpenM • P*
Explicit threading methods (e.g., Win32 and POSIX threads) do not have any means to automatically schedule a set of
independent tasks to threads. When needed, such capability must be programmed into the application. Static scheduling of
tasks is a straightforward exercise, as shown in this example. For dynamic scheduling, two related methods are easily

Intel Guide for Developing Multithreaded Applications | Programming Tools
45 Copyright © 2010 Intel Corporation. All rights reserved. *Other names and brands may be claimed as the property of others.
implemented: Producer/Consumer and Manager/Worker. In the former, one or more threads (Producer) place tasks into a
queue, while the Consumer threads remove tasks to be processed, as needed. While not strictly necessary, the Producer/
Consumer model is often used when there is some pre-processing to be done before tasks are made available to Consumer
threads. In the Manager/Worker model, Worker threads rendezvous with the Manager thread, whenever more work is needed,
to receive assignments directly.
Whatever model is used, consideration must be given to using the correct number and mix of threads to ensure that threads
tasked to perform the required computations are not left idle. While a single Manager thread is easy to code and ensures
proper distribution of tasks, should Consumer threads stand idle at times, a reduction in the number of Consumers or an
additional Producer thread may be needed. The appropriate solution will depend on algorithmic considerations as well as the
number and length of tasks to be assigned.
OpenMP provides four scheduling methods for iterative work-sharing constructs (see the OpenMP specification for a detailed
description of each method). Static scheduling of iterations is used by default. When the amount of work per iteration varies
and the pattern is unpredictable, dynamic scheduling of iterations can better balance the workload.
A microarchitectural issue called false sharing may arise when dynamic scheduling is used. False sharing is a performance-
degrading pattern-access problem. False sharing happens when two or more threads repeatedly write to the same cache line
(64 bytes on Intel architectures). Special care should be given when workloads are dynamically distributing among threads.
Intel® Threading Building Blocks (Intel® TBB) is a runtime-based parallel programming model, consisting of a template-based
runtime library to help developers harness the latent performance of multicore processors. Intel TBB allows developers to
write scalable applications that take advantage of concurrent collections and parallel algorithms. It provides a divide-and-con-
quer scheduling algorithm with a work-stealing mechanism so that the developers do not have to worry about various
scheduling algorithms. By leveraging the work-stealing mechanism, Intel TBB balances tasks among worker threads dynami-
cally.
Additional Resources
Intel® Software Network Parallel Programming Community
Intel® Parallel Studio
OpenMP* Specifications
Intel® Threading Building Blocks
Intel Threading Building Blocks for Open Source
James Reinders, Intel Threading Building Blocks: Outfitting C++ for Multi-core Processor Parallelism. O’Reilly Media, Inc. Sebastopol, CA, 2007.

Intel Guide for Developing Multithreaded Applications | Programming Tools
46 Copyright © 2010 Intel Corporation. All rights reserved. *Other names and brands may be claimed as the property of others.
4.6 – Getting Code Ready for Parallel Execution with Intel® Parallel Composer
Abstract
Developers have the choice among a number of approaches for introducing parallelism into their code. This article provides an
overview of the methods available in Intel® Parallel Composer, along with a comparison of their key benefits. While Intel Paral-
lel Composer covers development in C/C++ on Windows* only, many of the methods also apply (with the suitable compiler) to
development in Fortran and/or on Linux*.
Background
While the Intel® Compilers have some ways of automatically detecting and optimizing suitable code constructs for parallel exe-
cution (e.g., vectorization and auto/parallelization), most of the methods require code modifications. The pragmas or functions
inserted rely on runtime libraries that actually perform the decomposition and schedule execution of the parallel threads, such
as OpenMP*, Intel® Threading Building Blocks (Intel® TBB), and the Win32* API. The main difference among the approaches is
the level of control they provide over execution details; in general, the more control provided, the more intrusive the required
code changes are.
Parallelization using OpenMP*
OpenMP is an industry standard for portable multi-threaded application development. The Intel® C++ Compiler supports the
OpenMP C/C++ version 3.0 API specification available at the OpenMP web site (http://www.openmp.org). Parallelism with
OpenMP is controllable by the user through the use of OpenMP directives. This approach is effective at fine-grain (loop-level)
and large-grain (function-level) threading. OpenMP directives provide an easy and powerful way to convert serial applica-
tions into parallel applications, enabling potentially big performance gains from parallel execution on multi-core systems. The
directives are enabled with the /Qopenmp compiler option and will be ignored without the compiler option. This characteristic
allows building both the serial and parallel versions of the application from the same source code. For shared memory parallel
computers, it also allows for simple comparisons between serial and parallel runs.
The following table shows commonly used OpenMP* directives:

Intel Guide for Developing Multithreaded Applications | Programming Tools
47 Copyright © 2010 Intel Corporation. All rights reserved. *Other names and brands may be claimed as the property of others.
Example 1:
The /Qopenmp-report[n] compiler option, where n is a number between 0 and 2, can be used to control the OpenmMP
parallelizer’s level of diagnostic messages. Use of this option requires the programmer to specify the /Qopenmp option. If n is
not specified, the default is /Qopenmp-report1 which displays diagnostic messages indicating loops, regions, and sections
successfully parallelized.
Because only directives are inserted into the code, it is possible to make incremental code changes. The ability to make incre-
mental code changes helps programmers maintain serial consistency. When the code is run on one processor, it gives the same
result as the unmodified source code. OpenMP is a single source code solution that supports multiple platforms and operating
systems. There is also no need to determine the number of cores, because the OpenMP runtime chooses the right number
automatically.
OpenMP version 3.0 contains a new task-level parallelism construct that simplifies parallelizing functions, in addition to the
loop-level parallelism for which OpenMP is most commonly used. The tasking model allows parallelizing programs with irregular
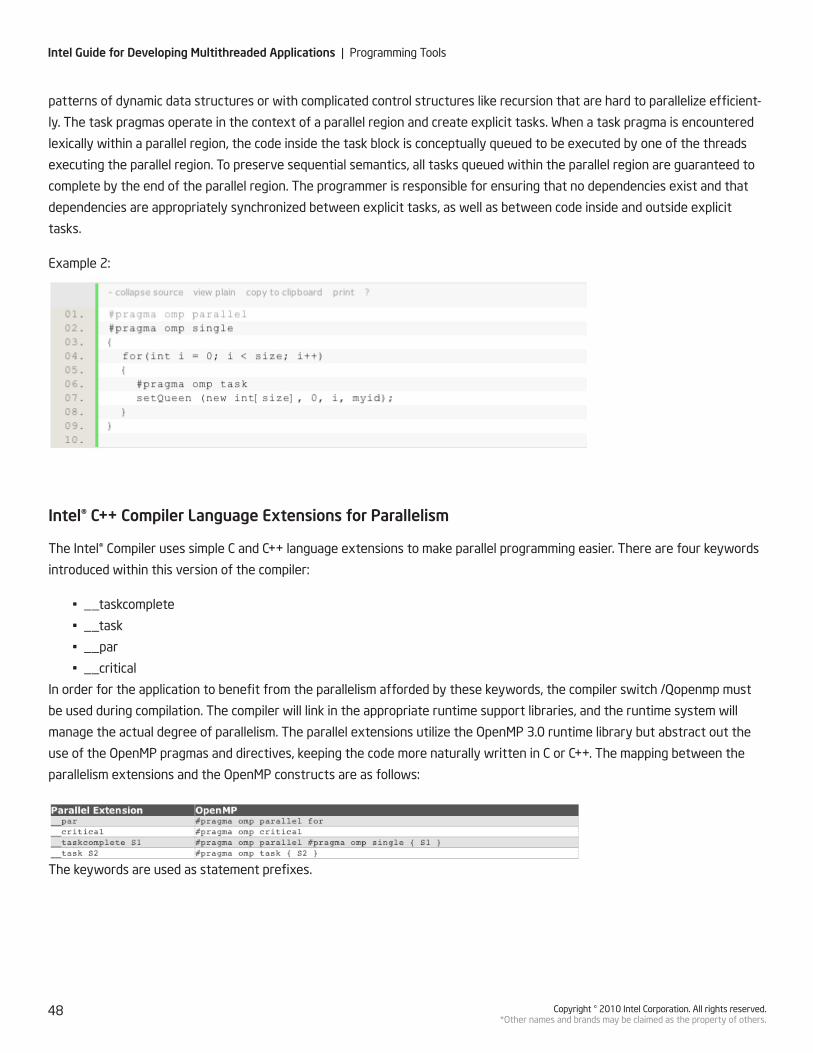
Intel Guide for Developing Multithreaded Applications | Programming Tools
48 Copyright © 2010 Intel Corporation. All rights reserved. *Other names and brands may be claimed as the property of others.
patterns of dynamic data structures or with complicated control structures like recursion that are hard to parallelize efficient-
ly. The task pragmas operate in the context of a parallel region and create explicit tasks. When a task pragma is encountered
lexically within a parallel region, the code inside the task block is conceptually queued to be executed by one of the threads
executing the parallel region. To preserve sequential semantics, all tasks queued within the parallel region are guaranteed to
complete by the end of the parallel region. The programmer is responsible for ensuring that no dependencies exist and that
dependencies are appropriately synchronized between explicit tasks, as well as between code inside and outside explicit
tasks.
Example 2:
Intel® C++ Compiler Language Extensions for Parallelism
The Intel® Compiler uses simple C and C++ language extensions to make parallel programming easier. There are four keywords
introduced within this version of the compiler:
__taskcomplete •
__task •
__par •
__critical •
In order for the application to benefit from the parallelism afforded by these keywords, the compiler switch /Qopenmp must
be used during compilation. The compiler will link in the appropriate runtime support libraries, and the runtime system will
manage the actual degree of parallelism. The parallel extensions utilize the OpenMP 3.0 runtime library but abstract out the
use of the OpenMP pragmas and directives, keeping the code more naturally written in C or C++. The mapping between the
parallelism extensions and the OpenMP constructs are as follows:
The keywords are used as statement prefixes.
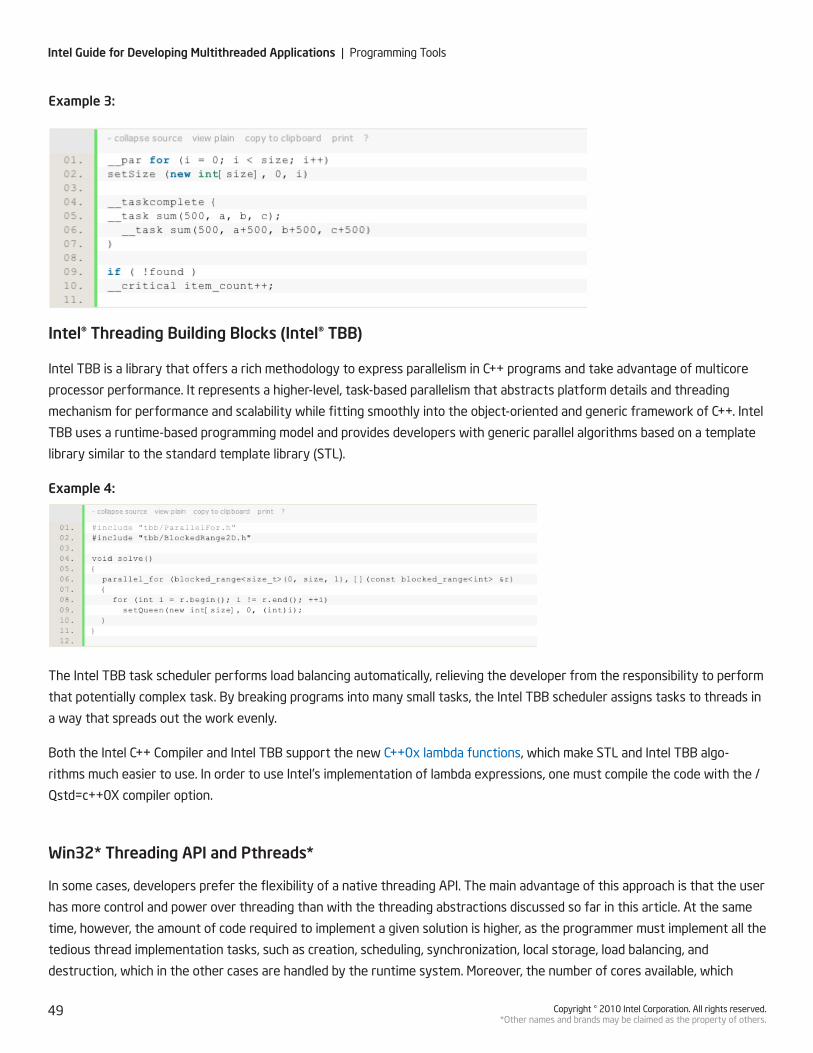
Intel Guide for Developing Multithreaded Applications | Programming Tools
49 Copyright © 2010 Intel Corporation. All rights reserved. *Other names and brands may be claimed as the property of others.
Example 3:
Intel® Threading Building Blocks (Intel® TBB)
Intel TBB is a library that offers a rich methodology to express parallelism in C++ programs and take advantage of multicore
processor performance. It represents a higher-level, task-based parallelism that abstracts platform details and threading
mechanism for performance and scalability while fitting smoothly into the object-oriented and generic framework of C++. Intel
TBB uses a runtime-based programming model and provides developers with generic parallel algorithms based on a template
library similar to the standard template library (STL).
Example 4:
The Intel TBB task scheduler performs load balancing automatically, relieving the developer from the responsibility to perform
that potentially complex task. By breaking programs into many small tasks, the Intel TBB scheduler assigns tasks to threads in
a way that spreads out the work evenly.
Both the Intel C++ Compiler and Intel TBB support the new C++0x lambda functions, which make STL and Intel TBB algo-
rithms much easier to use. In order to use Intel’s implementation of lambda expressions, one must compile the code with the /
Qstd=c++0X compiler option.
Win32* Threading API and Pthreads*
In some cases, developers prefer the flexibility of a native threading API. The main advantage of this approach is that the user
has more control and power over threading than with the threading abstractions discussed so far in this article. At the same
time, however, the amount of code required to implement a given solution is higher, as the programmer must implement all the
tedious thread implementation tasks, such as creation, scheduling, synchronization, local storage, load balancing, and
destruction, which in the other cases are handled by the runtime system. Moreover, the number of cores available, which
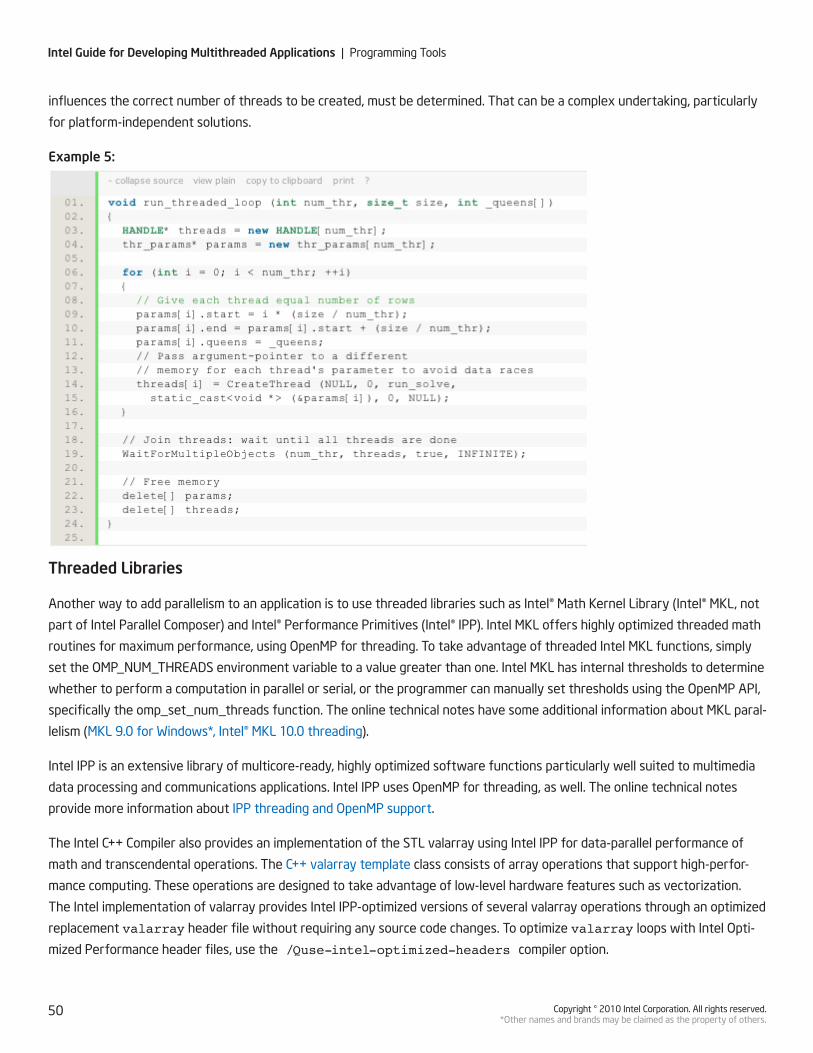
Intel Guide for Developing Multithreaded Applications | Programming Tools
50 Copyright © 2010 Intel Corporation. All rights reserved. *Other names and brands may be claimed as the property of others.
influences the correct number of threads to be created, must be determined. That can be a complex undertaking, particularly
for platform-independent solutions.
Example 5:
Threaded Libraries
Another way to add parallelism to an application is to use threaded libraries such as Intel® Math Kernel Library (Intel® MKL, not
part of Intel Parallel Composer) and Intel® Performance Primitives (Intel® IPP). Intel MKL offers highly optimized threaded math
routines for maximum performance, using OpenMP for threading. To take advantage of threaded Intel MKL functions, simply
set the OMP_NUM_THREADS environment variable to a value greater than one. Intel MKL has internal thresholds to determine
whether to perform a computation in parallel or serial, or the programmer can manually set thresholds using the OpenMP API,
specifically the omp_set_num_threads function. The online technical notes have some additional information about MKL paral-
lelism (MKL 9.0 for Windows*, Intel® MKL 10.0 threading).
Intel IPP is an extensive library of multicore-ready, highly optimized software functions particularly well suited to multimedia
data processing and communications applications. Intel IPP uses OpenMP for threading, as well. The online technical notes
provide more information about IPP threading and OpenMP support.
The Intel C++ Compiler also provides an implementation of the STL valarray using Intel IPP for data-parallel performance of
math and transcendental operations. The C++ valarray template class consists of array operations that support high-perfor-
mance computing. These operations are designed to take advantage of low-level hardware features such as vectorization.
The Intel implementation of valarray provides Intel IPP-optimized versions of several valarray operations through an optimized
replacement valarray header file without requiring any source code changes. To optimize valarray loops with Intel Opti-
mized Performance header files, use the /Quse-intel-optimized-headers compiler option.

Intel Guide for Developing Multithreaded Applications | Programming Tools
51 Copyright © 2010 Intel Corporation. All rights reserved. *Other names and brands may be claimed as the property of others.
Auto-Parallelization
Auto-parallelization is a feature of the Intel C++ Compiler. In auto-parallelization mode, the compiler automatically detects
parallelism inherent in the program. The auto-parallelizer analyzes the dataflow of the loops in the application source code and
generates multithreaded code for those loops which can safely and efficiently be executed in parallel. If data dependencies
are present, loop restructuring may be needed for the loops to be auto-parallelized.
In auto-parallelization mode, all parallelization decisions are made by the compiler, and the developer does not have any con-
trol over which loops are to be parallelized. Auto-parallelization can be combined with OpenMP to achieve higher performance.
When combining OpenMP and auto-parallelization, OpenMP will be used to parallelize loops containing OpenMP directives and
auto-parallelization will be used to parallelize non-OpenMP loops. Auto-parallelization is enabled with the /Qparallel compiler
option.
Example 6:
By default, the auto-parallelizer reports which loops were successfully auto-parallelized. Using the /Qpar-report[n] option,
where n is a number between 0 and 3, the auto-parallelizer can report diagnostic information about auto-parallelized loops
and those that did not get auto-parallelized. For example, /Qpar-report3 tells the auto-parallelizer to report diagnostics
messages for loops successfully and unsuccessfully auto-parallelized plus information about any proven or assumed depen-
dencies inhibiting auto-parallelization. The diagnostics information helps restructure loops to be auto-parallelized.
Auto-Vectorization
Vectorization is the technique used to optimize loop performance on Intel® processors. Parallelism defined by vectorization
technique is based on vector-level parallelism (VLP) made possible by the processor’s SIMD hardware. The auto-vectorizer in
the Intel C++ Compiler automatically detects low-level operations in the program that can be performed in parallel and then
converts the sequential code to process 1-, 2-, 4-, 8-, or up to 16-byte data elements in one operation with extensions up
to 32- and 64-byte in the future processors. Loops need to be independent for the compiler to auto vectorize them. Auto-
vectorization can be used in conjunction with the other thread-level parallelization techniques such as auto-parallelization
and OpenMP discussed earlier. Most floating-point applications and some integer applications can benefit from vectorization.
The default vectorization level is /arch:SSE2 which generates code for Intel® Streaming SIMD Extensions 2 (Intel® SSE2). To
enable auto-vectorization for other than the default target, use the /arch (e.g., /arch:SSE4.1) or /Qx (e.g., /QxSSE4.2,
QxHost) compiler options.

Intel Guide for Developing Multithreaded Applications | Programming Tools
52 Copyright © 2010 Intel Corporation. All rights reserved. *Other names and brands may be claimed as the property of others.
The figure below shows the serial execution of the loop iterations on the left without vectorization, where the lower parts
of the SIMD registers are not utilized. The vectorized version on the right shows four elements of the A and B arrays added in
parallel for each iteration of the loop, utilizing the full width of the SIMD registers.
Figure 1. Loop iterations with and without vectorization.
Example 7:
By default, the vectorizer reports which loops got vectorized. Using the /Qvec-report[n] option, where n is a number be-
tween 0 and 5, the vectorizer can report diagnostic information about vectorized and non-vectorized loops. For example, the /
Qvec-report5 option tells the vectorizer to report on non-vectorized loops and the reason why they were not vectorized. The
diagnostics information helps restructure the loops to be vectorized.
Advice/Usage Guidelines
Tradeoffs Between Different Methods
Various parallelism methods can be categorized in terms of abstraction, control, and simplicity. Intel TBB and the API models
do not require specific compiler support, but OpenMP does. The use of OpenMP requires the use of a compiler that recognizes
OpenMP directives. The API-based models require the programmer to manually map concurrent tasks to threads. There is no
explicit parent-child relationship between the threads; all threads are peers. These models give the programmer control over
all low-level aspects of thread creation, management, and synchronization. This flexibility is the key advantage of library-
based threading methods. The tradeoff is that to obtain this flexibility, significant code modifications and a lot more coding are
required. Concurrent tasks must be encapsulated in functions that can be mapped to threads. The other drawback is that most
threading APIs use arcane calling conventions and only accept one argument. Thus, it is often necessary to modify function
prototypes and data structures that may break the abstraction of the program design, which fits better in a C approach than
an Object-oriented C++ one.
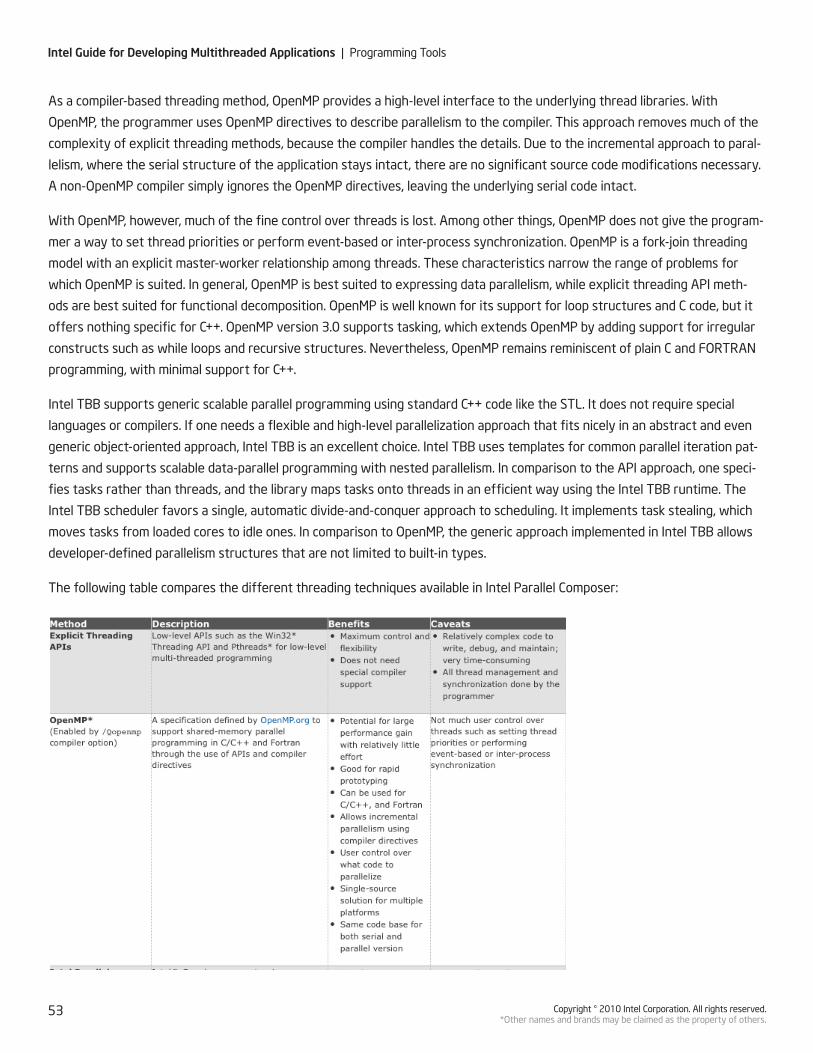
Intel Guide for Developing Multithreaded Applications | Programming Tools
53 Copyright © 2010 Intel Corporation. All rights reserved. *Other names and brands may be claimed as the property of others.
As a compiler-based threading method, OpenMP provides a high-level interface to the underlying thread libraries. With
OpenMP, the programmer uses OpenMP directives to describe parallelism to the compiler. This approach removes much of the
complexity of explicit threading methods, because the compiler handles the details. Due to the incremental approach to paral-
lelism, where the serial structure of the application stays intact, there are no significant source code modifications necessary.
A non-OpenMP compiler simply ignores the OpenMP directives, leaving the underlying serial code intact.
With OpenMP, however, much of the fine control over threads is lost. Among other things, OpenMP does not give the program-
mer a way to set thread priorities or perform event-based or inter-process synchronization. OpenMP is a fork-join threading
model with an explicit master-worker relationship among threads. These characteristics narrow the range of problems for
which OpenMP is suited. In general, OpenMP is best suited to expressing data parallelism, while explicit threading API meth-
ods are best suited for functional decomposition. OpenMP is well known for its support for loop structures and C code, but it
offers nothing specific for C++. OpenMP version 3.0 supports tasking, which extends OpenMP by adding support for irregular
constructs such as while loops and recursive structures. Nevertheless, OpenMP remains reminiscent of plain C and FORTRAN
programming, with minimal support for C++.
Intel TBB supports generic scalable parallel programming using standard C++ code like the STL. It does not require special
languages or compilers. If one needs a flexible and high-level parallelization approach that fits nicely in an abstract and even
generic object-oriented approach, Intel TBB is an excellent choice. Intel TBB uses templates for common parallel iteration pat-
terns and supports scalable data-parallel programming with nested parallelism. In comparison to the API approach, one speci-
fies tasks rather than threads, and the library maps tasks onto threads in an efficient way using the Intel TBB runtime. The
Intel TBB scheduler favors a single, automatic divide-and-conquer approach to scheduling. It implements task stealing, which
moves tasks from loaded cores to idle ones. In comparison to OpenMP, the generic approach implemented in Intel TBB allows
developer-defined parallelism structures that are not limited to built-in types.
The following table compares the different threading techniques available in Intel Parallel Composer:

Intel Guide for Developing Multithreaded Applications | Programming Tools
54 Copyright © 2010 Intel Corporation. All rights reserved. *Other names and brands may be claimed as the property of others.
The article, “Solve the N-Queens problem in parallel,” provides hands-on training about applying each of the parallelizatio
techniques discussed in this document to implement a parallel solution to the N-Queens problem, a more general version of
the Eight Queens Puzzle. Additional examples are provided in the “Samples” folder under the Intel® C++ Compiler installation
folder.
Additional Resources
Intel® Software Network Parallel Programming Community
General information on Intel Compilers, documentation, White Papers, Knowledge Base
The Software Optimization Cookbook (2nd Edition) High performance Recipes for the Intel Architecture
Intel Software Network Forums
Additional information on OpenMP, including the complete specification and list of directives
Intel® Threading Building Blocks
Intel Threading Building Blocks for Open Source
James Reinders, Intel Threading Building Blocks: Outfitting C++ for Multi-core Processor Parallelism. O’Reilly Media, Inc. Sebas-topol, CA, 2007.
Intel® C++ Compiler Optimization Guide
Quick Reference Guide to optimization with the Intel Compilers

Intel Guide for Developing Multithreaded Applications | Programming Tools
55 Copyright © 2010 Intel Corporation. All rights reserved. *Other names and brands may be claimed as the property of others.
Authors and Editors
The following Intel engineers and technical experts contributed to writing, reviewing and editing the Intel® Guide for Developing Multithreaded Applications: Henry Gabb, Martyn Corden, Todd Rosenquist, Paul Fischer, Julia Fedorova, Clay Breshears, Thomas Zipplies, Vladimir Tsymbal, Levent Akyil, Anton Pegushin, Alexey Kukanov, Paul Petersen, Mike Voss, Aaron Tersteeg and Jay Hoeflinger.
Learn more about developer tools and resources at Intel® Software Development Products
Brought to you by Intel® Software Dispatch Delivering the latest tools, techniques, and best practices for leading-edge software
infrastructure, platform software, and developer resources.