integrity, good governance and development
TRANSCRIPT

Text
INTEGRITY, GOOD GOVERNANCE AND DEVELOPMENTRonald U. Mendoza, PhD

Text
500
1000
1500
2000
2500
3000
1960
1962
1964
1966
1968
1970
1972
1974
1976
1978
1980
1982
1984
1986
1988
1990
1992
1994
1996
1998
2000
2002
2004
2006
2008
2010
2012
2014
2016
Tradeliberalizationandimportsubstitution
Exportpromotion
Economicexpansionandprivatizationofstate-ownedenterprise
Postponementofliberalizationonsomesectorsand
increasingprotectionism
Debt– drivengrowth
Expansionofservicesectoranddeclinein
manufacturingRapideconomic
growth
Garcia Macapagal Marcos C.Aquino RamosEstrada
ArroyoAquino
Duterte
GROWING THE ECONOMIC PIE

TextMONOPOLY + DISCRETION – ACCOUNTABIILITY = CORRUPTION

Text
4
Total price tag: US$1.88 billionTotal output: zero kilowatts

Text
• THINDYNASTY • FATDYNASTY
POST-MARCOS ERA:
RISE OF MINI-DICTATORSHIPS?

TextOutside Imperial Manila: Provinces becoming more dynastic over time?
Dynastic Share across Provinces (2007 – 2016 Elections)
0
10
20
30
40
50
60
70
80
DYNSHARE2007 DYNSHARE2010 DYNSHARE2013 DYNSHARE2016
Source: Ateneo School of Government Local Government Leadership Database.

TextTextDinagat Islands is dominated by Ecleo Clan, 2016 Election
ECLEO,10
VARGAS,3ABIS,2
ELUDO,2
FERMILAN,2
LLAMERA,2
LONGOS,2
LUIB,2
VILLAROSA,2
Distributionofdynastiesbasedonnumberofelectedclanmembers
Source:Authors’calculationsbasedondatadevelopedbyMendozaetal(2012;2016).

Text Snapshot of Inequality – Ecleo Castle and fishing village in Dinagat Islands

Text
Violent political competition in Masbate. Four Congressmen assassinated between
1989 and 2005.
Meanwhile, 1 in 2 Filipinos in Masbate live below the poverty line…
RIZALINA SEACHON-LANETEgovernor and dynasty matriarch
ANTONIO KHOformer congressman and dynasty patriarch
53.5666 56.3266 51.3231
0.00
14.25
28.50
42.75
57.00
71.25
2006 2009 2012
Povertyincidence(%
of
popu
latio
n)
DATA SOURCE: PHILIPPINE STATISTICAL AUTHORITYPHOTO SOURCE: ABS-CBN NEWS ONLINE

TextAverage Dynastic Share (2007 – 2016 Elections)
Position Dynastic share (in %) 2007 2010 2013 2016
Governor 69.6 82.3 86.3 81.3 Percentage increase/decrease 12.7 3.97 -5 Vice Governor 62 70.9 75 81 Percentage increase/decrease 8.87 4.11 6.01 Representative 75.3 78.7 75.3 77.5 Percentage increase/decrease 3.44 -3.46 2.25 Mayor 57.6 67.2 67.5 68.8 Percentage increase/decrease 9.6 0.3 1.3 Vice Mayor 40.6 51.2 52.6 56.9 Percentage increase/decrease 10.6 1.4 4.3
81% of Governors. 78% of Congressmen. 69% of Mayors. 57% of Vice Mayors.

TextPolitical Dynasties Lead To Deeper Poverty
Mendoza, Beja, Venida and Yap (2016) examine the link between poverty and dynasties, using a comprehensive database of political dynasties in Philippine local government covering 2000-2013;
Finds empirical evidence that more dynasties cause greater poverty, notably outside of Metro Manila.
TextPolitical Dynasties Lead To Deeper Poverty
"PoliticalDynastiesandPoverty:IllustrationofMeasurementand
InitialEvidenceofLinkagesinthePhilippines"OxfordDevelopmentStudies 44(2):189-201.
Mendoza,Beja,Venida andYap(2016)examinethelinkbetween
povertyanddynasties,usingacomprehensivedatabaseof
politicaldynastiesinPhilippinelocalgovernmentcovering2000-
2013;
CONCLUSION: More fat dynasties cause greater poverty, notably outside of Metro Manila.

FEDERALISM AND POLITICAL DYNASTIESThe discussion focuses on three proposed Federal States and potential dynamics, including challenges, that may arise upon transition to Federalism.
The State of Central Visayas
Political dynasty prevalence5 provinces from two regions will merge into one state
Third highest concentration of private armies
A combination of highly developed and least developed provinces
The State of Northern Luzon
Political dynasty prevalence15 provinces will merge into one state
Second largest concentration of private armies
Relatively better socio-economic development measures
The State of Bangsamoro
Political dynasty prevalence
Highest concentration of private armies and conflict
Lowest socio-economic development among its provinces
The proposed state is based from an existing entity (ARMM)
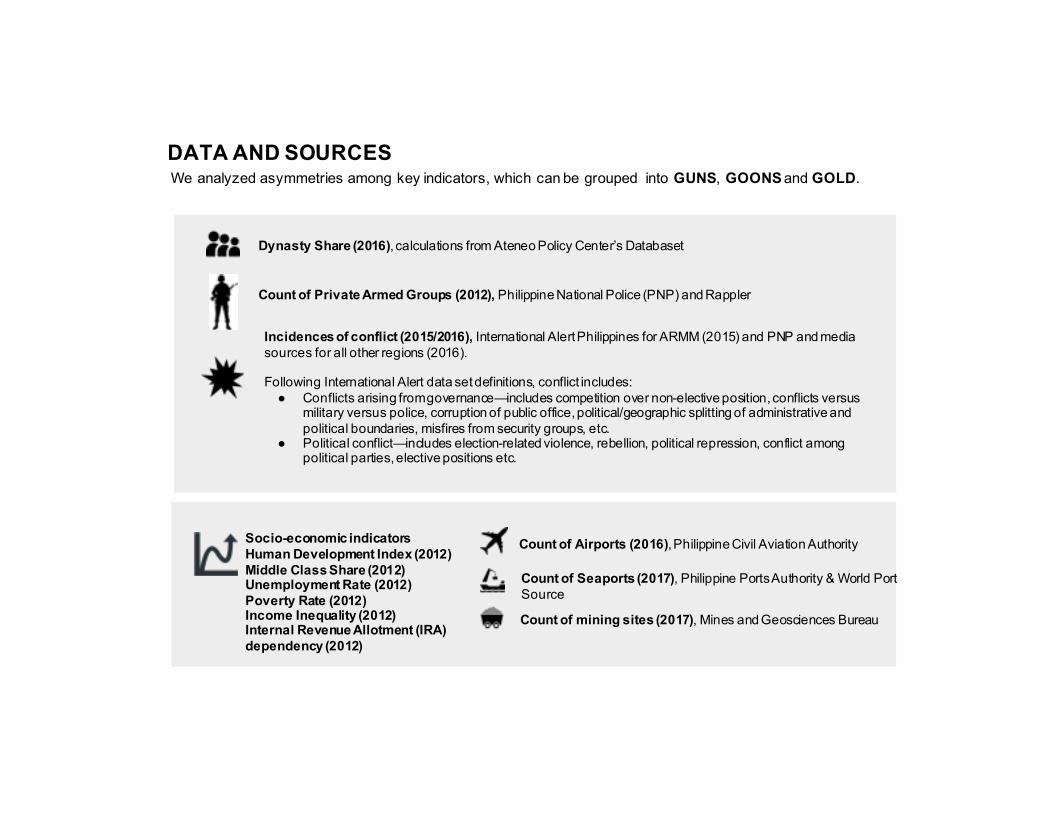
DATA AND SOURCESWe analyzed asymmetries among key indicators, which can be grouped into GUNS, GOONS and GOLD.
Dynasty Share (2016), calculations from Ateneo Policy Center’s Databaset
Count of Private Armed Groups (2012), Philippine National Police (PNP) and Rappler
Incidences of conflict (2015/2016), International Alert Philippines for ARMM (2015) and PNP and media sources for all other regions (2016).
Following International Alert data set definitions, conflict includes:● Conflicts arising from governance—includes competition over non-elective position, conflicts versus
military versus police, corruption of public office, political/geographic splitting of administrative and political boundaries, misfires from security groups, etc.
● Political conflict—includes election-related violence, rebellion, political repression, conflict among political parties, elective positions etc.
Count of Airports (2016), Philippine Civil Aviation Authority
Count of Seaports (2017), Philippine Ports Authority & World Port Source
Count of mining sites (2017), Mines and Geosciences Bureau
Socio-economic indicatorsHuman Development Index (2012)Middle Class Share (2012)Unemployment Rate (2012)Poverty Rate (2012)Income Inequality (2012)Internal Revenue Allotment (IRA) dependency (2012)

PROPOSED STATE OF BANGSAMOROSummary versus Other Proposed States: The proposed state of Bangsamoro is an agglomeration of the most dynastic, underdeveloped, and conflict-laden provinces.
Source: Philippine Statistics Authority, Philippine National Police, Ateneo Policy Center

PROPOSED STATE OF BANGSAMORO: SUMMARY Summary Table: The most dynastic provinces Maguindanao, Sulu, and Lanao del Sur also have relatively lower human development, higher poverty rates and severely IRA dependent.
Dynasty Shares: All provinces are dynastic, with higher shares than national average (50%).
Human Development: All provinces have poor HDI - lower than national average (0.644).
Unemployment: Unemployment is relatively low in Maguindanao, Sulu and higher in Lanao del Sur and Basilan compared to national average (5.7%).
Poverty: Except for Tawi-Tawi, poverty rate is very high compared to national average (25.2%).
Income Inequality: Low compared to national average (0.506).
IRA dependency: High IRA dependency except across all, except Basilan.
Legend: Each column (variable) is ranked from key watch-out (red) to least key watch-out (green).Sources: COMELEC, government and International Alert data (see sources slide).

PROPOSED STATE OF BANGSAMORO: POLITICAL DYNASTIESDynasty Shares, Families, and Incidences of Conflict: Most conflicts are rebellion-related and linked to law-enforcement. Some of the prominent clans, like the Mangudadatu of Maguindanao occupy the highest positions in the province.
61.5%
4
11(5 rebellion-related; 5 law enforcement)
20
69.1%
91(76 rebellion-related,13 law enforcements)
32(26 rebellion-related;3 political/elected pos related)
6
57.7%
Lanao del SurTotal Posts: 278Top Dynastic families (10% of total posts):
Balindong (7)Mindalano (5)Sarip (5)Abdul (4)Abdullah (4)Adiong (4)
BasilanTotal Posts: 149Top Dynastic families (14%):
Ismael (5)Akbar (4)Hataman (4)Kallahal (4)Sali (4)
SuluTotal Posts: 209 Top Dynastic families (16%):
Tan (7)Anni (5)Burahan (5)Daud (4)Arbison (4)Tingkahan (4)Tulawie (4)
Tawi-TawiTotal Posts: 114Top Dynastic families (17%):
Ahaja (4)Matba (3)Joe (3)Omar (3)Salih(3)
MaguindanaoTotal Posts: 382Top Dynastic families (20% of total posts):
Ampatuan (19)Mangudadatu (13)Midtimbang (12) Sinsuat (12)Sangki (10)Montawal (7)Kali(5)
Dynastic Shares 2016
67.5%
7
7
43(all rebellion-related)
53.5%
Legend: Dynastic families are marked red if they occupy key positions in government: provincial governor/vice governor, regional governor/vice, regional leg assembly, regional vice governor, representativeSources: Ateneo Policy Center, Philippine National Police and International Alert data (see sources slide).

PROPOSED STATE OF BANGSAMORO: GUNS & GOONSDynasty Shares, Armed Groups, and Conflict: All provinces have dynasty shares that exceed national average (50%) and infiltrated by various private armed groups.
61.5%
4
11
20
69.1%9132
6
57.7%
Lanao del Sur
Basilan
Sulu
Tawi-Tawi
Maguindanao
Dynastic Shares 2016
67.5%
7
7
53.5%
43
Source: Philippine National Police, Ateneo Policy Center, International Alert Philippines

PROPOSED STATE OF BANGSAMORO: GOLD Dynasties and development: Lanao del Sur province hosts the proposed capital and has the largest seaport and airport. This is also the province with the biggest private armies, the most dynastic jurisdiction, and has one of the highest poverty rates in the country.
Composition Old ARMM provinces (5)
Dynastic Share Hghly Dynastic (average of 61.9% versus 50% national average)
Private Armies High Concentration and High Spread (all 45 armies in all 5 provinces)
Conflict Highest number of provinces with conflict
Resources/Economy Highly dependent on IRA, mostly gray economy, no mining activity, two ports
Development Lowest human development across provinces; lowest GDP per capita
61.5%
4
11 1
220
69.1%
1
9132
6
57.7%1
1
Lanao del SurHDI: 21.7%Middle Class Share: 2.2% (-1.13)Unemployment: 8.3%Poverty Rate: 67.3%Income Inequality: 33.0%IRA dependency: 96.4
BasilanHDI: 41.9%Middle Class Share: 1.2% (-1.18)Unemployment: 5.4%Poverty Rate: 32.1%Income Inequality: 64.0%IRA dependency: 64.03%
SuluHDI: 30.3%Middle Class Share: 0.9% (+0.71)Unemployment: 1.3%Poverty Rate: 40.2%Income Inequality: 22.0%IRA dependency: 93.3%
Tawi-TawiHDI: 40.3%Poverty Rate: 21.9%
MaguindanaoHDI: 30.9%Middle Class Share: 1.9% (+0.51)Unemployment: 1.5%Poverty Rate: 54.5%Income Inequality: 36.9%IRA dependency: 94.5%
Dynastic Shares 2016
67.5%
7
7
53.5%
43
Sources: COMELEC, government and InternationalAlert data (see sources slide).
Proposed Capital: Marawi City

PROPOSED STATE OF NORTHERN LUZON: SUMMARYSummary Table: This state combines the most dynastic and least dynastic provinces but with varying patterns when it comes to socioeconomic indicators. Key watch-out would be private armies and conflict in highly dynastic provinces.
Dynasty Shares: Nine out of the 15 provinces have higher dynasty shares than national average (50%). However, this region also hosts the least dynastic provinces in the country—Mt. Province and Benguet.Human Development: The provinces generally have lower human development with only 4 regions matching or exceeding the national average (0.644).Unemployment: Generally lower unemployment is noteworthy in this region (5.7%). Poverty: Average poverty rate is lower than national average (25.2). Apayao, Ifugao, Mountain Province, and the highly dynastic province of Abra have poverty rates exceeding national average.Income Inequality: Highest income inequality seen in Batanes, Apayao, and Kalinga.IRA dependency: Higher IRA dependency noted in the regions with lesser dynastic shares except Mountain Province.
Legend: Each column (variable) is ranked from key watch-out (red) to least key watch-out (green).Sources: COMELEC, government data and media (see sources slide).

PROPOSED STATE OF NORTHERN LUZON: POLITICAL DYNASTIESDynasty Shares, Families, and Incidences of Conflict: Clan perpetuations are very evident —with as high as 10 kins of a clan elected in the province of Pangasinan, 2016.
Dynastic Shares 2016
Ilocos NorteTotal Posts: 238Top Dynastic families (12% of total posts):
Garvida (6)Sales (6)Aguinaldo (4)Farinas (4)Garcia (4)Marcos (4)
Legend: Dynastic families are marked red if they occupy key positions in government: provincial governor/vice governor, regional governor/vice, regional leg assembly, regional vice governor, representativeSources: COMELEC, government data and media (see sources slide).
IsabelaTotal Posts: 372Top Dynastic families (9% of total posts):
Dy (7)Uy (7)Talaue (5)Go(4)Guyud (4)Panganiban (4)Pascual (4)
La UnionTotal Posts: 210Top Dynastic families (11% of total posts):
Ortega (6)Concepcion (5)Fontanilla (5)Flores (4)Rimando (3)Pangasinan
Total Posts: 500Top Dynastic families (15% of total posts):
Sison (10)De Guzman (9)Perez (9)De Vera (6)Ramos (6)Caleste (5)Espino (5)Reyes (5)Soriano (5)Aquino (4)Calimlim (4)Fernandez(4)Resuello(4)
CagayanTotal Posts: 308Top Dynastic families (9% of total posts):
Carag (3)Pascual (3)Vargas (3)Mamba (3)Paat (3)Ruma (3)Trinidad (3)Turingan (3)
BenguetTotal Posts: 158Top Dynastice families (8% of total posts):
Canuto (2)Carantes (2)Mayos (2)Molitas(2)Salbino (2)Willie (2)
AbraTotal Posts: 281Top Dynastic families (15% of total posts):
Barona (5)Valera (5)Balao-as (4)Bernos(4)Seares (4)Bisares (3)Biscarra (3)Baringas (3)Cardenas (3)Crisologo (3)Domingo (3)Garcia (3)
1
5
2
1
3
1

Dynastic Shares 2016
Sources: COMELEC, government data and media (see sources slide).
Cagayan
3
56.5%
Apayao
56.8%
Ilocos Norte 1
64.3%
Abra5 56.9%
Ilocos Sur
55.3%Benguet
25.3%La Union 2
60.0%
Pangasinan
1
64.6%
Nueva Vizcaya
46.6%
Batanes
Quirino
42.1%
Ifugao
42.1%Isabela
58.6% 1
Mt. Province
18.9%
Kalinga
41.9%
Dynasty Shares, Families, and Incidences of Conflict: Fifteen provinces will be combined to form the proposed State of Northern Luzon; 9 out of the 15 over-index in dynasty share versus total PH. However, this proposed state also hosts the least dynastic provinces of Benguet and Mt. Province.
PROPOSED STATE OF NORTHERN LUZON: GUNS & GOONS

2
2
Dynastic Shares 2016
Sources: COMELEC, government data and media (see sources slide).
CagayanHDI: 0.626Middle Class Share: 12.6% (-1.33)Unemployment: 2.1%Poverty Rate: 15.2%Income Inequality: 0.432IRA dependency: 87.9%3
1
56.5%
3
ApayaoHDI: 0.379Middle Class Share: 10.2% (3.69)Unemployment: 1.2%Poverty Rate: 54.7%Income Inequality: 0.463IRA dependency: 98.4%
56.8%
Ilocos NorteHDI: 0.731Middle Class Share: 23.5% (1.53)Unemployment: 8.4%Poverty Rate: 8.4%Income Inequality: 0.384IRA dependency: 73.2%
11
1
64.3%
1AbraHDI: 0.526Middle Class Share: 14.7% (-2.83)Unemployment: 7.1%Poverty Rate: 27.2%Income Inequality: 0.404IRA dependency: 66.2%
5 56.9%
1Ilocos SurHDI: 0.640Middle Class Share: 16.2% (-1.65)Unemployment: 6.7%Poverty Rate: 13.7%Income Inequality: 0.391IRA dependency: 75.2% 55.3%Benguet
HDI: 0.842Middle Class Share: 29.8% (0.73)Unemployment: 8.7%Poverty Rate: 2.8%Income Inequality: 0.402IRA dependency: 64.6%
25.3%
3
La UnionHDI: 0.687Middle Class Share: 11.1% (-5.10)Unemployment: 9.7%Poverty Rate: 15.3%Income Inequality: 0.398IRA dependency: 71.2%
2
60.0%
PangasinanHDI: 0.580Middle Class Share: 12.0% (1.43)Unemployment: 6.6%Poverty Rate: 14.9%Income Inequality: 0.417IRA dependency: 85.6%
1
64.6%
1
Nueva VizcayaHDI: 0.644Middle Class Share: 11.8% (-5.99)Unemployment: 3.2%Poverty Rate: 15.1%Income Inequality: 0.419IRA dependency: 82.4%
46.6%
2
1
BatanesHDI: 0.512Middle Class Share: 10% (-8.18)Unemployment: 0.0%Poverty Rate: 18.2%Income Inequality: 0.470IRA dependency: 70.0%
QuirinoHDI: 0.549Middle Class Share: 9.4%Unemployment: 0.0%Poverty Rate: 15.5%Income Inequality: 0.428IRA dependency: 88.0%
42.1%
IfugaoHDI: 0.488Middle Class Share: 7.6% (-0.36)Unemployment: 1.0%Poverty Rate: 36.0%Income Inequality: 0.404IRA dependency: 94.4%
42.1%IsabelaHDI: 0.587Middle Class Share: 14.1% (2.09)Unemployment: 2.8%Poverty Rate: 19.0%Income Inequality: 0.412IRA dependency: 88.0%
58.6% 1
2
Mt. ProvinceHDI: 0.473Middle Class Share: 9.9% (-0.44)Unemployment: 0.7%Poverty Rate: 27.9%Income Inequality: 0.387IRA dependency: 82.8
18.9%
KalingaHDI: 0.546Middle Class Share: 16.4% (3.60)Unemployment: 6.0%Poverty Rate: 20.9%Income Inequality: 0.452IRA dependency: 94.4%
41.9%
Proposed Capital: Tuguegarao
1
PROPOSED STATE OF NORTHERN LUZON: GOLDDynasties and development: This state combines the most dynastic and least dynastic provinces but with varying pattern when it comes to socioeconomic indicators. Notable is the distribution of mining activities in the provinces as well as the relative scarcity of seaports.

KEY TAKEAWAYS
● Merging of provinces into one state can create a power vaccuum whereby leaders of each province would vie for leadership.
● This fight for leadership is not negative per se but may not be ideal especially for states with provinces where political dynasties and armed conflicts are prevalent.
● Furthermore, there exist asymmetries within and among provinces (dynastic, non dynastic, low/high development) which pose a challenge in integration.
○ These imbalances mirror the kind of leadership in a locale.
○ For example dynastic leaders dominate the conflict-laden and underdeveloped Bangsamoro region and Masbate province in Central Visayas
● What will be the role of the Federal Government in maintaining and ensuring that dynasties with political armies will govern the newly formed state without violence?
○ Institutional effectiveness/ Stronger policing (strong-state) to deal with private armies, more punitive measures, and shadow economies?
○ Calling for abolition of private armies in exchange of certain liberties/concessions? These concessions, however, should be beneficial to the people of the state/state development.

Federalism: Is the problem the song or the singer?

For further data and research visit: http://buildinganinclusivedemocracy.org

TextPolitical Dynasties Lead To Deeper Poverty
Mendoza, Beja, Venida and Yap. 2012. “Inequality in democracy: Insights from an empirical analysis of political dynasties in the 15th Philippine Congress”. Philippine Political Science Journal 33(2):132-145.http://papers.ssrn.com/sol3/papers.cfm?abstract_id=1969605
ü70% of the 15th Philippine Congress is dynastic; and dynasties dominate all of the major political parties.üOn average, there are more dynasties in regions with higher poverty and lower human development.
üDynasties tend to be richer (higher SALNs) when one outlier is removed among present non-dynasties (MP).
ü80% of the youngest Congressmen (age 26-40) are from dynastic clans.

Text