integrative data analysis for research in … · integrative data analysis for research in...
TRANSCRIPT

1
Integrative Data Analysis for Research in Developmental Psychopathology
Eun-Young Mun1, Yang Jiao
1, 2, Minge Xie
2
1 Center of Alcohol Studies
2 Department of Statistics
Rutgers, The State University of New Jersey

2
Author Note
The project described was supported by Award Number R01 AA 019511 from the
National Institute on Alcohol Abuse and Alcoholism (NIAAA). The content is solely the
responsibility of the authors and does not necessarily represent the official views of the NIAAA
or the National Institutes of Health.
We thank Helene R. White and Anne E. Ray of the Center of Alcohol Studies, Rutgers,
The State University of New Jersey; Jimmy de la Torre and Yan Huo of the Graduate School of
Education, Rutgers, The State University of New Jersey; and David C. Atkins, David Huh, and
Mary Larimer of the Department of Psychiatry and Behavioral Sciences, University of
Washington for their contributions to Project INTEGRATE.
We also thank the following researchers who contributed their data to Project
INTEGRATE (in alphabetical order): John S. Baer, Department of Psychology, The University
of Washington, and Veterans' Affairs Puget Sound Health Care System; Nancy P. Barnett,
Center for Alcohol and Addiction Studies, Brown University; M. Dolores Cimini, University
Counseling Center, The University at Albany, State University of New York; William R. Corbin,
Department of Psychology, Arizona State University; Kim Fromme, Department of Psychology,
The University of Texas, Austin; Joseph W. LaBrie, Department of Psychology, Loyola
Marymount University; Mary E. Larimer, Department of Psychiatry and Behavioral Sciences,
The University of Washington; Matthew P. Martens, Department of Educational, School, and
Counseling Psychology, The University of Missouri; James G. Murphy, Department of
Psychology, The University of Memphis; Scott T. Walters, Department of Behavioral and
Community Health, The University of North Texas Health Science Center; Helene R. White,

3
Center of Alcohol Studies, The State University of New Jersey; and Mark D. Wood, Department
of Psychology, The University of Rhode Island.
Correspondence concerning this article should be addressed to Eun-Young Mun, Center
of Alcohol Studies, Rutgers, The State University of New Jersey, 607 Allison Road, Piscataway,
NJ 08854. E-mail: [email protected]

4
TABLE OF CONTENTS
1 CHAPTER OVERVIEW
2 UTILITIES FOR RESEARCH IN DEVELOPMENTAL PSYCHOPATHOLOGY
2.1 Etiology
2.2 Infrequently or Rarely Observed Behaviors
2.3 Screening and Diagnostic Tests
2.4 Prevention and Intervention
3 RESEARCH SYNTHESIS
3.1 Inclusion Criteria for Studies
3.2 Publication Bias and Selection Bias
3.3 Selection of Variables and Harmonization of Groups and Measures
3.4 Classical Meta-analysis Approaches
3.4.1 p value Combination
3.5 Combining 2 x 2 Tables
3.5.1 Mantel-Haenszel Method
3.5.2 Peto’s Odds Ratio
3.5.3 Data Example
3.6 Model-based Approaches
3.6.1 Fixed-effects Model
3.6.2 Random-effects Model
3.6.3 Estimators of Variance
3.6.4 Fixed-effects vs. Random-effects Model
3.6.5 Unifying Approach to Synthesize Data from Multiple Studies
3.7 Complex Research Synthesis

5
3.7.1 Multivariate Meta-analysis
3.7.2 Network Meta-analysis
3.7.3 IPD Meta-analysis and Integrative Data Analysis
3.7.4 Subgroups, Moderated Effects, and New Discoveries
4 DATA EXAMPLES
4.1 Pooled Data
4.1.1 Sample
4.1.2 Intervention Groups and Procedures
4.1.3 Measures
4.1.4 Measures: Protective Behavioral Strategies
4.1.5 Measures: Alcohol-related Problems–Neglecting Responsibilities
4.2 Outcome Analysis
4.2.1 Model-based Meta-analysis
4.2.2 Multivariate Meta-analysis
4.3 Software Programs and Packages
5 TRANSLATIONAL IMPLICATIONS OF INTEGRATIVE DATA ANALYSIS
6 FUTURE DIRECTIONS AND LIMITATIONS
7 CONCLUSIONS
8 REFERENCES

6
ABSTRACT
Researchers from many disciplines have increasingly called for changes in research
practices to be more transparent and rigorous. One of the changes prominently discussed is the
utilization of quantitative research synthesis from multiple single studies, which we broadly refer
to as integrative data analysis (IDA). The present chapter discusses how IDA can be particularly
helpful for research in developmental psychopathology. We provide a broad overview of
evidence-based quantitative approaches, covering different types of data, different analytical
models, univariate and multivariate models, and complex research synthesis methods. We
highlight the promise of utilizing individual participant-level data from multiple single studies or
networks of single studies for analyzing multiple related parameters (or multiple endpoints)
within the framework of quantitative research synthesis. We provide several data examples to
illustrate some of these methods. Through the use of innovative strategies for IDA, we can
strengthen our research practices and expand our knowledge base cumulatively.
Keywords: Research synthesis, Integrative data analysis, Meta-analysis, Multivariate meta-
analysis, Individual participant-level data

7
CHAPTER OVERVIEW
The importance of research synthesis from a body of evidence using more rigorous,
systematic, and quantitative approaches has been echoed in the field over years; yet most of the
literature reviews are narrative or qualitative in nature. It is possible to conduct two different
narrative literature reviews and to have contrasting sets of hypotheses if the reviews were not
sufficiently extensive or done selectively. Even in extensive and systematic reviews, determining
which studies are more important and relevant than others to report or discuss in detail may very
well be within the realm of subjective judgments. Iain Chalmers (2003) poignantly pointed out
missed opportunities of the past citing that, for example, cases of sudden infant death (SID)
syndrome, for babies sleeping on their fronts (tummy), could have been prevented much earlier,
had there been a rigorous, systematic and quantitative review of available evidence. He also cited
exemplary cases of the past that saved numerous lives (e.g., low doses of aspirin reducing the
risk of cardiovascular morbidity and mortality; see O’Rourke, 2007 for a historical account of
this report that appeared in the Lancet editorial in 1980). Furthermore, as the number of relevant
studies increases, it becomes much more difficult to summarize findings from multiple studies in
a narrative review.
Quantitative research synthesis can help us to draw inferences that are not afflicted with
chance findings and optimism bias, when conducted routinely and vigorously with the most up-
to-date compiled evidence. Quantitative research synthesis is aimed at quantifying the overall
effect of interest across studies and providing the uncertainty surrounding the point estimate. The
resulting summary estimate can be helpful for deciding the benefits of the effect in question if,
for example, a new treatment were brought to market. In the field of preventions and
interventions, one can examine the average effect size of existing interventions, and subsequently

8
channel efforts into more effective interventions, thus saving limited resources available in the
current, tight funding environment. The Cochran Collaborative Network (Higgins & Green, 2011)
and the Human Genome Epidemiology Network (Ioannidis et al., 2006) represent such efforts to
promote systematic reviews and to obtain efficient and reliable findings, respectively, by
utilizing large scale evidence in the medical and epidemiological genetic research fields.
In addition, recent high profile reports and discussions have fueled the need for
quantitative research synthesis. These reports pointed out that findings from single studies are
often not replicable, and are subject to publication bias and afflicted by low power and high false
discovery rates (e.g., Begley & Ellis, 2012; Ioannidis, 2005). Thus, findings from single studies
that are conducted independently, regardless of how important they may sound, may be best
interpreted with some caution and scrutiny. At the same time, data from individual studies may
be utilized more often for a large-scale research synthesis to obtain more robust evidence in the
future.
Synthesizing data across studies in a meta-analysis allows one to obtain more credible
estimates of effects than are possible from individual studies and to achieve better generalization
of how causal relationships may change over variations in study features (Shadish, Cook, &
Campbell, 2002). From a more discovery-oriented or exploratory perspective, individual single
studies are not well equipped for novel discoveries due to lack of power. By combining data
from multiple sources, we can overcome several important, inherent limitations of single studies.
In the future, single studies may serve two distinct goals: a preliminary investigation for novel
discoveries, and a component data set as part of a bigger, pooled data set, for more robust and
generalized inference.

9
The momentum toward more robust research synthesis via quantitative approaches has
been building in recent psychological research. Quantitative research synthesis from available
data—either published aggregated data (AD) in terms of effect size estimates or raw individual
participant-level data (IPD)—has prominently been discussed as one of the central strategies for
building a cumulative knowledge base. The journal Prevention Science recently published a
special issue focusing on subgroup analysis by pulling data from multiple trials or by utilizing
more advanced analytic approaches in prevention and intervention research (Supplee, Kelly,
MacKinnon, & Barofsky, 2013). In addition, Psychological Methods published a special issue
focusing on integrative data analysis (IDA) in 2009 (Curran, 2009), discussing advantages and
disadvantages of pulling raw data from multiple studies, compared to either single studies
(Curran & Hussong, 2009) or meta-analysis using AD (Cooper & Patell, 2009). Similarly,
Perspectives on Psychological Science recently published a special section on replicability
(Pashler & Wagenmakers, 2012). In this special section, the Open Science Collaboration (2012)
and other contributors have called for sharing of data and/or publishing raw data for IPD meta-
analysis to achieve better transparency and higher standards for research (e.g., Ioannidis, 2012).
The current chapter discusses quantitative methods for research synthesis. We discuss
any quantitative methods aimed at synthesizing information from multiple, independent sources
under the big IDA tent. The covered methods encompass meta-analysis using AD for different
outcomes, such as odds ratio, mean difference, or other effect size estimates; meta-analysis using
IPD; and other approaches to analyzing multiple, independent data sets. This chapter is intended
to provide a more inclusive coverage of these various quantitative approaches under the umbrella
of IDA (see Figure 1). Curran and Hussong (2009) defined IDA more specifically as “the
statistical analysis of a single data set that consists of two or more separate samples that have
10
been pooled into one,” to distinguish IDA from either AD meta-analysis or single studies and to
highlight the unique advantages and challenges associated with analyzing raw IPD. In contrast,
we include AD meta-analysis under the IDA framework because results from AD meta-analysis
can be obtained by using raw IPD (see Figures 1 and 2). In addition, the strict distinction
between AD and IPD may not be useful for the purpose of research synthesis. Because IPD is not
always available and IPD analysis can be quite challenging, analysis based on combinations of
AD and partially available IPD may provide an alternative in some situations (see Yamaguchi et
al., 2014 for a proposed method that combines these two data structures) while taking advantage
of all available data. Figure 1 shows the relationships between IDA, IPD meta-analysis, and AD
meta-analysis. Note that in the current chapter, we use the term IDA in two different ways. On
one hand, we broadly use IDA as a general evidence-based framework for research synthesis that
includes all quantitative methods. At the concrete level of analysis, on the other hand, we use
IDA interchangeably with IPD meta-analysis and contrast it against AD meta-analysis. Table 1
provides a list of several important approaches and summarizes notable characteristics and
challenges of each approach.
Despite some differences across various methods, these quantitative approaches under the
broad umbrella of IDA share many benefits identified by Curran and Hussong (2009): built-in
replication, increased statistical power, increased sample heterogeneity, increased frequencies of
low base-rate behaviors, broader psychometric assessment of constructs, extended period of
study, and increased efficiency in time and money. IDA utilizing IPD may provide an especially
good framework for facilitating new discoveries, as well as strengthening research practices, by
improving the sample analyzed and by adopting advanced, better analytical approaches that may
not have been available before. From the perspective of single studies, this approach may also

11
propel desirable changes in the way individual single studies are conducted in the future. For
example, in the field of brief motivational interventions to reduce excessive drinking and related
harm among college students, Mun and her colleagues (in press) recommended that single
studies be designed and implemented to increase overlap in measures and follow-up assessments
across trials, to reduce heterogeneity in intervention groups across trials, and to improve
transparency and documentation overall.
Figure 2 depicts various analytic approaches to research synthesis in a snapshot. First, at
the broadest level, we distinguish methods based on whether IPD is available. In the absence of
IPD, one has to rely on AD for quantitative synthesis. For the analysis of AD, one can combine
AD across studies using fixed-effects or random-effects meta-analysis models (see the Model-
based Approaches section). One can further analyze between-study variation by using meta-
regression, which can reveal study-level moderators of the effect in question. Meta-analysis
using AD tends to be larger in scale in terms of the number of studies and sample size because
collecting and analyzing AD is relatively straightforward and there is no need to establish
commensurate measures. Effect size estimates provide readily available standardized measures
in AD meta-analysis.
Meta-analysis has been on the rise in clinical research. It has had an exponential rise in
the number of publications as a publication type in PubMed and also as a method covered in an
influential journal, Statistics in Medicine, between 1990 and 2006 (Sutton & Higgins, 2008).
Similarly, between 1997 and 2012, the papers published in a flagship journal in the field of
developmental psychopathology, Development and Psychopathology, increasingly either
reported findings from a meta-analysis or utilized evidence from a meta-analysis reported
elsewhere when generating hypotheses or discussing findings (see Figure 3).

12
When IPD is available, meta-analysis using IPD can be conducted. One can closely check
and correct data, if necessary, and reanalyze data by using more suitable analytical models for
robust inference. IPD meta-analysis has long been championed and discussed as a promising
method in the field of medical research synthesis (e.g., Steinberg et al., 1997; Stewart, 1995) but
is a newly emerging approach for psychological research. IPD meta-analysis studies in
psychological research have been rare primarily because of the challenge to establish
measurement invariance across studies for valid inference. This can be a formidable challenge
particularly for psychological measures (Hussong, Curran, & Bauer, 2013). Establishing
measurement invariance can be challenging enough even when the same measure is used across
key target groups (e.g., different developmental periods or different countries; Steenkamp &
Baumgartner, 1998). It can be quite another challenge when different items or measures are used
across studies and any overlap in items and measures is tenuous. Once measurement invariance
across groups or studies is established, individuals can be placed on common metrics across
different groups or studies.
Integrated analysis can then be conducted under various advanced analytical model
frameworks (see Figure 2). IPD meta-analysis can be very attractive in the sense that it can
achieve two important goals: (1) strengthening our inference on prespecified (or confirmatory)
hypotheses and (2) giving an opportunity for serendipity, namely exploring new insights from
IPD. In relation to the second goal, subgroups or moderated relationships can be examined via
analyzing IPD (Borenstein & Higgins, 2013; Brown et al., 2013; Sutton & Higgins, 2008).
Moderated effects require large samples to detect when they truly exist. The availability of both
individual-level and study-level covariates makes it feasible to formally test these moderated
relationships.

13
Within the IDA framework, one-step analysis is probably more typical, but places a
greater burden on IDA researchers to resolve any discrepancies between studies and to deal with
missing data as pooled IPD is analyzed in a single analytical model. Alternatively, two-step
integrative analysis can proceed as follows: IDA researchers, after harmonizing data across
studies (see the Selection of Variables and Harmonization of Groups and Measures section),
develop a common analytical model and conduct separate analysis for each study included in the
pooled data set. Estimates resulting from separate analyses from the first step can then be pooled
across studies in the second integrative step (see the Outcome Analysis section for examples).
Relative to the one-step approach, this may more flexibly address design differences across
studies when analyzing the combined data. Alternatively, the two-step IDA can be conducted by
original investigators under the same analytic strategy instead of sharing original data sets with
IDA researchers (Brown et al., 2013). Brown and colleagues called this a parallel analysis
strategy. The choice of method for IPD meta-analysis may depend on several factors, including
how easily data can be shared among researchers; how similar and dissimilar studies are in
relation to research questions; the number of studies and, more generally, the dimension of the
combined data; and how resources and research credits can be shared between research teams.
IDA or IPD meta-analysis is a relatively new approach, but its applications are expected to
increase in the coming years.
The current chapter will present methods of research synthesis for the field of
developmental psychopathology, present classical and emerging meta-analysis approaches,
provide data examples, and discuss future directions.
UTILITIES FOR RESEARCH IN DEVELOPMENTAL PSYCHOPATHOLOGY

14
In a review of the past achievements of developmental psychopathology and its future
directions, Cicchetti and Toth (2009) stated that developmental psychopathology as a discipline
has long sought to transcend many existing dualisms in order to better understand the
developmental processes involved in maladaptive, as well as competent, trajectories across the
life course. In addition to breaking down the schism between normative and nonnormative
development, developmental psychopathology as a field has advocated a systems perspective
(Ford & Lerner, 1992) and a holistic approach to development (Magnusson, 2000) to better
understand complex developmental processes. The dynamic systems perspective and its tools,
when combined with better known concepts and tools for linear statistical modeling approaches,
may help to break the existing knowledge barriers in the literature.
Researchers in the field of developmental psychopathology have been early adopters of
advanced analytical methods and led debates about their utilities (e.g., Bergman & Magnusson,
1997; Sterba & Bauer, 2010). Furthermore, researchers have championed the importance of
maintaining feedforward and feedback loops between etiological discovery-oriented research and
prevention and intervention research, while emphasizing that cultural vistas may affect the
developmental processes of those living in them (Cicchetti & Toth, 2009). In essence,
developmental psychopathology is a discipline that synthesizes data either directly or indirectly
in single studies or multiple studies across multiple systems, across scales, and across time. By
doing so, developmental psychopathology transcends the typical boundaries of disciplines in
search of new insights and ideas.
We discuss ways in which methods for research synthesis can help shed new light for the
field of developmental psychopathology. Some of the application examples in the literature are
discussed to highlight the benefits of IDA, as well as the areas for improvement in the future.

15
Etiology
One of the critical challenges for research in developmental psychopathology is to
understand developmental continuity and discontinuity of an underlying problem despite
changing or different norms across age, gender, race and ethnicity, and other contexts. Focusing
on age-related patterns, specific behaviors can repeatedly be assessed using the same set of
questions across age. However, the same behavior observed at different ages may signal different
levels or forms of risk. Likewise, different behaviors observed at different ages may indicate the
same underlying trait. There are many excellent examples across different research fields. In the
field of alcohol research, for example, there is a clear age-related trend in the prevalence of
alcohol use prior to, during, and after college years (Substance Abuse and Mental Health
Services Administration, 2012), and its associated risks and consequences vary across these
distinctive developmental phases (e.g., White, Lee, Mun, & Loeber, 2012). Similarly, the legal
drinking age differs across countries (Kuntsche et al., 2013), which affects the meaning of early
onset drinking and its associations with other risky behaviors across nations.
The basic understanding of the underlying continuity and discontinuity across
developmental phases is needed for screening individuals for intervention and for a better
understanding of the etiology of alcohol problems. This issue of the continuity and discontinuity
across time has been widely noted as an important research goal in developmental
psychopathology (Sroufe & Rutter, 1984). In reality, however, this goal is difficult to achieve in
individual studies. The complexity related to age is exacerbated when we consider race and
ethnicity, as well as other situational and contextual influences. Single studies are typically
limited in terms of demographic, contextual, and other situational influences. When data from

16
multiple studies are combined, however, one can examine age-related continuity and
discontinuity across different contexts and evaluate its generalizability.
In one of the early research studies that utilized meta-analysis in developmental
psychopathology, Weiss and Garber (2003) examined developmental differences in the
manifestation of depressive symptoms by meta-analyzing core, as well as associated, symptoms
from 20 studies that varied in age, gender, and source of samples (clinical, diagnosed, normative).
A total of 29 symptoms were examined in relation to age by using Cohen’s effect size estimate d
(Cohen, 1988). They found that for the vast majority of symptoms, significant study-to-study
(i.e., between-study) heterogeneity in estimates existed, indicating that age-related patterns in
symptoms substantially differed across studies. Of the 10 symptoms that were not significantly
heterogeneous, the following five symptoms—anhedonia, hopelessness, hypersomnia, weight
gain, and social withdrawal—showed higher levels among older individuals, which supported
the notion that the specific manifestations of depressive symptoms may vary with development.
Due in part to the high percentage of study-level heterogeneity, Weiss and Garber found the
evidence inconclusive to call depression developmentally isomorphic. However, the implicit
assumption involved in the analysis under which this question was examined (i.e., a common
true effect across studies under fixed-effects models) may have been unnecessarily too strict.
Recent meta-analytic studies tend to focus on explaining between-study variation in
effect sizes rather than assuming that effect sizes are the same across all studies. In general, it is
more plausible to assume that study-specific effect sizes differ across studies, due to potential
differences in study contexts, designs, interventions, and subjects (Borenstein, Hedges, Higgins,
& Rothstein, 2009). When the results from various studies differ, one can use this as an
opportunity to investigate factors that may account for the observed heterogeneity across studies

17
by allowing study-level covariates to be included in meta-regression (see the Model-based
Approaches section). When IPD is available, the search for explanations can be done at both the
individual- and study-level.
Some studies may combine data from just a few studies. AD meta-analysis starts with an
extensive search of all eligible and available evidence. However, three-quarters of meta-analyses
indexed in the Cochrane Database of Systematic Reviews include five or fewer studies (Davey,
Turner, Clarke, & Higgins, 2011). Nonetheless, evidence from two studies is better than
evidence from one study, if all else is equal. By pooling original data from multiple sources,
even if limited in number, one can extend the period under observation and test hypotheses in a
more heterogeneous, diverse sample, which can strengthen our confidence in the derived
conclusions. These benefits may be particularly salient for IDA studies that combine data from
long-term, longitudinal studies because these studies are virtually impossible to replicate and
also because they tend to feature homogeneous samples.
For example, Hussong et al. (2007) obtained original IPD from two longitudinal studies
of children of alcoholics (COAs) and combined them to examine externalizing behavior
problems in COAs. The two longitudinal studies that were combined and harmonized were the
Michigan Longitudinal Study (MLS; Zucker et al., 2000), a community-based study of alcoholic
parents and their young biological children and comparison families within the same
neighborhoods, and the Adolescent/Adult Family Development Project (AFDP; Chassin et al.,
1991) that followed adolescent COAs and their matched controls, as well as their parents. Most
cohorts for the MLS were originally between the ages of 3 and 5 and followed up every 3 years
thereafter, with yearly assessments between the ages of 11 and 17. The AFDP project
interviewed the adolescents when they were between the ages of 11 and 15. They were followed

18
up twice when they were between the ages of 12 and16 and again between the ages of 13 and 17.
The MLS had observations covering mostly from ages 3 to 14, whereas the AFDP had
observations spanning from ages 10 to 17. When these two samples were combined, the overlap
that existed for ages 10 to 14 provided an important chain in measurement models and the basis
to test subsequent, substantive hypotheses. With the two distinctive but similar samples
combined, an observational period was stretched from ages 2 to 17 for the entire combined
sample. This pooled sample had some of the core characteristics (i.e., COAs and non-COAs) in
common, but differed in other aspects (e.g., race/ethnicity, and geographical and socioeconomic
backgrounds).
With the combined data described above, Hussong and her colleagues (2007) examined
whether (1) the number of alcoholic parents in families; (2) comorbid parental diagnoses (i.e.,
depression and antisocial personality disorder); and (3) subtypes of parental alcoholism (i.e.,
controls, depressed alcoholic type, and antisocial alcoholic type) were linked to the development
of externalizing behavior problems. They found that children in multialcoholic families were at
greater risk for externalizing symptoms that emerged by mid-adolescence. Children in comorbid
alcoholic families had a stable early risk for greater externalizing symptoms, compared to those
in noncormobid alcoholic families. These observations were internally replicated—meaning
observed in two samples—within the analytic model. Thus, in addition to lengthening an
observational window and increasing sample heterogeneity, IDA can be used to provide
opportunities for built-in, internal replications and for better-powered studies, compared to single
individual studies (Curran & Hussong, 2009; Hussong et al., 2013).
Infrequently or Rarely Observed Behaviors

19
Compiling and analyzing data from multiple, similarly designed studies can be
particularly beneficial for research in developmental psychopathology when rare behaviors are of
particular interest. In typical single studies, a low base rate behavior or atypical behavior is often
ignored—neither researched nor reported. However, when isolated or infrequent behaviors of
interest are aggregated across multiple studies, this combined information can provide a valuable
insight for developmental psychopathology. For clinical trials, it is now required to report
adverse effects as one of the basic data for the ClinicalTrials.gov site (Tse, Williams, & Zarin,
2009). Adverse effects can then be compiled across studies and used to assess the overall safety
risk of clinical interventions, as well as the efficacy.
In the field of pharmaceutical clinical trials, there has been a high profile case in recent
years, demonstrating the importance of infrequently observed behaviors and its treatment in
analysis. It involves Avandia (rosiglitazone), marketed by GlaxoSmithKline (GSK), which was
intended to improve blood sugar levels in diabetics. Nissen and Wolski (2007) compiled adverse
event data from 42 studies and concluded that the drug significantly increased the risk for
myocardial infarction (heart attacks). According to Finkelstein and Levin (2012), GSK’s stock
price dropped 7.8% on the day of the publication of the study by Nissen and Wolski. Thousands
of lawsuits were filed against GSK, and in 2010 alone, GSK had charges totaling $6.76 billion
against earnings to deal with the Avandia cases (Finkelstein & Levin, 2012). Several other
subsequent meta-analysis publications ensued that used different approaches (e.g., Tian et al.,
2009) from the one taken by Nissen and Wolski. One of the most contentious issues surrounding
this controversy involved the treatment of zero adverse observations in studies. Because the rate
of adverse outcomes was low (i.e., approximately 0.5%), it was possible not to see any adverse
outcomes in some of the small studies. In typical two-arm (i.e., treatment and control) clinical

20
trials, if adverse outcomes are not observed in both arms, it is difficult to quantify the risk, which
is mathematically undefined using well-known risk measures, such as odds ratio. Nissen and
Wolski chose to exclude data altogether from any studies with zero adverse observations and
used Peto’s method of combining odds ratios only from studies with nonzero observations
(Yusuf, Peto, Lewis, Collins, & Sleight, 1985; see the Peto’s Odds Ratio section for Peto’s
method). Subsequent investigations tackled zero adverse observations in studies by adding a
constant, by imputing data, or by using alternative methods by which risk differences could be
defined.
We can learn from this Avandia controversy that zero events can be important to report in
original studies, and that they can and should be investigated by compiling data from multiple
studies. Even if no reasonable statistical approach can be taken, zero events out of 100,000 cases
certainly carry a different meaning than zero events out of 1,000 cases. Especially in the field of
developmental psychopathology, many behaviors of interest that occur rarely have not been
studied extensively. Although rare, these behaviors are nonetheless important to better
understand because of their potentially huge impact. For example, using data from a longitudinal
project on the development of delinquency and antisocial behavior among boys, Lee and White
(2012) reported that those who experienced childhood maltreatment were more likely than those
who did not experience childhood maltreatment (defined as an officially substantiated record by
age 13) to die before the ages 27-32 and ages 34-38, respectively for two different birth cohorts.
More specifically, 7.4% of 202 maltreated men died, whereas 2.5% of 711 nonmaltreated men
died. Overall, 35 deaths were observed during the 913 person-year observation period, yielding
an average mortality rate of 3,834 deaths per 100,000 person-years (7,426 for maltreated vs.
2,813 for nonmaltreated boys). Many individuals followed-up by this project were exposed to

21
violence in childhood and adolescence and died from, or committed, homicide (see also Loeber
et al., 2005). Childhood maltreatment, for this high-risk sample, increased their risk of early
death.
As the example described above shows, rare behavioral data have the potential to provide
an important new insight in the field, yet many such behaviors have been understudied. From the
analyst’s perspective, it also makes sense to combine data from individual studies because low
base-rate, binary behaviors (such as death or maltreatment) and their associated binomial
confidence intervals can be quite erratic (Brown, Cai, & DasGupta, 2001). When data from
multiple studies are combined, the number of cases increases, although average prevalence rate
remains the same, which improve the stability of model estimation and reduce the influence of
extreme observations, thus achieving better precision.
Even when behaviors of interest may not be as rare as what was previously discussed,
many clinical outcomes of interest have generally low base rates. Behaviors with prevalence
rates of 10% to 20% are huge numbers at the population level, but can still be difficult to study in
single studies. The median and mean total sample sizes for articles published in four major
psychological journals (Journal of Abnormal Psychology, Journal of Applied Psychology,
Journal of Experimental Psychology: Human Perception and Performance, and Developmental
Psychology) in 2006 were 40 and 196, respectively (Marszalhk, Barber, Kohlhart, & Holmes,
2011). At this level of sample size, a behavior with the prevalence of 5% or less, despite highly
prevalent at the population level, would be practically impossible to examine in single small
studies. Furthermore, some of the advanced analytic approaches for nonnormally distributed data,
including Poisson or zero-inflated hurdle mixed models, tend to be more complex and
challenging and require many parameters to be estimated (Atkins, Baldwin, Zheng, Gallop, &

22
Neighbors, 2013). Thus, pooling data from multiple, similar studies and analyzing them together
for research synthesis can be particularly attractive for many clinical behaviors of interest.
Screening and Diagnostic Tests
It is important to develop screening and diagnostic tests and to derive cut-off scores that
are sensitive for detecting true cases (i.e., sensitivity) yet correctly differentiate those cases that,
in truth, do not meet the criteria (i.e., specificity). Only a small proportion of individuals
typically meet any clinical criteria by definition. Thus, one can achieve better sensitivity and
specificity estimates of a screening tool by combining multiple data sets. Both estimates—
sensitivity and specificity—are important to simultaneously consider when making informed
decisions under which a particular screening tool should be used. This is because these estimates
are typically considered in the context of the cost of administering diagnostic or screening tests,
and the consequences of missing potential cases and of falsely diagnosing noncases. In addition,
these two estimates are negatively related within studies because lowering a threshold may
enhance sensitivity but increase the likelihood that noncases are falsely identified as meeting the
cutoff. As a result, these estimates are related also across studies. Thus, one estimate (either
sensitivity or specificity) needs to be considered in the context of the other in the same analysis
when pooling data from multiple sources (Reitsma et al., 2005). Failing to do so can lead to
misleading or inaccurate conclusions.
One of the recent advances made in the meta-analysis methodological literature involves
analysis of multiple, related outcome variables (see Jackson, White, & Thompson, 2010; see the
Complex Research Synthesis section). The capacity to examine multiple related outcomes in a
meta-analysis framework is an important advance when examining comparative advantages of
various tools for diagnostic accuracy. In the field of medical research, Reitsma et al. (2005)

23
reanalyzed data reported in a univariate meta-analysis that examined a single combined measure
of sensitivity and specificity—the log of the diagnostic odds ratio (DOR; Scheidler, Hricak, Yu,
Subak, & Segal, 1997)—using a bivariate meta-analysis. Their analysis provided contextualized,
richer conclusions than the previous univariate meta-analysis of DOR (Scheidler et al., 1997).
More specifically, Scheidler et al. concluded that three screening tools—lymphangiography
(LAG), computed tomography (CT), and magnetic resonance imaging (MRI)—performed
similarly when diagnosing lymph node metastases in women with cervical cancer. They further
suggested that given the invasive nature of the LAG procedure, CT and MRI may be preferable
over LAG. When both sensitivity and specificity were jointly estimated as two related outcomes
in a bivariate meta-analysis, however, CT and MRI were found to be comparable in terms of
sensitivity but LAG was significantly more sensitive than CT (Reitsma et al., 2005). In addition,
LAG was lower in specificity compared to either CT or MRI. Thus, even though the three
screening tools could not be distinguished in terms of their overall accuracy based on a single
combined measure of sensitivity and specificity in the previous univariate meta-analysis
(Scheidler et al., 1997), this new bivariate meta-analysis approach provided useful information
about the relative accuracy of three different screening tools. Based on the results, one may
suggest that for high-risk individuals, the invasive nature of the LAG procedure be weighed less,
in favor of its better sensitivity, when making a decision about which screening tool to use. In
contrast, for non-high-risk individuals, the lower specificity of the LAG procedure, which could
lead to unnecessary anxiety, combined with its invasive nature, suggest that other procedures
may be more preferable.
As illustrated in the example of cervical cancer screening tools, there is a value in
knowing the unique estimates of both sensitivity and specificity from a clinical perspective when

24
deciding which tools to use for whom. Given the purpose of screening measures, pooling data
from independent studies can provide a needed scale and diversity in terms of both sample and
clinical tool when examining relative advantages and disadvantages. In a way, it can emulate a
multisite planned study without the enormous resource required. Similarly for etiological
research, pooled data from multiple sources can provide a better sense of how strict or lenient
one should be when deriving cutoff scores for positively meeting the diagnostic criteria, as the
recommendation based on the finding from a single homogeneous sample may not be ideal for
general populations. Screening individuals and reaching accurate diagnoses are the critical initial
steps for formulating strategies for prevention and intervention. Therefore, research synthesis
through innovative methods holds important promise for the field of developmental
psychopathology.
Prevention and Intervention
In the era of evidence-based, health decision-making, central questions become those of
what works (on the whole), what works for whom (subgroups or treatment modifiers), and how it
works (mechanisms of behavior change). Although individual studies have long attempted to
address these questions, there are good reasons to believe that findings from single studies alone
may not be sufficient in guiding these evidence-based decisions. First, there is a growing concern
about the dismal reproducibility (replicability) in the biomedical and psychological research
fields (Begley & Ellis, 2012; see also Ioannidis, 2005; Nosek, Spies, & Motyl, 2012), prompting
further high-profile publications illustrating ironies about the p values (Nuzzo, 2014) and calling
for better standards for clinical trials (Begley & Ellis, 2012). Second, the effect sizes reported in
single, typically small studies may be overestimated (Cumming & Maillardet, 2006; Kraemer,
Mintz, Noda, Tinklenberg, & Yesavage, 2006). The magnitude of any intervention effect is

25
important to correctly estimate in order to determine its cost effectiveness and to develop
strategies for dissemination. However, effect size estimates vary widely across studies that differ
in designs, measures, and participants; thus, research on the true magnitude of the intervention
effect may be necessary via large, controlled multisite studies and/or meta-analysis studies.
The danger of overly relying on evidence from individual studies can be seen in the case
of the efficacy of antidepressants in recent literature. Turner, Matthews, Linardatos, Tell, and
Rosenthal (2008) meta-analyzed the data submitted to the Food and Drug Administration (FDA)
between 1987 and 2004 (i.e., 74 individual trials for a total of 12 drugs and 12,564 patients), and
compared their own findings with the published findings from the same trials. Their analyses
indicated that effect sizes had been substantially overestimated in published studies (i.e.,
publication bias; see the Publication Bias and Selection Bias section). Whereas 94% of the 37
published studies reported a significant positive result, only 51% actually had a positive outcome
in their reanalysis of the FDA data. On average, Turner and colleagues found a 32% difference in
effect size estimates between the FDA data and the published data. Thus, supporting evidence for
intervention efficacy in single studies may be best viewed cautiously. Subsequent analysis found
that this positive outcome bias was associated with deviations from study protocol, such as
switching from an intent-to-treat analysis to a per-protocol analysis (Moreno et al., 2009).
Similarly, a recent reanalysis of randomized clinical trial data reported that 35% of the
reanalyzed studies required a different interpretation from that of the original article, including
changed direction, magnitude, and statistical significance of findings (Ebrahim et al., 2014).
There is another source of bias in our perception of evidence for intervention efficacy.
Researchers investigating interventions are more likely to cite previous studies reporting positive
outcomes than equally valid studies with disappointing outcomes; this is referred to as the

26
optimisim bias (also referred to as the citation bias; Chalmers & Matthews, 2006). This bias,
along with the publication bias, can have harmful consequences, such as spending limited
resources on less promising trials instead of spending time and resources to develop better
interventions.
In the next section, we provide a review of quantitative methodologies that are aimed at
synthesizing information from multiple studies. We focus on methods for AD meta-analysis, IPD
meta-analysis, and IDA.
RESEARCH SYNTHESIS
The first known use of a meta-analytic method was by Karl Pearson in 1904. Pearson
examined the association between inoculation and mortality from typhoid among soldiers who
had volunteered for inoculation against typhoid for their deployment in various places across the
British Empire (O’Rourke, 2007). It was not until 1976 that the term “meta-analysis” was
introduced by Gene Glass as “the statistical analysis of a large collection of analysis results from
individual studies for the purpose of integrating the findings” and the method took off (O’Rourke,
2007). Meta-analysis has caught on in many substantive fields, especially in medicine. For the
past two decades, the Cochrane Collaboration (2013, http://www.cochrane.org/about-us) has
been a major influence in the field of medical research, conducting over 5,000 systematic
reviews that can affect evidence-based health decisions. Recent methodological advances in the
field of meta-analysis include methods utilizing IPD and complex meta-analysis methods, such
as multivariate meta-analysis and meta-regression. Below we review some of the considerations
needed for conducting meta-analysis. We then review classical and model-based approaches to

27
meta-analysis, as well as complex research synthesis methods involving IPD and/or multivariate
meta-analysis.
Inclusion Criteria for Studies
One of the first decisions in research synthesis involves which studies should be screened
and combined. In meta-analysis, inclusion and exclusion criteria for selecting studies need to be
carefully specified to protect against selection bias. There are two stages of screening in a typical
meta-analysis. The first stage determines eligibility criteria that are based on the goal of the
meta-analysis to ensure that only relevant studies are included. The second stage involves more
careful screening and coding of relevant information (Berman & Parker, 2002).
As in any empirical research, research synthesis starts with certain goals that it is
intended to meet. Is the study intended to derive average effect sizes of the relationships between
emotion regulation strategies and symptoms of psychopathology in observational studies? Or is it
to validate findings from a new intervention to general populations? Depending on the answers
to these questions, studies to be included or excluded can be decided. For the former objective, it
may be reasonable to include both cross-sectional and longitudinal studies that are observational
or etiological in nature, as well as experimental studies. For the latter question of the efficacy of
a new intervention, however, it would be reasonable to eliminate any single studies that are not
randomized controlled trials.
As an illustration, there are several meta-analysis or systematic review studies in the
field of brief alcohol interventions for college students (Carey, Scott-Sheldon, Carey, &
DeMartini, 2007; Carey, Scott-Sheldon, Elliott, Garey, & Carey, 2012; Cronce & Larimer, 2011;
Larimer & Cronce, 2007). The review by Cronce and Larimer (2011), which was not quantitative
but systematic, was intended to provide a quick overview of recent findings in the field of

28
alcohol interventions for college students. Cronce and Larimer used the following inclusion
criteria: studies should (1) report alcohol-focused behavioral outcomes from individual-focused
preventive interventions for college students; (2) be published or conducted between 2007 and
2010; (3) utilize a randomized controlled trial (RCT) or quasi-experimental design (i.e., one
active condition and one control or wait-listed, and randomization). Similarly, Carey et al. (2007)
included any published studies in their meta-analysis if studies (1) examined any educational,
behavioral, or psychological alcohol intervention; (2) sampled college or university students; (3)
used an RCT design; (4) assessed drinking behaviors as outcome measures; and (5) provided
sufficient information to calculate between-group effect size estimates. These inclusion criteria
set the boundaries of the generalizability of subsequent inference. Based on these inclusion
criteria, a list of search terms may be developed to cast a wide net during the search phase. A
flowchart is often provided to show the systematic search and selection process of eligible
studies, which looks like a CONSORT flowchart (Schulz, Altman, & Moher, 2010) for an RCT.
The American Psychological Association (APA) Publications and Communications
Board Working Group (2008) developed the meta-analysis reporting standards (MARS), which
is different from the journal article reporting standards (JARS) for typical empirical articles. The
MARS includes specific recommendations for all sections of a meta-analysis. Specifically, for
describing search strategies, the MARS recommends that the following information be provided:
reference and citation databases searched;
registries searched and keywords used;
time period in which studies needed to be conducted;
other efforts to retrieve all available studies, including listserv queries and personal
contacts made;

29
method of addressing reports in languages other than English;
process for determining study eligibility, including aspects of studies examined, number
and qualification of judges and their agreement; and
treatment of unpublished studies.
And for coding procedures:
the number and qualification of coders;
interrater agreement and how disagreements were resolved;
assessment of study quality; and
how missing data were handled.
In the case of IDA investigations of etiological and longitudinal studies, the number of
similar studies may be fairly limited. Some of the studies considered for IDA investigations may
be ongoing and complex, and data may not be available publicly. In such situations, the
availability of the original investigators throughout all phases of IDA may become one of the
important considerations. Etiological longitudinal studies focusing on developmental pathways
of children of alcoholic parents (e.g., Hussong, Huang, Curran, Chassin, & Zucker, 2010) or twin
or genome-wide association studies (GWAS; Schumann et al., 2011) that are geared toward
understanding genetic susceptibility in the regulation of alcohol consumption may be such
examples. When original studies are under way at the same time as IDA investigations, an
additional set of considerations at the outset of IDA investigations may be especially helpful.
Hussong et al. (2013) recommended the following steps when building the supportive team
science environment needed for IDA research: (1) decide how the responsibility and resources
for data preparation will be divided up between the original study teams and the IDA research
team; (2) make clear what the IDA study aims to answer that is different from the aims of

30
original research projects; (3) coordinate research teams across manuscripts within the IDA study
and the original study teams; (4) reflect the contributions of researchers in a balanced way when
deciding publication credit; and (5) communicate about study differences and reconcile any
discrepancies between IDA study findings and original study publications.
An alternative model of collaborations between the original and IDA investigators may
be a prospective one. In the field of genetic epidemiology, there is a movement toward
establishing collaborative networks of consortia prospectively from the onset of studies with the
possibility in mind that their data may be utilized as an input data set for a larger investigation
down the road (Ioannidis et al., 2006; see also NIMH Collaborative Data Synthesis for
Adolescent Depression Tirals Study Team, 2013). In prospective collaborations, some of the
critical design elements, such as phenotypes, exposures, endpoints, and analyses, can be
coordinated in advance to be sufficiently similar or the same within consortia (i.e., networks of
single studies; see also Figure 4). This type of prospective collaboration among researchers can
lessen the burden of labor-intensive “data unpacking” for IDA investigations in the future.
Publication Bias and Selection Bias
When planning a meta-analysis, one needs to consider the potential threat of publication
bias. Publication bias or file drawer problem refers to the selective publication of studies with
statistically significant outcomes (e.g., beneficial intervention effects). The inclusion of
unpublished data in meta-analysis may be helpful for avoiding or lessening publication bias.
However, some authors have used the inclusion of only published studies as a justification for
ensuring some minimal standards for research by eliminating low quality studies. As an
alternative, individual studies can be scored on a number of items that indicate quality and
summed quality scores can then be used as a minimum threshold score for studies to be included

31
or as study weights in analysis. It should be cautioned that quality scores can be calculated in
many different ways, which can result in different conclusions (Herbison, Hay-Smith, &
Gillespie, 2006), despite sharing common frameworks (Chalmers et al., 1981; Shadish et al.,
2002) for assessing the validity of studies.
Publication bias can happen if oversampling of studies with significant findings occurs
because they are more easily identifiable or accessible or because they are from colleagues in the
same discipline (i.e., citation bias, availability/cost bias, familiarity bias; Borenstein et al., 2009).
Selection bias can occur when studies are included or omitted for systematic reasons. For
example, authors may include certain types of studies in meta-analysis while excluding or
missing others selectively, which can result in a biased sample of studies. A recent review of
meta-analysis studies published in the American Psychological Association and the Association
for Psychological Science journals from 2004 to 2009 indicates that meta-analysis studies that
include unpublished studies are just as likely to show evidence of publication bias as those that
do not, due to selection bias (Ferguson & Brannick, 2012).
There are several ways to examine publication bias. A funnel plot is a graphical approach
to examining publication bias. It displays the estimated effect sizes on the x-axis and sample size
or related measure (e.g., standard error) on the y-axis for a sample of studies. It is based on the
assumption that smaller studies will exhibit more variable effect sizes due to their lack of
precision, and thus the scatter plot should look like a funnel. Figure 5 shows examples of a
funnel plot. An asymmetrical funnel plot (bottom figure) suggests the presence of publication
bias. Several other procedures also exist, such as the trim-and-fill method (Duval & Tweedie,
2000), Begg and Mazumdar’s rank correlation test (Begg & Mazumdar, 1994), and Egger’s
regression asymmetry test (Egger, Smith, Schneider, & Minder, 1997). Nonetheless, the presence

32
of this publication bias is not always examined or adjusted in a meta-analysis. Ferguson and
Brannick (2012) found that 30% of the recent meta-analysis studies did not report checking
publication bias in their sample of studies.
Selection of Variables and Harmonization of Groups and Measures
Next, what are the outcomes of interest? For this question, outcome variables need to be
operationally defined. In medical research, often an outcome is the occurrence of a certain binary
event, such as morbidity (yes-no) and mortality (yes-no) as endpoints of a disease, and therefore
can clearly be defined using a binary indicator. In other situations, a success may be
operationally defined based on meeting cutoff scores on some indicator variables. For example,
alcohol consumption can be quantified as the alcohol intake per day in grams of pure alcohol
(e.g., Roerecke & Rehm, 2012) to examine the relationship between alcohol use and ischemic
heart disease (IHD).
For psychological traits, however, it is more difficult to place individuals on common
metrics (Curran & Hussong, 2009; Huo et al., 2014). Furthermore, the definition of a critical
independent variable (e.g., intervention conditions) can be substantially different at the
operational level; thus, it must be made equivalent across studies before any synthesis can be
conducted. In the IDA study of brief motivational interventions (BMIs) for college students
(Mun et al., in press), for example, we found that some of the intervention and control groups
sharing the same labels were not equivalent across studies in terms of their content,
personalization, and other procedures. In the case of control groups, they differed, ranging from
an assessment-only control group to a treatment-as-usual control group. In some studies, a
treatment-as-usual group was closer to an educational group than to an assessment-only control
group. We addressed this problem by carefully coding all intervention content materials and their

33
delivery characteristics, which was carried out by two independent raters (Ray et al., in press).
Similarly, the operational definition of alcoholic parents can be slightly different across the three
longitudinal studies of children of alcoholics included in the Cross Study Project (Hussong et al.,
2013). Some of these between-study differences may be accounted for by adding covariates (e.g.,
COA and COA by study) in subsequent analytic models. When possible, however, it may be best
to harmonize groups and derive equivalent measures across studies, prior to analysis, to reduce
between-study heterogeneity. More important, any reported findings may be biased without the
commensurate measures and groups established across component studies.
As for the selection of variables for outcome analysis, harmonization of measures is
typically not required for meta-analysis using AD since the unit of analysis is already
standardized. However, this is a serious challenge for IPD meta-analysis or IDA. The need for
ensuring commensurate measures across studies is widely discussed as a notable barrier for IDA
or meta-analysis using IPD, especially in psychological research (Cooper & Patall, 2009; Curran
& Hussong, 2009). As indicated in the literature, the resources needed to establish commensurate
measures for individuals within and across studies are quite extensive (Hussong et al., 2013;
Mun et al., in press, for detail). The task of establishing measurement equivalence starts from
poring over codebooks and data to see if they are consistent across time within studies as well as
across studies. If items are different in terms of the referent time frame, stem, or body of
questions, or if response options are different across studies, they should be treated differently
until these differences are resolved through harmonization processes. Some of the examples can
be seen in Hussong et al. (2013) and Mun et al. (in press).
Once the demanding data preparatory work is completed, one can proceed to analyze
measurement models specifically developed to meet the unique needs of each IDA study. In the

34
field of psychological IDA research, item-level data have been analyzed via utilizing item
response theory (IRT) based models and/or factor analysis (FA) based models. These models
include a unidimensional, two-parameter logistic (2-PL) IRT analysis (Curran et al., 2008;
Hussong et al., 2007), a multi-unidimensional 2-PL IRT analysis for multiple groups (Huo et al.,
2014), a generalized partial credit model (Mun et al., in press) for polytomous items, and
longitudinal invariant Rasch test analysis (LIRT; McArdle, Grimm, Hamagami, Bowles, &
Meredith, 2009). For other applications, moderated nonlinear factor analysis (MNLFA; Bauer &
Hussong, 2009; Curran et al., 2014) has been utilized. Each analytical approach, although the
goal of the task remains the same, has originated to address the unique demands of these IDA
studies.
The entire process of establishing common metrics across studies, starting from checking
data to estimating latent trait scores, can quickly become quite complex as the number of items
in studies increases, as the number of studies increases, and as the number of observations and/or
the observed duration increases. Liu, Liu, and Xie (in press a) considered a new methodology to
synthesize information from independent studies with heterogeneous designs, which may help
release, to some extent, the constraints of common design metrics. But more research is still
needed. Some of the challenging issues that arise from more complex situations include missing
data, high dimensionality, and differential item functioning (DIF) (see Mun et al., in press for
detailed discussion). Other measurement models, adaptations, and computing algorithms are
expected to accommodate these challenges in the field of IDA research in the future.
Classical Meta-analysis Approaches
The earliest meta-analysis approaches combine p values, which is particularly suitable for
situations under which the only available data in original studies are p values or z statistics.

35
There are also a number of classical approaches for synthesizing discrete and, in particular,
binary data from independent studies. In this section, we review these approaches.
p value Combination
Assume that the p values from original studies test the same null hypothesis. We can use
Fisher’s method (Fisher, 1948), which can be traced back to the 1930s, to combine the p values
and provide an overall inference. Consider the case with k studies. Fisher’s method combines the
p values into a 2X test statistic using the formula
2 2
2 2
1
2 ln ,k
k i k
i
X p
where ip is the p value of study i . Under the null hypothesis, the test statistic 2X has a chi-
squared distribution with 2k degrees of freedom. We often use this combined 2X test statistic to
obtain an overall p value for combined inference. Another closely related approach is Stouffer’s
Z (Stouffer, Suchman, DeVinney, Star, & Williams, 1949). This approach converts p values to Z
scores first and then combines the resulting Z scores. More specifically, we first let
1~ 1 ,i iZ p
where is the standard normal cumulative distribution function. Then, the combined Z score
1~
k
i
i
Z
Zk
follows a standard normal distribution under the null hypothesis. Other p value combination
methods include Tippett’s (Min) method, Max method, and Sum method, etc. (cf., Marden,
1991).
Weights can be applied in p value combination methods to account for different sample
sizes across studies and to improve the efficiency combination. For instance, in Stouffer’s Z

36
score method, if the Z score for study i is weighted by iw , then the combined weighted Z score
is
1
2
1
~
k
i i
i
k
i
i
w Z
Z
w
.
Along with the unweighted Stouffer’s Z score, the weighted Z score follows a standard normal
distribution under the null hypothesis. Note that Stouffer’s Z score method, as well as other p
value combination methods, can be used also for combining results from multiple independent
tests within a single study (see Donovan, Wood, Frayjo, Black, & Surette, 2012 for an example
of how this method can be used).
Combining 2 x 2 Tables
Mantel-Haenszel Method
Many outcomes of interest are binary, discrete event data. There can be many important,
naturally binary outcomes, such as mortality or meeting the diagnostic criteria for disorders.
Whether an adverse event occurred following a pharmaceutical trial is also one example. Even
with continuous numerical data, dichotomizing may be preferable in some situations (Shentu &
Xie, 2010) when there are errors in measurement or when obtained data can be naturally
fluctuating due to their sensitivity to internal and external stimulation (e.g., blood pressure).
Furthermore, dichotomized outcomes can be more straightforward to communicate to various
stake holders (Mun, Bates, & Vaschillo, 2010).
To explain some of the methods for binary data, Table 2 shows model setting for 2 x 2
tables for k independent studies, where iX and iY follow a binomial distribution with fixed
numbers in and im of binary observations, respectively. We denote 1 2, ,..., kX X X and

37
1 2, ,..., kY Y Y as responses for k studies following binomial distributions with expectations
expressed as 1p and 2p , respectively; it stands for the total number of events for study i. For
discrete binary data, odds ratio or log odds ratio is often used as an effect size estimate. Some
studies also consider other measures, such as risk ratio, risk difference, etc. The goal of a meta-
analysis for 2 x 2 tables is to synthesize the overall effect across k independent studies.
The Mantel-Haenszel (MH) method (Mantel & Haenszel, 1959) estimates common
parameters from 2 x 2 tables under a fixed-effects model, which assumes a common odds ratio
across studies (see Table 2 for the model setting used). The MH method proceeds:
Estimate odds ratio and its variance for each individual study:
i i i
i ii
i i ii
i
X m Y
R N
Y n XS
N
and
2 2 1 1 1 1
,i ii i i
i i i i i i i i
P QVar
R S X n X Y m Y
where i i i
i
i
X m YR
N
,
i i i
i
i
Y n XS
N
, i i i
i
i
X m YP
N
, and i i i
i
i
Y n XQ
N
.
Estimate the combined odds ratio from k studies:
11
1 1
kki i i
iii i
MH k ki i i
i
i i i
X m YR
N
Y n XS
N
and

38
21 1 1
2 2
1 11 1
22 2
k k k
i i i i i i i i
i i iMH MH
k kk k
i ii ii ii i
PR PS Q R Q S
Var
R SR S
.
The MH method provides consistent and asymptotically efficient estimates when study sizes are
large or when a large number of small studies are combined (Breslow, 1981). Standard error of
estimate can be obtained by using the last equation shown above (Robins, Breslow, & Greenland,
1986).
Peto’s Odds Ratio
Peto’s odds ratio method (Yusuf et al., 1985) is also commonly used for 2 x 2 table data
in meta-analysis. Similar to the MH method, it yields a weighted log odds ratio estimate under
the fixed-effects model framework (see the Model-based Approaches section). However, this
method is different from the MH method in the sense that, instead of using observed odds ratios,
an approximated log odds ratio is calculated for each study and then combined. Hence, it is
sometimes known as the Peto’s one-step method or the “O—E” method since log odds ratio is
estimated by using the “observed” number of events (O) and the “expected” number of events
(E).
Peto’s odds ratio method can be computed as below:
Estimate log odds ratio and its variance for study i :
i ii
i
O E
V
,
1i
i
VarV
,
where iXiO , i ii
i
t nE
N ,
i
2 1
i i i i
i
i i
t m n N tV
N N
.

39
Estimate the combined log odds ratio from all k studies:
1 1
1
k k
i i
i iPeto k
i
i
O E
V
and
1
1Peto
k
i
i
Var
V
.
For both the MH and Peto’s methods, the confidence interval for the estimated log odds ratio can
then be obtained by using the formula shown above along with z critical value. The Peto’s
method, as well as the MH method, relies on the combined estimators approximating to a
standard normal (z) distribution.
Both the MH and Peto’s methods rely on large sample theory to justify the validity of the
approaches. There is also an exact meta-analysis method for combining 2 x 2 tables based on
Fisher’s exact test and conditional likelihood inference; see, for instance, Gart (1970). For the
parameter of risk difference, Tian et al. (2009) proposed a simple procedure to combine
confidence intervals of risk difference for 2 x 2 tables without assigning any arbitrary numbers to
empty cells in meta-analysis, and re-analyzed the controversial data reported in Nissen and
Wolski (2007). For more recent discussions of exact meta-analysis of discrete data, see Liu, Liu,
and Xie (in press b).
Data Example
To illustrate combining discrete binary data across similar studies, we utilize the
intervention data reported in Wilk, Jensen, and Havighurst (1997). Wilk and colleagues
examined the effectiveness of brief alcohol interventions targeted for adult heavy drinkers. They

40
searched for brief interventions that were (1) motivational in nature, (2) as short as 10-15
minutes, and (3) aimed to reduce drinking and related harm to treat nondependent heavy or
problem drinkers. Two databases, MEDLINE and PsychLIT, were searched with the following,
more specific inclusion criteria: (1) focus on alcohol abuse/dependence or heavy drinking, (2)
focus on intervention and outcome, (3) human subjects between the ages of 19 and 65, (4)
publication in English, and (4) a randomized control trial that includes a control group. The
resulting sample consisted of 3,948 heavy drinkers across 12 clinical trials. The brief
interventions common to all trials were short, and all sessions included feedback, education, and
advice. The intervention outcome was measured by using a binary indicator of moderated
alcohol use at 6–12 months post intervention. Of the 12 trials, eight reported outcome data. Table
3 shows 2 x 2 tables, observed odds ratios, and their associated confidence intervals (last two
columns) for all eight studies, as well as overall estimates from the Peto’s one-step method and
the MH method (the bottom two rows).
For the purpose of illustration, here we use the 2 x 2 table for the second study (Study 2
in Table 3). Moderation in use indicates that participants reduced their heavy drinking, whereas
nonmoderation indicates no change in drinking at 6–12 months post intervention. Typically, odds
ratio, as a measure of association, is highly skewed and asymmetrical. Thus, log odds ratio and
its standard errors are often computed instead for inference. The log odds ratio for Study 2 can be
calculated:
2
14 / 66 14 70Log OR log log 1.31
4 / 70 4 66
.
Next, we show how to compute the corresponding 95% confidence interval. First, the standard
error of the log odds ratio 1.13 is

41
2
1 1 1 10.59
14 66 4 70se .
Assuming the log odds ratio is approximately normally distributed, its 95% confidence interval is
1.31 1.96 0.59 0.15,2.47 .
This log odds ratio can then be converted back to odds ratio as follows:
2 2OR exp Log OR exp 1.31 3.71 .
Similarly, the 95% confidence interval for the odds ratio can be obtained by exponentiation of
lower and upper limits of the log odds ratio:
exp(0.15), exp(2.47) [1.16,11.82] .
The MH estimate can be obtained by combining these odds ratios across studies via the
combining equation shown previously in the Mantel-Haenszel Method section. The MH odds
ratio estimate was 1.98 with its 95% confidence interval ranging from 1.67 to 2.34.
Whereas the MH method combines observed odds ratios only, the Peto’s method uses
both observed and expected odds ratios (see the Peto’s Odds Ratio section). Peto’s log odds ratio
for Study 2 can be calculated as:
P
2
2
14 (14 4) (14 66) / (14 66 4 70)Log OR 1.16
V
and its associated standard error
2 2
(14 4) (4 70) (14 66) (66 70)V 4
(14 66 4 70) 14 66 4 70 1
with

42
If we convert the Peto’s log odds ratio to odds ratio, it becomes 3.19, which is different from the
previous observed odds ratio 3.71 obtained by using the MH method.
The combined overall odds ratio across all eight studies using the Peto’s method was 1.95
with its 95% confidence interval ranging from 1.66 to 2.30. The combined estimate is also
different from that obtained by using the MH method. However, both estimates suggest we reject
the null hypotheses. Based on the size of the overall odds ratio, our interpretation is that those
who participated in the brief interventions were almost twice as likely to moderate their drinking
compared to controls. The results from both methods are expected to be similar given that the
rate (37%) of the outcome (i.e., moderation in drinking in the combined sample) was not too
severely low, and also because the two randomized groups were similar in size. In other extreme
data situations, the two methods can result in different conclusions. It has been shown that for
meta-analysis of rare events (e.g., 1% or less), the Peto’s method is the least biased and most
powerful method, according to a simulation study that evaluated several methods, including the
MH method (Bradburn, Deeks, Berlin, & Russell Localio, 2007). Bradburn et al. also observed
that the Peto’s method can yield biased results when sample sizes substantially differ between
groups (e.g., treatment and control) in 2 x 2 tables, and that it yields worse results than the MH
method (conducted without any corrections for zero cells) when the rate of event is not that
extreme (5% or 10% as opposed to 1% or less).
Model-based Approaches
There are at least two major sources of variation to consider when combining statistics
(e.g., means) across studies. First, sampling variability may vary across studies. Studies with
P2Log OR
2
10.5.
Vse

43
larger samples have more information and hence better precision, which can be indicated in taller
and narrower distributions. In contrast, studies with smaller samples have shorter and wider
distributions and less precision surrounding their means (Figure 6). Second, the statistics of
interest can be assumed to have a common value (Figure 6) or to have come from an underlying
distribution of study-specific values (Figure 7). The first source of variation refers to within-
study variability and the latter addresses between-study variability.
Fixed-effects Model
A fixed-effects model assumes that each study summary statistic, iY , is a realization
from a population of study estimates with a common true value . Let be the parameter of
interest (e.g., mean intervention effect) and there are 1,2,....,i k independent studies. Then,
value quantifies the average effect across k studies, which is assumed to be the same across
studies (see Figure 6 for a graphic illustration) so that there is no subscript for . Variance of
summary statistic, iY for study i is assumed to be known, which is denoted as 2
is . This variance
estimate can differ across studies and is indicated by subscript i . Within-study variability 2
is can
be seen as tall and skinny (better precision) vs. short and wide (less precision) distributions in
Figure 6.
A fixed-effects model usually takes the inverse variances ( 2
is ) of the estimates as weights
when pooling data. Between-study variability surrounding is assumed to be essentially zero or
nothing more than what is expected from random errors. This can be more formally expressed as
2( , )i iY N s for 1,2,...,i k .
To see if this assumption holds, the test of homogeneity across studies is conducted by
using the Q statistic (Cochran, 1950)

44
2( ) ,i i w
i
Q W Y Y
where iW is the inverse of the sampling variance for study i and /W i i i
i i
Y WY W is the
weighted estimator of the effect of interest (e.g., estimated mean intervention effect). Under the
null hypothesis, Q follows a chi-squared distribution with 1k degrees of freedom. This test
quantifies the extent of heterogeneity by examining the proportion of the total variation in point
estimates that can be attributed to heterogeneity across studies. If the Q test is rejected, we can
conclude that there exists significant variation across studies due to many reasons, including
differences in study designs, procedures, measures, and samples. Note that this Q test suffers
from low power (Sutton & Higgins, 2008), and 2I test (Higgins & Thompson, 2002) may be an
alternative. More important, it may be unrealistic and too strict to assume that there is one true
common effect size across all studies and that no variability exists surrounding the true effect
size (Jackson et al., 2010; Thompson & Pocock, 1991).
Random-effects Model
A random-effects model assumes that each study summary statistic, iY , comes from a
study-specific distribution, and that the expectations of these study-specific distributions follow a
common distribution. Hence, in addition to within-study variability 2
is , there is study-to-study
variation surrounding the underlying common effect , which can be expressed as variance 2 .
The top figure in Figure 7 shows the underlying superpopulation with a mean and a variance
2 , from which study-specific true effect size estimates are drawn.
These relationships can be expressed more formally as follows:
2 2, ( , )i i i ii
Y s N s and

45
2 2, ( , )i N .
Hence, the distribution of each study summary measure, iY , after averaging over the study-
specific effects, is normally distributed with mean and variance 2 2
is . The distribution of i
can be helpful for identifying subgroups of intervention procedures that are more effective.
When between-study variability 2 = 0, random-effects models reduce to fixed-effects models.
Given that between-study variability 2 is typically greater than zero, fixed-effects models will
almost always have narrower confidence intervals than random-effects models. Likewise, the
larger the 2 , the wider the confidence intervals for the effect of interest. This is because the
underlying between-study variation of the effect is incorporated into weights in a random-effects
model (DerSimonian & Laird, 1986).
Estimators of Variance
Most commonly used methods for estimating variance are the maximum likelihood
estimator (MLE), restricted maximum likelihood (REML), DerSimonian and Laird (DL;
DerSimonian & Laird, 1986), method of moments, and Bayesian (see Normand, 1999, for a
review of estimators, including equations and detailed discussion). To obtain estimates in a
model-based model, the MLE and Bayesian methods are used. The REML, DL, and method of
moments are used to estimate between-study variance in a random-effects model. Note that both
fixed-effects and random-effects models are typically based on the assumption of a normal
distribution. Sensitivity to this distributional assumption or to any individual study may need to
be examined (Normand, 1999). For example, leaving one study out of analysis in a series of
analyses and examining the stability of the estimates across these analyses may be performed as
part of sensitivity analysis. However, there may be limited options when a few studies are
analyzed.

46
Fixed-effects vs. Random-effects Model
Synthesizing data from sufficiently similar studies that have some variation in measures,
samples, and designs has an important benefit in that it provides new understanding about the
boundaries of the effect being examined. When the evidence of a significant difference exists
across studies based on the Q test of homogeneity, it is often used as the basis for choosing a
random-effects model over a fixed-effects model. However, the significant Q test can also be
used to imply that at least one study distinctively differs from others in the effect size estimates
examined. In the case of a meta-analysis of intervention studies, this may indicate the presence
of an important subgroup in which the efficacy of intervention substantially differs from the rest.
Thus, pooling these heterogeneous intervention studies into one model may not make sense in
estimating the overall intervention effect size. For example, if there are outlier studies with
strongly negative intervention effects, it may not be informative to include them with the rest of
the studies that have clear positive intervention effects, only to yield no overall effect. Rather, it
may be more useful to pool data only from sufficiently similar studies. Alternatively, the
magnitude of heterogeneity across studies can be reduced by including informative covariates in
the model. Covariates can be study-level variables for an AD meta-analysis and individual- and
study-level variables for an IPD meta-analysis.
Otherwise, when heterogeneous studies are combined in a fixed-effects meta-analysis
model, studies with larger samples can dominate the combined estimate in a meta-analysis,
essentially throwing away studies with small samples (Al khalaf, Thalib, & Doi, 2011). Similarly,
pooling data from heterogeneous studies in a random-effects model may yield findings that may
shift an inverse variance weighted meta-analysis back toward an unweighted mean estimate (Al
khalaf et al., 2011).

47
The decision of which model to use may depend on other practical considerations. When
there is a sufficiently large number of similar studies with normally distributed outcome data (i.e.,
effect size estimates or IPD outcome variable), a random-effects model can be used, in which
studies are viewed as a random sample drawn from a superpopulation of studies, and
consequently, any resulting inference can be generalized back to this broad population. If there
are a limited number of studies, however, one may need to be cautious about using a random-
effects model, since in this case the between-study variability 2 typically cannot be estimated
accurately and the quality of the overall meta-analysis estimator may be affected. In such a
situation, a fixed-effects model can be used not to draw broad inference but to obtain specific
summary results about the pooled studies (see also Borenstein, Hedges, Higgins, & Rothstein,
2010).
Last, when the number of individual studies is finite, Claggett, Xie, and Tian (2014)
proposed an alternative, resampling-based nonparametric meta-analysis approach that is more
flexible than both random- and fixed-effects models. Note that, in the fixed-effects and random-
effects models, we often assume that the underlying study-level parameters are either exactly the
same across individual studies or that they are realizations of a random sample from a population
(often normal). In the approach by Claggett et al., one only needs to assume that the study-level
parameters are unknown fixed parameters. This approach draws inferences about, for example,
the quantiles of the set of parameters using study-specific summary statistics. This nonparametric
approach proposed by Claggett et al. is more flexible than the fixed-effects model method,
because it allows the underlying study-level parameters to be different across different studies. It
is also more flexible than the random-effects model method because it does not need to limit the
underlying study-level parameters to be from a normal distribution or any assumed known

48
distribution and also because it accommodates any population of the underlying study-level
parameters.
Unifying Approach to Synthesize Data from Multiple Studies
Xie, Singh, and Strawderman (2011) proposed a broad, unifying approach to combining
data from multiple studies. This approach can encompass all of the procedures reviewed
previously, including those from model-based approaches (i.e., fixed-effects and random-effects
models using MLE or Bayesian estimator) under one inclusive theoretical umbrella. This
approach by Xie et al. is more comprehensive than combining point estimates (e.g., means) or p
values like Stouffer’s Z or confidence interval estimates from multiple studies. When combining
data, it uses the so-called confidence distribution (CD). CD is a sample-dependent distribution
function that can represent confidence intervals of all levels for a parameter of interest. It uses a
distribution function, instead of a point (point estimator) or an interval (confidence interval), to
estimate a parameter of interest. For example, in the simple normal example with sample
xi~ N (m,1) , for i =1,...,n , the CD approach invokes the distribution function N (x,1/ n) to
estimate, instead of estimating just a point estimate, sample mean x and 95% confidence
interval 1.96 / , 1.96 /x n x n , for the parameter of interest, m . Analogous to a Bayesian
posterior distribution that contains a wealth of information for Bayesian inference, CD contains
rich information for constructing frequentist inference (Xie & Singh, 2013). Unlike a few point
estimators or confidence intervals, CD contains information about not only important point
estimators—mean, median, and mode—but also confidence intervals of all levels and p values
for various tests. Depending on the set up, the CD approach to combining data can be used to
make either approximate (i.e., justified based on large sample theory) or exact inference for the
parameters of interest. The CD combining approach has also been generalized for robust meta-
49
analysis that is resistant to errors in data, misspecified models, and outlying or bad studies (Xie
et al., 2011). An R package gmeta has been developed to combine data using conventional as
well as robust meta-analysis approaches (Yang & Xie, 2010).
Complex Research Synthesis
Complex research synthesis, although somewhat arbitrary to define, involves models that
(1) incorporate evidence on multiple related parameters (e.g., multiple intervention comparisons
or multiple endpoints—two or more related outcome variables), (2) specifically model data from
different study designs (e.g., experimental studies and observational studies), or (3) involve raw
IPD (Sutton & Higgins, 2008). In other words, complex research synthesis is a collection of
emerging analytical approaches that are aimed at taking full advantage of existing data to
respond to research questions not easily addressed in a single individual study or in a typical AD
meta-analysis.
Multivariate Meta-analysis
Multivariate meta-analysis generally refers to the joint synthesis of multiple related
parameters across studies, which can be found in terms of multiple intervention conditions,
covariates, or outcomes, and repeatedly observed single measures. These variables are correlated
within studies by their nature and are referred to as the within-study correlation. In contrast, the
between-study correlation indicates how the true estimates are related among studies. A
multivariate model takes into account within-study correlations, which allows one to borrow
strength from other related data and obtain more desirable estimates. Riley (2009) demonstrated
in a simulation study that ignoring the within-study correlation results in increases in the
standard errors of overall effect estimates (precision) and mean-square error (between-study
variance), and results in bias when nonignorable missing data exist. The diagnostic application

50
example we illustrated in the Screening and Diagnostic Tests section (i.e., Reitsma et al., 2005)
utilized a bivariate meta-analysis for the joint estimation of two related estimates (i.e., sensitivity
and specificity). The utilities of multivariate meta-analysis, however, extend much beyond
diagnostic meta-analysis. Multivariate meta-analysis methods can be utilized for synthesizing
treatment effects on multiple related outcomes (also called multiple endpoints), multiple
interventions, or exposure groups (also called network meta-analysis; see Jackson, Riley, &
White, 2011 for a review).
More formally and generally, multivariate meta-analysis can be shown as below. When
multiple outcomes are synthesized using the framework of a random-effects model, we typically
assume the following multivariate model:
| ,S ~ ,Si i i i iNY ;
| , ~ ,i N ,
where iY denote the 1p vector of outcomes of interest for study i; i is the true underlying
effect for study i; and iS is the within-study covariance matrix, which is assumed to be known.
N denotes the multivariate normal distribution with dimension p . We also assume that i
varies from study to study and follows a multivariate normal distribution with overall mean
and between-study covariance matrix . The estimate ̂ can be expressed in terms of ̂ :
1
1 1
1 1
ˆ ˆ ˆn n
i i i
i i
S S
Y ,
where ̂ can be obtained by using the MLE, REML, method of moments, or Bayesian method.
The estimated variance is:

51
1
1
1
ˆ ˆVarn
i
i
S
.
If some studies have missing data for the vector of interest, one way of incorporating these
studies with missing data in multivariate analysis may be to replace missing data with estimates
with a negligible weight and information. This can be achieved by setting very large within-
study variances to the missing data points and by constraining within-study correlations with
other endpoints to be zeros (Jackson et al., 2010). Thus, the multivariate meta-analysis methods
achieve better efficiency in using all available information than univariate methods.
The idea that multivariate meta-analysis should take into account the correlated nature of
data when there are multiple endpoints is not new, although its utilization has been rare in
applied research. Jackson and colleagues (2011) summarized the following five advantages of
multivariate meta-analysis over univariate methods: First, we can obtain estimates for all effects
in a single modeling framework. A single integrated multivariate meta-analysis is more elegant
than multiple univariate ones. Conceptually, it is analogous to conducting a multivariate analysis
of variance (MANOVA) as opposed to conducting a series of analysis of variance (ANOVA)
when there is a need to analyze multiple related outcomes. Second, we can utilize the
relationships among the multiple effects examined when making inferences. For example, in
quadratic growth curve models, linear and quadratic growth parameters are often negatively
associated and this information can be interpreted and used in a multivariate analysis. Similarly,
sensitivity and specificity estimates are negatively associated and this information can be used
when jointly estimating the region of significance.
Third, we can obtain parameter estimates with better statistical properties. When we
utilize the correlations among related endpoints in a multivariate analysis, each endpoint can
52
borrow strength from the other related endpoints, resulting in smaller standard errors for the
overall estimates compared to those from separate univariate models. Moreover, it also results in
smaller mean square error of the between-study variance. This gain in estimation is directly
related to the within-study correlation. As the within-study correlation increases, we generally
obtain better estimates. Fourth, we can make potentially different clinical conclusions, compared
to those from multiple univariate meta-analyses. By providing all results in a single multivariate
meta-analysis, it is easier to compare the results than it is from different analyses that make
different assumptions. Fifth, the multivariate methods have the potential to reduce bias due to
partial reporting of data. These advantages apply to both AD and IPD analysis. With IPD,
however, the implications of the multivariate meta-analysis methods significantly change. Its
promise is very appealing and clear. At the very least, within-study correlations can be directly
estimated using IPD. More important, data can be newly and directly analyzed using IPD with
advanced analytical models.
Multivariate meta-analysis is particularly well suited for use in prevention and
intervention research. Many behavioral outcome measures are highly correlated and typically not
fully reported in publications. When multiple related outcome data exist in studies and when they
are examined one by one (and separately at each follow-up) or selectively, it raises the possibility
of chance findings, especially in studies with small samples (Tversky & Kahneman, 1971). This
research practice can lead to misleading conclusions with regard to whether the intervention is
efficacious overall. In some situations, investigators may selectively report some outcomes and
omit others when publishing, which is a research practice that should be avoided (Bakker, van
Dijk, & Wicherts, 2012). Given that the average behavioral intervention effect is generally small,

53
the likely conclusion one can make under this questionable research practice is that an
intervention has an effect for some of the outcome variables but not for others.
When it comes to univariate meta-analysis using AD, these multiple related outcomes are
analyzed separately one by one, which can result in different samples for different analysis
because not all studies report or have those outcomes. As a consequence, each meta-analysis
includes only those studies that have the measure being analyzed. Any different conclusions
across different outcome measures from univariate methods can be attributed to different studies
or samples being included, as well as to different intervention benefits for different outcomes.
For a relatively understudied outcome variable, it is also possible to have just a few available
studies, which seriously limits our ability to draw any firm conclusions in a typical univariate
meta-analysis. Multivariate meta-analysis is a promising new approach, especially when the
method is used with IPD. Below, we discuss how the multivariate meta-analysis methods can be
used for comparing multiple intervention groups.
Network Meta-analysis
Network meta-analysis refers to synthesis of a network of trials connected by evidence
(Jansen et al., 2011). When a multivariate meta-analysis is performed for comparing multiple
intervention groups, it can be viewed as a network meta-analysis (Hoaglin et al., 2011; Jansen et
al., 2011). This approach enables us to draw conclusions about relative intervention effects of
different intervention approaches that have not been compared head-to-head in a trial using a
network of direct and indirect evidence (Jansen et al., 2011). It takes advantage of a greater share
of available evidence than a traditional meta-analysis of RCTs, which typically features
comparing just two arms (i.e., intervention and control). Furthermore, when a new intervention
surfaces, it is rarely compared against another, effective intervention approach. As a result, there

54
is a dearth of evidence suggesting relative benefits when attempting to make evidence-based
health decisions. Via network meta-analysis, the existing interventions can be contrasted with
new ones through connected evidence, even when they were never directly compared.
To know the relative strengths of all available interventions, it may be best to include
them in a large-scale study and compare them pairwise to derive estimates of relative
intervention effect. However, with limited resources, this is practically impossible to carry out.
In the absence of direct head-to-head comparisons of competing interventions, network meta-
analysis utilizes networks of direct and indirect comparisons to derive relative intervention effect
estimates between competing interventions. Figure 8 illustrates the concepts of direct and
indirect evidence. The solid lines between ovals indicate that direct head-to-head intervention
comparisons are possible. The dotted lines indicate indirect comparisons are possible. As long as
indirect pairwise comparisons can be anchored, indirect comparisons of multiple intervention
conditions are possible. For example, head-to-head pairwise comparisons of intervention
conditions A and B, and A and C, are anchored on the common condition A. With A serving as
the anchor, relative effects of intervention conditions B vs. C can be obtained indirectly (the
figure on left). Intervention conditions B and C are connected indirectly through the condition A.
This is the essence of an indirect comparison through using an anchor intervention in a network
of evidence. The figure on the right shows that both direct and indirect comparisons are possible
between intervention conditions B and C. Many more intervention conditions can be compared
even though they are not directly compared in any trials. For example, intervention conditions B
and D, B and E, C and D, C and E, and D and E are possible due to the anchor intervention A. As
more intervention conditions are linked to the existing network, more interventions can be
directly and indirectly compared.

55
It is important to note that there are necessary assumptions for network meta-analysis to
be valid—similarity and consistency (Jansen et al., 2011). The assumption of similarity
necessitates that trials included in relative comparisons should be sufficiently similar in terms of
participant characteristics, protocols, and measures and that any between-study variation in these
characteristics should not systematically modify the intervention effect across studies. The
assumption of consistency dictates that when both direct and indirect comparisons are possible in
a network of connected evidence (Figure 8; on the right side), the evidence from direct and
indirect comparisons should be consistent. Jansen and colleagues (2011) recommended that
network meta-analysis be used when the evidence base consists of more than two RCTs
connecting more than two interventions.
IPD Meta-analysis and Integrative Data Analysis
As discussed thus far, IPD meta-analysis and IDA can be conducted to address whether
the effect of interest exists across the board and how large the effect is at the population level.
When utilized in the context of multivariate meta-analysis for multiple related parameters, IDA
or IPD meta-analysis can be a particularly compelling approach because the advantages of
multivariate methods can be fully exploited in IDA.
At the same time, some cautionary comments about IPD are needed. When IPD is
analyzed in a large study, one can achieve much needed precision about point estimates and
standard errors. In a small IDA project with a few studies, however, it is difficult to obtain such
precision, especially when considerable between-study variability exists. For this reason, there
should be a sufficiently large number of studies available for IPD meta-analysis and
consequently greater resource, compared to AD meta-analysis (Mun et al., in press; Steinberg et
al., 1997). For any population-based inference, some researchers have suggested that 10–20

56
studies may be needed for its population representation and validity of parameter estimates
(Hussong et al., 2013). In relation to this population based inference, it is also important to
communicate how the set of studies included in IDA relates to the body of existing studies in the
literature.
In this section, we focus on combining IPD for comparing multiple intervention groups
across studies. Whenever there are multiple competing intervention conditions in some of the
studies, data are typically combined and analyzed only from the studies that have the target
intervention groups, and this analysis is repeated for all intervention pairs. However, the
downside of this approach is that the studies being included in each set of analysis can be
different, and any effect size estimate cannot be directly compared because uncertainty
surrounding the estimates can be due to the different samples analyzed. Furthermore, it is
unreasonable to assume that these interventions or multiple outcomes are independent within
studies. Thus, comparing intervention conditions separately is an inefficient use of data, and can
also lead to misleading and/or biased estimates.
In a multivariate meta-analysis, we can include all conditions across studies as long as
they can be linked together by utilizing the correlational structure among these conditions. In the
current chapter, we illustrate a 2-stage multivariate meta-analysis using IPD. This analysis
proceeds in two stages. At the first stage, the analyst formulates a model to run for each data set
based on a substantive conceptual model. This model can be flexibly designed by the analyst
based on the research goals and data characteristics. It can be a latent curve model with
polynomials, piecewise model, or mixed-effects model. In addition, an intervention effect can be
variously defined and derived. It can be derived from a model that includes baseline levels.

57
Alternatively, one can specify an intervention effect on the rate of growth. The distributions of
outcome measures can also be accommodated.
At the second stage, the vectors of coefficients of the model across studies are analyzed
to obtain overall estimates and covariance matrix. For the second step, different estimators for
between-study covariance matrix, such as the MLE or method of moments can be utilized. If
some of the covariates are not available in a data set because it was not assessed originally, or if
all observations in the data set share the same value for some covariates (e.g., all participants in a
study are men), these covariates cannot be included in the model. For example, there can be a
total of five coefficients in the formulated model, of which three can exist in one study but four
in another. It is possible that none of the studies has all five coefficients. The resulting coefficient
vectors and their covariance matrices of all studies are then collected and analyzed to obtain an
averaged coefficient vector and its associated covariance matrix.
This approach to multivariate meta-analysis is well suited for IPD because it is necessary
to analyze IPD for each study, derive adjusted effects, and obtain their associated covariance
matrix at the first stage. For a multivariate meta-analysis with AD to be feasible, within-study
covariance matrices should be reported in publications or made available. There are no
restrictions as to the number of coefficients that can be analyzed and combined, but it can
become quite complex as the number of coefficients and/or studies increases and as sparseness
goes up.
To present the method more formally, we first assume the model to be analyzed at the
first stage is
T
ijt i ijt ij ijty x u ,

58
where ijty is the outcome score for participant j at time t in study i , ijtx and i are the
corresponding design and coefficient vectors, respectively; iju is the random intercept for
participant j in study i , and ijt is the residual error term. Each i is a subset of the vector , and
its estimate and covariance matrix of , denoted as , are obtained separately for each study
(first stage) and subsequently combined (second stage).
At the second combining stage, we assume a hierarchical model with the form
| , ~ ,ii i i p i iS N S ;
| , ~ , T
i p i i iN A A A ,
where i and i are the observed and true parameter vectors for study i , respectively. iS is the
covariance matrix of i , which is typically assumed to be known. and are the population
parameters and the corresponding covariance matrix can be estimated by many estimation
methods, such as the REML. iA is the mapping matrix that indicates missing data and maps to
i . The particular estimation approach shown above utilizes the CD method (see the Unifying
Approach to Synthesize Data from Multiple Studies section) and explicitly incorporates the
overall structure of missing data into the model through a mapping matrix iA . If there are no
missing data points, iA becomes an identity matrix. The CD estimator consequently becomes
equivalent to other estimation methods (see Jackson et al., 2011), which is extremely unlikely for
any IPD analysis situations.
When applying the CD method, the combined estimates of and its covariance, denoted
as and ,c ES , have the following forms

59
and
.
These equations are used when combining estimates of and its covariance. This multivariate
meta-analysis approach for comparing multiple intervention groups using IPD can be seen as a
network meta-analysis application. At the same time, this multivariate approach using IPD is
more general and flexible than typical network meta-analysis using AD in the sense that
intervention effects included can be adjusted effects after taking into consideration any effects of
covariates.
It is also important to note that IDA can be conducted to pool two or three non-RCT
studies into one. When two or more non RCT studies are pooled into one, the resulting pooled
data can still enjoy many advantages of IDA. The pooled data set would be more heterogeneous
in terms of samples and study characteristics, be larger in sample size, and have more follow-ups
for a longer duration. Overall, combined data from two studies may be better than data from a
single study, if the measurement equivalence can be established across the studies being pooled.
IDA or IPD meta-analysis, regardless of the nature of its component studies, is highly innovative.
Not only does it strengthen causal inference based on existing data, but more importantly, it
allows testing of a new set of hypotheses and mechanisms of change that may not be feasible to
examine in single studies. One possibility for new analyses is to detect moderated effects and
explore subgroups, which can be explored in the pooled data of RCTs or non-RCTs.
Subgroups, Moderated Effects, and New Discoveries
60
IPD meta-analysis or IDA can be useful for understanding subgroups because individual-
level, as well as study-level, covariates can be explicitly studied in connection with different
intervention effects. Subgroups in this context extend beyond subgroups of individuals to include
any meaningful differences that may affect intervention outcomes, such as any differences in
intervention protocols and follow-up periods. These investigations are of critical interest in
intervention and prevention research, as they suggest clues for mechanisms of behavior change at
the individual level. Through the use of IDA, one can conduct new analyses well suited to reveal
subgroups for a large pooled sample. IPD analysis can overcome issues of low power,
publication bias, and ecological fallacy.
The power advantage of IPD analysis over single studies or AD analysis is generally well
known. Investigations aimed at revealing subgroups require a considerably large sample in
original single studies. In comparison with AD analysis, the power to detect these effects by
using the summary-level data will often be prohibitively low, and IPD analysis is necessary to
detect effects of covariates at the individual level (Sutton & Higgins, 2008). However, with
careful considerations, an AD meta-analysis may gain back the power even under heterogeneous
designs (Liu et al., in press a).
As for publication bias, single studies lack sufficient power to detect moderated effects.
Thus, these nonsignificant effects may go unreported in many publications. Furthermore, the
analytic approaches chosen for subgroup analysis in single studies vary widely, which makes it
even more difficult to combine effect sizes across individual studies in AD meta-analysis. More
important, there is an issue of interpretation. This applies to the relative advantage of IPD over
AD. When study-level covariates are used to explain any differences in intervention effects, this
can lead to invalid statistical conclusions.

61
Meta-regressions (via using AD; see Figure 2) require careful interpretation, as they are
more prone to ecological bias. Ecological fallacy or ecological bias occurs when conclusions
are made about the mechanism at the lower-level data based on the higher-level data. For
example, in the field of college alcohol intervention research, some of the studies comprise all
men or all women. If gender is included as a moderator of the treatment effect in meta-regression
analysis, which is confounded with study membership, the resulting conclusion may be subject
to ecological bias. Thus, IPD meta-analysis is better suited than single studies and AD meta-
analysis when examining subgroups (Brown et al., 2013; Simmonds & Higgins, 2007).
Of course, IPD analysis has other advantages, such as the capabilities to check the quality
of data and reanalyze data using more appropriate approaches (Curran & Hussong, 2009; Sutton,
Kendrick, & Coupland, 2008). For these reasons, IPD meta-analysis is widely considered as the
“gold standard” in the statistical literature (Lin & Zeng, 2010; Sutton & Higgins, 2008). At the
same time, it has been echoed by many that such analyses require much more time and efforts to
carry out (Cooper & Patall, 2009; Mun et al., in press; Steinberg et al., 1997; Sutton et al., 2008).
The advantages of IDA need to be understood in the context of challenges. IDA requires
the availability of data and subsequent contacts with those who have conducted relevant studies.
Other challenges include the need for harmonizing groups and measures across studies. These
challenges go up when the number of studies increases because the number of variations to be
harmonized across studies goes up along with the number of studies (see Mun et al., in press for
some examples). In addition, as the number of studies goes up, overall percentage of missing
data at the study level (i.e., did not assess or could not be harmonized) may become prohibitively
huge when individual data sets are combined for a single-step integrated analysis. When one of

62
the goals of IDA is to fully utilize available data in analysis, missing data can cause great
difficulties for IDA studies throughout all stages of analysis.
Table 1 provides an overview of various methods discussed in this chapter. Figures 1, 2,
and 4 graphically summarize the relationships among the source of data, type of data being
pooled, analytic methods, and approaches to the univariate and multivariate methods. Figure 4
shows emerging new directions in the field of research synthesis. Namely, future innovations
may be obtained by coordinating and designing single studies as part of research networks, then
channeling IPD from these sources for innovative multivariate analysis, maximally utilizing all
available data for more robust inference and new discoveries. In the DATA EXAMPLES section
below, we illustrate two data examples from an IDA research project that pooled data from
multiple alcohol intervention studies for college students.
DATA EXAMPLES
In the field of college alcohol intervention research, brief motivational interventions
(BMIs) have received empirical support for reducing excessive alcohol use and related problems
among college students at least on a short-term basis (Carey et al., 2007; Cronce & Larimer,
2011). However, there are several outstanding questions, including inconsistent intervention
effects within and between studies, as well as the small intervention effect sizes reported in the
literature. Furthermore, the mechanisms of behavior change remain sketchy. Project
INTEGRATE was a response to address these outstanding questions. More specific goals were to
examine (1) whether BMIs are efficacious for bringing about changes in theory-based behavior
targets, such as normative perceptions about peer alcohol use and the use of protective

63
behavioral strategies while drinking; (2) whether positive changes in behavior targets predict
greater reductions in alcohol use and negative consequences; (3) whether subsets of interventions
are more promising; and (4) whether subgroups of individuals exist for whom different
interventions are more efficacious.
Pooled Data
To compile data from BMIs, we contacted individual investigators in the spring of 2009
who had published data on BMIs. All but one agreed to share their data. In the case of the single
exception, there was an ongoing project within the research team that had similar research goals.
There was also a snowballing recruitment of other investigators. The unpublished data by these
investigators were also compiled. Unlike a typical meta-analysis project, we did not
systematically search databases or launch an exhaustive search of all eligible studies. Thus, the
sample of studies we have is a convenient sample that is nonetheless broadly representative of
the existing intervention studies conducted between 1990 and 2009 (published between 1998 and
2010). The combined data set was diverse in terms of original investigators, college campuses
from which participants were recruited, demographic characteristics, and intervention study
designs (Table 4; see also Mun et al., in press).
Sample
Data were pooled from 24 independent studies (Studies 1 through 7, Studies 8a, 8b, and
8c, and Studies 9 through 22; see Table 4), resulting in a combined data set consisting of 12,630
participants (42% men; 58% first-year or incoming students) who were assessed two or more
times from baseline up to 12 months. The majority of the sample is White (74%), with 12%
Asian, 7% Hispanic, 2% Black, and 5% belonging to other or mixed ethnic groups.
Approximately 15% are college students mandated to complete a university program (e.g., a

64
BMI or educational program) as a result of alcohol-related infractions; 27% are members (or
pledged to be a member) of fraternities and sororities; and 13% are varsity athletes or members
of club sports. The majority of the individual studies included in Project INTEGRATE have been
previously described in the published literature (see Mun et al., in press for more information).
Intervention Groups and Procedures
All studies included one or more BMI conditions, with the majority (21 studies) including
either a control condition or other comparison condition (i.e., alcohol education). Across studies,
some groups with the same intervention label were different; and several other groups with
different intervention labels were actually equivalent when examined at the operational level. To
determine which groups are equivalent to and different from others, we developed a quite
detailed coding procedure to go over all published and unpublished intervention materials and
quantitatively code their content and characteristics. Two content experts coded independently
and any discrepancies were discussed in detail, at first between them and, if necessary, with the
rest of the research team (see Ray et al., in press for the detailed description). We consequently
relabeled intervention groups based on their intervention characteristics and intervention content.
Newly labeled five intervention groups for Project INTEGRATE were: Motivational
Interview plus Personalized Feedback (MI + PF), stand-alone Personalized Feedback (PF),
Group Motivational Interview (GMI), Alcohol Education (AE), and Control. There were also
several unique conditions that did not fit these categories, including an MI + PF combined with
an alcohol expectancy challenge, an MI without PF, and an MI + PF combined with a parent-
based intervention. Participant recruitment and selection also varied across studies, ranging from
volunteer students recruited with flyers to students who were required to complete an alcohol
program because they violated university rules about alcohol.
In a preplanned, large multisite RCT, intervention conditions or groups can be perfectly
balanced as in a factorial design, which is practically not feasible for IDA studies. For Project

65
INTEGRATE, five intervention conditions existed across 24 studies. Table 5 shows the
unbalanced nature of the intervention conditions in terms of both number and type for a subset of
studies that were utilized in the current chapter. Studies 9 and 13/14 had all four groups but all
other studies had two or three groups. Some of the studies did not have a control group (Studies
1 and 3) and only three studies had an Alcohol Education group. If these five conditions are
crossed with study, it would result in missing data for many study-by-intervention conditions.
Thus, if these groups were to be analyzed simultaneously in one-step analysis using typical
analytic approaches, it is likely that missing conditions would create estimation difficulties in
analysis.
Measures
We now describe how measures were harmonized and how latent traits were estimated
across studies for two of the measures used in the outcome analysis. See also Huo et al. (2014)
for technical detail and Mun et al. (in press) for an accessible overview of the measurement
approach taken for Project INTEGRATE.
Measures: Protective Behavioral Strategies
Protective behavioral strategies (PBS) refer to specific cognitive behavioral strategies that
can be employed to reduce risky drinking and limit harm from drinking (Martens et al., 2004).
We identified five major questionnaires used to assess PBS: the 10-item Protective Behavioral
Strategies (PBS) measure taken from the National College Health Assessment survey (American
College Health Association, 2001), the 15-item Protective Behavioral Strategies Scale (PBSS;
Martens et al., 2005), the 37-item Self Control Strategies Questionnaire (SCSQ; Werch &
Gorman, 1988), a seven-item Drinking Restraint Strategies (DRS) scale used in Wood, Capone,
Laforge, Erickson, and Brand (2007), and a nine-item Drinking Strategies (DS) scale reported in

66
Wood et al. (2010). The PBS was assessed by Studies 1, 2, 8a, 8b, 8c, and 9; the PBSS was
assessed in Studies 4, 16, 18, and 21; the SCSQ by Study 3; the DRS by Studies 12 and 22; and
the DS by Study 22. In these studies, items were assessed in Likert-type scales. Note that many
items were similar in wording. Given that slightly differently worded items can be responded to
differently by responders, we initially treated them as different items. In addition, we limited
item-level data only for those who reported recent drinking (i.e., past 1 to 3 months) due to the
nature of the construct.
Of the compiled pool of items, items indicating abstinence from drinking (two items; cut
back on drinking and choose not to drink alcohol) or manner of drinking (one item; drink shots
of liquor) were dropped, as they do not conceptually fit the definition of PBS. Study 3 included
an additional 16 items related to PBS, which were dropped from the pool because they were
assessed only in Study 3 and could not be linked to any other items across studies. Study 7
assessed protective, as well as risky, behaviors (a total of 17 items) as a set of behaviors that one
can engage during drinking, such as leaving drinks unattended or drank lower alcohol content
beverage. Participants were asked to provide the total number of times that they participated in
such activities in the past month (possible range from 0 to 99). Their response patterns were very
different from those of other studies measured on a Likert-type scale and difficult to harmonize
reasonably. We thus decided not to include these items in the pool.
A total of 58 protective behavioral strategy items assessed by 13 studies (Studies 1–4,
8a–8c, 9, 12, 16, 18, 21, and 22) were then analyzed using item response theory (IRT) analysis.
Different questionnaires had different stem questions leading to specific items. Some of the
major variations were as follows: “The following set of questions asks about your drinking
behavior. Please indicate how often you did the following…”(PBS); “Please indicate the degree

67
to which you engage in the following behaviors when using alcohol or ‘partying’ … ” (PBSS);
“How often did you use each of these strategies to deliberately limit your drinking?” (SCSQ);
“Do you deliberately try to … ” (DRS); and “How often do you … ”(DS). We assumed that these
stem questions did not make a difference.
Of the remaining 58 items, 20 were combined into five individual items because they
were very similarly worded. Examples of similarly worded questions were: avoid drinking
games; avoid or limit your participation in drinking games in order to drink less; avoid playing
“drinking games.” Collapsing such similarly worded items may not be ideal, as participants can
respond differently to slightly differently worded items or different leading (stem) questions.
However, to be able to link items across studies, we made an assumption that these similarly
worded items were essentially the same in eliciting responses. Many pooled items were similar,
as they had been adopted or modified from other existing questionnaires included in the pool of
items. If we were to take the strictest route and treat all items as different, one consequence
would be to analyze only those few studies that administered exactly the same questionnaire for
exactly the same time frame using exactly the same response options. For example, the PBS was
administered in six studies and the PBSS was administered in four studies. If these data sets were
analyzed separately, it would be difficult to draw any direct comparisons between the two sets of
analyses.
In general, there is a trade-off between item coverage across studies and quality of
information when harmonizing measures. The coverage of items will be greater when we accept
slightly imperfect items as commensurate across studies. However, the coverage will suffer if
slight variations are not tolerated across studies. This decisional balance may have to be
determined individually depending on the research questions, available data, and subsequent

68
analytic methods (to see examples in which harmonization may not be reasonable, see Mun et al.,
in press).
Our subsequent analysis did not involve comparing intervention cases and control cases
across studies (called “breaking randomization” or “naïve comparison”). We compared
intervention cases against their own controls within studies, before their relative differences were
pooled across studies. Thus, we made an assumption that this item linkage we established would
not yield biased results. In situations where naïve comparisons are made, however, one cannot
assume that even the same item has the same item function across studies. In other words, when
participants in one study are combined with participants in another study without the nested data
structure taken into consideration, item functions may differ across studies, which may result in
biased inference. In such situations, DIF tests across studies and appropriate follow-up actions
may be needed to demonstrate measurement equivalence across studies.
Response options were harmonized and recoded to indicate 0 = never; 1 = rarely, seldom,
occasionally, or sometimes; 2 = often or usually; and 3 = always. Response options rarely,
seldom, occasionally, and sometimes were originally assessed as different categories but were
combined into one because endorsement rates were relatively low for these categories. Also, for
PBS, answers in either extreme (i.e., never or always) and adjacent steps from the extremes are
more important than any difference that exists in the middle of the scale (e.g., rarely vs. seldom
or occasionally vs. sometimes).
A total of 43 items (38 unique and 5 collapsed items) were then analyzed, specifying a
single, underlying dimension of protective behavioral strategies. Because we deemed it
important to distinguish often from always, we used a generalized partial credit model (GPCM;
Muraki, 1992) to assign partial credit for polytomous items (for more detailed explanations of

69
the GPCM parameters, see Mun et al., in press). We developed Markov chain Monte Carlo
(MCMC) algorithms to fit several IRT models, including the GPCM model, within a hierarchical
Bayesian framework. Huo et al. (2014) provides the theoretical and technical details of the IRT
models and MCMC algorithms, which were written in Ox (Doornik, 2009). The correlation
between latent trait scores from the GPCM analysis and the original scale scores was 0.96.
Measures: Alcohol-related Problems–Neglecting Responsibilities
Alcohol-related problems is one of the critical outcome measures and our measurement
approach for this construct is described in greater detail elsewhere (see Huo et al., 2014; Mun et
al., in press). Briefly, individual items and items from well-known questionnaires for alcohol-
related problems were identified from each study and compiled in a separate data set. These
items mostly came from the Rutgers Alcohol Problem Index (RAPI; White & Labouvie, 1989),
the Young Adult Alcohol Problems Screening Test (YAAPST; Hurlbut & Sher, 1992), the Brief
Young Adult Alcohol Consequences Questionnaire (BYAACQ; Kahler, Strong, & Read, 2005),
the Alcohol Use Disorders Identification Test (AUDIT; Saunders, Aasland, Babor, De La Fuente,
& Grant, 1993), the Positive and Negative Consequences Experienced questionnaire (PNCE;
D’Amico & Fromme, 1997), and the Alcohol Dependence Scale (ADS; Skinner & Allen, 1982;
Skinner & Horn, 1984). For each item, responses were dichotomized to indicate 1 = Yes; 0 = No,
because this response format was the common denominator across studies. When someone did
not drink during the time frame referenced, the score was recoded as zero.
We conducted both a unidimensional IRT model and a four-dimension IRT model for
alcohol-related problems for Project INTEGRATE. In the former, a single overall, severity latent
trait is assumed to give rise to item responses. In the latter, four distinct but related latent trait
dimensions give rise to item responses within their dimensions, which were Neglecting
70
responsibilities, Interpersonal difficulties, Dependence-like symptoms, and Acute heavy-drinking,
respectively. Estimated correlations among the four dimensions exceeded 0.8, which indicates
that these dimensions are highly correlated but still distinct. Both IRT models showed acceptable
fit and parameter estimates were similar between the two models. In the current chapter, we
focus on a single dimension of alcohol-related problems obtained from the four-dimensional IRT
model–Neglecting responsibilities (NR) as an example in the Outcome Analysis section. Some
of the example items for this dimension were “Got into trouble at work or school because of
drinking” and “Missed a day (or part of a day) of school or work”.
Outcome Analysis
For outcome analysis, we provide data examples for model-based meta-analysis and
multivariate meta-analysis (network meta-analysis) using data for PBS and NR, respectively. For
the first data example, we utilized both fixed-effects model and random-effects model to
examine whether college students who were assigned to a brief alcohol intervention utilized PBS
more often their counterpart controls at the first, immediate follow-up. PBS is increasingly seen
as an important behavioral target of alcohol intervention efforts for college students. For the
second example, we demonstrated how multiple intervention arms could be combined across
studies and analyzed in a single combined, multivariate analysis using the CD approach.
Model-based Meta-analysis
For model-based meta-analysis, we used PBS data. Of the 13 studies (Studies 1–4, 8a–8c,
9, 12, 16, 18, 21, and 22) that assessed PBS, we excluded three studies due to the lack of an
equivalent control group (Studies 1, 3, and 4). Studies 9 and 21 had multiple intervention arms
and we combined them into one intervention group (i.e., MI + PF, PF, and Alcohol Education
were combined for Study 9; MI + PF and PF were combined for Study 21). Thus, we had a two-

71
arm design (one intervention and one control) for a total of 10 studies, and examined their PBS
data at their first follow-up. The first follow-up assessment occurred within 1–3 months for
Studies 2, 9, 12, 16, 18, and 21; 9 months for Study 22; and 12 months for Studies 8a, 8b, and 8c.
Results indicated that there was no significant between-study heterogeneity, Q (df = 9) =
12.03, p = 0.21. The statistical conclusion from either a fixed-effects or a random-effects model
was the same. That is, there were no significant differences between the intervention and control
groups in terms of their tendency to utilize PBS at the first follow-up. The overall mean
difference in PBS latent traits between the two groups was 0.05 under the fixed-effect model.
The 95% confidence interval, [-0.002 to 0.102], included 0. The random-effects model estimated
the overall mean difference to be 0.05 and had the slightly larger 95% confidence interval, [-
0.008 to 0.104], to account for between-study variability, although in the present case there was
no statistically significant, between-study variability in the mean differences in PBS scores.
Figure 9 shows the results from the fixed-effects model in a forest plot. At the individual study
level, only Study 8a showed a statistically significant, favorable outcome for the intervention
group, compared to control.
Although there was no statistically significant, between-study variability in estimates, the
nonsiginificant Q statistic should not literally be interpreted as evidence to indicate that the effect
sizes are consistent across studies since such nonsignificance can be due to lack of power. With a
small number of studies and/or large within-study variance in individual studies, even substantial
between-study dispersion might yield a nonsiginificant Q statistic (Borenstein et al., 2009). In the
forest plot shown in Figure 9, we had narrow confidence intervals (small within-study variance)
in large studies, such as Studies 8a and 8b, but in many other studies with small samples (e.g.,
Studies 16 and 18), the within-study variance and associated confidence intervals were large. In

72
addition to the highly discrepant sample sizes (see Table 4), studies varied in terms of the follow-
up periods, sample characteristics, and also intervention received. For example, the eligibility
criteria for participation in Study 12 (Wood et al., 2007) were geared toward enrolling high-risk
heavy drinkers: (a) 14 or more drinks per week for men and 10 per week for women; (b) at least
one episode of heavy drinking in the past 30 days; and (c) endorsement of at least two alcohol-
related consequences in the past year. Although Wood et al. excluded and referred the students
who reported more than 40 drinks per week and/or exhibited moderate to severe dependence to
the university counseling center, this sample placed on the extreme end of risk for excessive and
problematic drinking (see Huh et al., 2014 for alcohol use data across studies). Furthermore, this
sample was estimated to have the lowest levels of PBS at baseline across all 10 studies (see
Figure 10). For these reasons, when we excluded data from Study 12, the results from the
remaining nine studies indicated a favorable outcome for the intervention group at follow-up;
overall mean difference = 0.08, with 95% confidence interval ranging from 0.01 to 0.15 (see
Figure 11).
The point about this subsequent analysis without Study 12 is not to draw a conclusion
that the intervention was efficacious for increasing the utilization of PBS, which was not the case
for the pooled sample of 10 studies, but to suggest that the intervention’s role in the utilization of
PBS may differ depending on the levels of alcohol use and their PBS utilization at baseline. To
test this hypothesis, however, a further investigation is required that incorporates individual-level
covariates in the model. Without examining the individual level data, drawing any conclusion
based on study-level data (like the one that we tentatively discussed here) may be subject to
ecological fallacy, and lead to inaccurate inference about how changes occur following an
intervention.

73
Multivariate Meta-analysis
For multivariate meta-analysis, we had the following inclusion criteria: at least two
intervention arms were used and participants were randomly assigned to these groups (Studies 5,
6, and 17 excluded); and the intervention utilized should not be unique (Studies 4, 7, and 19
excluded). Studies 15 and 16 were further excluded because they were exclusively for first-year
female students, which represented a missing data problem (due to no variability) for two
covariates (first-year student and gender) and posed a difficulty at the second stage of combining
estimates. In addition, these latter two studies were small in sample size, were conducted on the
same college campus by the same investigators, and utilized the same intervention (i.e., GMI).
Due to the elimination of other GMI studies, these two studies became unique in the pooled data
set. Of the studies that met these inclusion criteria, we further removed some conditions (e.g.,
alcohol expectancy challenge, parent-based intervention, or MI without PF) because they were
deemed sufficiently different from other intervention conditions and/or were unique to studies
and could not be linked. Studies 13 and 14 were combined into one study for the purpose of
analysis. Study 13 included an MI + PF intervention and a stand-alone PF intervention, and
Study 14 included an MI + PF intervention and an assessment-only control group. In-person MIs
combined with PF in both studies were, by and large, identical (i.e., high risk samples, same PF
design, led by the same investigators, and on the same campus), and there were no baseline
differences across these two groups. In addition, these two studies had very small samples. Thus,
we collapsed these two studies into one combined study, allowing an MI + PF group and a PF to
be contrasted with a control condition.
Table 5 shows that only a subset of studies provides information for direct, head-to-head
comparisons of intervention groups. For example, for a head-to-head, direct comparison between

74
MI + PF and PF, data from Studies 1, 9, 13/14, and 21 can be analyzed. For a comparison
between MI + PF and Alcohol Education, data from Studies 3, 9, and 13/14 can be utilized. For a
comparison between MI + PF and control, Studies 9, 10, 12, 13/14, 20, 21, and 22 can be
analyzed. However, for these potential subset analyses, eligible studies would be different, and
the number of studies to be analyzed would be much smaller than the entire sample of eligible
studies. This would be an inefficient use of available data and could also create inconsistent
findings due to different data sets being analyzed for different comparisons. Furthermore, this
subsetting strategy does not accommodate the fact that some of the intervention conditions are
from the same studies and are hence related. Multivariate meta-analysis overcomes these data
characteristics by taking advantage of all available information from all studies.
We first fit a random intercept model using NR latent trait scores as an outcome variable
separately for each study. The regression model included a total of 15 covariate terms (see Table
6). Alcohol outcomes following an intervention among college students typically show a pattern
of an immediate decline followed by a rebound (e.g., Mun, White, & Morgan, 2009). Thus, we
modeled the outcome over time by using a quadratic growth model (month post intervention as a
time variable). We included three covariates to control for their differences in alcohol-related
problems—being male, White, and first-year student. In addition, we included PBS scores at
baseline as a covariate because it was related to missing data at follow-ups in some of the studies.
To test intervention effects, we added interaction terms between each of the growth parameters
(i.e., linear and quadratic growth slopes) and each of the three intervention groups (i.e., MI + PF,
PF, and Alcohol Education). Naturally, three variables to contrast the three intervention groups
against control were also included in the model. Note that the actual model for each study was
different due to missing covariates at the study level. For example, if a study did not assess PBS,

75
the model had a total of 14 covariates (e.g., Study 13/14 in Table 6). Similarly, for studies that
had just one follow-up, any coefficients involving a quadratic growth parameter could not be
estimated. The overall pattern of covariates analyzed for each study is shown in Table 6.
After analyzing this common model for all 16 studies in 15 runs (because Studies 13 and
14 were combined into one), at the second stage, a vector of the estimates of regression
coefficients and their covariance matrix were obtained for each study and combined with the
estimates from other studies. We had a maximum of 15 covariates per model. Once the
coefficients for a maximum of 15 covariates were estimated separately for each study, at the
second stage, they were combined across studies. These estimates were then further analyzed
using the formulas and the REML estimation approach shown in the IPD Meta-analysis and
Integrative Data Analysis section.
As indicated previously, the multivariate method utilized for this data example combines
multivariate estimates from multiple studies simultaneously and borrows information, when
information is missing, from other studies by incorporating information from their correlations.
This approach differs from existing multivariate meta-analysis approaches utilizing AD. This
approach also differs from those combining single or bivariate estimates from multiple studies in
the sense that what is integrated across studies is the entire multilevel model specified at the first
stage of multivariate meta-analysis. This IPD multivariate meta-analysis approach utilizes more
data and the combined multilevel model from the second stage can be interpreted and utilized for
subsequent investigations.
Table 7 shows the IPD multivariate meta-analysis results that combined multilevel
models. After adjusting for the effects of other covariates, Alcohol Education had higher levels
of NR problems compared to control, due to their baseline difference (see Figures 12–14) that

76
was maintained throughout the follow-up period. In-person MI combined with PF (MI + PF) or
PF did not differ from control. For the efficacy of these interventions, we focused on the
interaction terms between growth parameters and intervention conditions. There was a
statistically significant interaction effect on NR problems between the linear slope of growth and
MI + PF. The interaction term between the quadratic growth parameter and MI + PF was not
statistically significant. These two terms are highlighted in bold in Table 7 because it is
impossible to evaluate any growth trends or growth-related effects in a compartmentalized,
piecewise manner. In a typical growth curve model, for those whose initial levels are high, their
subsequent growth trends tend to be subdued. It would be misleading to focus on one growth
parameter without considering the other as the first-order polynomial term (linear) is dominated
by the second-order term (quadratic) in growth models.
Thus, to demonstrate this intervention effect as a whole, we estimated the NR trait levels
at two important follow-up periods—6 months and 12 months post intervention—by plugging
the meta-analyzed regression coefficients into the model and calculating the estimated latent trait
scores for the intervention groups. For some studies, this resulted in extrapolated estimates and
for others, these were actual estimates based on observed data (see Figures 12–14). Note that
confidence intervals (and error bars) in Figures 12–14 were calculated by using different
formulas depending on the focus of the comparisons (within-group vs. between-group). In
estimation, we used the following values for covariates: Male = 1, first-year = 1, White = 1, and
PBS = average value. Negative NR scores were due to anchoring (of a group in IRT analysis)
and shorter bars indicate more severe problems for the present data in Figure 12.
Since first-year students tended to have more severe problems and those with greater PBS
had lower levels of problems, depending on the covariate of interest, these bar graphs could be

77
adjusted a little lower (or longer; i.e., less serious problems) for non-first-year students and for
those with higher levels of PBS at baseline. Relatively speaking, there was a trend toward
improvement for PF and MI + PF. Figure 13 shows the statistically significant reductions from
baseline at 6-month follow-up, but not at 12-month follow-up for control, PF, and MI + PF. No
evidence of change was found for Alcohol Education. Higher difference scores (positive scores
on y-axis) indicate higher levels of NR trait scores at follow-ups relative to their baseline levels
(i.e., NR score went up), whereas lower difference scores (negative scores on y-axis) indicate
reductions in NR scores at 6-month and 12-month follow-ups, compared to baseline. Given that
control also significantly reduced NR at 6-month follow-up (zero not included in 95%
confidence interval), the significant reductions shown by both the PF and MI + PF groups could
not be attributed to the interventions received. Thus, we then specifically compared the changes
shown by three intervention groups against the change by control. Figure 14 shows the results.
Compared to control, MI + PF showed significantly lower levels of NR at both 6-month and 12-
month follow-ups. Those in the MI + PF condition were significantly better than those who
received no intervention at both 6-month and 12-month follow-ups (zero not included in the 95%
confidence intervals; Figure 14).
A few other things may be worth mentioning. Confidence intervals for 12-month
outcome data were greater than those for 6-month data, which reflects greater uncertainty at 12-
month follow-up, especially for PF. Second, Alcohol Education exhibited greater problems at all
three assessment time points, reflecting their baseline differences. Combined with the data shown
in Figure 13, we can say that Alcohol Education neither made it worse nor better for participants.
The participants assigned to Alcohol Education more or less maintained their NR levels. This
analysis was repeated for another dimension of alcohol-related problems and the results were

78
largely similar (not reported). Thus, we can conclude that first, an in-person MI combined with
PF does make a difference in ameliorating alcohol-related problems among college students, at
least for 12 months; second, a stand-alone PF is not helpful for reducing alcohol-related
problems, compared to control.
This finding is similar to the one reported in Huh et al. (2014) that utilized different
analytic methodologies for a slightly different set of studies from Project INTEGRATE. In Huh
et al., we used Bayesian multilevel over-dispersed Poisson hurdle models to estimate
intervention effects on drinks per week and peak drinking, and Gaussian models for alcohol
problems in one-step IDA analysis. To overcome the unbalanced design, it utilized a three-level
multilevel model, in which study-by-intervention condition was used as the highest, third level
(repeated measures as the first level and individuals as the second level). To derive the overall
intervention efficacy estimate (overall efficacy), as well as estimates for each of the intervention
groups, it utilized posterior distributions from Bayesian analysis. The results indicated that there
was no evidence of the overall intervention (BMI vs. control) effect on any of the outcomes
examined but there was a small intervention effect by MI + PF on alcohol-related problems (Huh
et al., 2014).
The substantive conclusion made in the current chapter is significant because the field of
college alcohol interventions has embraced web-based normative feedback interventions, based
on the previous findings from single studies that suggested that stand-alone PF interventions are
just as efficacious as in-person MIs with PF at least for short term (e.g., see Walters & Neighbors,
2005 for a review). The current finding suggests that to reduce alcohol-related harm, an in-
person MI may be needed. Although web-based interventions are easier to reach those who are in
need and are attractive for their scalability, the findings from IDA investigations cautiously

79
suggest a need to delve further into the mechanisms behind an in-person MI combined with PF
and to develop new interventions that may be more efficacious.
Note that the analytical examples shown in this chapter, as well as the one in Huh et al.
(2014), are computationally demanding although the nature of the challenges is different. For the
current IPD multivariate meta-analysis, the dimension of covariates was an important factor to
consider. We added just four demographic covariates to the model, but the analysis required 15 x
15 covariance matrices to be pooled across 15 separate analyses (with Studies 13 and14
combined). The estimation of between-study covariance matrix was quite challenging, especially
with the embedded missing data in these matrices. Despite these challenges noted, the data
examples shown in this section demonstrate new possibilities for the field of meta-analysis and
IDA. Instead of focusing on qualitative and/or subjective interpretations of the relevant literature
or counting the number of studies with a statistically significant intervention effect, IDA can be
utilized by using more advanced and flexible methodologies developed in recent years. It can
overcome inherent limitations of single studies and AD meta-analysis. The value of fully
utilizing existing data has been important and will most likely remain important in the coming
years.
Software Programs and Packages
There are commercially available software packages, such as Comprehensive Meta-
analysis (CMA; Borenstein, Hedges, Higgins, & Rothstein, 2005) and MetAnalysis (Leandro,
2005), as well as other free DOS-based programs for univariate meta-analysis. The various
features and different levels of usability have been reviewed in great detail by Bax, Yu, Ikeda,
and Moons (2007). Table 8 lists available meta-analysis packages developed for R (R Core Team,
2014) and user-defined commands developed for Stata (StataCorp, 2013). For multivariate

80
methods, metafor (Viechtbauer, 2010) can perform multivariate meta-analysis under fixed- and
random-effects models, and the latter can be fitted through MLE or REML. In contrast, mvtmeta
package (Chen, 2012) performs multivariate meta-analysis using the method of moments
estimator for between-study covariance matrix when fitting random-effects model; mvmeta
package (Gasparrini, Armstrong, & Kenward, 2012) uses the same method of moments
estimation but allows missing data and handles meta-regression; metaSEM package (Cheung,
2014) offers functions to perform fixed-effects and random-effects multivariate meta-analysis
under the framework of structural equation modelling. All of these packages can handle both AD
and IPD.
For the multivariate meta-analysis illustrated in the present chapter, we developed our
own functions to use in the R programming environment. The existing packages for multivariate
meta-analysis discussed above could not be applied due to the complex data structure that we
had. As indicated previously in the Multivariate Meta-analysis section, the dimension of the data
estimated was high (15 x 15 covariance matrix) and this complexity was compounded with
missing data. Thus, the second author wrote custom functions that were suited for our data.
Essentially, the idea was to obtain the likelihood function while incorporating the missing data
structure, which could not be accomplished using the existing packages. More specifically, we
estimated the 15 x 15 between-study covariance matrix using REML by using the R package
optimx. We also utilized different methods available in the optimx package (Nash & Varadhan,
2011) to confirm the final estimates reported in this chapter. We then calculated meta-analyzed
individual coefficient estimates (reported in Table 7) by plugging the REML estimates into the
last two equations shown in the IPD Meta-analysis and Integrative Data Analysis section.
Figures 12-14 were drawn using the combined individual estimates in Table 7.

81
TRANSLATIONAL IMPLICATIONS OF INTEGRATIVE DATA ANALYSIS
IDA is an emerging methodological approach that is well suited for translational research.
Translational research, although variously understood by different people, is generally known as
the “bench-to-bedside” translation of knowledge from basic sciences to produce new clinical or
treatment options for patients (Woolf, 2008). Through this translation, a new clinical treatment
can be brought to scale to treat hard-to-treat problems and to narrow health disparities. For the
successful translation of knowledge for evidence-based, bedside clinical practice, however, the
integrity and validity of evidence is critical: Evidence-based practice is only as good and valid as
the evidence that it is based on.
IDA, especially meta-analysis using IPD, has many promising utilities over single studies
and over traditional meta-analysis utilizing summary data from published reports. More broadly,
with regard to translational research, IDA may have at least three unique advantages. First, IDA
studies using IPD can scrutinize existing findings in the literature and generate more robust
findings and conclusions than possible based on single studies or traditional meta-analysis.
Second, via IDA, one can examine mechanisms of behavior change with data that are better
suited to address them. Third, through the advanced, state-of-the-art multivariate models, one can
overcome compartmentalized pieces of evidence at various levels of analysis to create a more
comprehensive understanding based on integrative quantitative evidence.
In terms of scrutinizing existing findings and strengthening our statistical inference,
meta-analysis is increasingly seen as an important tool to shore up our confidence in evidence. In
the present chapter, we suggested that traditional meta-analysis using summary statistics may be
viewed as part of IDA using IPD, a broader research synthesis approach involving original raw

82
participant-level data. Both of these approaches are expected to be relied on in the coming years;
yet more advances and applications may be in store for IDA using IPD. There have been public
calls to raise research standards for single studies and, in response, several stake holders, such as
editors of major journals and the National Institutes of Health (NIH), have proposed a number of
changes in research practice (Collins & Tabak, 2014). According to Collins and Tabak, one of
the initiatives considered by NIH is to develop a searchable data index for locating and accessing
primary data. Thus, IDA using IPD may be called upon to provide a “self-correcting” function of
science, especially for preclinical research, at more rapid pace than before.
Even for clinical research, the examples of antidepressant medications (Turner et al.,
2008) and reanalysis of randomized controlled trials (Ebrahim et al., 2014) reviewed earlier in
the current chapter illustrate the dangers of overly relying on data from published single studies.
Therefore, from this perspective, it is promising that researchers are calling for a need to build
participatory, prospective collaborative projects to tackle hallmark clinical questions such as
what works (on the whole), what works for whom (subgroups or treatment modifiers), and how it
works (mechanisms of behavior change) through innovative analysis of pooled data from
multiple RCTs (e.g., Collaborative Data Synthesis for Adolescent Depression Trials [CDSADT;
NIMH Collaborative Data Synthesis for Adolescent Depression Trials Study Team, 2013]).
In addition, it is very attractive that, via IDA, one can transcend compartmentalized or
reduced pieces of evidence at various levels of analysis. In its place, one can generate a new
understanding that is based on integrated quantitative evidence, which has been largely
unobtainable from single studies or review studies that exclusively rely on summary data from
single studies. Using IDA, similar studies can be linked to provide comparative evidence of
various treatment approaches; generate evidence for treatment efficacy from multiple related

83
outcomes; and provide clues as to the duration of treatment efficacy. Instead of subjectively
interpreting and evaluating multiple coefficients obtained from multiple analyses in a piecemeal
fashion, we can better grasp, for example, which treatment may be best of all available
approaches in the field through the use of advanced methods well suited for IDA, as
demonstrated in the data example provided in this chapter.
FUTURE DIRECTIONS AND LIMITATIONS
The research environment for IDA is ripe in many disciplines, including that of
psychology. There are several thrusts behind this momentum. First, there is a great movement
away from the current research practices that heavily depend on null hypothesis significance
testing (NHST), toward new statistical practices that emphasize estimation of effect sizes and
confidence intervals, and meta-analysis (Cumming, 2014). The journal Psychological Science, a
flagship journal for the Association for Psychological Science, announced new changes in
publication standards and practices to be implemented starting January 2014 (Eich, 2014). To
shore up the foundations of scientific inquiries, the journal’s editors have proposed five broad
changes: (1) remove word limits for the Methods and Results sections; (2) challenge researchers
to clarify the What, Why, and How questions of the research; (3) adopt the four-item disclosure
statement aimed at making visible what goes on behind publications (i.e., undisclosed flexibility
in data collection and analysis; Simmons, Nelson, & Simonsohn, 2011); (4) promote open
practices by creating incentives to share data and materials when publishing and to declare full
research protocols in advance; and (5) emphasize effect sizes, confidence intervals, and meta-
analysis. When these changes are fully implemented, metadata repository systems that are

84
searchable and easily accessible by others will create opportunities to quickly validate existing
findings.
Second, from the perspective of exploratory, discovery-oriented investigations, the
expectation of sharing data can yield unexpected, serendipitous exploratory findings, which may
lead to a prespecified, confirmatory study. Indeed, there are many national survey datasets that
can be downloaded for public use. Moreover, in recent years, NIH has launched large, multisite
projects expecting that they can serve as seed projects for other investigations. Big initiatives,
such as the Human Connectome Project (HCP) and the National Consortium on Alcohol and
Neurodevelopment in Adolescence (NCANDA), take advantage of improved computing
capability, easier access to the web for storing and searching information, and convenient use of
biological indices to better understand a complex phenomenon across different time scales and
across different domains.
A third important thrust is the development of innovative methods for research synthesis.
As this chapter demonstrates, there has been an explosion of more flexible, efficient, and
powerful research methods to accommodate various needs, and these developments will likely
continue. With improved computing capability, we can run computationally demanding models,
such as Bayesian models that were unthinkable not long ago. Elucidating the complex
developmental processes that we see in developmental psychopathology requires a
transdisciplinary, systems prospective that cuts across scale and time, which has also been the
guiding vision at NIH to promote scientific breakthroughs (Mabry, Olster, Morgan, & Abrams,
2008). IDA is a promising new approach in the era of big data to build a knowledge base that is
more robust and cumulative and to move us forward toward more integrated and innovative
research.

85
Despite our enthusiasm for IDA, some cautionary caveats are in order. Controlled,
multisite, large studies do not always yield the same results as those from meta-analysis studies.
In addition, different meta-analytic approaches—IPD or AD and different models— can lead to
different estimates and/or conclusions (e.g., Haines & Hill, 2011). Recall, in the case of Avandia
illustrated previously, the FDA restricted marketing of the drug based on findings from several
meta-analysis studies showing greater heart attack risk, while simultaneously offering some
disclaimers stating that large-scale RCTs did not show a statistically significant risk elevation
(Finkelstein & Levin, 2012). Thus, this case demonstrates that there is a need to evaluate all
available evidence as a whole, and to be cautious about overly relying on one approach.
In addition, the time and resources required for IDA are considerable and one needs to
carefully weigh the benefits of IDA relative to the resources needed. Data processing for IDA
can be as intensive as collecting original data (Hussong et al., 2013) because of the need to
examine and scrutinize all aspects of the pooled data prior to harmonizing and conducting further
analysis to establish measurement invariance across important groups. Missing data resulted
from combining data from multiple studies also pose a huge challenge to overcome for studies
utilizing IPD.
Overall, whereas the cost of AD analysis does not depend on the number of studies
included, the time and resource needed for IDA goes up with the addition of each study
(Steinberg et al., 1997; see also Mun et al., in press). For example, for Project INTEGRATE, it
took more than 2 years before we could run analyses to examine prespecified hypotheses, despite
that these studies were generally similar in goals and designs. However, as the overall research
environment is moving toward preregistration of a trial, reporting of all outcome variables, and
better disclosure of methods and results, the environment may become more favorable for IDA

86
studies in the future. Even for nonexperimental studies, similar, more open research practices are
likely to follow, which may make it easier to conduct IDA studies.
CONCLUSIONS
Systematic research synthesis, particularly IDA involving original IPD from multiple
sources, provides exciting new capabilities. IDA is well suited to address unmet needs in the
field of developmental psychopathology and critical challenges in the current research
environment. At the same time, there is a need to further develop research methods intended for
research synthesis and to bridge our knowledge gaps in implementing these methods for IDA.
Despite its many challenges, IDA is expected to be utilized more often in the future as a means
to strengthen our research practice and lead to new discoveries.

87
REFERENCES
Al khalaf, M. M., Thalib, L., & Doi, S. A. R. (2011). Combining heterogenous studies using the
random-effects model is a mistake and leads to inconclusive meta-analyses. Journal of
Clinical Epidemiology, 64(2), 119-123. doi: 10.1016/j.jclinepi.2010.01.009
American College Health Association (2001). National College Health Assessment ACHA-
NCHA reliability and validity analyses. Baltimore, MD: American College Health
Association.
American Psychological Association Publicaitons and Communications Board Working Group
on Journal Article Reporting Standards (2008). Reporting standards for research in
psychology: Why do we need them? What might they be? American Psychologist, 63(9),
839-851. doi: 10.1037/0003-066X.63.9.839
Atkins, D. C., Baldwin, S. A., Zheng, C., Gallop, R. J., & Neighbors, C. (2013). A tutorial on
count regression and zero-altered count models for longitudinal substance use data.
Psychology of Addictive Behaviors, 27(1), 166-177. doi: 10.1037/a0029508
Baer, J. S., Kivlahan, D. R., Blume, A. W., McKnight, P., & Marlatt, G. A. (2001). Brief
intervention for heavy-drinking college students: 4-year follow-up and natural history.
American Journal of Public Health, 91(8), 1310-1318.
Bakker, M., van Dijk, A., & Wicherts, J. M. (2012). The rules of the game called psychological
science. Perspectives on Psychological Science, 7(6), 543-554. doi:
10.1177/1745691612459060
Barnett, N. P., Murphy, J. G., Colby, S. M., & Monti, P. M. (2007). Efficacy of counselor vs.
computer-delivered intervention with mandated college students. Addictive Behaviors,
32(11), 2529-2548. doi: 10.1016/j.addbeh.2007.06.017

88
Bauer, D. J., & Hussong, A. M. (2009). Psychometric approaches for developing commensurate
measures across independent studies: Traditional and new models. Psychological
Methods, 14(2), 101-125. doi: 10.1037/a0015583
Bax, L., Yu, L.-M., Ikeda, N., & Moons, K. (2007). A systematic comparison of software
dedicated to meta-analysis of causal studies. BMC Medical Research Methodology, 7(1),
40. doi:10.1186/1471-2288-7-40
Begg, C. B., & Mazumdar, M. (1994). Operating characteristics of a rank correlation test for
publication bias. Biometrics, 50(4), 1088-1101. doi: 10.2307/2533446
Begley, C. G., & Ellis, L. M. (2012). Drug development: Raise standards for preclinical cancer
research. Nature, 483(7391), 531-533. doi: 10.1038/483531a
Bergman, L. R., & Magnusson, D. (1997). A person-oriented approach in research on
developmental psychopathology. Development and Psychopathology, 9(2), 291-319. doi:
doi:10.1017/S095457949700206X
Berman, N., & Parker, R. (2002). Meta-analysis: Neither quick nor easy. BMC Medical Research
Methodology, 2(1), 10. doi: 10.1186/1471-2288-2-10
Borenstein, M., Hedges, L. V., Higgins, J. P. T., & Rothstein, H. R. (2005). Comprehensive
Meta-Analysis (Version 2) [Computer software]. Engelwood, NJ: Biostat.
Borenstein, M., Hedges, L. V., Higgins, J. P. T., & Rothstein, H. R. (2009). Introduction to meta-
analysis. West Sussex, UK: Wiley.
Borenstein, M., Hedges, L. V., Higgins, J. P. T., & Rothstein, H. R. (2010). A basic introduction
to fixed-effect and random-effects models for meta-analysis. Research Synthesis Methods,
1(2), 97-111. doi: 10.1002/jrsm.12
89
Borenstein, M., & Higgins, J. P. T. (2013). Meta-analysis and subgroups. Prevention Science,
14(2), 134-143. doi: 10.1007/s11121-013-0377-7
Bradburn, M. J., Deeks, J. J., Berlin, J. A., & Russell Localio, A. (2007). Much ado about
nothing: A comparison of the performance of meta-analytical methods with rare events.
Statistics in Medicine, 26(1), 53-77. doi: 10.1002/sim.2528
Breslow, N. (1981). Odds ratio estimators when the data are sparse. Biometrika, 68(1), 73-84.
doi: 10.2307/2335807
Brown, C. H., Sloboda, Z., Faggiano, F., Teasdale, B., Keller, F., Burkhart, G., . . . Perrino, T.
(2013). Methods for synthesizing findings on moderation effects across multiple
randomized trials. Prevention Science, 14(2), 144-156. doi: 10.1007/s11121-011-0207-8
Brown, L. D., Cai, T. T., & DasGupta, A. (2001). Interval estimation for a binomial proportion.
Statistical Science, 16(2), 101-117. doi: 10.2307/2676784
Carey, K. B., Scott-Sheldon, L. A., Carey, M. P., & DeMartini, K. S. (2007). Individual-level
interventions to reduce college student drinking: A meta-analytic review.
Addictive Behaviors, 32(11), 2469-2494. doi: 10.1016/j.addbeh.2007.05.004
Carey, K. B., Scott-Sheldon, L. A., Elliott, J. C., Garey, L., & Carey, M. P. (2012). Face-to-face
versus computer-delivered alcohol interventions for college drinkers: A meta-analytic
review, 1998 to 2010. Clinical Psychology Review, 32(8), 690-703. doi:
10.1016/j.cpr.2012.08.001
Chalmers, I. (2003). Trying to do more good than harm in policy and practice: The role of
rigorous, transparent, up-to-date evaluations. The ANNALS of the American Academy of
Political and Social Science, 589(1), 22-40. doi: 10.1177/0002716203254762

90
Chalmers, I., & Matthews, R. (2006). What are the implications of optimism bias in clinical
research? The Lancet, 367(9509), 449-450. doi: 10.1016/S0140-6736(06)68153-1
Chalmers, T. C., Smith Jr, H., Blackburn, B., Silverman, B., Schroeder, B., Reitman, D., &
Ambroz, A. (1981). A method for assessing the quality of a randomized control trial.
Controlled Clinical Trials, 2(1), 31-49. doi: 10.1016/0197-2456(81)90056-8
Chassin, L., Rogosch, F., & Barrera, M. (1991). Substance use and symptomatology among
adolescent children of alcoholics. Journal of Abnormal Psychology, 100, 449-463.
Chen, H. (2012). mvtmeta: Multivariate meta-analysis (R package version 1.0). Available from
http://cran.r-project.org/web/packages/mvtmeta/mvtmeta.pdf
Cheung, M. W.-L. (2014). Fixed- and random-effects meta-analytic structural equation modeling:
Examples and analyses in R. Behavior Research Methods, 46, 29-40.
doi:10.3758/s13428-013-0361-y
Cicchetti, D., & Toth, S. L. (2009). The past achievements and future promises of developmental
psychopathology: the coming of age of a discipline. Journal of Child Psycholgy and
Psychiatry, 50(1-2), 16-25. doi: 10.1111/j.1469-7610.2008.01979.x
Cimini, M. D., Martens, M. P., Larimer, M. E., Kilmer, J. R., Neighbors, C., & Monserrat, J. M.
(2009). Assessing the effectiveness of peer-facilitated interventions addressing high-risk
drinking among judicially mandated college students. Journal of Studies on Alcohol and
Drugs. Supplement(16), 57-66.
Claggett, B., Xie, M., & Tian, L. (2014). Meta-analysis with fixed, unknown, study-specific
parameters. (under review) Accessible at
http://www.stat.rutgers.edu/home/mxie/RCPapers/Final.CDOS_JASA_unblind.pdf

91
Cochran, W. G. (1950). The comparison of percentages in matched samples. Biometrika, 37(3/4),
256–266. doi:10.1093/biomet/37.3-4.256.
Cohen, J. (1988). Statistical power analysis for the behavioral sciences. Hillsdale, NJ: Erlbaum.
Collins, F. S., & Tabak, L. A. (2014). NIH plans to ehnance reproducibility. Nature, 505, 612-
213.
Cooper, H., & Patall, E. A. (2009). The relative benefits of meta-analysis conducted with
individual participant data versus aggregated data. Psychological Methods, 14(2), 165-
176. doi: 10.1037/a0015565
Cronce, J. M., & Larimer, M. E. (2011). Individual-focused approaches to the prevention of
college student drinking. Alcohol Research & Health, 34(2), 210-221.
Cumming, G. (2014). The new statistics: Why and how. Psychological Science, 25(1), 7-29. doi:
10.1177/0956797613504966
Cumming, G., & Maillardet, R. (2006). Confidence intervals and replication: Where will the next
mean fall? Psychological Methods, 11(3), 217-227. doi: 10.1037/1082-989X.11.3.217
Curran, P. J. (2009). The seemingly quixotic pursuit of a cumulative psychological science:
Introduction to the special issue. Psychological Methods, 14(2), 77-80. doi:
10.1037/a0015972
Curran, P. J., & Hussong, A. M. (2009). Integrative data analysis: The simultaneous analysis of
multiple data sets. Psychological Methods, 14(2), 81-100. doi: 10.1037/a0015914
Curran, P. J., Hussong, A. M., Cai, L., Huang, W., Chassin, L., Sher, K. J., & Zucker, R. A.
(2008). Pooling data from multiple longitudinal studies: the role of item response theory
in integrative data analysis. Developmental Psychology, 44(2), 365-380. doi:
10.1037/0012-1649.44.2.365

92
Curran, P. J., McGinley, J. S., Bauer, D. J., Hussong, A. M., Burns, A., Chassin, L., . . . Zucker,
R. (2014). A moderated nonlinear factor model for the development of commensurate
measures in integrative data analysis. Multivariate Behavioral Research, 49(3), 214-231.
doi: 10.1080/00273171.2014.889594
D’Amico, E. J., & Fromme, K. (1997). Health risk behaviors of adolescent and young adult
siblings. Health Psychology, 16(5), 426-432. doi: 10.1037/0278-6133.16.5.426
Davey, J., Turner, R. M., Clarke, M. J., & Higgins, J. P. (2011). Characteristics of meta-analyses
and their component studies in the Cochrane Database of Systematic Reviews: a cross-
sectional, descriptive analysis. BMC Medical Research Methodology, 11(1), 160.
doi:10.1186/1471-2288-11-160.
Doornik, J. A. (2009). Object-oriented matrix programming using Ox (Version 3.1) [Computer
software]. London, UK: Timberlake Consultants.
DerSimonian, R., & Laird, N. (1986). Meta-analysis in clinical trials. Controlled Clinical Trials,
7(3), 177-188. doi: 10.1016/0197-2456(86)90046-2
Donovan, E., Wood, M., Frayjo, K., Black, R. A., & Surette, D. A. (2012). A randomized,
controlled trial to test the efficacy of an online, parent-based intervention for reducing the
risks associated with college-student alcohol use. Addictive Behaviors, 37(1), 25-35. doi:
10.1016/j.addbeh.2011.09.007
Duval, S., & Tweedie, R. (2000). Trim and fill: A simple funnel-plot–based method of testing
and adjusting for publication bias in meta-analysis. Biometrics, 56(2), 455-463. doi:
10.1111/j.0006-341X.2000.00455.x
93
Ebrahim, S., Sohani, Z. N., Montoya, L., Agarwal, A., Thorlund, K., Mills, E. J., & Ioannidis, J.
P. A. (2014). Reanalyses of randomized clinical trial data. Journal of American Medical
Association, 312(10), 1024-1032. doi: 10.1001/jama.2014.9646
Egger, M., Smith, G. D., Schneider, M., & Minder, C. (1997). Bias in meta-analysis detected by
a simple, graphical test. British Medical Journal, 315(7109), 629-634. doi:
10.1136/bmj.315.7109.629
Eich, E. (2014). Business not as usual. Psychological Science, 25(1), 3-6. doi:
10.1177/0956797613512465
Ferguson, C. J., & Brannick, M. T. (2012). Publication bias in psychological science: Prevalence,
methods for identifying and controlling, and implications for the use of meta-analyses.
Psychological Methods, 17(1), 120-128. doi: 10.1037/a0024445
Finkelstein, M. O., & Levin, B. (2012). Meta-analysis of "sparse" data: Perspectives from the
Avandia cases. Jurimetrics, 52(2), 123-153.
Fisher, R. A. (1948). Questions and answers #14. The American Statistician, 2(5), 30–31. doi:
10.2307/2681650
Ford, D. H., & Lerner, R. M. (1992). Developmental systems theory. Newbury Park, CA: SAGE.
Fromme, K., & Corbin, W. (2004). Prevention of heavy drinking and associated negative
consequences among mandated and voluntary college students. Journal of Consulting
and Clinical Psychology, 72(6), 1038-1049. doi: 10.1037/0022-006X.72.6.1038
Gart, J. J. (1970). Point and interval estimation of the common odds ratio in the combination of 2
× 2 tables with fixed marginals. Biometrika, 57(3), 471-475. doi: 0.1093/biomet/57.3.471

94
Gasparrini, A., Armstrong, B., & Kenward, M. G. (2012). Multivariate meta-analysis for non-
linear and other multi-parameter associations. Statistics in Medicine, 31(29), 3821-3839.
doi: 10.1002/sim.5471.
Haines, T. P., & Hill, A.-M. (2011). Inconsistent results in meta-analyses for the prevention of
falls are found between study-level data and patient-level data. Journal of Clinical
Epidemiology, 64(2), 154-162. doi: 10.1016/j.jclinepi.2010.04.024
Herbison, P., Hay-Smith, J., & Gillespie, W. J. (2006). Adjustment of meta-analyses on the basis
of quality scores should be abandoned. Journal of Clinical Epidemiology, 59(12),
1249.e1241-1249.e1211. doi: 10.1016/j.jclinepi.2006.03.008
Higgins, J. P. T., & Green, S. (Eds.). (2011). Cochrane handbook for systematic reviews of
interventions (ver 5.1.0). Available from www.cochrane-handbook.org: The Cochrane
Collaboration.
Higgins, J. P. T., & Thompson, S. G. (2002). Quantifying heterogeneity in a meta-analysis.
Statistics in Medicine, 21(11), 1539-1558. doi: 10.1002/sim.1186
Hoaglin, D. C., Hawkins, N., Jansen, J. P., Scott, D. A., Itzler, R., Cappelleri, J. C., . . . Barrett, A.
(2011). Conducting indirect-treatment-comparison and network-meta-analysis studies:
Report of the ISPOR Task Force on indirect treatment comparisons good research
practices: Part 2. Value in Health, 14(4), 429-437. doi: 10.1016/j.jval.2011.01.011
Huh, D., Mun, E.-Y., Larimer, M. E., White, H. R., Ray, A. E., Rhew, I., … Atkins, D. C. (2014).
Brief motivational interventions for college student drinking may not be as powerful as
we think: An individual participant-level data meta-analysis. (under review)
Huo, Y., de la Torre, J., Mun, E.-Y., Kim, S.-Y., Ray, A. E., Jiao, Y., & White, H. R. (2014). A
hierarchical multi-unidimensional IRT approach for analyzing sparse, multi-group data

95
for integrative data analysis. Psychometrika. Advance online publication.
doi:10.1007/s11336-014-9420-2
Hurlbut, S. C., & Sher, K. J. (1992). Assessing alcohol problems in college students. Journal of
American College Health, 41(2), 49-58. doi: 10.1080/07448481.1992.10392818
Hussong, A. M., Curran, P. J., & Bauer, D. J. (2013). Integrative data analysis in clinical
psychology research. The Annual Review of Clinical Psychology, 9(1), 61-89.
doi:10.1146/annurev-clinpsy-050212-185522
Hussong, A. M., Huang, W., Curran, P. J., Chassin, L., & Zucker, R. A. (2010). Parent
alcoholism impacts the severity and timing of children’s externalizing symptoms. Journal
of Abnormal Child Psychology, 38(3), 367-380. doi: 10.1007/s10802-009-9374-5
Hussong, A. M., Wirth, R. J., Edwards, M. C., Curran, P. J., Chassin, L. A., & Zucker, R. A.
(2007). Externalizing symptoms among children of alcoholic parents: Entry points for an
antisocial pathway to alcoholism. Journal of Abnormal Psychology, 116(3), 529-542. doi:
10.1037/0021-843X.116.3.529
Ioannidis, J. P. A. (2005). Why most published research findings are false. PLoS Med, 2(8), e124.
doi: 10.1371/journal.pmed.0020124
Ioannidis, J. P. A. (2012). Why science is not necessarily self-correcting. Perspectives on
Psychological Science, 7(6), 645-654. doi: 10.1177/1745691612464056
Ioannidis, J. P. A., Gwinn, M., Little, J., Higgins, J. P. T., Bernstein, J. L., Boffetta, P., . . . , &
The Human Genome Epidemiology Network and the Network of Investigator Networks
(2006). A road map for efficient and reliable human genome epidemiology. Nature
Genetics, 38(1), 3-5. doi: 10.1038/ng0106-3

96
Jackson, D., Riley, R., & White, I. R. (2011). Multivariate meta-analysis: Potential and promise.
Statistics in Medicine, 30(20), 2481-2498. doi: 10.1002/sim.4172
Jackson, D., White, I. R., & Thompson, S. G. (2010). Extending DerSimonian and Laird's
methodology to perform multivariate random effects meta-analyses. Statistics in
Medicine, 29(12), 1282-1297. doi: 10.1002/sim.3602
Jansen, J. P., Fleurence, R., Devine, B., Itzler, R., Barrett, A., Hawkins, N., . . . Cappelleri, J. C.
(2011). Interpreting indirect treatment comparisons and network meta-analysis for health-
care decision making: Report of the ISPOR Task Force on indirect treatment comparisons
good research practices: Part 1. Value in Health, 14(4), 417-428. doi:
10.1016/j.jval.2011.04.002
Kahler, C. W., Strong, D. R., & Read, J. P. (2005). Toward efficient and comprehensive
measurement of the alcohol problems continuum in college students: The Brief Young
Adult Alcohol Consequences Questionnaire. Alcoholism: Clinical and Experimental
Research, 29(7), 1180-1189. doi: 10.1097/01.alc.0000171940.95813.a5
Kraemer, H., Mintz, J., Noda, A., Tinklenberg, J., & Yesavage, J. A. (2006). Caution regarding
the use of pilot studies to guide power calculations for study proposals. Archives of
General Psychiatry, 63(5), 484-489. doi: 10.1001/archpsyc.63.5.484
Kuntsche, E., Rossow, I., Simons-Morton, B., Bogt, T. T., Kokkevi, A., & Godeau, E. (2013).
Not early drinking but early drunkenness is a risk factor for problem behaviors among
adolescents from 38 European and North American countries. Alcoholism: Clinical and
Experimental Research, 37(2), 308-314. doi: 10.1111/j.1530-0277.2012.01895.x
LaBrie, J. W., Huchting, K., Tawalbeh, S., Pedersen, E. R., Thompson, A. D., Shelesky, K., . . .
Neighbors, C. (2008). A randomized motivational enhancement prevention group reduces

97
drinking and alcohol consequences in first-year college women. Psychology of Addictive
Behaviors, 22(1), 149-155. doi: 2008-01797-017 [pii]10.1037/0893-164X.22.1.149
LaBrie, J. W., Huchting, K. K., Lac, A., Tawalbeh, S., Thompson, A. D., & Larimer, M. E.
(2009). Preventing risky drinking in first-year college women: Further validation of a
female-specific motivational-enhancement group intervention. Journal of Studies on
Alcohol and Drugs, Suppl(16), 77-85.
LaBrie, J. W., Hummer, J. F., Neighbors, C., & Pedersen, E. R. (2008). Live interactive group-
specific normative feedback reduces misperceptions and drinking in college students: A
randomized cluster trial. Psychology of Addictive Behaviors, 22(1), 141-148. doi: 2008-
01797-016 [pii] 10.1037/0893-164X.22.1.141
LaBrie, J. W., Lamb, T. F., Pedersen, E. R., & Quinlan, T. (2006). A group motivational
interviewing intervention reduces drinking and alcohol-related consequences in
adjudicated college students. Journal of College Student Development, 47(3), 267-280.
LaBrie, J. W., Pedersen, E. R., Lamb, T. F., & Quinlan, T. (2007). A campus-based motivational
enhancement group intervention reduces problematic drinking in freshmen male college
students. Addictive Behaviors, 32(5), 889-901. doi: 10.1016/j.addbeh.2006.06.030
LaBrie, J. W., Thompson, A., Huchting, K., Lac, A., & Buckley, K. (2007). A group
motivational interviewing intervention reduces drinking and alcohol-related negative
consequences in adjudicated college women. Addictive Behaviors, 32(11), 2549-2562.
doi: 10.1016/j.addbeh.2007.05.014
Larimer, M. E., & Cronce, J. M. (2007). Identification, prevention, and treatment revisited:
individual-focused college drinking prevention strategies 1999-2006. Addictive Behaviors,
32(11), 2439-2468. doi: 10.1016/j.addbeh.2007.05.006

98
Larimer, M. E., Lee, C. M., Kilmer, J. R., Fabiano, P. M., Stark, C. B., Geisner, I. M., . . .
Neighbors, C. (2007). Personalized mailed feedback for college drinking prevention: A
randomized clinical trial. Journal of Consulting and Clinical Psychology, 75(2), 285-293.
doi: 10.1037/0022-006X.75.2.285
Larimer, M. E., Turner, A. P., Anderson, B. K., Fader, J. S., Kilmer, J. R., Palmer, R. S., &
Cronce, J. M. (2001). Evaluating a brief alcohol intervention with fraternities. Journal of
Studies on Alcohol, 62(3), 370-380.
Leandro, G. (2005). Meta-analysis in medical research. Malden, MA: BMJ Books.
Lee, C., & White, H. R. (2012). Effects of childhood maltreatment on violent injuries and
premature death during young adulthood among urban high-risk men. Archives of
Pediatrics & Adolescent Medicine, 166(9), 814-820. doi: 0.1001/archpediatrics.2012.244
Lee, C. M., Kaysen, D. L., Neighbor, C., Kilmer, J. R., & Larimer, M. E. (2009). Feasibility,
acceptability, and efficacy of brief interventions for college drinking: Comparison of
group, individual, and web-based alcohol prevention formats. Unpublished manuscript,
Department of Psychiatry and Behavioral Sciences, University of Washington, Seattle,
Washington.
Lin, D. Y., & Zeng, D. (2010). On the relative efficiency of using summary statistics versus
individual-level data in meta-analysis. Biometrika, 97(2), 321-332. doi:
10.1093/biomet/asq006
Liu, D., Liu, R. Y., & Xie, M. (in press a). Multivariate meta-analysis of heterogeneous studies
using only summary statistics: Efficiency and robustness. Journal of the American
Statistical Association. doi: 10.1080/01621459.2014.899235

99
Liu, D., Liu, R. Y., & Xie, M. (in press b). Exact meta-analysis approach for discrete data and its
application to 2 × 2 tables with rare events. Journal of the American Statistical
Association. doi: 10.1080/01621459.2014.946318
Loeber, R., Pardini, D., Homish, D. L., Wei, E. H., Crawford, A. M., Farrington, D. P., . . .
Rosenfeld, R. (2005). The prediction of violence and homicide in young men.
Journal of Consulting and Clinical Psycholology, 73(6), 1074-1088. doi: 10.1037/0022-
006X.73.6.1074
Mabry, P. L., Olster, D. H., Morgan, G. D., & Abrams, D. B. (2008). Interdisciplinarity and
systems science to improve population health: A view from the NIH Office of Behavioral
and Social Sciences Research. American Journal of Preventive Medicine, 35(2,
Supplement), S211-S224. doi: http://dx.doi.org/10.1016/j.amepre.2008.05.018
Magnusson, D. (2000). The individual as the organizing principle in psychological inquiry: A
holistic approach. In L. R. Bergman, R. B. Cairns, L.-G. Nilsson, & L. Nystedt (Eds.),
Developmental science and the holistic approach (pp. 33-48). Mahwah, NJ: Erlbaum.
Mantel, N., & Haenszel, W. (1959). Statistical aspects of the analysis of data from retrospective
studies of disease. Journal of the National Cancer Institute, 22, 719–748.
Marden, J. I. (1991). Sensitive and sturdy p-values. The Annals of Statistics, 19(2), 918-934. doi:
10.2307/2242091
Marszalhk, J. M., Barber, C., Kohlhart, J., & Holmes, C. B. (2011). Sample size in psychological
research over the past 30 years. Perceptual & Motor Skills, 112(2), 331-348. doi:
10.2466/03.11.pms.112.2.331-348

100
Martens, M. P., Ferrier, A. G., Sheehy, M. J., Corbett, K., Anderson, D. A., & Simmons, A.
(2005). Development of the Protective Behavioral Strategies Survey. Journal of studies
on Alcohol, 66(5), 698-705.
Martens, M. P., Kilmer, J. R., Beck, N. C., & Zamboanga, B. L. (2010). The efficacy of a
targeted personalized drinking feedback intervention among intercollegiate athletes: A
randomized controlled trial. Psychology of Addictive Behaviors, 24(4), 660-669. doi:
10.1037/a0020299
Martens, M. P., Taylor, K. K., Damann, K. M., Page, J. C., Mowry, E. S., & Cimini, M. D.
(2004). Protective behavioral strategies when drinking alcohol and their relationship to
negative alcohol-related consequences in college students. Psychology of Addictive
Behaviors, 18(4), 390-393. doi: 10.1037/0893-164X.18.4.390
McArdle, J. J., Grimm, K. J., Hamagami, F., Bowles, R. P., & Meredith, W. (2009). Modeling
life-span growth curves of cognition using longitudinal data with multiple samples and
changing scales of measurement. Psychological Methods, 14(2), 126-149. doi:
10.1037/a0015857
Moreno, S. G., Sutton, A. J., Turner, E. H., Abrams, K. R., Cooper, N. J., Palmer, T. M., & Ades,
A. E. (2009). Novel methods to deal with publication biases: secondary analysis of
antidepressant trials in the FDA trial registry database and related journal publications.
BMJ, 339, b2981. doi: 10.1136/bmj.b2981
Mun, E.-Y., Bates, M. E., & Vaschillo, E. (2010). Closing the gap between person-oriented
theory and methods. Development and Psychopathology, 22(2), 261-271. doi:
10.1017/S0954579410000039
101
Mun, E.-Y., White, H. R., & Morgan, T. J. (2009). Individual and situational factors that
influence the efficacy of personalized feedback substance use interventions for mandated
college students. Journal of Consulting and Clinical Psychology, 77(1), 88-102. doi:
10.1037/a0014679
Mun, E.-Y., de la Torre, J., Atkins, D. C., White, H. R., Ray, A. E., Kim, S.-Y., …, & The
Project INTEGRATE Team (in press). Project INTEGRATE: An integrative study of
brief alcohol intervention trials for college students. Psychology of Addictive Behaviors.
Muraki, E. (1992). A generalized partial credit model: Application of an EM algorithm. Applied
Psychological Measurement, 16(2), 159-176. doi: 10.1177/014662169201600206
Murphy, J. G., Benson, T. A., & Vuchinich, R. E. (2004). A comparison of personalized
feedback for college student drinkers delivered with and without a motivational interview.
Journal of Studies on Alcohol, 65(2), 200-203.
Murphy, J. G., Duchnick, J. J., Vuchinich, R. E., Davison, J. W., Karg, R. S., Olson, A. M., . . .
Coffey, T. T. (2001). Relative efficacy of a brief motivational intervention for college
student drinkers. Psychology of Addictive Behaviors, 15(4), 373-379.
Nash, J. C., & Varadhan, R. (2011). Unifying optimization algorithms to aid software system
users: Optimx for R. Journal of Statistical Software, 43(9), 1-14.
NIMH Collaborative Data Synthesis for Adolescent Depression Trials Study Team (2013).
Advancing science through collaborative data sharing and synthesis. Perspectives on
Psychological Science, 8(4), 433-444. doi: 10.1177/1745691613491579
Nissen, S. E., & Wolski, K. (2007). Effect of rosiglitazone on the risk of myocardial infarction
and death from cardiovascular causes. New England Journal of Medicine, 356(24), 2457-
2471. doi: 10.1056/NEJMoa072761

102
Normand, S.-L. T. (1999). Meta-analysis: formulating, evaluating, combining, and reporting.
Statistics in Medicine, 18(3), 321-359. doi: 10.1002/(sici)1097-
0258(19990215)18:3<321::aid-sim28>3.0.co;2-p
Nosek, B. A., Spies, J. R., & Motyl, M. (2012). Scientific utopia: II. Restructuring incentives and
practices to promote truth over publishability. Perspectives on Psychological Science,
7(6), 615-631. doi: 10.1177/1745691612459058
Nuzzo, R. (2014). Scientific method: Statistical errors. Nature, 506, 150-152. doi:
doi:10.1038/506150a
Open Science Collaboration (2012). An open, large-scale, collaborative effort to estimate the
reproducibility of psychological science. Perspectives on Psychological Science, 7(6),
657-660. doi: 10.1177/1745691612462588
O'Rourke, K. (2007). An historical perspective on meta-analysis: dealing quantitatively with
varying study results. Journal of the Royal Society of Medicine, 100(12), 579-582.
doi:10.1258/jrsm.100.12.579
Pashler, H., & Wagenmakers, E. J. (2012). Editors' Introduction to the Special Section on
Replicability in Psychological Science: A Crisis of Confidence? Perspectives on
Psychological Science, 7(6), 528-530. doi: 10.1177/1745691612465253
R Core Team (2014). R: A language and environment for statistical computing. Vienna, Austria:
R Foundation for Statistical Computing.
Ray, A. E., Kim, S.-Y., White, H. R., Larimer, M. E., Mun, E. Y., Clarke, N., … , & The Project
INTEGRATE Team. (in press). When less is more and more is less in brief motivational
interventions: Characteristics of intervention content and their associations with drinking
outcomes. Psychology of Addictive Behaviors. doi: 10.1037/a0036593

103
Reitsma, J. B., Glas, A. S., Rutjes, A. W. S., Scholten, R. J. P. M., Bossuyt, P. M., &
Zwinderman, A. H. (2005). Bivariate analysis of sensitivity and specificity produces
informative summary measures in diagnostic reviews. Journal of Clinical Epidemiology,
58(10), 982-990. doi: 10.1016/j.jclinepi.2005.02.022
Riley, R. (2009). Multivariate meta-analysis: The effect of ignoring within-study correlation.
Journal of the Royal Statistical Society: Series A, 172(4), 789-811. doi: 10.1111/j.1467-
985X.2008.00593.x
Robins, J., Breslow, N., & Greenland, S. (1986). Estimators of the Mantel-Haenszel variance
consistent in both sparse data and large-strata limiting models. Biometrics, 42(2), 311-
323. doi: 10.2307/2531052
Roerecke, M., & Rehm, J. (2012). The cardioprotective association of average alcohol
consumption and ischaemic heart disease: A systematic review and meta-analysis.
Addiction, 107(7), 1246-1260. doi: 10.1111/j.1360-0443.2012.03780.x
Saunders, J. B., Aasland, O. G., Babor, T. F., De La Fuente, J. R., & Grant, M. (1993).
Development of the Alcohol Use Disorders Identification Test (AUDIT): WHO
Collaborative Project on early detection of persons with harmful alcohol consumption-II.
Addiction, 88(6), 791-804. doi: 10.1111/j.1360-0443.1993.tb02093.x
Scheidler, J., Hricak, H., Yu, K. K., Subak, L., & Segal, M. R. (1997). Radiological evaluation of
lymph node metastases in patients with cervical cancer: A meta-analysis. Journal of the
American Medical Association, 278(13), 1096-1101. doi:
10.1001/jama.1997.03550130070040

104
Schulz, K. F., Altman, D. G., & Moher, D. (2010). CONSORT 2010 statement: Updated
guidelines for reporting parallel group randomised trials. PLoS Med, 7(3), e1000251. doi:
10.1371/journal.pmed.1000251
Schumann, G., Coin, L. J., Lourdusamy, A., Charoen, P., Berger, K. H., Stacey, D., . . . Elliott, P.
(2011). Genome-wide association and genetic functional studies identify autism
susceptibility candidate 2 gene (AUTS2) in the regulation of alcohol consumption.
Proceedings of the National Academy of Sciences, 108(17), 7119-7124. doi:
10.1073/pnas.1017288108
Shadish, W. R., Cook, T. D., & Campbell, D. T. (2002). Experimental and quasi-experimental
designs for generalized causal inference. New York: Houghton Mifflin.
Shentu, Y., & Xie, M. (2010). A note on dichotomization of continuous response variable in the
presence of contamination and model misspecification. Statistics in Medicine, 29(21),
2200-2214. doi: 10.1002/sim.3966
Simmonds, M. C., & Higgins, J. P. T. (2007). Covariate heterogeneity in meta-analysis: Criteria
for deciding between meta-regression and individual patient data. Statistics in Medicine,
26(15), 2982-2999. doi: 10.1002/sim.2768
Simmons, J. P., Nelson, L. D., & Simonsohn, U. (2011). False-positive psychology: Undisclosed
flexibility in data collection and analysis allows presenting anything as significant.
Psychological Science, 22, 1359-1366. doi: 10.1177/0956797611417632
Skinner, H. A., & Allen, B., A. (1982). Alcohol dependence syndrome: Measurement and
validation. Journal of Abnormal Psychology, 91(3), 199-209.
Skinner, H. A., & Horn, J. L. (1984). Alcohol Dependence Scale: Users guide. Toronto, Canada:
Addiction Research Foundation.

105
Sroufe, L. A., & Rutter, M. (1984). The domain of developmental psychopathology. Child
Development, 55(1), 17-29. doi: 10.2307/1129832
StataCorp. (2013). Stata statistical software (version 13) [Computer software]. College Station,
TX: StataCorp LP.
Steenkamp, J.-B. E. M., & Baumgartner, H. (1998). Assessing measurement invariance in cross-
national consumer research. Journal of Consumer Research, 25, 78-107. doi:
10.1086/209528
Steinberg, K. K., Smith, S. J., Stroup, D. F., Olkin, I., Lee, N. C., Williamson, G. D., & Thacker,
S. B. (1997). Comparison of effect estimates from a meta-analysis of summary data from
published studies and from a meta-analysis using individual patient data for ovarian
cancer studies. American Journal Epidemiology, 145(10), 917-925.
Sterba, S. K., & Bauer, D. J. (2010). Matching method with theory in person-oriented
developmental psychopathology research. Development and Psychopathology, 22(2),
239-254. doi: doi:10.1017/S0954579410000015
Stewart, L. A. (1995). Practical methodology of meta-analyses (overviews) using updated
individual patient data. Statistics in Medicine, 14(19), 2057-2079. doi:
10.1002/sim.4780141902
Stouffer, S. A., Suchman, E. A., DeVinney, L. C., Star, S. A., & Williams, R. M., Jr. (1949). The
American soldier, vol.1: Adjustment during army life. Princeton, NJ: Princeton University
Press.
Substance Abuse and Mental Health Services Administration (SAMHSA) (2012). National
Survey on Drug Use and Health (NSDUH). Available at
106
http://www.samhsa.gov/data/NSDUH/2012SummNatFindDetTables/DetTabs/NSDUH-
DetTabsSect5peTabs1to56-2012.htm#Tab5.31b
Supplee, L. H., Kelly, B. C., MacKinnon, D. P., & Barofsky, M. Y. (2013). Introduction to the
special issue: Subgroup analysis in prevention and intervention research. Prevention
Science, 14(2), 107-110. doi: 10.1007/s11121-012-0335-9
Sutton, A. J., & Higgins, J. P. T. (2008). Recent developments in meta-analysis. Statistics in
Medicine, 27(5), 625-650. doi: 10.1002/sim.2934
Sutton, A. J., Kendrick, D., & Coupland, C. A. (2008). Meta-analysis of individual- and
aggregate-level data. Statistics in Medicine, 27(5), 651-669. doi: 10.1002/sim.2916
Thompson, S. G., & Pocock, S. J. (1991). Can meta-analyses be trusted? The Lancet, 338(8775),
1127-1130.
Tian, L., Cai, T., Pfeffer, M. A., Piankov, N., Cremieux, P.-Y., & Wei, L. J. (2009). Exact and
efficient inference procedure for meta-analysis and its application to the analysis of
independent 2 × 2 tables with all available data but without artificial continuity correction.
Biostatistics, 10(2), 275-281. doi: 10.1093/biostatistics/kxn034
Tse, T., Williams, R. J., & Zarin, D. A. (2009). Reporting "basic results" in ClinicalTrials.gov.
Chest, 136(1), 295-303. doi: 10.1378/chest.08-3022
Turner, E. H., Matthews, A. M., Linardatos, E., Tell, R. A., & Rosenthal, R. (2008). Selective
publication of antidepressant trials and its influence on apparent efficacy. New England
Journal of Medicine, 358(3), 252-260. doi: doi:10.1056/NEJMsa065779
Tversky, A., & Kahneman, D. (1971). Belief in the law of small numbers. Psychological Bulletin,
76(2), 105-110. doi: 10.1037/h0031322
Viechtbauer, W. (2010). Conducting meta-analyses in R with the metafor package. Journal of

107
Statistical Software, 36, 1-48.
Walters, S. T., & Neighbors, C. (2005). Feedback interventions for college alcohol misuse: What,
why and for whom? Addictive Behaviors, 30(6), 1168-1182. doi:
10.1016/j.addbeh.2004.12.005
Walters, S. T., Vader, A. M., & Harris, T. R. (2007). A controlled trial of web-based feedback
for heavy drinking college students. Prevention Science, 8(1), 83-88. doi:
10.1007/s11121-006-0059-9
Walters, S. T., Vader, A. M., Harris, T. R., & Jouriles, E. N. (2009). Reactivity to alcohol
assessment measures: An experimental test. Addiction, 104(8), 1305-1310. doi:
10.1111/j.1360-0443.2009.02632.x
Walters, S. T., Vader, A. M., Harris, T. R., Field, C. A., & Jouriles, E. N. (2009). Dismantling
motivational interviewing and feedback for college drinkers: A randomized clinical trial.
Journal of Consulting and Clinical Psychology, 77(1), 64-73. doi: 2009-00563-015
[pii]10.1037/a0014472
Weiss, B., & Garber, J. (2003). Developmental differences in the phenomenology of depression.
Development and Psychopathology, 15(2), 403-430. doi:
doi:10.1017/S0954579403000221
Werch, C. E., & Gorman, D. R. (1988). Relationship between self-control and alcohol
consumption patterns and problems of college students. Journal of Studies on Alcohol,
49(1), 30-37.
White, H. R., & Labouvie, E. W. (1989). Towards the assessment of adolescent problem
drinking. Journal of Studies on Alcohol, 50(1), 30-37.

108
White, H. R., Lee, C., Mun, E.-Y., & Loeber, R. (2012). Developmental patterns of alcohol use
in relation to the persistence and desistance of serious violent offending among African
American and Caucasian young men. Criminology, 50(2), 391-426. doi: 10.1111/j.1745-
9125.2011.00263.x
White, H. R., Mun, E.-Y., & Morgan, T. J. (2008). Do brief personalized feedback interventions
work for mandated students or is it just getting caught that works? Psychology of
Addictive Behaviors, 22(1), 107-116. doi:10.1037/0893-164x.22.1.107
White, H. R., Mun, E.-Y., Pugh, L., & Morgan, T. J. (2007). Long-term effects of brief substance
use interventions for mandated college students: sleeper effects of an in-person personal
feedback intervention. Alcoholism: Clinical and Experimental Research, 31(8), 1380-
1391. doi: ACER435 [pii]10.1111/j.1530-0277.2007.00435.x
Wilk, A. I., Jensen, N. M., & Havighurst, T. C. (1997). Meta-analysis of randomized control
trials addressing brief interventions in heavy alcohol drinkers. Journal of General
Internal Medicine, 12(5), 274-283. doi: 10.1046/j.1525-1497.1997.012005274.x
Wood, M. D., Capone, C., Laforge, R., Erickson, D. J., & Brand, N. H. (2007). Brief
motivational intervention and alcohol expectancy challenge with heavy drinking college
students: a randomized factorial study. Addictive Behaviors, 32(11), 2509-2528. doi:
10.1016/j.addbeh.2007.06.018
Wood, M. D., Fairlie, A. M., Fernandez, A. C., Borsari, B., Capone, C., Laforge, R., &
Carmona-Barros, R. (2010). Brief motivational and parent interventions for college
students: A randomized factorial study. Journal of Consulting and Clinical Psychology,
78(3), 349-361. doi: 10.1037/a0019166

109
Woolf, S. H. (2008). The meaning of translational research and why it matters. Journal of the
American Medical Association, 299(2), 211-213. doi: 10.1001/jama.2007.26
Xie, M., & Singh, K. (2013). Confidence distribution, the frequentist distribution estimator of a
parameter: A review. International Statistical Review, 81(1), 3-39. doi:
10.1111/insr.12000
Xie, M., Singh, K., & Strawderman, W. E. (2011). Confidence distributions and a unifying
framework for meta-analysis. Journal of the American Statistical Association, 106(493),
320-333. doi: 10.1198/jasa.2011.tm09803
Yamaguchi, Y., Sakamoto, W., Goto, M., Staessen, J. A., Wang, J., Gueyffier, F., & Riley, R. D.
(2014). Meta-analysis of a continuous outcome combining individual patient data and
aggregate data: a method based on simulated individual patient data. Research Synthesis
Methods, n/a-n/a. doi: 10.1002/jrsm.1119
Yang, G., & Xie, M. (2010). gmeta: An R package unified meta-analysis methods through
combining confidence distributions. Piscataway, NJ: Department of Statistics, Rutgers,
The State University of New Jersey.
Yusuf, S., Peto, R., Lewis, J., Collins, R., & Sleight, P. (1985). Beta blockade during and after
myocardial infarction: An overview of the randomized trials. Progress in Cardiovascular
Diseases, 27, 335-371.
Zucker, R. A., Fitzgerald, H. E., Refior, S. K., Puttler, L. I. Pallas, D. M., & Ellis, D. A. (2000).
The clinical and social ecology of childhood for children of alcoholics: Description of a
study and implications for a differentiated social policy. In H. E. Fitzgerald, B. M. Lester,
& B. S. Zuckerman (Eds.), Children of addiction: Research, health and policy issues (pp.
174-222). New York: Garland Press.

110
Table 1
Research Synthesis via Integrative Data Analysis Approaches
Approaches Notable Characteristics Weaknesses or Challenges
Nonempirical Research Synthesis
Narrative review of single
studies
Can quickly be conducted
Can draw information from a wide range of
studies (e.g., animal models, cross-sectional
studies, experimental studies, etc.)
Vote counting, the process of counting the
number of significant and nonsignificant
studies, is often used
May be subject to publication bias and
reviewer subjectivity
Variations across studies can become too
complex as the number of studies
increases
Limitations of single studies cannot be
overcome
The results from single studies cannot be
quantified using a precise metric
Vote counting is not a valid approach
Empirical Research Synthesis
Classical meta-analysis
approaches
Relatively easy to conduct
Essentially fixed-effects model (see below)
Groups or conditions to be compared
should be similar across studies
Publication bias remains a threat, which
can be countered by conducting an
extensive search of the published and
unpublished literature

111
Model-based meta-analysis:
Fixed-effects model
(using either AD or IPD)
One common true effect for all studies is
assumed
Within-study variability, not between-study
variability, is assumed
Between-study heterogeneity may be
accommodated by grouping similar studies
together and stratifying them or by including
covariates
Covariates can be included
Between-study heterogeneity is not part of
the model, which may be an unreasonable
assumption
Study-level missing data (i.e., did not
assess) can cause difficulty estimating a
common model across studies
Inference cannot be generalized beyond
the sample of studies analyzed (in terms of
sample characteristics and study
designs/effects)
Model-based meta-analysis:
Random-effects model
(using either AD or IPD)
A distribution of true study-specific effects
is assumed
Between-study heterogeneity (i.e., different
intervention effects and design/sample
characteristics) can be taken into account
Population-based inference can be made
Compared to a fixed-effects model,
relatively greater weights are assigned to
smaller studies
Compared to a fixed-effects model, this will
result in wider confidence intervals around
pooled effect estimates
Study-level missing data (i.e., did not
assess) can cause difficulty estimating a
common model across studies
Relatively a large number of studies are
needed. With a few studies, estimates may
not be reliable
Can be difficult to characterize the
population to which inference is made

112
Covariates can be included
Complex Research Synthesis—Multivariate Meta-analysis, Network Meta-analysis, IDA
Network meta-analysis
(using either AD or IPD; but
much more promising for
IPD)
When IPD analysis is used, it is widely
considered the “gold standard”—efficient,
unbiased, and powerful
With IPD, both study-level and participant-
level covariates can be included
Particularly useful for research synthesis of
randomized controlled trials (RCTs)
Multiple intervention comparisons are
possible via direct, indirect, and mixed
evidence of intervention effects
Randomization of groups within studies is
needed to derive relative intervention
effects
Within-study covariance matrix can be
hard to obtain in analysis using AD
Without IPD, ecological inference bias
may occur when using study-level
covariates
Can be computationally intensive with IPD
Multivariate meta-analysis
(using either AD or IPD; but
much more promising for
IPD)
When IPD analysis is used, it is widely
considered the “gold standard”—efficient,
unbiased, and powerful
With IPD, both study-level and participant-
level covariates can be included
With IPD, analytic models are not limited to
those used in single studies; many different
statistical models are feasible
Correlated parameters for multiple
outcomes, time points, or intervention
Randomization of groups within studies is
needed to derive relative intervention
effects
IPD may not be available for clinical trial
data due to privacy concerns
With IPD, data cleaning and checking take
considerable time and resources
With IPD, common metrics across studies
need to be established to minimize missing
data and to interpret individual-level

113
groups can be estimated findings
Key study design characteristics may vary,
causing study-level missing data
Can be computationally intensive
Other etiological
(longitudinal) IDA1
Take advantage of existing data sets that are
expensive to collect (e.g., fMRI, DNA,
and/or longitudinal data)
Create a pooled data set that has many
desirable characteristics than possible from
single studies
More advanced and appropriate analysis can
be conducted
Used for validation and to quantify an
average effect size
Have greater power to detect small effects
Data dimensions can be exceedingly large
Compiled data can be very sparse due to
study-level missing data (e.g., candidate
genes not available in some studies)
Common metrics across studies need to be
established to minimize missing data and
to interpret individual-level findings
Can be computationally intensive
Typically a few studies are analyzed
together as a single data set
Notes. AD = Aggregated data; IPD = Individual participant-level data (or individual patient-level data in medical research).
1 In principle, IDA investigations of etiological and/or long-term longitudinal studies can use the same analytical methods as those
listed under the complex synthesis methods. It is listed separately to highlight the challenges of harmonizing and analyzing extremely
high dimensional data.

114
Table 2
Model Setting of 2 x 2 Tables for k Independent Studies
Event Non-Event Total
Treatment iX i in X in
Control iY i im Y im
Total it i iN t iN

115
Table 3
Pooling Data from 2 x 2 Tables Using the Peto’s Odds Ratio and the Mantel-Haenszel Method
Article Group Moderation
Non-
Moderation
Observed
Odds Ratio 95% CI
Individual study estimate
1 Intervention 201 247 2.25 [1.70, 2.97]
Control 122 337
2 Intervention 14 66 3.71 [1.16, 11.85a]
Control 4 70
3 Intervention 9 24 1.09 [0.38, 3.11]
Control 10 29
4 Intervention 391 367 1.80 [1.40, 2.33]
Control 134 227
5 Intervention 9 50 1.74 [0.44, 6.95]
Control 3 29
6 Intervention 22 27 3.26 [1.25, 8.49]
Control 8 32
7 Intervention 34 35 2.14 [1.05, 4.34]
Control 20 44
8 Intervention 34 102 1.23 [0.60, 2.54]
Control 13 48
Pooled estimate
Peto's Odds Ratio 1.95 [1.66, 2.30]
Mantel-Haenszel Odds Ratio 1.98 [1.67, 2.34]
Source: Wilk et al. (1997). a = the upper limit of this CI is different from the text due to rounding.
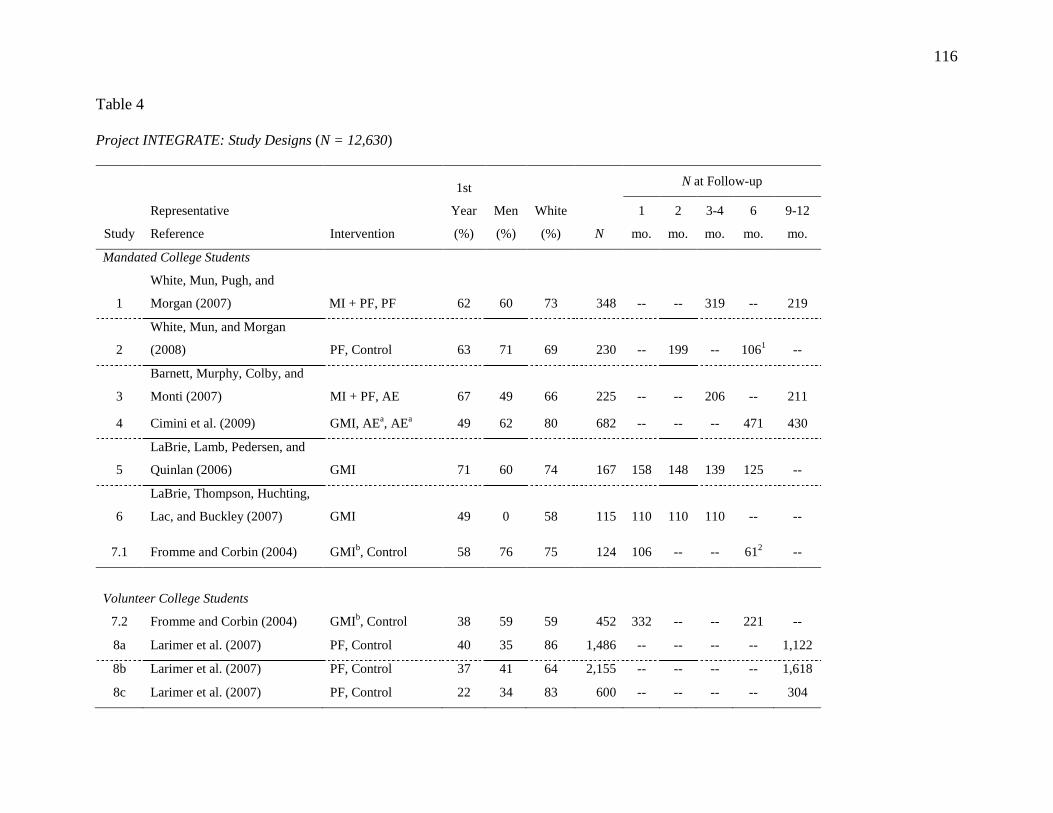
116
Table 4
Project INTEGRATE: Study Designs (N = 12,630)
Study
Representative
Reference Intervention
1st
Year
(%)
Men
(%)
White
(%) N
N at Follow-up
1
mo.
2
mo.
3-4
mo.
6
mo.
9-12
mo.
Mandated College Students
1
White, Mun, Pugh, and
Morgan (2007) MI + PF, PF 62 60 73 348 -- -- 319 -- 219
2
White, Mun, and Morgan
(2008) PF, Control 63 71 69 230 -- 199 -- 1061 --
3
Barnett, Murphy, Colby, and
Monti (2007) MI + PF, AE 67 49 66 225 -- -- 206 -- 211
4 Cimini et al. (2009) GMI, AEa, AE
a 49 62 80 682 -- -- -- 471 430
5
LaBrie, Lamb, Pedersen, and
Quinlan (2006) GMI 71 60 74 167 158 148 139 125 --
6
LaBrie, Thompson, Huchting,
Lac, and Buckley (2007) GMI 49 0 58 115 110 110 110 -- --
7.1 Fromme and Corbin (2004) GMIb, Control 58 76 75 124 106 -- -- 61
2 --
Volunteer College Students
7.2 Fromme and Corbin (2004) GMIb, Control 38 59 59 452 332 -- -- 221 --
8a Larimer et al. (2007) PF, Control 40 35 86 1,486 -- -- -- -- 1,122
8b Larimer et al. (2007) PF, Control 37 41 64 2,155 -- -- -- -- 1,618
8c Larimer et al. (2007) PF, Control 22 34 83 600 -- -- -- -- 304

117
Volunteer 1st-year or Incoming College Students
10.2
Baer, Kivlahan, Blume,
McKnight, and Marlatt (2001) Control 100 41 78 87 -- -- -- -- 81
11
Walters, Vader, and Harris
(2007) PF, Control 100 59 64 383 -- 272 288 -- --
15 LaBrie, Huchting, et al. (2008) GMI, Control 100 0 56 263 261 260 258 -- --
16 LaBrie et al. (2009) GMI, Control 100 0 57 287 282 277 268 250 --
17
LaBrie, Pedersen, Lamb, and
Quinlan (2007) GMI 100 100 65 120 110 105 90 56 --
22 Wood et al. (2010)
MI + PF, MI + PF
+ PBIc, Control 100 43 87 758 -- -- -- -- 687
Volunteer Heavy Drinking College Students
9
Lee, Kaysen, Neighbor,
Kilmer, and Larimer (2009)
MI + PF, PF,
AE, GMI, GMIa,
Control 100 38 71 604 -- -- 504 485 --
10.1 Baer et al. (2001) MI + PF, Control 100 46 84 348 -- -- -- -- 322
12 Wood et al. (2007)
MI + PF, AEa,c
,
MI + PF + AEa,c
,
Control 4 47 91 335 276 -- 257 258 --
13
Murphy, Benson, and
Vuchinich (2004) MI + PF, PF 13 32 94 54 -- -- -- 51 --
14 Murphy et al. (2001)
MI + PF, AE,
Control 41 46 94 84 -- -- 79 -- 79

118
21
Walters, Vader, Harris, Field,
and Jouriles (2009); Walters,
Vader, Harris, and Jouriles
(2009)
MI + PF, PF, MI
without PFc,
Control 41 35 84 288 -- -- 261 252 251
Intercollegiate Student Athletes or Fraternity, Sorority, and Service Organization Members
18
Martens, Kilmer, Beck, and
Zamboanga (2010) PF, PFa, Control 32 26 85 329 289 -- -- 259 --
19
LaBrie, Hummer, Neighbors,
and Pedersen (2008) GMIa, Control
a 19 31 67 1,178 966 922 -- -- --
20 Larimer et al. (2001) MI + PF, Control 78 52 84 928 -- -- -- -- 631
Notes. Studies are numbered arbitrarily. MI + PF = Motivational Interview plus Personalized Feedback; PF = Stand-alone
Personalized Feedback; GMI = Group Motivational Interview; AE = Alcohol Education; PBI = Parent-based Intervention. a = These
groups are quite unique despite having the same label as others without the superscript; b = GMI in Study 7 provided personalized
feedback, whereas other GMIs did not; c = These groups represent unique intervention conditions not found in any other studies
included in Project INTEGRATE. The control group (n = 119) for Study 2 received feedback at 2 months post baseline and thus their
follow-up data at 6 months post baseline were excluded; 2 Mandated students who were in the control group (n = 24) in Study 7.1
received GMI at 1 month post baseline and their follow-up data at 6 month post baseline were excluded. “--” indicates that follow-up
was not administered. Follow-up sample sizes were based on selective alcohol use measures and could differ from those reported in
published articles.

119
Table 5
Project INTEGRATE: Intervention Groups across Studies after Removing Ineligible Studies for the Multivariate Meta-analysis Data
Example
1 2 3 8a 8b 8c 9 10 11 12 13/14 18 20 21 22
MI + PF X -- X -- -- -- X X -- X X -- X X X
PF X X -- X X X X -- X -- X X -- X --
Alcohol Education -- -- X -- -- -- X -- -- -- X -- -- -- --
Control -- X -- X X X X X X X X X X X X
Notes. MI + PF = Motivational Interview plus Personalized Feedback; PF = Stand-alone Personalized Feedback. “--” indicates the
intervention groups are missing by design.
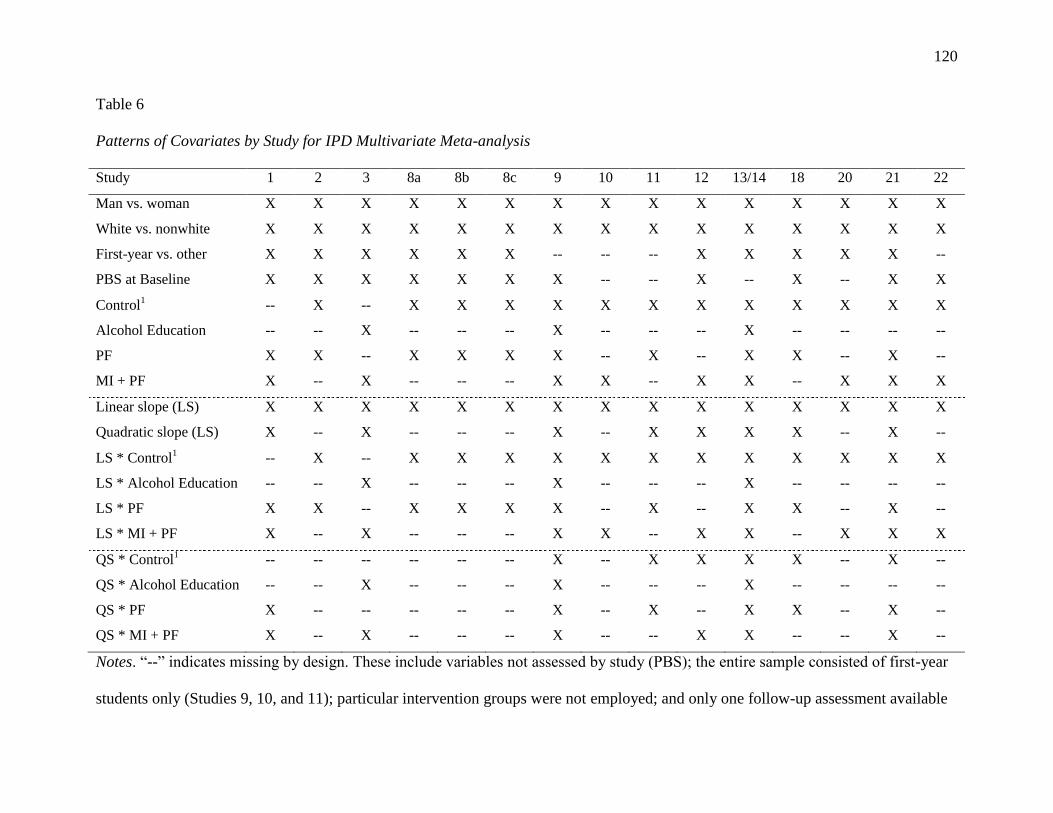
120
Table 6
Patterns of Covariates by Study for IPD Multivariate Meta-analysis
Study 1 2 3 8a 8b 8c 9 10 11 12 13/14 18 20 21 22
Man vs. woman X X X X X X X X X X X X X X X
White vs. nonwhite X X X X X X X X X X X X X X X
First-year vs. other X X X X X X -- -- -- X X X X X --
PBS at Baseline X X X X X X X -- -- X -- X -- X X
Control1 -- X -- X X X X X X X X X X X X
Alcohol Education -- -- X -- -- -- X -- -- -- X -- -- -- --
PF X X -- X X X X -- X -- X X -- X --
MI + PF X -- X -- -- -- X X -- X X -- X X X
Linear slope (LS) X X X X X X X X X X X X X X X
Quadratic slope (LS) X -- X -- -- -- X -- X X X X -- X --
LS * Control1 -- X -- X X X X X X X X X X X X
LS * Alcohol Education -- -- X -- -- -- X -- -- -- X -- -- -- --
LS * PF X X -- X X X X -- X -- X X -- X --
LS * MI + PF X -- X -- -- -- X X -- X X -- X X X
QS * Control1 -- -- -- -- -- -- X -- X X X X -- X --
QS * Alcohol Education -- -- X -- -- -- X -- -- -- X -- -- -- --
QS * PF X -- -- -- -- -- X -- X -- X X -- X --
QS * MI + PF X -- X -- -- -- X -- -- X X -- -- X --
Notes. “--” indicates missing by design. These include variables not assessed by study (PBS); the entire sample consisted of first-year
students only (Studies 9, 10, and 11); particular intervention groups were not employed; and only one follow-up assessment available

121
during the 12-month period, and thus their quadratic slope parameter in change could not be estimated. 1 = in actual models, this group
becomes a referent group for the three other intervention groups, and is not counted in the number of covariates included in the model.
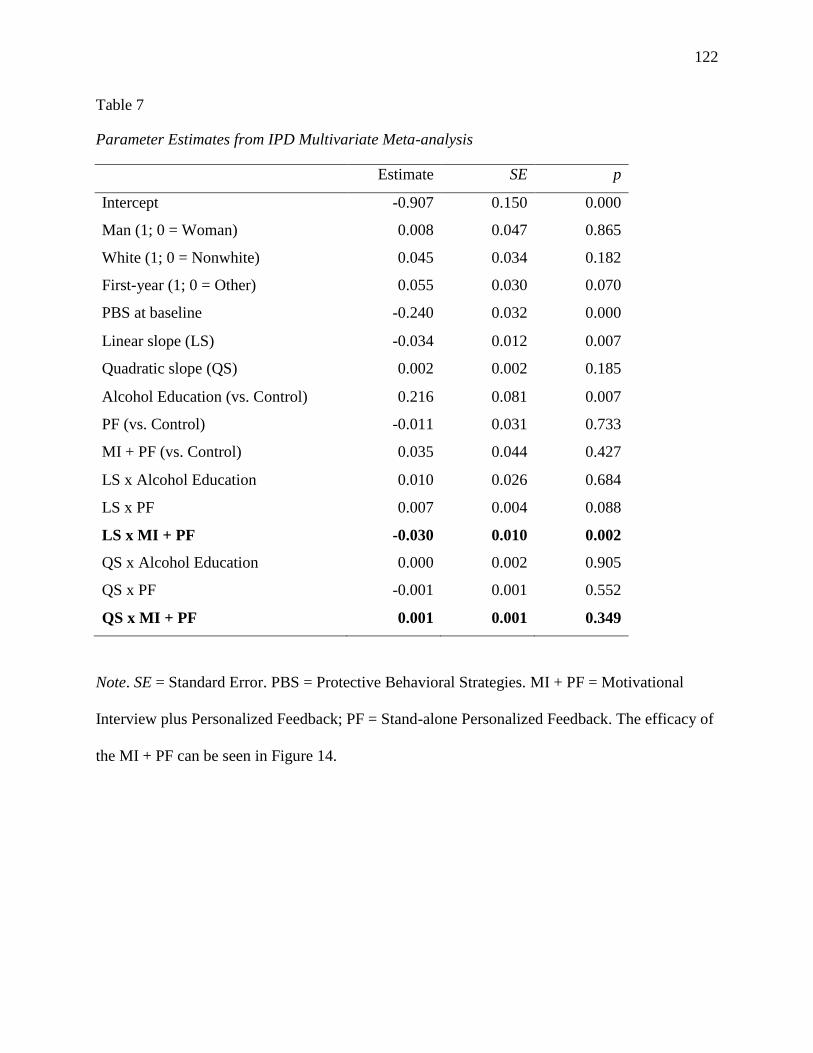
122
Table 7
Parameter Estimates from IPD Multivariate Meta-analysis
Estimate SE p
Intercept -0.907 0.150 0.000
Man (1; 0 = Woman) 0.008 0.047 0.865
White (1; 0 = Nonwhite) 0.045 0.034 0.182
First-year (1; 0 = Other) 0.055 0.030 0.070
PBS at baseline -0.240 0.032 0.000
Linear slope (LS) -0.034 0.012 0.007
Quadratic slope (QS) 0.002 0.002 0.185
Alcohol Education (vs. Control) 0.216 0.081 0.007
PF (vs. Control) -0.011 0.031 0.733
MI + PF (vs. Control) 0.035 0.044 0.427
LS x Alcohol Education 0.010 0.026 0.684
LS x PF 0.007 0.004 0.088
LS x MI + PF -0.030 0.010 0.002
QS x Alcohol Education 0.000 0.002 0.905
QS x PF -0.001 0.001 0.552
QS x MI + PF 0.001 0.001 0.349
Note. SE = Standard Error. PBS = Protective Behavioral Strategies. MI + PF = Motivational
Interview plus Personalized Feedback; PF = Stand-alone Personalized Feedback. The efficacy of
the MI + PF can be seen in Figure 14.

123
Table 8
Software Programs for Meta-analysis
Univariate
Meta-analysis
Multivariate
Meta-analysis
R (packages) epiR mvmeta
meta mvtmeta
metafor metaSEM
rmeta
gmeta
Stata (User written commands) metan mvmeta
metacum mvmeta_make
metareg
Note. More information, including manuals and references, can be found at http://cran.r-project.org/web/views/MetaAnalysis.html and
http://www.stata.com/support/faqs/statistics/meta-analysis/

124
Figure 1. Integrative data analysis (IDA) and meta-analysis using individual participant-level
data (IPD) and aggregated data (AD). AD meta-analysis can be conducted either as part of IDA
when IPD is available (see the circle inside the rectangle on left) or based on reported AD in
publications (the circle inside the right rectangle). The overlap in the middle between the two
rectangles indicates situations where IPD is available for some of the studies. The circles for AD
meta-analysis within the two rectangles are shaded in different colors to reflect some differences
in the procedures and possibly different results involved in AD meta-analysis depending on the
source of data. We use the term IDA differently in the current chapter. First, we use IDA to
broadly refer to quantitative research synthesis; second, at the more concrete analysis level, we
interchangeably use IDA with IPD meta-analysis, and contrast it against AD meta-analysis.

125
Figure 2. Analytical approaches under IDA.

126
Figure 3. Proportion of the articles citing meta-analysis studies in their literature review
published in Development and Psychopathology from 1997 to 2012.
0.0
0.1
0.2
0.3
0.4
0.5
1997 1998 1999 2000 2001 2002 2003 2004 2005 2006 2007 2008 2009 2010 2011 2012

127
Figure 4. Current and future directions of research synthesis. Black arrows indicate the emerging
directions and dotted arrows indicate the flow of research synthesis from data to analysis. Note
that IPD approaches are computationally intensive and may not always be feasible.
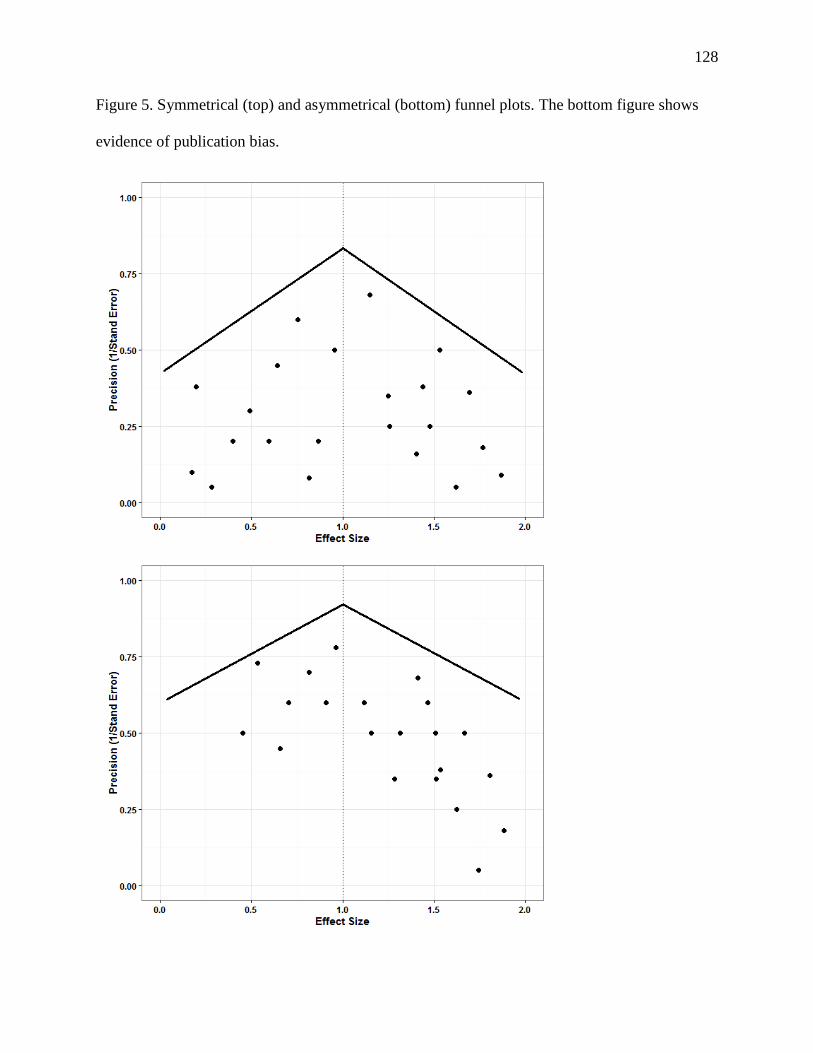
128
Figure 5. Symmetrical (top) and asymmetrical (bottom) funnel plots. The bottom figure shows
evidence of publication bias.
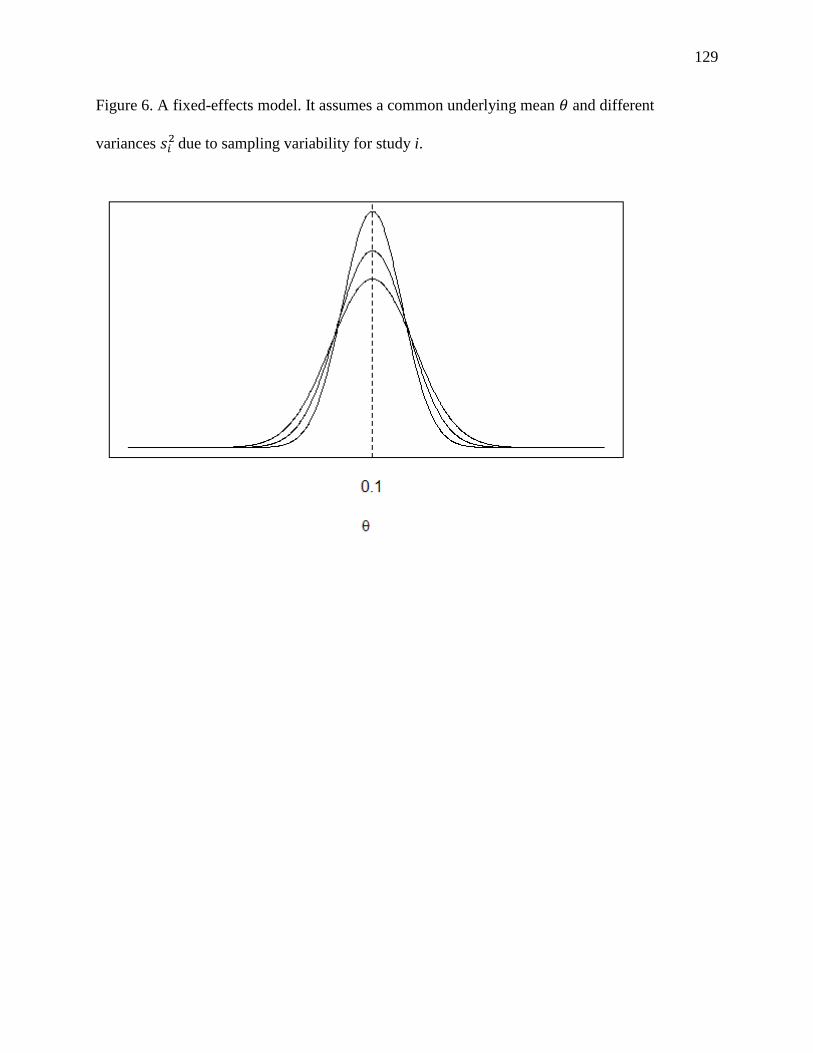
129
Figure 6. A fixed-effects model. It assumes a common underlying mean and different
variances
due to sampling variability for study i.

130
Figure 7. A random-effects model. It assumes a superpopulation with a mean and a variance from which distributions with
different means and variances
are drawn.

131
Figure 8. Network meta-analysis. The solid lines between ovals indicate that direct head-to-head
intervention comparisons are possible. The dotted lines indicate indirect comparisons are
possible. The figure on the left shows an example of an indirect comparison between
interventions B and C. The figure on the right shows mixed networks of evidence (both direct
and indirect) for interventions B and C. Interventions B and C are connected via both solid and
dotted lines. The closed loop connected by solid lines among interventions A, B, and C can
provide anchors for other comparisons involving interventions B and D, B and E, C and D, C and
E, and D and E. This network can be extended further when new interventions become available
for comparisons.

132
Figure 9. Protective Behavioral Strategies (PBS) at the first follow-up under the fixed-effects model for 10 studies.

133
Figure 10. Protective Behavioral Strategies (PBS) latent trait means across studies estimated from the generalized partial credit model
(GPCM ) analysis. The second, third, and fourth bars indicate data from Studies 8a, 8b, and 8c, respectively. The error bars indicate
two times standard errors in each direction. Participants in Studies 2 and 16 were estimated to utilize PBS more often than students in
other studies. Study 12 was an outlying study—Participants in Study 12 were least likely to utilize PBS.

134
Figure 11. Protective Behavioral Strategies (PBS) at the first follow-up under the fixed-effects model for nine studies (Study 12
removed).
135
Figure 12. Model-based estimates of NR latent trait scores at baseline, 6 months and 12 months
post intervention by group. NR = Neglecting responsibilities due to drinking. AlcEd = Alcohol
Education; PF = Stand-alone Personalized Feedback; MI.PF = Motivational Interview plus
Personalized Feedback (MI + PF); y-axis indicates NR scores. Higher scores (i.e., shorter bars in
this figure) indicate greater severity. Error bars indicate 95% confidence intervals. Relatively
speaking, there was a trend toward improving for those in the PF and MI + PF conditions.

136
Figure 13. Model-based estimates of change at 6 months and 12 months post intervention by
group. NR = Neglecting responsibilities due to drinking. AlcEd = Alcohol Education; PF =
Stand-alone Personalized Feedback; MI.PF = Motivational Interview plus Personalized Feedback
(MI + PF); y-axis indicates NR change scores. Error bars indicate 95% confidence intervals for
these change scores. Confidence intervals that do not include zero indicate a statistically
significant reduction at a given time point within groups. All groups with the exception of
Alcohol Education showed a statistically significant reduction at 6 months. The significant
reduction disappeared at 12 months for all three groups.

137
Figure 14. Multivariate meta-analysis of multiple intervention comparisons, showing a graphic
demonstration of the significant MI + PF intervention effect, compared to control. NR =
Neglecting responsibilities due to drinking. AlcEd = Alcohol Education; PF = Stand-alone
Personalized Feedback; MI.PF = Motivational Interview plus Personalized Feedback (MI + PF).
Error bars indicate 95% confidence intervals. Confidence intervals that do not include zero
indicate that the intervention condition at a given time point differed significantly in the
estimated NR trait scores, compared to control. MI + PF, compared to control, showed
significantly lower levels of NR trait scores at both 6 months and 12 months post intervention.