integration of industrial scale processes using biomass ... · pdf fileintroduction •...
TRANSCRIPT

Integration of Industrial Scale Processes using Biomass Feedstock in the Petrochemical Complex ofBiomass Feedstock in the Petrochemical Complex of
the Lower Mississippi River Corridor
Debalina Sengupta1 Ralph W Pike1 Tom Hertwig2 and Helen H Lou3
Session 20 - 23A01 Design for Sustainability Paper 20c American Institute of Chemical Engineers Annual Meeting Nashville (Nov 8-13 2009)
11 Department of Chemical Engineering Department of Chemical Engineering Louisiana State University Baton Rouge Baton Rouge LA 70803 USALouisiana State University LA 70803 USA 2 Mosaic Corporation 7250 Highway 44 Uncle Sam LA 70792 3 Department of Chemical Engineering Lamar University Beaumont TX 77710
Introduction
bull Introduction to Sustainable Development
bull Research Vision
bull Biomass conversion processes Aspen HYSYS 2006reg designs Aspen ICARUS Process Evaluator 2006reg cost estimations
bullbull Integration of biotechnology in existing plant complex Integration of biotechnology in existing plant complex
bull Conclusions
SustainabilitySustainability
Sustainability refers to integrating development in three aspects ndash Economic ndash Environmental ndash Societal Th h t tt t i t ti fThere are numerous approaches to attempt an integration of these aspects by world organizations countries and industries
bull
AIChE Total Cost Assessment Methodology
bull A methodology was developed by an industry group working through the AIChE to assess the total cost in a project and they issued a detailed report on total cost assessment (Constable et al TCA Report 1999)
bull Project Team AD Little (Collab amp Researcher) DOE
Bristol‐Myers Squibb Dow
E t Ch i lEastman Chemical E t K d kEastman Kodak Georgia Pacific Merck
IPPC of Business Round Table Monsanto
Owens Corning SmithKline Beecham (Lead)( )
Rohm and Haas Sylvatica (TCAce Dev)y ( )
bull TCA Users Group created in May 2009 Work is ongoing to update the costs identified in the report
bull Type I Direct
bull Type II Indirect
bull Type III Contingent Liability
Type IV Type IV Intangibles Intangibles
bull Type V External
Constable D et al ldquoTotal Cost Assessment Methodology Internal Managerial Decision Making Toolrdquo AIChE ISBN 0-8169-0807-9 July 1999
Corpporate Sustainabilityy
bull A companyrsquos success depends on maximizing the profit as expressed below
Profit = Σ Product Sales ndash Σ Raw Material Costs ndash Σ Energy Costs
bull The profit equation above can be expanded to meet the ldquoTriple Bottomlinerdquo criteria of sustainability
bull This will incorporate the economic costs expanded to environmental costs and societal costs ((also referred to as the sustainable or sustainabilityy costs))
Triple Bottom Line = Σ Product Sales + Σ Sustainable Credits ndash Σ Raw Material Costs ndash Σ Energy Costs ndash Σ Environmental Costs ndash Σ Sustainable Costs Σ Environmental Costs Σ Sustainable Costs
Triple Bottom Line = Σ Profit ‐ Σ Environmental Costs + Σ Sustainable (Credits ndash Costs)
Research Vision
bull Propose biomass based processes integrated into the chemical production complex in the Gulf Coast Region and other chemical complexes of the worldcomplexes of the world
bull Utilize carbon dioxide from processes in the complex to make chemicals and produce algae for biomass feedstock
bull Assign costs to the Triple Bottomline Equation components
bull Propose a Mixed Integer Non‐Linear Programming problem to maximize the Tripple Bottomline based on constraints multipplant material and energy balances product demand raw material availability and plant capacities
bullbull Use Chemical Complex Analysis System to obtain Pareto optimal Use Chemical Complex Analysis System to obtain Pareto optimal solutions to the MINLP problem
bull Use Monte Carlo simulations to determine sensitivity of optimal sollution
Proposed Biomass-Based Complex Extension
Research White Paper and Presentation available at wwwmprilsuedu
Biomass Processes
The following biomass conversion processes are considered for integration into the chemical complex superstructure ndash Fermentation
ndash Anaerobic digestion
ndash Transesterification
ndash G ifi Gasificati tion
Pretreatment of biomass is necessary before any of the biomass conversion processesbiomass conversion processes
Aspen HYSYSreg Aspen HYSYSreg Process simulation ‐ Process simulation
Aspen ICARUS Process Evaluatorreg ‐ Cost Estimation
Transesterification
13‐ propanediol Glycerol
Glycerol derivatives
N t l Oil T t ifi ti
Propylene glycol
Polyurethane Natural Oils Transesterification
y polyols FAME or FAEE
ndash Transesterification process is the treatment of natural oils with an alcohol and a catalyst to produce esters and glycerol ndash Methanol or ethanol is used as alcohol for fatty acid methyl or ethyl esters (FAMEFAEE) ndash These esters can be transformed to polymers ndash Glycerol is produced ~ 10 by weight in the process ndash Gl l b i t d d t th l h iGlycerol can be introduced to the propylene chain
HYSYS Design of Transesterification Process
Methyl ester purification Transesterification Reaction
Glycerol recovery and purification y y p
Design Description of Transesterification
Glycerol 4250 kghr Natural 393 kghr OilsOils
4250 kghr Methanol
Transesterification FAME or FAEE
612 kghr
bull The design is divided into three sections ndash Transesterification reaction
ndash Methyl ester purification Methyl ester purification
ndash Glycerol recovery and purification
bull 10 million gallons per year 1 of Fatty Acid Methyl Ester (FAME) produced
bull FAME is util dlized in manuffacture off pollymers
bull Glycerol is used in manufacture of propylene glycol
bull This pprocess can use Alggae oil as feedstock
bull The energy required for the process was comparable to the energy liberated
Transesterification
Thermodynamic model
Reactants
Catalyyst
Products
Temperature Temperature
UNIQUAC
Methanol Soybean Oil
178 (ww) Sodium Methyylate ( ) in methanol
Methyl Ester Glycerol
60oCC60
Methyl Ester Purification
Wash agents Water HClHCl
Glycerol Recovery and Purification
Purification NaOH Agents Water
HCl
1 Design based on ldquoA process model to estimate biodiesel production costsrdquoMJ Haas et al Bioresource Technology 97 (2006) 671-678
ICARUS Process Evaluator Economic Analysis of Transesterification
Economic Analysis
Economic Life
Plant Capacity
Total Project Capital Cost
Total Operating Cost
Total Raw Materials Cost Total Raw Materials Cost
Total Utilities Cost
Total Product Sales Total Product Sales
10
10300000
6930000
22600000
19 100 000 19100000
139000
22 600 000 22600000
years
gallonsyear Methyl Ester
USD
USDyear
USDyear USDyear
USDyear
USDyear 218 USDgallon of Methyl Ester
HYSYS Design of Glycerol to Propylene Glycol Hydrogenolysis Reaction
Purification of Propylene Glycol
Design description of Propylene Glycol
Propylene Glycol Glycerol
Hydrogen 200oC 200 psi
246 kghr
Propylene Glycol Glycerol
15000 kghr 9300 kghr
Hydrogenolysis Hydrogenolysis
Thermodynamic model UNIQUAC
Reactants Glycerol
bull Thhe ddesign is bbasedd on a llow pressure (200 psi) and temperature (200oC) process for hydrogenation of glycerol to Products Propylene Glycol
propylene glycol 1 propylene glycol 1
bull ~65000 metric ton of propylene glycol is produced per year2 Pressure 200 psi
bull Th i d f The energy required for thhe process was comparable to the energy liberated
Hydrogen Hydrogen
Catalyst Copper Chromite
Water Water
200oCTemperature
1 Design based on experimental results from Dasari M A et al 2005 Applied Catalysis A General Vol 281 p 225-231 2 Capacity based on AshlandCargill joint venture of process converting glycerol to propylene glycol
ICARUS Process Evaluator Economic Analysis of Propylene Glycol
Economic Analysis
Economic Life Economic Life 1010 Years Years
Plant Capacity 164000000 lbYear propylene glycol
Total Project Capital Cost Total Project Capital Cost 6580000 USDUSD
Total Operating Cost 83400000 USDYear
Total Raw Materials Cost 73 300 000 73300000 USDYear
Total Utilities Cost 2410000 USDYear
USDYear 082 T t l P d t S l Total Product Sales USDlb lUSDlb propylene
133000000 glycol
Fermentation
Ethanol derivatives Sugars Fermentation
C6 Sugars Ethylene
Ethanol
Ethanol derivatives
Starches Enzyme Conversion
Succinic Acid
Ethylene derivatives
Succinic acid derivatives
Cellulose and Hemicellulose
Acid or Enzyme Hydrolysis
C5C6 Sugars Butanol Butanol derivatives
Hemicellulose
bull Fermentation is the enzyme‐catalyzed transformation of an organic compound bull Fermentation enzymes react with hexose and pentose to form products E l i d i dbull Enzyme selection determines product -
bull Saccharomyces Cervisiae (C6) Escherichia coli (C5 amp C6) Zymomonas mobilis (C6)ndash Ethanol bull Enggineered Eschericia coli A succinicipproducens ndash Succinic Acid bull Engineeried microorganism ‐ Butanol bull Lactic Acid Producing Bacteria (LAB) ndash Lactic Acid
HYSYS Design of Fermentation
Pretreatment Section Fermentation Section Purification Section
Design Description of Fermentation
Sugars Air Cellulase
60000 kghr 2700 kghr
19800 kghr CO2
19000 kghr
Starches
Cellulose and Hemicellulose
Fermentation Ethanol
CSL DAP waste biomass
166667 kghr 400 kghr 71 kghr 133000 kghr
53 MMGpy Million gallons per year
bull The design is based on NRELrsquos11
lignocellulosic biomass to ethanol process design which converts 2000 metric tonsday of corn stover metric tonsday of corn stover
bull Waste treatment not considered
bull Net energy was liberated from the system
Fermentatiion
Thermodynamic Model UNIQUAC
Reactants Corn Stover
reesei) Enzyme (hydrolysis) Cellulase (Trichoderma
Bacteria (fermentation) Z mobilis
Ethanol CO2 Waste Ethanol CO2 Waste Products Products
Nitrogen Sources CSL DAP
1 Design based on results from Aden A et al NRELTP-510-32438 National Renewable Energy Laboratory Golden CO (June 2002)
ICARUS Process Evaluator Economic Analysis of Fermentation
Economic Analysis
Economic Life Economic Life 1010 Years Years
Plant Capacity 53000000 gallonsYear ethanol
Total Project Capital Cost j p 20 000 000 20000000 USD
Total Operating Cost 81000000 USDYear
Total Raw Materials Cost 54000000 USDYear
Total Utilities Cost 17000000 USDYear
Total Product Sales 106000000106000000
USDYear 150 USDgallon ethanol USDgallon ethanol
HYSYS Design of Ethanol to Ethylene
Dehydration Section Purification Section y
bull
Description of Ethylene Process
Ethylene Ethanol
300oC Fluidized bed process 99 conversion
41 500 k h 25 000 k h 41500 kghr 25000 kghr
Design is based on dehydrogenation Design is based on dehydrogenation of ethanol to ethylene1
bull The capacity of the plant is based on a 200000 metric tonyear ethylene a 200000 metric tonyear ethylene production facility proposed by Braskem in Brazil2
bull Net energy was required by the ener was required by theNet gy system
Dehydrogenation Dehydrogenation
Thermodynamic model UNIQUAC
Reactants Ethanol
Catalyst Activated silica‐alumina
Products Ethylene Water Water
Temperature 300oC
1 Design based on process described by Wells G M 1999 Handbook of Petrochemicals and Processes Sec Ed Pg 207-208 2 Capacity based on Braskem proposed ethanol to ethylene plant in Brazil httpwwwbraskemcombr
ICARUS Process Evaluator Economic Analysis of Ethylene
Economic Analysis
Economic Life Economic Life 1010 Years Years
Plant Capacity 440400000 lbYear ethylene
Total Project Capital Cost Total Project Capital Cost 3 000 000 3000000 USDUSD
Total Operating Cost 186000000 USDYear
Total Raw Materials Cost 169 000 000 169000000 USDYear
Total Utilities Cost 3000000 USDYear
Total Product Sales 186 000 000 186000000
USDYear 042 USDlb ethylene USDlb ethylene
Anaerobic Digestion
bull Anaerobic digestion of biomass is the treatment of biomass with a mixed culture of bacteria in absence of oxygen to produce methane (biogas) andculture of bacteria in absence of oxygen to produce methane (biogas) and carbon dioxide
bull Four stages hydrolysis acidogenesis acetogenesis and methanogenesis
bull Mi Al I hibit f th t f th d ti MixAlco process ndash Inhibits fourth stage of methane production usiing iodoform (CHI3) or bromoform (CHBr3) Reduces cost of process by using mixed culture of bacteria from cattle rumen Produces mixed alcohols carboxylic acids and ketones carboxylic acids and ketones
HYSYS Design of Anaerobic Digestion
Pretreatment Section Anaerobic Digestion Section
Purification Section Section
Design Description of Anaerobic Digestion
14 000 kghr
Cellulose and Hemicellulose
Anaerobic Biodigestion
Acetic Acid
83300 kghr (dry basis) Nutrients Innoculum
CO2H2 mix [12 mole ratio] 14000 kghr
Hemicellulose Biodigestion
20800 kghr (dry basis)
Pig Manure Iodoform 8333 kghr Lime
1 kghr
20000 kghr
20800 kghr (dry basis)
bull Design is based on anaerobic digestion of corn stover to carboxylic acids 1
Anaerobic Digestion of corn stover to carboxylic acids
Thermodynamic model UNIQUAC bull The capacity of the plant is based on a
Reactants Corn Stover 2000 metric tonday processing of biomass2 Innoculum Rumen Fluid biomass
CH4 Inhibitor Iodoform bull Ketones can be produced by modifying process
bullbull Energy recovered from the system
Acetic Acid CO2H2Products
Energy recovered from the system
1 Design based on process described by Thanakoses et al ldquoFermentation of Corn Stover to Carboxylic Acidsrdquo BioTech and Bio Eng Vol 83 No 2 2003 2 Aden A et al NRELTP-510-32438 National Renewable Energy Laboratory Golden CO (June 2002)
Gasification
Ammonia Ammonia derivatives
Gasification Methanol Methanol derivatives Syngas
Hydrogen
Cellulose and Hemicellulose
Hydrogen
- Biomass can be gasified to produce of syngas Biomass can be gasified to produce of syngas
- Syngas can be converted to chemicals like methanol ammonia and hydrogen
Industries in Louisiana
bull ndash Dow
ndash DuPont ndash BASF
ShellShell
ndash Exxon
ndash Monsanto
ndash Mosaic
ndash Union Carbide
hellip and othershellip and others
Petrochemical complex in the lower Mississippi River Corridor
Photo Peterson 2000
Base Case of Plants in the Lower Mississippi River Corridor
Plants in the Base Case
bull Ammonia bull Nitric acid bull Ammonium nitrate bull Urea bull UAN bull Methanol bull Granular triple super phosphate bull MAP amp DAP bull Contact pprocess for Sulfuric acid bull Wet process for Phosphoric acid bull Acetic acid bull Ethylbenzene bull Styyrene
Biomass Complex
Methanol DAP Acids
Base Case Complex
Integrated Chemical Production Complex
Utilities CO2
New Processes Utilizingg Biomass Feedstock
bull Fermentation to EthanolCO2
bull Ethanol to Ethylene process bull Transesterification to FAME Glycerol bull Glycerol to Propylene Glycol process bull Anaerobic Digestion to Acetic Acid H2 CO2
bull Gasification to Syngas
Superstructure with New Processes Utilizingg CO2 Integrated into Base Case
bull Electric furnace process for phosphoric acid phosphoric acid
bull HCl process for phosphoric acid bull SO2 recovery from gypsum bull S amp SO2 recovery from gypsum bull Acetic acid from CO Acetic acid from CO2 amp CH4bull amp CH bull Graphite amp H2 bull Syngas from CO2 amp CH4 bull Propane dehydrogenation bullbull Propylene from propane amp CO Propylene from propane amp CO2 bull Styrene from ethylbenzene amp CO2 bull Methanol from CO2 amp H2 bull Formic acid bullbull Methylamines Methylamines bull Ethanol bull Dimethylether
Past work done by our group where CO2 is utilized to make chemicals and integrated into base case
Processes in the Optimal Structure
Plants in the Base Case Plants in the Base Case bull Ammonia
bull Nitric acid
bull Ammonium nitrate Ammonium nitrate
bull Urea
bull UAN
bull Methanol
bull Granular triple super phosphate
bull MAP amp DAP
bull Contact process for Sulfuric acid
bull f h h i idWet process for phosphoric acid
bull Ethylbenzene
bull Styrene
N t i th CNot in the BBase Case bull Acetic acid
New Plants in the Optimal Structure New Plants in the Optimal Structure bull Acetic acid from CO2 amp CH4
bull Graphite amp H2
bull Syngas from CO Syngas from CO2 amp CH4amp CH
bull Formic acid
bull Methylamines
Plants Not in the Optimal Structure Plants Not in the Optimal Structure bull Electric furnace process for phosphoric acid
bull HCl process for phosphoric acid
bull SOSO2 recovery from gypsum bull recovery from gypsum
bull S amp SO2 recovery from gypsum
bull Propane dehydrogenation
bull Propylene from propane amp CO22
bull Styrene from ethylbenzene amp CO2
bull Methanol from CO2 amp H2
bull Ethanol
bull Dimethylether
SPACE BASED SOLAR POWER SPACE‐BASED SOLAR POWER ADVANCED CAR BATTERIES UTILITY STORAGE CARBON CAPTURE AND STORAGE NEXT‐GENERATION BIOFUELS
Algae ‐ New Feedstock Option that use CO2 Algae New Feedstock Option that use CO2
bull Algae ndash Consumes CO2 in a continuous
process using exhaust from power plant (40 CO2 and 86 NO)
ndash Can be separated into oil and carb hbohyddrattes
ndash Upto 5000 gallonsacre of yield of alcohol produced compared to 350 gallonsacre corn based ethanol1 gallonsacre corn based ethanol
ndash Upto 15000 gallonsacre of algae oil produced compared to 60 gallonsacre for soybean oil2
ndash Water used can be recycled and waste water can be used as compared to oilseed cropsrsquo high water demand water demand
ndash High growth rates can be harvested 1 Wall Street Journal Oct 19 2009
daily 2 National Geographic October 2007
Algae FeedstockAlgae Feedstock
mdash ExxonMobil Announcement ‐ it will invest more than $600 million in algae‐based biofuels in association with Synthetic Genomics Inc 1 algae based biofuels in association with Synthetic Genomics Inc mdash Dow Announcement ndash Algenol and Dow Chemical Company announced a pilot scale Algae‐based process to convert CO2 to ethanol2
Algenol Bioffuels Inc algae to ethanol test ffacility in Florida
1 Biodiesel Magazine July 2009 2 and Photo Ethanol Producer Magazine September 2009
Integrated Chemical Production Complex
CO2
CO2
Chemicals like methylamines
h lmethanol acetic acid etc from CO2
Algae growth for use as biomass
Multicriteria Optimization ProblemMulticriteria Optimization Problem Maximize w1P+w2S
P = Σ Product Sales ndash Σ Economic Costs ndash Σ Environmental Costs S = Σ Sustainability (Credits ndash Costs)
w1 + w2 = 1 Subject to
MultiplantMultiplant material and energy balancematerial and energy balance Product demand Raw material availability Plant capacities
Costs in the Triple Bottom line bull Economic Costs
ndash Icarus Process Evaluator results for capital costs ndash Icarus Process Evaluator results for operating costs including raw material
costs and utilities
bull Environmental costs ndash AIChETCA report 1 lists environmental costs as approximately 20 of total
manufacturing cost and raw material as 30 of manufacturing costs (datamanufacturing cost and raw material as 30 of manufacturing costs (data provided by Amoco DuPont and Novartis)
ndash Environmental cost estimated as 67 of raw material cost
bull Sustainable costs ndash Sustainable costs were estimated from results given for power generation in
AIChETCA report 1
ndash Al h d i i bl b i lAlternate methods to estimate sustainable costs are being evaluatedd
Component Sustainable Cost ($mt)
NOx 1030
Carbon Dioxide 325
SOx 192
1 Constable D et al ldquoTotal Cost Assessment Methodology Internal Managerial Decision Making Toolrdquo AIChE ISBN 0-8169-0807-9 July 1999
Raw Material and Product Prices (Base Case)
Raw Materials Raw Materials Cost ($mt) Cost ($mt) Raw Materials Raw Materials Cost ($mt) Cost ($mt) ProductsProducts Natural Gas 172 Market cost for short term Ammonia 150 Phosphate Rock purchase
Methanol
300 wet process
27
Reducing gas
1394
Acetic Acid 1034
electrofurnace
24 Wood gas
634
GTSP 142 HCl process
25
Sustainable Costs and Credits MAP 180 GTSP process 30 Credit for CO2 650 DAP 165
HCl
50
Consumption
NH
4NO3 153 Sulfur Debit for CO2
325
UAN 112 Frasch Frasch 4242 ProductionProduction UreaUrea 154154 Claus
38
Credit for HP Steam 10 H3PO4
320
C electrofurnace 760 Credit for IP Steam 64 Ethanol 670 Ethylene 446 Credit for gypsum 5 Ethylbenzene 551 Benzene 257 Consumption
Propene
240 Propane 163 Debit for gypsum 25 CO 31
Production
Graphite 882 Debit for NOx 1025 H2 796
Production
Styrene
705 Debit for SO2 Debit for SO2 150150 Toluene Toluene 238238
Production
Fuel Gas 596 Formic Acid 690
MMA
1606
DMA
1606 DME 946
Price ($mt) Price ($mt)
Transportation to Gulf Coast
Waterways from the midwestern states can provide excellent transport for biomassWaterways from the midwestern states can provide excellent transport for biomass feedstock to the Gulf Coast Industries in the Lower Mississippi River Corridor can receive the feedstock and convert to chemicals
Map created from httpnationalatlasgov
Natural Gas Pipelines in the United States
Major CO2 Pipelines in the United States
Source httpncseonlineorgnlecrsreports07mayrl33971pdf
Summary E d h Ch i l P d i C l i h LExtend the Chemical Production Complex in the Lower
Mississippi River Corridor to include Biomass based chemical pproduction compplex
CO2 utilization from the complex
Obtained the relations for the above chemical plants A il bilit f t i lAvailability of raw materials
Demand for product
Plant capacities
Material and energy balance equations
Assigned Triple Bottomline costs Economic costsEconomic costs
Environmental costs
Sustainable credits and costs
Summary bull Solve Multicriteria Optimization Problem with constraints
bull Use Mixed Integer Non Linear Programming Global Optimization Solvers to obtain Pareto optimal solutions of the problem belowobtain Pareto optimal solutions of the problem below
Optimise w1P+w2S
P = P = ΣΣProduct Product SalesSales ndash ΣΣEconomic Economic Costs Costs ndash ΣEnvironmental Costs ΣEnvironmental Costs
S = ΣSustainability (Credits ndash Costs) w1 + w2 = 1
bull Use Monte Carlo Analysis to determine sensitivity of the optimal solution
bull Follow the procedure to include plants in the Gulf Coast Region (Texas L iLouisiiana Missiissiippii Alabbama))Mi Al
bull Methodology can be applied to other chemical complexes of the world
Research White Paper and Presentation available at wwwmprilsuedu
TCA Cost Explanations
Cost Type Description Examples
I Direct costs Manufacturing site costs Capital investment operating labor materials and waste disposal costs
II Indirect costs Corporate andpo Reporting costs regulatory costs andepo g egu y manufacturing overhead monitoring costs
III Future and Potential fines penalties Clean‐up personal injury and contingent liability and future liabilities property damage lawsuits industrial costs accident costs
IV Intangible Difficult‐to‐measure but Cost to maintain customer loyalty internal costs real costs borne by the worker morale union relations and (Company‐paid) company community relations
V External costs Costs borne by society Effect of operations on housing costs (Not currently paid degradation of habitat effect of b th )by the company) ll ti h h lth pollution on human health
Biomass Components
α links β links
Hexose Pentose Complex polymer containing phenolic Triglycerides compounds
Algae SpeciesAlgae Species
bull The following species listed are currently being studied for their suitability as a mass‐oil producing crop across various locations worldwide
bull Botryococcus braunii
bull Chlorella
bull Dunaliella tertiolecta
bull Gracilaria
bull Pleurochrysis carterae (also called CCMP647)[39] bull Pleurochrysis carterae (also called CCMP647)[39]
bull Sargassum with 10 times the output volume of Gracilaria[40]
Costs in the Triple Bottom line
Relative Price per unit energy of various feedstocks and products quoted in their traditional units and calibrated to $$GJ
Contour plot of production cost plus return on investment as a function of capital and variable costs (based on 1000Ggyear of olefin production)
CEP March 2008 Pg S7-S14
Total Capital Cost ($ million)
111
543 606 756 854
0
500
1000
Grain ethanol Hydrogen Methanol Cellulosic Fischer‐Tropschyd oge ethanol
opsc Liquids
Costs in the Triple Bottom line
Capital Cost per unit of Production ($ per BPD gasoline equivalent)
13000
59000 66000 76000 86000
0
50000
100000
($ per BPD gasoline equivalent)
Grain ethanol Hydrogen Methanol Cellulosic ethanol
Fischer‐Tropsch Liquids
Capital and operating costs for 150 million gallons per year (MMGPY) of gasoline equivalent plants 2005 dollars plants 2005 dollars
Operating Cost
105 122 128 176 18
05 1
15 2
p g ($ per gallon of gasoline equivalent)
0
Hydrogen Grain ethanol Methanol Cellulosic ethanol
Fischer‐Tropsch Liquids
Biofpr 149-56 (2007)
Industry Perspective
Ethylene and Propylene are basic building blocks for polymers and chemical intermediates
Approximately 1 of global energy market and 3 of global oil and gas mark t i ket is usedd as chhemiicall feedstock
frac12 of the energy and frac34 mass of the chemical feedstock is retained in the end product
1
2
3
1 CEP March 2008 Pg S7-S14 2 httpwwwbraskemcombrsiteportal_braskemen sala_de_imprensasala_de_imprensa_detalhes_6970aspx 3 httpwwwashlandcompress_roomnews_detailasps=1543
- Structure Bookmarks
-

bull
AIChE Total Cost Assessment Methodology
bull A methodology was developed by an industry group working through the AIChE to assess the total cost in a project and they issued a detailed report on total cost assessment (Constable et al TCA Report 1999)
bull Project Team AD Little (Collab amp Researcher) DOE
Bristol‐Myers Squibb Dow
E t Ch i lEastman Chemical E t K d kEastman Kodak Georgia Pacific Merck
IPPC of Business Round Table Monsanto
Owens Corning SmithKline Beecham (Lead)( )
Rohm and Haas Sylvatica (TCAce Dev)y ( )
bull TCA Users Group created in May 2009 Work is ongoing to update the costs identified in the report
bull Type I Direct
bull Type II Indirect
bull Type III Contingent Liability
Type IV Type IV Intangibles Intangibles
bull Type V External
Constable D et al ldquoTotal Cost Assessment Methodology Internal Managerial Decision Making Toolrdquo AIChE ISBN 0-8169-0807-9 July 1999
Corpporate Sustainabilityy
bull A companyrsquos success depends on maximizing the profit as expressed below
Profit = Σ Product Sales ndash Σ Raw Material Costs ndash Σ Energy Costs
bull The profit equation above can be expanded to meet the ldquoTriple Bottomlinerdquo criteria of sustainability
bull This will incorporate the economic costs expanded to environmental costs and societal costs ((also referred to as the sustainable or sustainabilityy costs))
Triple Bottom Line = Σ Product Sales + Σ Sustainable Credits ndash Σ Raw Material Costs ndash Σ Energy Costs ndash Σ Environmental Costs ndash Σ Sustainable Costs Σ Environmental Costs Σ Sustainable Costs
Triple Bottom Line = Σ Profit ‐ Σ Environmental Costs + Σ Sustainable (Credits ndash Costs)
Research Vision
bull Propose biomass based processes integrated into the chemical production complex in the Gulf Coast Region and other chemical complexes of the worldcomplexes of the world
bull Utilize carbon dioxide from processes in the complex to make chemicals and produce algae for biomass feedstock
bull Assign costs to the Triple Bottomline Equation components
bull Propose a Mixed Integer Non‐Linear Programming problem to maximize the Tripple Bottomline based on constraints multipplant material and energy balances product demand raw material availability and plant capacities
bullbull Use Chemical Complex Analysis System to obtain Pareto optimal Use Chemical Complex Analysis System to obtain Pareto optimal solutions to the MINLP problem
bull Use Monte Carlo simulations to determine sensitivity of optimal sollution
Proposed Biomass-Based Complex Extension
Research White Paper and Presentation available at wwwmprilsuedu
Biomass Processes
The following biomass conversion processes are considered for integration into the chemical complex superstructure ndash Fermentation
ndash Anaerobic digestion
ndash Transesterification
ndash G ifi Gasificati tion
Pretreatment of biomass is necessary before any of the biomass conversion processesbiomass conversion processes
Aspen HYSYSreg Aspen HYSYSreg Process simulation ‐ Process simulation
Aspen ICARUS Process Evaluatorreg ‐ Cost Estimation
Transesterification
13‐ propanediol Glycerol
Glycerol derivatives
N t l Oil T t ifi ti
Propylene glycol
Polyurethane Natural Oils Transesterification
y polyols FAME or FAEE
ndash Transesterification process is the treatment of natural oils with an alcohol and a catalyst to produce esters and glycerol ndash Methanol or ethanol is used as alcohol for fatty acid methyl or ethyl esters (FAMEFAEE) ndash These esters can be transformed to polymers ndash Glycerol is produced ~ 10 by weight in the process ndash Gl l b i t d d t th l h iGlycerol can be introduced to the propylene chain
HYSYS Design of Transesterification Process
Methyl ester purification Transesterification Reaction
Glycerol recovery and purification y y p
Design Description of Transesterification
Glycerol 4250 kghr Natural 393 kghr OilsOils
4250 kghr Methanol
Transesterification FAME or FAEE
612 kghr
bull The design is divided into three sections ndash Transesterification reaction
ndash Methyl ester purification Methyl ester purification
ndash Glycerol recovery and purification
bull 10 million gallons per year 1 of Fatty Acid Methyl Ester (FAME) produced
bull FAME is util dlized in manuffacture off pollymers
bull Glycerol is used in manufacture of propylene glycol
bull This pprocess can use Alggae oil as feedstock
bull The energy required for the process was comparable to the energy liberated
Transesterification
Thermodynamic model
Reactants
Catalyyst
Products
Temperature Temperature
UNIQUAC
Methanol Soybean Oil
178 (ww) Sodium Methyylate ( ) in methanol
Methyl Ester Glycerol
60oCC60
Methyl Ester Purification
Wash agents Water HClHCl
Glycerol Recovery and Purification
Purification NaOH Agents Water
HCl
1 Design based on ldquoA process model to estimate biodiesel production costsrdquoMJ Haas et al Bioresource Technology 97 (2006) 671-678
ICARUS Process Evaluator Economic Analysis of Transesterification
Economic Analysis
Economic Life
Plant Capacity
Total Project Capital Cost
Total Operating Cost
Total Raw Materials Cost Total Raw Materials Cost
Total Utilities Cost
Total Product Sales Total Product Sales
10
10300000
6930000
22600000
19 100 000 19100000
139000
22 600 000 22600000
years
gallonsyear Methyl Ester
USD
USDyear
USDyear USDyear
USDyear
USDyear 218 USDgallon of Methyl Ester
HYSYS Design of Glycerol to Propylene Glycol Hydrogenolysis Reaction
Purification of Propylene Glycol
Design description of Propylene Glycol
Propylene Glycol Glycerol
Hydrogen 200oC 200 psi
246 kghr
Propylene Glycol Glycerol
15000 kghr 9300 kghr
Hydrogenolysis Hydrogenolysis
Thermodynamic model UNIQUAC
Reactants Glycerol
bull Thhe ddesign is bbasedd on a llow pressure (200 psi) and temperature (200oC) process for hydrogenation of glycerol to Products Propylene Glycol
propylene glycol 1 propylene glycol 1
bull ~65000 metric ton of propylene glycol is produced per year2 Pressure 200 psi
bull Th i d f The energy required for thhe process was comparable to the energy liberated
Hydrogen Hydrogen
Catalyst Copper Chromite
Water Water
200oCTemperature
1 Design based on experimental results from Dasari M A et al 2005 Applied Catalysis A General Vol 281 p 225-231 2 Capacity based on AshlandCargill joint venture of process converting glycerol to propylene glycol
ICARUS Process Evaluator Economic Analysis of Propylene Glycol
Economic Analysis
Economic Life Economic Life 1010 Years Years
Plant Capacity 164000000 lbYear propylene glycol
Total Project Capital Cost Total Project Capital Cost 6580000 USDUSD
Total Operating Cost 83400000 USDYear
Total Raw Materials Cost 73 300 000 73300000 USDYear
Total Utilities Cost 2410000 USDYear
USDYear 082 T t l P d t S l Total Product Sales USDlb lUSDlb propylene
133000000 glycol
Fermentation
Ethanol derivatives Sugars Fermentation
C6 Sugars Ethylene
Ethanol
Ethanol derivatives
Starches Enzyme Conversion
Succinic Acid
Ethylene derivatives
Succinic acid derivatives
Cellulose and Hemicellulose
Acid or Enzyme Hydrolysis
C5C6 Sugars Butanol Butanol derivatives
Hemicellulose
bull Fermentation is the enzyme‐catalyzed transformation of an organic compound bull Fermentation enzymes react with hexose and pentose to form products E l i d i dbull Enzyme selection determines product -
bull Saccharomyces Cervisiae (C6) Escherichia coli (C5 amp C6) Zymomonas mobilis (C6)ndash Ethanol bull Enggineered Eschericia coli A succinicipproducens ndash Succinic Acid bull Engineeried microorganism ‐ Butanol bull Lactic Acid Producing Bacteria (LAB) ndash Lactic Acid
HYSYS Design of Fermentation
Pretreatment Section Fermentation Section Purification Section
Design Description of Fermentation
Sugars Air Cellulase
60000 kghr 2700 kghr
19800 kghr CO2
19000 kghr
Starches
Cellulose and Hemicellulose
Fermentation Ethanol
CSL DAP waste biomass
166667 kghr 400 kghr 71 kghr 133000 kghr
53 MMGpy Million gallons per year
bull The design is based on NRELrsquos11
lignocellulosic biomass to ethanol process design which converts 2000 metric tonsday of corn stover metric tonsday of corn stover
bull Waste treatment not considered
bull Net energy was liberated from the system
Fermentatiion
Thermodynamic Model UNIQUAC
Reactants Corn Stover
reesei) Enzyme (hydrolysis) Cellulase (Trichoderma
Bacteria (fermentation) Z mobilis
Ethanol CO2 Waste Ethanol CO2 Waste Products Products
Nitrogen Sources CSL DAP
1 Design based on results from Aden A et al NRELTP-510-32438 National Renewable Energy Laboratory Golden CO (June 2002)
ICARUS Process Evaluator Economic Analysis of Fermentation
Economic Analysis
Economic Life Economic Life 1010 Years Years
Plant Capacity 53000000 gallonsYear ethanol
Total Project Capital Cost j p 20 000 000 20000000 USD
Total Operating Cost 81000000 USDYear
Total Raw Materials Cost 54000000 USDYear
Total Utilities Cost 17000000 USDYear
Total Product Sales 106000000106000000
USDYear 150 USDgallon ethanol USDgallon ethanol
HYSYS Design of Ethanol to Ethylene
Dehydration Section Purification Section y
bull
Description of Ethylene Process
Ethylene Ethanol
300oC Fluidized bed process 99 conversion
41 500 k h 25 000 k h 41500 kghr 25000 kghr
Design is based on dehydrogenation Design is based on dehydrogenation of ethanol to ethylene1
bull The capacity of the plant is based on a 200000 metric tonyear ethylene a 200000 metric tonyear ethylene production facility proposed by Braskem in Brazil2
bull Net energy was required by the ener was required by theNet gy system
Dehydrogenation Dehydrogenation
Thermodynamic model UNIQUAC
Reactants Ethanol
Catalyst Activated silica‐alumina
Products Ethylene Water Water
Temperature 300oC
1 Design based on process described by Wells G M 1999 Handbook of Petrochemicals and Processes Sec Ed Pg 207-208 2 Capacity based on Braskem proposed ethanol to ethylene plant in Brazil httpwwwbraskemcombr
ICARUS Process Evaluator Economic Analysis of Ethylene
Economic Analysis
Economic Life Economic Life 1010 Years Years
Plant Capacity 440400000 lbYear ethylene
Total Project Capital Cost Total Project Capital Cost 3 000 000 3000000 USDUSD
Total Operating Cost 186000000 USDYear
Total Raw Materials Cost 169 000 000 169000000 USDYear
Total Utilities Cost 3000000 USDYear
Total Product Sales 186 000 000 186000000
USDYear 042 USDlb ethylene USDlb ethylene
Anaerobic Digestion
bull Anaerobic digestion of biomass is the treatment of biomass with a mixed culture of bacteria in absence of oxygen to produce methane (biogas) andculture of bacteria in absence of oxygen to produce methane (biogas) and carbon dioxide
bull Four stages hydrolysis acidogenesis acetogenesis and methanogenesis
bull Mi Al I hibit f th t f th d ti MixAlco process ndash Inhibits fourth stage of methane production usiing iodoform (CHI3) or bromoform (CHBr3) Reduces cost of process by using mixed culture of bacteria from cattle rumen Produces mixed alcohols carboxylic acids and ketones carboxylic acids and ketones
HYSYS Design of Anaerobic Digestion
Pretreatment Section Anaerobic Digestion Section
Purification Section Section
Design Description of Anaerobic Digestion
14 000 kghr
Cellulose and Hemicellulose
Anaerobic Biodigestion
Acetic Acid
83300 kghr (dry basis) Nutrients Innoculum
CO2H2 mix [12 mole ratio] 14000 kghr
Hemicellulose Biodigestion
20800 kghr (dry basis)
Pig Manure Iodoform 8333 kghr Lime
1 kghr
20000 kghr
20800 kghr (dry basis)
bull Design is based on anaerobic digestion of corn stover to carboxylic acids 1
Anaerobic Digestion of corn stover to carboxylic acids
Thermodynamic model UNIQUAC bull The capacity of the plant is based on a
Reactants Corn Stover 2000 metric tonday processing of biomass2 Innoculum Rumen Fluid biomass
CH4 Inhibitor Iodoform bull Ketones can be produced by modifying process
bullbull Energy recovered from the system
Acetic Acid CO2H2Products
Energy recovered from the system
1 Design based on process described by Thanakoses et al ldquoFermentation of Corn Stover to Carboxylic Acidsrdquo BioTech and Bio Eng Vol 83 No 2 2003 2 Aden A et al NRELTP-510-32438 National Renewable Energy Laboratory Golden CO (June 2002)
Gasification
Ammonia Ammonia derivatives
Gasification Methanol Methanol derivatives Syngas
Hydrogen
Cellulose and Hemicellulose
Hydrogen
- Biomass can be gasified to produce of syngas Biomass can be gasified to produce of syngas
- Syngas can be converted to chemicals like methanol ammonia and hydrogen
Industries in Louisiana
bull ndash Dow
ndash DuPont ndash BASF
ShellShell
ndash Exxon
ndash Monsanto
ndash Mosaic
ndash Union Carbide
hellip and othershellip and others
Petrochemical complex in the lower Mississippi River Corridor
Photo Peterson 2000
Base Case of Plants in the Lower Mississippi River Corridor
Plants in the Base Case
bull Ammonia bull Nitric acid bull Ammonium nitrate bull Urea bull UAN bull Methanol bull Granular triple super phosphate bull MAP amp DAP bull Contact pprocess for Sulfuric acid bull Wet process for Phosphoric acid bull Acetic acid bull Ethylbenzene bull Styyrene
Biomass Complex
Methanol DAP Acids
Base Case Complex
Integrated Chemical Production Complex
Utilities CO2
New Processes Utilizingg Biomass Feedstock
bull Fermentation to EthanolCO2
bull Ethanol to Ethylene process bull Transesterification to FAME Glycerol bull Glycerol to Propylene Glycol process bull Anaerobic Digestion to Acetic Acid H2 CO2
bull Gasification to Syngas
Superstructure with New Processes Utilizingg CO2 Integrated into Base Case
bull Electric furnace process for phosphoric acid phosphoric acid
bull HCl process for phosphoric acid bull SO2 recovery from gypsum bull S amp SO2 recovery from gypsum bull Acetic acid from CO Acetic acid from CO2 amp CH4bull amp CH bull Graphite amp H2 bull Syngas from CO2 amp CH4 bull Propane dehydrogenation bullbull Propylene from propane amp CO Propylene from propane amp CO2 bull Styrene from ethylbenzene amp CO2 bull Methanol from CO2 amp H2 bull Formic acid bullbull Methylamines Methylamines bull Ethanol bull Dimethylether
Past work done by our group where CO2 is utilized to make chemicals and integrated into base case
Processes in the Optimal Structure
Plants in the Base Case Plants in the Base Case bull Ammonia
bull Nitric acid
bull Ammonium nitrate Ammonium nitrate
bull Urea
bull UAN
bull Methanol
bull Granular triple super phosphate
bull MAP amp DAP
bull Contact process for Sulfuric acid
bull f h h i idWet process for phosphoric acid
bull Ethylbenzene
bull Styrene
N t i th CNot in the BBase Case bull Acetic acid
New Plants in the Optimal Structure New Plants in the Optimal Structure bull Acetic acid from CO2 amp CH4
bull Graphite amp H2
bull Syngas from CO Syngas from CO2 amp CH4amp CH
bull Formic acid
bull Methylamines
Plants Not in the Optimal Structure Plants Not in the Optimal Structure bull Electric furnace process for phosphoric acid
bull HCl process for phosphoric acid
bull SOSO2 recovery from gypsum bull recovery from gypsum
bull S amp SO2 recovery from gypsum
bull Propane dehydrogenation
bull Propylene from propane amp CO22
bull Styrene from ethylbenzene amp CO2
bull Methanol from CO2 amp H2
bull Ethanol
bull Dimethylether
SPACE BASED SOLAR POWER SPACE‐BASED SOLAR POWER ADVANCED CAR BATTERIES UTILITY STORAGE CARBON CAPTURE AND STORAGE NEXT‐GENERATION BIOFUELS
Algae ‐ New Feedstock Option that use CO2 Algae New Feedstock Option that use CO2
bull Algae ndash Consumes CO2 in a continuous
process using exhaust from power plant (40 CO2 and 86 NO)
ndash Can be separated into oil and carb hbohyddrattes
ndash Upto 5000 gallonsacre of yield of alcohol produced compared to 350 gallonsacre corn based ethanol1 gallonsacre corn based ethanol
ndash Upto 15000 gallonsacre of algae oil produced compared to 60 gallonsacre for soybean oil2
ndash Water used can be recycled and waste water can be used as compared to oilseed cropsrsquo high water demand water demand
ndash High growth rates can be harvested 1 Wall Street Journal Oct 19 2009
daily 2 National Geographic October 2007
Algae FeedstockAlgae Feedstock
mdash ExxonMobil Announcement ‐ it will invest more than $600 million in algae‐based biofuels in association with Synthetic Genomics Inc 1 algae based biofuels in association with Synthetic Genomics Inc mdash Dow Announcement ndash Algenol and Dow Chemical Company announced a pilot scale Algae‐based process to convert CO2 to ethanol2
Algenol Bioffuels Inc algae to ethanol test ffacility in Florida
1 Biodiesel Magazine July 2009 2 and Photo Ethanol Producer Magazine September 2009
Integrated Chemical Production Complex
CO2
CO2
Chemicals like methylamines
h lmethanol acetic acid etc from CO2
Algae growth for use as biomass
Multicriteria Optimization ProblemMulticriteria Optimization Problem Maximize w1P+w2S
P = Σ Product Sales ndash Σ Economic Costs ndash Σ Environmental Costs S = Σ Sustainability (Credits ndash Costs)
w1 + w2 = 1 Subject to
MultiplantMultiplant material and energy balancematerial and energy balance Product demand Raw material availability Plant capacities
Costs in the Triple Bottom line bull Economic Costs
ndash Icarus Process Evaluator results for capital costs ndash Icarus Process Evaluator results for operating costs including raw material
costs and utilities
bull Environmental costs ndash AIChETCA report 1 lists environmental costs as approximately 20 of total
manufacturing cost and raw material as 30 of manufacturing costs (datamanufacturing cost and raw material as 30 of manufacturing costs (data provided by Amoco DuPont and Novartis)
ndash Environmental cost estimated as 67 of raw material cost
bull Sustainable costs ndash Sustainable costs were estimated from results given for power generation in
AIChETCA report 1
ndash Al h d i i bl b i lAlternate methods to estimate sustainable costs are being evaluatedd
Component Sustainable Cost ($mt)
NOx 1030
Carbon Dioxide 325
SOx 192
1 Constable D et al ldquoTotal Cost Assessment Methodology Internal Managerial Decision Making Toolrdquo AIChE ISBN 0-8169-0807-9 July 1999
Raw Material and Product Prices (Base Case)
Raw Materials Raw Materials Cost ($mt) Cost ($mt) Raw Materials Raw Materials Cost ($mt) Cost ($mt) ProductsProducts Natural Gas 172 Market cost for short term Ammonia 150 Phosphate Rock purchase
Methanol
300 wet process
27
Reducing gas
1394
Acetic Acid 1034
electrofurnace
24 Wood gas
634
GTSP 142 HCl process
25
Sustainable Costs and Credits MAP 180 GTSP process 30 Credit for CO2 650 DAP 165
HCl
50
Consumption
NH
4NO3 153 Sulfur Debit for CO2
325
UAN 112 Frasch Frasch 4242 ProductionProduction UreaUrea 154154 Claus
38
Credit for HP Steam 10 H3PO4
320
C electrofurnace 760 Credit for IP Steam 64 Ethanol 670 Ethylene 446 Credit for gypsum 5 Ethylbenzene 551 Benzene 257 Consumption
Propene
240 Propane 163 Debit for gypsum 25 CO 31
Production
Graphite 882 Debit for NOx 1025 H2 796
Production
Styrene
705 Debit for SO2 Debit for SO2 150150 Toluene Toluene 238238
Production
Fuel Gas 596 Formic Acid 690
MMA
1606
DMA
1606 DME 946
Price ($mt) Price ($mt)
Transportation to Gulf Coast
Waterways from the midwestern states can provide excellent transport for biomassWaterways from the midwestern states can provide excellent transport for biomass feedstock to the Gulf Coast Industries in the Lower Mississippi River Corridor can receive the feedstock and convert to chemicals
Map created from httpnationalatlasgov
Natural Gas Pipelines in the United States
Major CO2 Pipelines in the United States
Source httpncseonlineorgnlecrsreports07mayrl33971pdf
Summary E d h Ch i l P d i C l i h LExtend the Chemical Production Complex in the Lower
Mississippi River Corridor to include Biomass based chemical pproduction compplex
CO2 utilization from the complex
Obtained the relations for the above chemical plants A il bilit f t i lAvailability of raw materials
Demand for product
Plant capacities
Material and energy balance equations
Assigned Triple Bottomline costs Economic costsEconomic costs
Environmental costs
Sustainable credits and costs
Summary bull Solve Multicriteria Optimization Problem with constraints
bull Use Mixed Integer Non Linear Programming Global Optimization Solvers to obtain Pareto optimal solutions of the problem belowobtain Pareto optimal solutions of the problem below
Optimise w1P+w2S
P = P = ΣΣProduct Product SalesSales ndash ΣΣEconomic Economic Costs Costs ndash ΣEnvironmental Costs ΣEnvironmental Costs
S = ΣSustainability (Credits ndash Costs) w1 + w2 = 1
bull Use Monte Carlo Analysis to determine sensitivity of the optimal solution
bull Follow the procedure to include plants in the Gulf Coast Region (Texas L iLouisiiana Missiissiippii Alabbama))Mi Al
bull Methodology can be applied to other chemical complexes of the world
Research White Paper and Presentation available at wwwmprilsuedu
TCA Cost Explanations
Cost Type Description Examples
I Direct costs Manufacturing site costs Capital investment operating labor materials and waste disposal costs
II Indirect costs Corporate andpo Reporting costs regulatory costs andepo g egu y manufacturing overhead monitoring costs
III Future and Potential fines penalties Clean‐up personal injury and contingent liability and future liabilities property damage lawsuits industrial costs accident costs
IV Intangible Difficult‐to‐measure but Cost to maintain customer loyalty internal costs real costs borne by the worker morale union relations and (Company‐paid) company community relations
V External costs Costs borne by society Effect of operations on housing costs (Not currently paid degradation of habitat effect of b th )by the company) ll ti h h lth pollution on human health
Biomass Components
α links β links
Hexose Pentose Complex polymer containing phenolic Triglycerides compounds
Algae SpeciesAlgae Species
bull The following species listed are currently being studied for their suitability as a mass‐oil producing crop across various locations worldwide
bull Botryococcus braunii
bull Chlorella
bull Dunaliella tertiolecta
bull Gracilaria
bull Pleurochrysis carterae (also called CCMP647)[39] bull Pleurochrysis carterae (also called CCMP647)[39]
bull Sargassum with 10 times the output volume of Gracilaria[40]
Costs in the Triple Bottom line
Relative Price per unit energy of various feedstocks and products quoted in their traditional units and calibrated to $$GJ
Contour plot of production cost plus return on investment as a function of capital and variable costs (based on 1000Ggyear of olefin production)
CEP March 2008 Pg S7-S14
Total Capital Cost ($ million)
111
543 606 756 854
0
500
1000
Grain ethanol Hydrogen Methanol Cellulosic Fischer‐Tropschyd oge ethanol
opsc Liquids
Costs in the Triple Bottom line
Capital Cost per unit of Production ($ per BPD gasoline equivalent)
13000
59000 66000 76000 86000
0
50000
100000
($ per BPD gasoline equivalent)
Grain ethanol Hydrogen Methanol Cellulosic ethanol
Fischer‐Tropsch Liquids
Capital and operating costs for 150 million gallons per year (MMGPY) of gasoline equivalent plants 2005 dollars plants 2005 dollars
Operating Cost
105 122 128 176 18
05 1
15 2
p g ($ per gallon of gasoline equivalent)
0
Hydrogen Grain ethanol Methanol Cellulosic ethanol
Fischer‐Tropsch Liquids
Biofpr 149-56 (2007)
Industry Perspective
Ethylene and Propylene are basic building blocks for polymers and chemical intermediates
Approximately 1 of global energy market and 3 of global oil and gas mark t i ket is usedd as chhemiicall feedstock
frac12 of the energy and frac34 mass of the chemical feedstock is retained in the end product
1
2
3
1 CEP March 2008 Pg S7-S14 2 httpwwwbraskemcombrsiteportal_braskemen sala_de_imprensasala_de_imprensa_detalhes_6970aspx 3 httpwwwashlandcompress_roomnews_detailasps=1543
- Structure Bookmarks
-
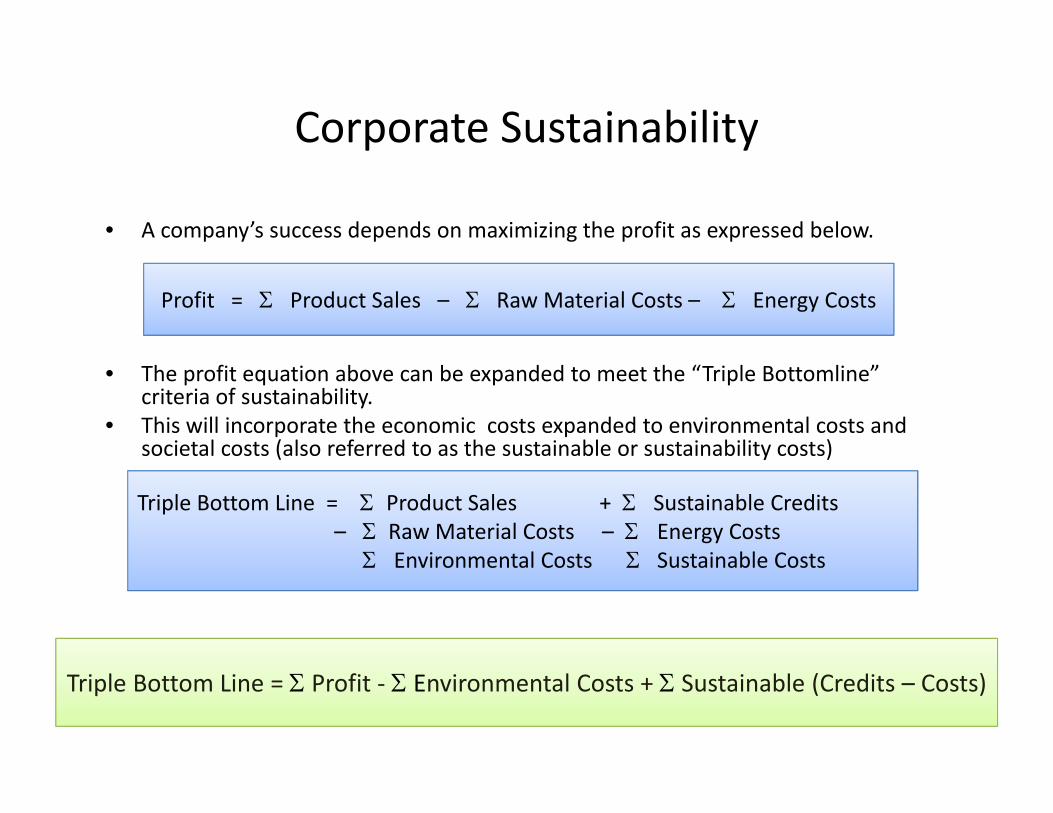
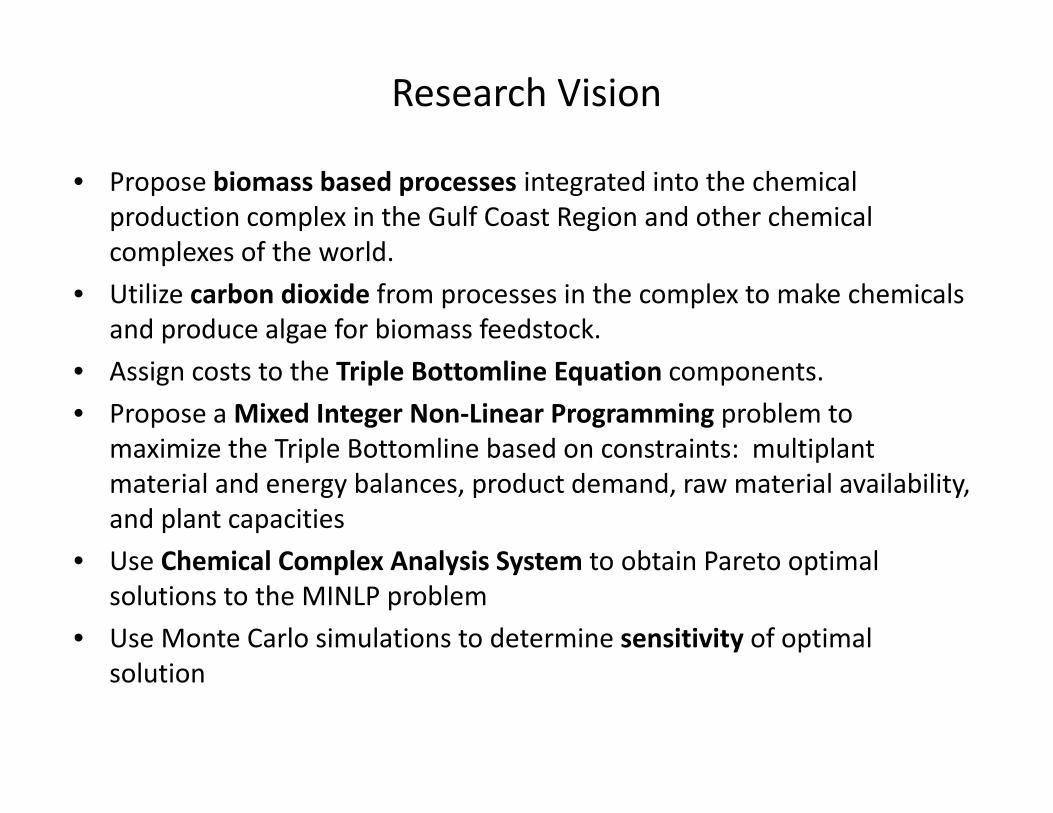

Transesterification
13‐ propanediol Glycerol
Glycerol derivatives
N t l Oil T t ifi ti
Propylene glycol
Polyurethane Natural Oils Transesterification
y polyols FAME or FAEE
ndash Transesterification process is the treatment of natural oils with an alcohol and a catalyst to produce esters and glycerol ndash Methanol or ethanol is used as alcohol for fatty acid methyl or ethyl esters (FAMEFAEE) ndash These esters can be transformed to polymers ndash Glycerol is produced ~ 10 by weight in the process ndash Gl l b i t d d t th l h iGlycerol can be introduced to the propylene chain
HYSYS Design of Transesterification Process
Methyl ester purification Transesterification Reaction
Glycerol recovery and purification y y p
Design Description of Transesterification
Glycerol 4250 kghr Natural 393 kghr OilsOils
4250 kghr Methanol
Transesterification FAME or FAEE
612 kghr
bull The design is divided into three sections ndash Transesterification reaction
ndash Methyl ester purification Methyl ester purification
ndash Glycerol recovery and purification
bull 10 million gallons per year 1 of Fatty Acid Methyl Ester (FAME) produced
bull FAME is util dlized in manuffacture off pollymers
bull Glycerol is used in manufacture of propylene glycol
bull This pprocess can use Alggae oil as feedstock
bull The energy required for the process was comparable to the energy liberated
Transesterification
Thermodynamic model
Reactants
Catalyyst
Products
Temperature Temperature
UNIQUAC
Methanol Soybean Oil
178 (ww) Sodium Methyylate ( ) in methanol
Methyl Ester Glycerol
60oCC60
Methyl Ester Purification
Wash agents Water HClHCl
Glycerol Recovery and Purification
Purification NaOH Agents Water
HCl
1 Design based on ldquoA process model to estimate biodiesel production costsrdquoMJ Haas et al Bioresource Technology 97 (2006) 671-678
ICARUS Process Evaluator Economic Analysis of Transesterification
Economic Analysis
Economic Life
Plant Capacity
Total Project Capital Cost
Total Operating Cost
Total Raw Materials Cost Total Raw Materials Cost
Total Utilities Cost
Total Product Sales Total Product Sales
10
10300000
6930000
22600000
19 100 000 19100000
139000
22 600 000 22600000
years
gallonsyear Methyl Ester
USD
USDyear
USDyear USDyear
USDyear
USDyear 218 USDgallon of Methyl Ester
HYSYS Design of Glycerol to Propylene Glycol Hydrogenolysis Reaction
Purification of Propylene Glycol
Design description of Propylene Glycol
Propylene Glycol Glycerol
Hydrogen 200oC 200 psi
246 kghr
Propylene Glycol Glycerol
15000 kghr 9300 kghr
Hydrogenolysis Hydrogenolysis
Thermodynamic model UNIQUAC
Reactants Glycerol
bull Thhe ddesign is bbasedd on a llow pressure (200 psi) and temperature (200oC) process for hydrogenation of glycerol to Products Propylene Glycol
propylene glycol 1 propylene glycol 1
bull ~65000 metric ton of propylene glycol is produced per year2 Pressure 200 psi
bull Th i d f The energy required for thhe process was comparable to the energy liberated
Hydrogen Hydrogen
Catalyst Copper Chromite
Water Water
200oCTemperature
1 Design based on experimental results from Dasari M A et al 2005 Applied Catalysis A General Vol 281 p 225-231 2 Capacity based on AshlandCargill joint venture of process converting glycerol to propylene glycol
ICARUS Process Evaluator Economic Analysis of Propylene Glycol
Economic Analysis
Economic Life Economic Life 1010 Years Years
Plant Capacity 164000000 lbYear propylene glycol
Total Project Capital Cost Total Project Capital Cost 6580000 USDUSD
Total Operating Cost 83400000 USDYear
Total Raw Materials Cost 73 300 000 73300000 USDYear
Total Utilities Cost 2410000 USDYear
USDYear 082 T t l P d t S l Total Product Sales USDlb lUSDlb propylene
133000000 glycol
Fermentation
Ethanol derivatives Sugars Fermentation
C6 Sugars Ethylene
Ethanol
Ethanol derivatives
Starches Enzyme Conversion
Succinic Acid
Ethylene derivatives
Succinic acid derivatives
Cellulose and Hemicellulose
Acid or Enzyme Hydrolysis
C5C6 Sugars Butanol Butanol derivatives
Hemicellulose
bull Fermentation is the enzyme‐catalyzed transformation of an organic compound bull Fermentation enzymes react with hexose and pentose to form products E l i d i dbull Enzyme selection determines product -
bull Saccharomyces Cervisiae (C6) Escherichia coli (C5 amp C6) Zymomonas mobilis (C6)ndash Ethanol bull Enggineered Eschericia coli A succinicipproducens ndash Succinic Acid bull Engineeried microorganism ‐ Butanol bull Lactic Acid Producing Bacteria (LAB) ndash Lactic Acid
HYSYS Design of Fermentation
Pretreatment Section Fermentation Section Purification Section
Design Description of Fermentation
Sugars Air Cellulase
60000 kghr 2700 kghr
19800 kghr CO2
19000 kghr
Starches
Cellulose and Hemicellulose
Fermentation Ethanol
CSL DAP waste biomass
166667 kghr 400 kghr 71 kghr 133000 kghr
53 MMGpy Million gallons per year
bull The design is based on NRELrsquos11
lignocellulosic biomass to ethanol process design which converts 2000 metric tonsday of corn stover metric tonsday of corn stover
bull Waste treatment not considered
bull Net energy was liberated from the system
Fermentatiion
Thermodynamic Model UNIQUAC
Reactants Corn Stover
reesei) Enzyme (hydrolysis) Cellulase (Trichoderma
Bacteria (fermentation) Z mobilis
Ethanol CO2 Waste Ethanol CO2 Waste Products Products
Nitrogen Sources CSL DAP
1 Design based on results from Aden A et al NRELTP-510-32438 National Renewable Energy Laboratory Golden CO (June 2002)
ICARUS Process Evaluator Economic Analysis of Fermentation
Economic Analysis
Economic Life Economic Life 1010 Years Years
Plant Capacity 53000000 gallonsYear ethanol
Total Project Capital Cost j p 20 000 000 20000000 USD
Total Operating Cost 81000000 USDYear
Total Raw Materials Cost 54000000 USDYear
Total Utilities Cost 17000000 USDYear
Total Product Sales 106000000106000000
USDYear 150 USDgallon ethanol USDgallon ethanol
HYSYS Design of Ethanol to Ethylene
Dehydration Section Purification Section y
bull
Description of Ethylene Process
Ethylene Ethanol
300oC Fluidized bed process 99 conversion
41 500 k h 25 000 k h 41500 kghr 25000 kghr
Design is based on dehydrogenation Design is based on dehydrogenation of ethanol to ethylene1
bull The capacity of the plant is based on a 200000 metric tonyear ethylene a 200000 metric tonyear ethylene production facility proposed by Braskem in Brazil2
bull Net energy was required by the ener was required by theNet gy system
Dehydrogenation Dehydrogenation
Thermodynamic model UNIQUAC
Reactants Ethanol
Catalyst Activated silica‐alumina
Products Ethylene Water Water
Temperature 300oC
1 Design based on process described by Wells G M 1999 Handbook of Petrochemicals and Processes Sec Ed Pg 207-208 2 Capacity based on Braskem proposed ethanol to ethylene plant in Brazil httpwwwbraskemcombr
ICARUS Process Evaluator Economic Analysis of Ethylene
Economic Analysis
Economic Life Economic Life 1010 Years Years
Plant Capacity 440400000 lbYear ethylene
Total Project Capital Cost Total Project Capital Cost 3 000 000 3000000 USDUSD
Total Operating Cost 186000000 USDYear
Total Raw Materials Cost 169 000 000 169000000 USDYear
Total Utilities Cost 3000000 USDYear
Total Product Sales 186 000 000 186000000
USDYear 042 USDlb ethylene USDlb ethylene
Anaerobic Digestion
bull Anaerobic digestion of biomass is the treatment of biomass with a mixed culture of bacteria in absence of oxygen to produce methane (biogas) andculture of bacteria in absence of oxygen to produce methane (biogas) and carbon dioxide
bull Four stages hydrolysis acidogenesis acetogenesis and methanogenesis
bull Mi Al I hibit f th t f th d ti MixAlco process ndash Inhibits fourth stage of methane production usiing iodoform (CHI3) or bromoform (CHBr3) Reduces cost of process by using mixed culture of bacteria from cattle rumen Produces mixed alcohols carboxylic acids and ketones carboxylic acids and ketones
HYSYS Design of Anaerobic Digestion
Pretreatment Section Anaerobic Digestion Section
Purification Section Section
Design Description of Anaerobic Digestion
14 000 kghr
Cellulose and Hemicellulose
Anaerobic Biodigestion
Acetic Acid
83300 kghr (dry basis) Nutrients Innoculum
CO2H2 mix [12 mole ratio] 14000 kghr
Hemicellulose Biodigestion
20800 kghr (dry basis)
Pig Manure Iodoform 8333 kghr Lime
1 kghr
20000 kghr
20800 kghr (dry basis)
bull Design is based on anaerobic digestion of corn stover to carboxylic acids 1
Anaerobic Digestion of corn stover to carboxylic acids
Thermodynamic model UNIQUAC bull The capacity of the plant is based on a
Reactants Corn Stover 2000 metric tonday processing of biomass2 Innoculum Rumen Fluid biomass
CH4 Inhibitor Iodoform bull Ketones can be produced by modifying process
bullbull Energy recovered from the system
Acetic Acid CO2H2Products
Energy recovered from the system
1 Design based on process described by Thanakoses et al ldquoFermentation of Corn Stover to Carboxylic Acidsrdquo BioTech and Bio Eng Vol 83 No 2 2003 2 Aden A et al NRELTP-510-32438 National Renewable Energy Laboratory Golden CO (June 2002)
Gasification
Ammonia Ammonia derivatives
Gasification Methanol Methanol derivatives Syngas
Hydrogen
Cellulose and Hemicellulose
Hydrogen
- Biomass can be gasified to produce of syngas Biomass can be gasified to produce of syngas
- Syngas can be converted to chemicals like methanol ammonia and hydrogen
Industries in Louisiana
bull ndash Dow
ndash DuPont ndash BASF
ShellShell
ndash Exxon
ndash Monsanto
ndash Mosaic
ndash Union Carbide
hellip and othershellip and others
Petrochemical complex in the lower Mississippi River Corridor
Photo Peterson 2000
Base Case of Plants in the Lower Mississippi River Corridor
Plants in the Base Case
bull Ammonia bull Nitric acid bull Ammonium nitrate bull Urea bull UAN bull Methanol bull Granular triple super phosphate bull MAP amp DAP bull Contact pprocess for Sulfuric acid bull Wet process for Phosphoric acid bull Acetic acid bull Ethylbenzene bull Styyrene
Biomass Complex
Methanol DAP Acids
Base Case Complex
Integrated Chemical Production Complex
Utilities CO2
New Processes Utilizingg Biomass Feedstock
bull Fermentation to EthanolCO2
bull Ethanol to Ethylene process bull Transesterification to FAME Glycerol bull Glycerol to Propylene Glycol process bull Anaerobic Digestion to Acetic Acid H2 CO2
bull Gasification to Syngas
Superstructure with New Processes Utilizingg CO2 Integrated into Base Case
bull Electric furnace process for phosphoric acid phosphoric acid
bull HCl process for phosphoric acid bull SO2 recovery from gypsum bull S amp SO2 recovery from gypsum bull Acetic acid from CO Acetic acid from CO2 amp CH4bull amp CH bull Graphite amp H2 bull Syngas from CO2 amp CH4 bull Propane dehydrogenation bullbull Propylene from propane amp CO Propylene from propane amp CO2 bull Styrene from ethylbenzene amp CO2 bull Methanol from CO2 amp H2 bull Formic acid bullbull Methylamines Methylamines bull Ethanol bull Dimethylether
Past work done by our group where CO2 is utilized to make chemicals and integrated into base case
Processes in the Optimal Structure
Plants in the Base Case Plants in the Base Case bull Ammonia
bull Nitric acid
bull Ammonium nitrate Ammonium nitrate
bull Urea
bull UAN
bull Methanol
bull Granular triple super phosphate
bull MAP amp DAP
bull Contact process for Sulfuric acid
bull f h h i idWet process for phosphoric acid
bull Ethylbenzene
bull Styrene
N t i th CNot in the BBase Case bull Acetic acid
New Plants in the Optimal Structure New Plants in the Optimal Structure bull Acetic acid from CO2 amp CH4
bull Graphite amp H2
bull Syngas from CO Syngas from CO2 amp CH4amp CH
bull Formic acid
bull Methylamines
Plants Not in the Optimal Structure Plants Not in the Optimal Structure bull Electric furnace process for phosphoric acid
bull HCl process for phosphoric acid
bull SOSO2 recovery from gypsum bull recovery from gypsum
bull S amp SO2 recovery from gypsum
bull Propane dehydrogenation
bull Propylene from propane amp CO22
bull Styrene from ethylbenzene amp CO2
bull Methanol from CO2 amp H2
bull Ethanol
bull Dimethylether
SPACE BASED SOLAR POWER SPACE‐BASED SOLAR POWER ADVANCED CAR BATTERIES UTILITY STORAGE CARBON CAPTURE AND STORAGE NEXT‐GENERATION BIOFUELS
Algae ‐ New Feedstock Option that use CO2 Algae New Feedstock Option that use CO2
bull Algae ndash Consumes CO2 in a continuous
process using exhaust from power plant (40 CO2 and 86 NO)
ndash Can be separated into oil and carb hbohyddrattes
ndash Upto 5000 gallonsacre of yield of alcohol produced compared to 350 gallonsacre corn based ethanol1 gallonsacre corn based ethanol
ndash Upto 15000 gallonsacre of algae oil produced compared to 60 gallonsacre for soybean oil2
ndash Water used can be recycled and waste water can be used as compared to oilseed cropsrsquo high water demand water demand
ndash High growth rates can be harvested 1 Wall Street Journal Oct 19 2009
daily 2 National Geographic October 2007
Algae FeedstockAlgae Feedstock
mdash ExxonMobil Announcement ‐ it will invest more than $600 million in algae‐based biofuels in association with Synthetic Genomics Inc 1 algae based biofuels in association with Synthetic Genomics Inc mdash Dow Announcement ndash Algenol and Dow Chemical Company announced a pilot scale Algae‐based process to convert CO2 to ethanol2
Algenol Bioffuels Inc algae to ethanol test ffacility in Florida
1 Biodiesel Magazine July 2009 2 and Photo Ethanol Producer Magazine September 2009
Integrated Chemical Production Complex
CO2
CO2
Chemicals like methylamines
h lmethanol acetic acid etc from CO2
Algae growth for use as biomass
Multicriteria Optimization ProblemMulticriteria Optimization Problem Maximize w1P+w2S
P = Σ Product Sales ndash Σ Economic Costs ndash Σ Environmental Costs S = Σ Sustainability (Credits ndash Costs)
w1 + w2 = 1 Subject to
MultiplantMultiplant material and energy balancematerial and energy balance Product demand Raw material availability Plant capacities
Costs in the Triple Bottom line bull Economic Costs
ndash Icarus Process Evaluator results for capital costs ndash Icarus Process Evaluator results for operating costs including raw material
costs and utilities
bull Environmental costs ndash AIChETCA report 1 lists environmental costs as approximately 20 of total
manufacturing cost and raw material as 30 of manufacturing costs (datamanufacturing cost and raw material as 30 of manufacturing costs (data provided by Amoco DuPont and Novartis)
ndash Environmental cost estimated as 67 of raw material cost
bull Sustainable costs ndash Sustainable costs were estimated from results given for power generation in
AIChETCA report 1
ndash Al h d i i bl b i lAlternate methods to estimate sustainable costs are being evaluatedd
Component Sustainable Cost ($mt)
NOx 1030
Carbon Dioxide 325
SOx 192
1 Constable D et al ldquoTotal Cost Assessment Methodology Internal Managerial Decision Making Toolrdquo AIChE ISBN 0-8169-0807-9 July 1999
Raw Material and Product Prices (Base Case)
Raw Materials Raw Materials Cost ($mt) Cost ($mt) Raw Materials Raw Materials Cost ($mt) Cost ($mt) ProductsProducts Natural Gas 172 Market cost for short term Ammonia 150 Phosphate Rock purchase
Methanol
300 wet process
27
Reducing gas
1394
Acetic Acid 1034
electrofurnace
24 Wood gas
634
GTSP 142 HCl process
25
Sustainable Costs and Credits MAP 180 GTSP process 30 Credit for CO2 650 DAP 165
HCl
50
Consumption
NH
4NO3 153 Sulfur Debit for CO2
325
UAN 112 Frasch Frasch 4242 ProductionProduction UreaUrea 154154 Claus
38
Credit for HP Steam 10 H3PO4
320
C electrofurnace 760 Credit for IP Steam 64 Ethanol 670 Ethylene 446 Credit for gypsum 5 Ethylbenzene 551 Benzene 257 Consumption
Propene
240 Propane 163 Debit for gypsum 25 CO 31
Production
Graphite 882 Debit for NOx 1025 H2 796
Production
Styrene
705 Debit for SO2 Debit for SO2 150150 Toluene Toluene 238238
Production
Fuel Gas 596 Formic Acid 690
MMA
1606
DMA
1606 DME 946
Price ($mt) Price ($mt)
Transportation to Gulf Coast
Waterways from the midwestern states can provide excellent transport for biomassWaterways from the midwestern states can provide excellent transport for biomass feedstock to the Gulf Coast Industries in the Lower Mississippi River Corridor can receive the feedstock and convert to chemicals
Map created from httpnationalatlasgov
Natural Gas Pipelines in the United States
Major CO2 Pipelines in the United States
Source httpncseonlineorgnlecrsreports07mayrl33971pdf
Summary E d h Ch i l P d i C l i h LExtend the Chemical Production Complex in the Lower
Mississippi River Corridor to include Biomass based chemical pproduction compplex
CO2 utilization from the complex
Obtained the relations for the above chemical plants A il bilit f t i lAvailability of raw materials
Demand for product
Plant capacities
Material and energy balance equations
Assigned Triple Bottomline costs Economic costsEconomic costs
Environmental costs
Sustainable credits and costs
Summary bull Solve Multicriteria Optimization Problem with constraints
bull Use Mixed Integer Non Linear Programming Global Optimization Solvers to obtain Pareto optimal solutions of the problem belowobtain Pareto optimal solutions of the problem below
Optimise w1P+w2S
P = P = ΣΣProduct Product SalesSales ndash ΣΣEconomic Economic Costs Costs ndash ΣEnvironmental Costs ΣEnvironmental Costs
S = ΣSustainability (Credits ndash Costs) w1 + w2 = 1
bull Use Monte Carlo Analysis to determine sensitivity of the optimal solution
bull Follow the procedure to include plants in the Gulf Coast Region (Texas L iLouisiiana Missiissiippii Alabbama))Mi Al
bull Methodology can be applied to other chemical complexes of the world
Research White Paper and Presentation available at wwwmprilsuedu
TCA Cost Explanations
Cost Type Description Examples
I Direct costs Manufacturing site costs Capital investment operating labor materials and waste disposal costs
II Indirect costs Corporate andpo Reporting costs regulatory costs andepo g egu y manufacturing overhead monitoring costs
III Future and Potential fines penalties Clean‐up personal injury and contingent liability and future liabilities property damage lawsuits industrial costs accident costs
IV Intangible Difficult‐to‐measure but Cost to maintain customer loyalty internal costs real costs borne by the worker morale union relations and (Company‐paid) company community relations
V External costs Costs borne by society Effect of operations on housing costs (Not currently paid degradation of habitat effect of b th )by the company) ll ti h h lth pollution on human health
Biomass Components
α links β links
Hexose Pentose Complex polymer containing phenolic Triglycerides compounds
Algae SpeciesAlgae Species
bull The following species listed are currently being studied for their suitability as a mass‐oil producing crop across various locations worldwide
bull Botryococcus braunii
bull Chlorella
bull Dunaliella tertiolecta
bull Gracilaria
bull Pleurochrysis carterae (also called CCMP647)[39] bull Pleurochrysis carterae (also called CCMP647)[39]
bull Sargassum with 10 times the output volume of Gracilaria[40]
Costs in the Triple Bottom line
Relative Price per unit energy of various feedstocks and products quoted in their traditional units and calibrated to $$GJ
Contour plot of production cost plus return on investment as a function of capital and variable costs (based on 1000Ggyear of olefin production)
CEP March 2008 Pg S7-S14
Total Capital Cost ($ million)
111
543 606 756 854
0
500
1000
Grain ethanol Hydrogen Methanol Cellulosic Fischer‐Tropschyd oge ethanol
opsc Liquids
Costs in the Triple Bottom line
Capital Cost per unit of Production ($ per BPD gasoline equivalent)
13000
59000 66000 76000 86000
0
50000
100000
($ per BPD gasoline equivalent)
Grain ethanol Hydrogen Methanol Cellulosic ethanol
Fischer‐Tropsch Liquids
Capital and operating costs for 150 million gallons per year (MMGPY) of gasoline equivalent plants 2005 dollars plants 2005 dollars
Operating Cost
105 122 128 176 18
05 1
15 2
p g ($ per gallon of gasoline equivalent)
0
Hydrogen Grain ethanol Methanol Cellulosic ethanol
Fischer‐Tropsch Liquids
Biofpr 149-56 (2007)
Industry Perspective
Ethylene and Propylene are basic building blocks for polymers and chemical intermediates
Approximately 1 of global energy market and 3 of global oil and gas mark t i ket is usedd as chhemiicall feedstock
frac12 of the energy and frac34 mass of the chemical feedstock is retained in the end product
1
2
3
1 CEP March 2008 Pg S7-S14 2 httpwwwbraskemcombrsiteportal_braskemen sala_de_imprensasala_de_imprensa_detalhes_6970aspx 3 httpwwwashlandcompress_roomnews_detailasps=1543
- Structure Bookmarks
-
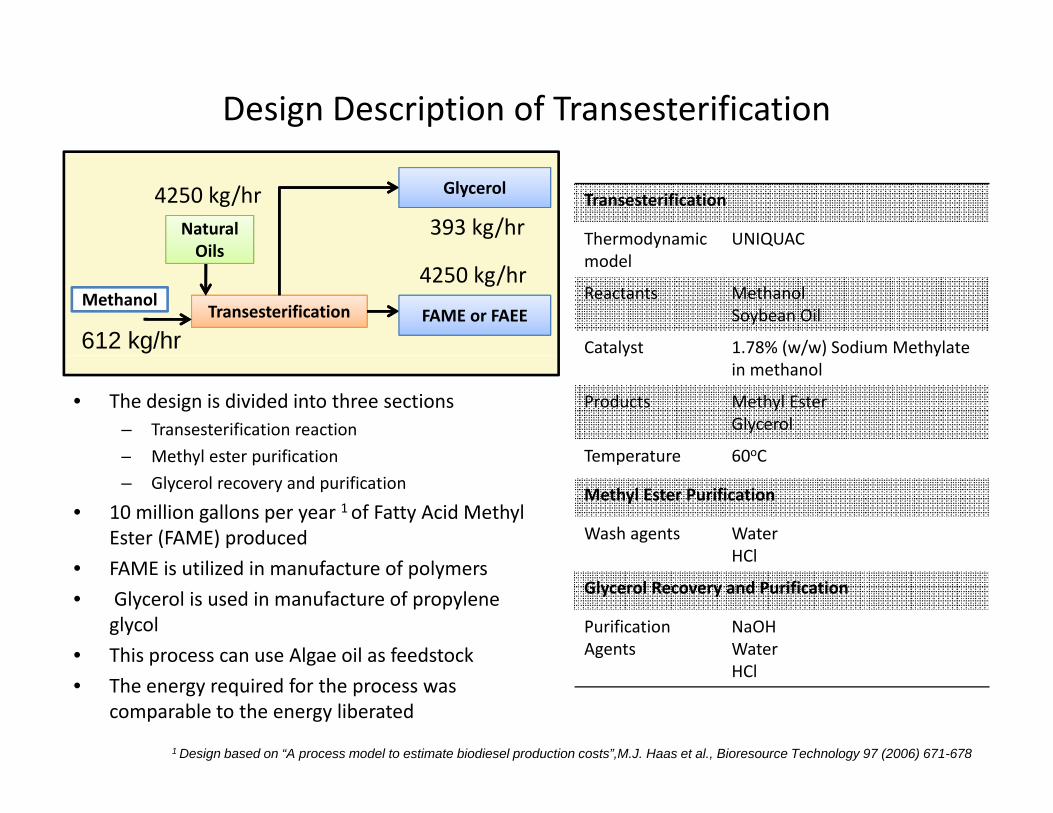
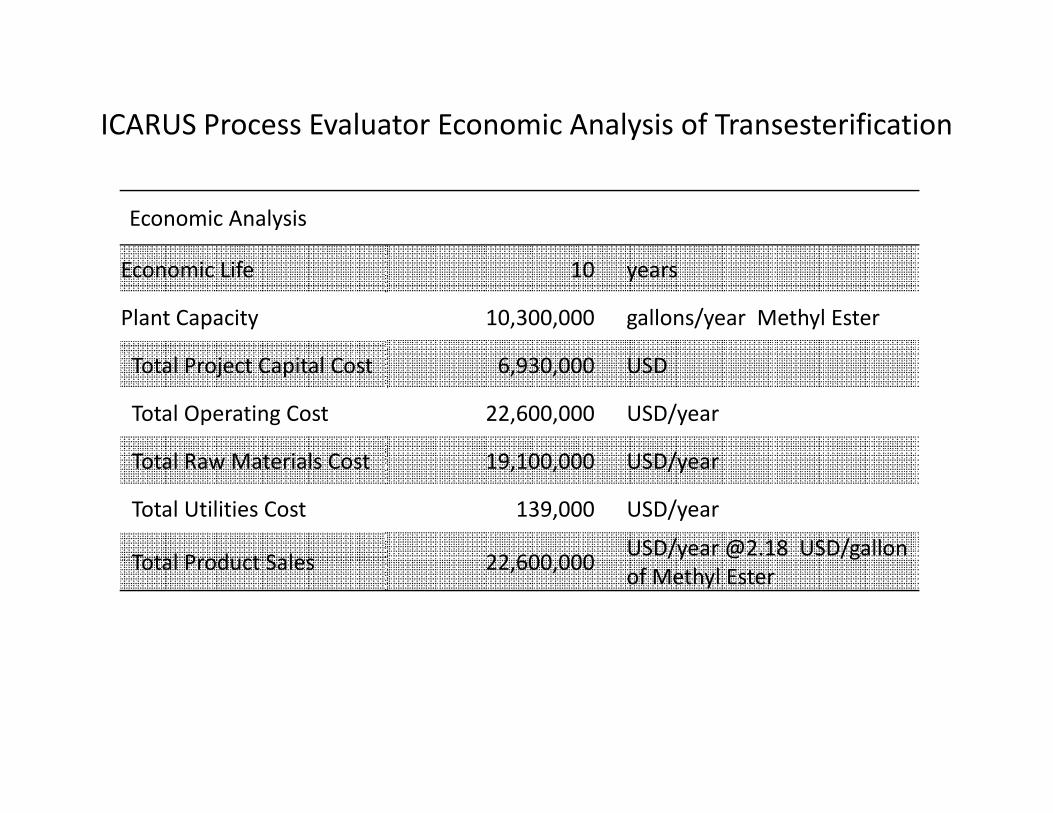
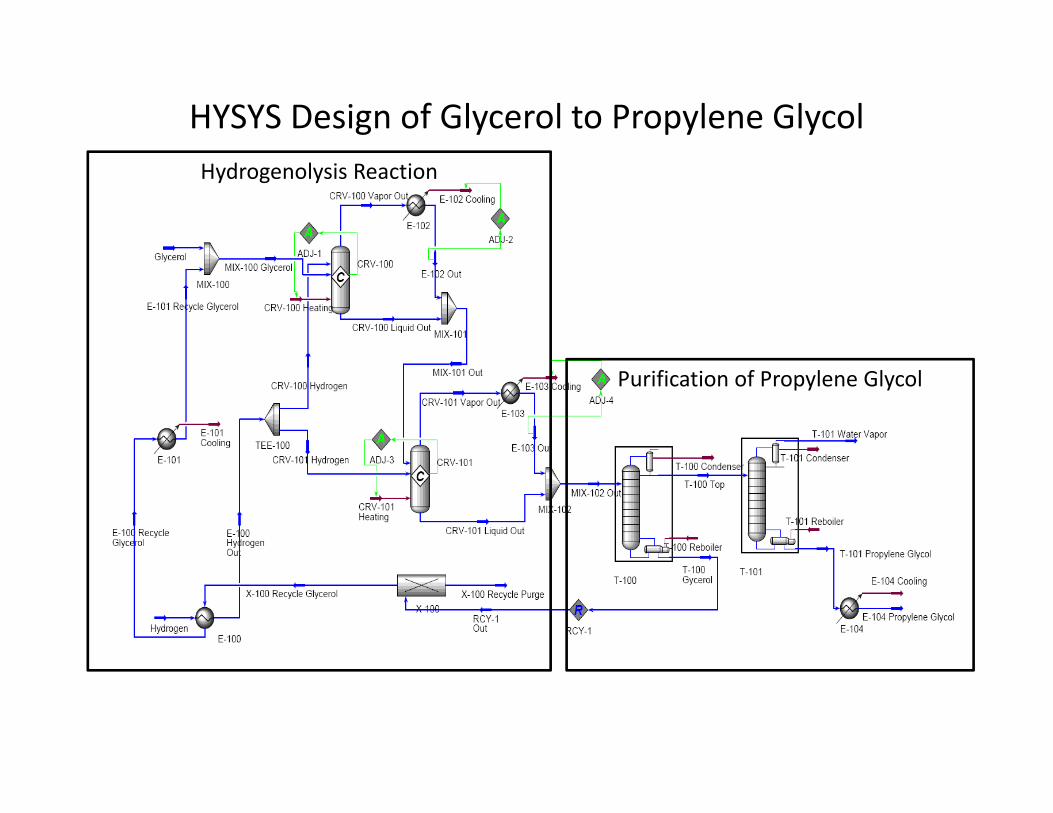
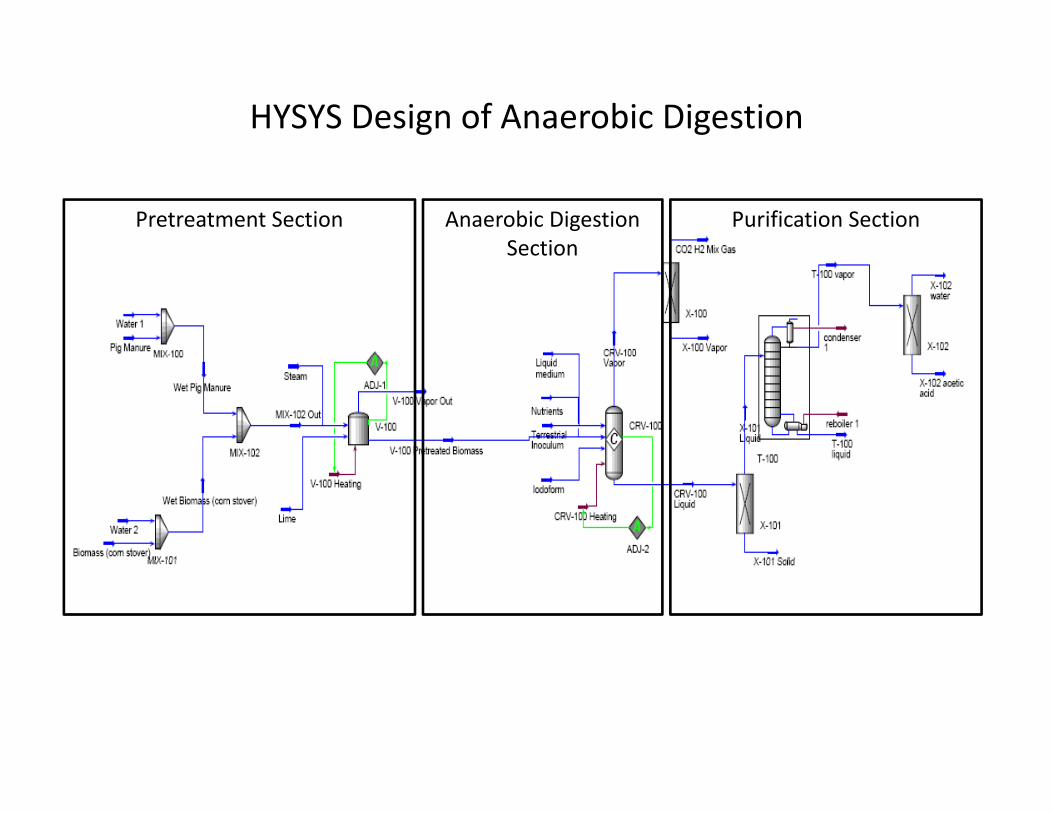
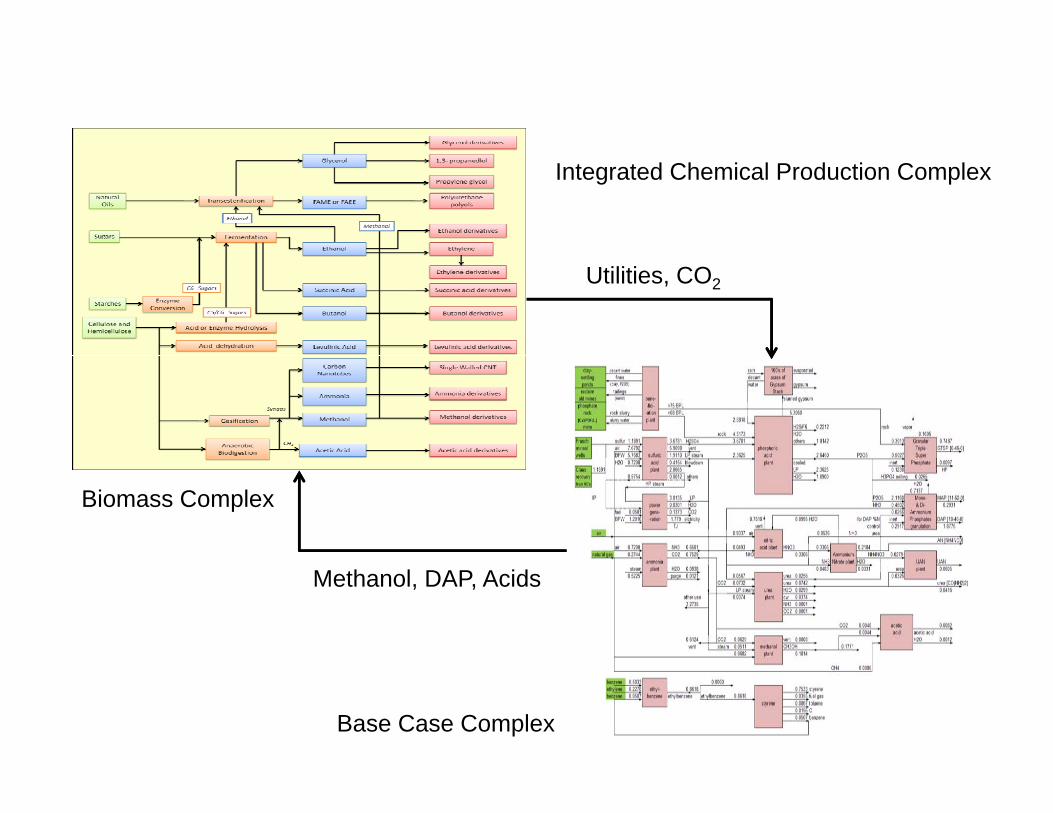
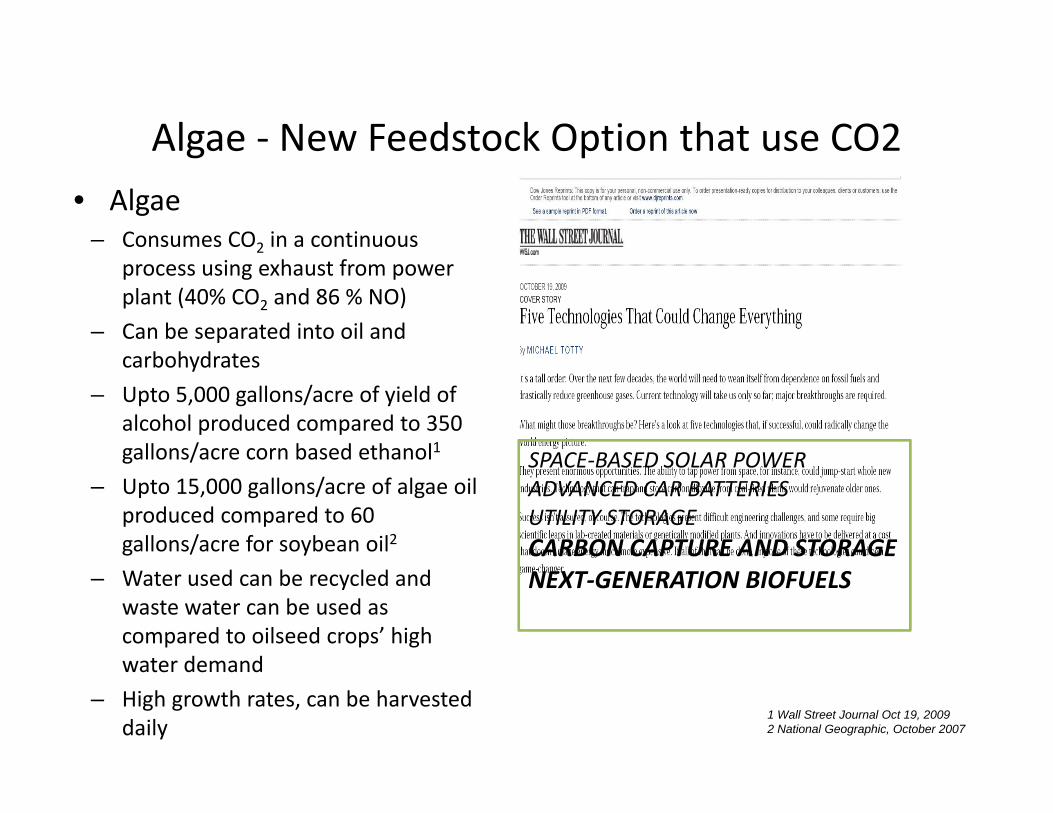
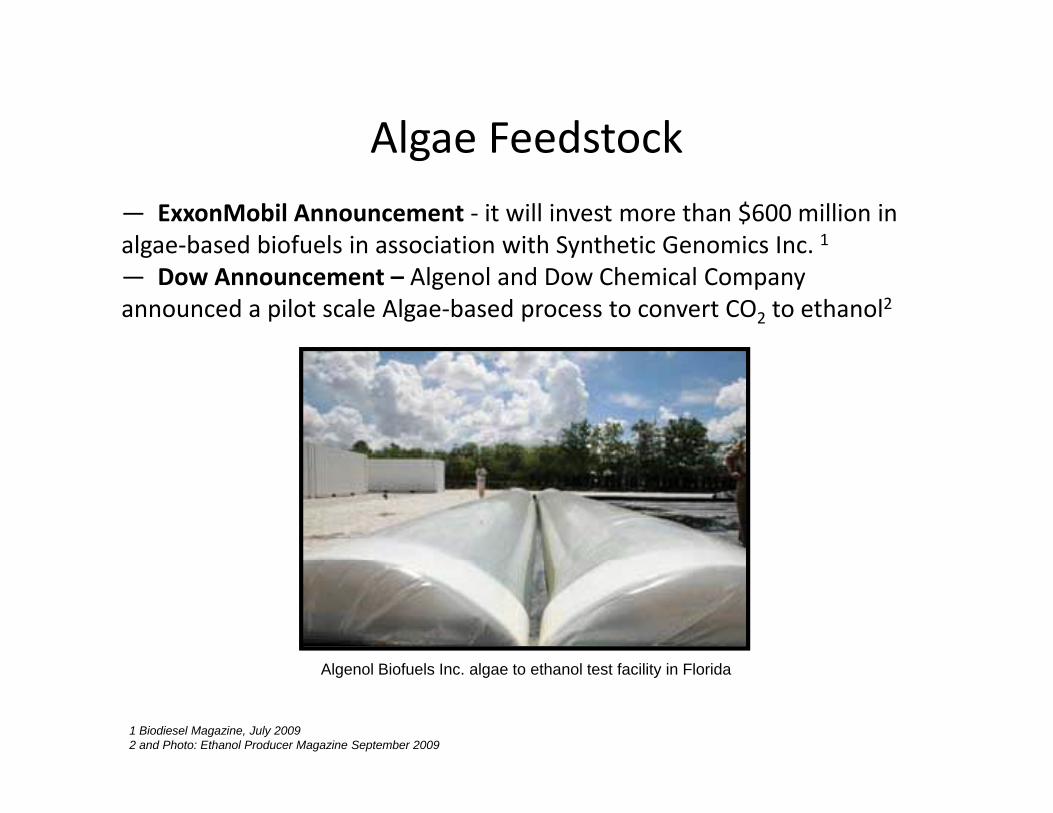

Costs in the Triple Bottom line
Relative Price per unit energy of various feedstocks and products quoted in their traditional units and calibrated to $$GJ
Contour plot of production cost plus return on investment as a function of capital and variable costs (based on 1000Ggyear of olefin production)
CEP March 2008 Pg S7-S14
Total Capital Cost ($ million)
111
543 606 756 854
0
500
1000
Grain ethanol Hydrogen Methanol Cellulosic Fischer‐Tropschyd oge ethanol
opsc Liquids
Costs in the Triple Bottom line
Capital Cost per unit of Production ($ per BPD gasoline equivalent)
13000
59000 66000 76000 86000
0
50000
100000
($ per BPD gasoline equivalent)
Grain ethanol Hydrogen Methanol Cellulosic ethanol
Fischer‐Tropsch Liquids
Capital and operating costs for 150 million gallons per year (MMGPY) of gasoline equivalent plants 2005 dollars plants 2005 dollars
Operating Cost
105 122 128 176 18
05 1
15 2
p g ($ per gallon of gasoline equivalent)
0
Hydrogen Grain ethanol Methanol Cellulosic ethanol
Fischer‐Tropsch Liquids
Biofpr 149-56 (2007)
Industry Perspective
Ethylene and Propylene are basic building blocks for polymers and chemical intermediates
Approximately 1 of global energy market and 3 of global oil and gas mark t i ket is usedd as chhemiicall feedstock
frac12 of the energy and frac34 mass of the chemical feedstock is retained in the end product
1
2
3
1 CEP March 2008 Pg S7-S14 2 httpwwwbraskemcombrsiteportal_braskemen sala_de_imprensasala_de_imprensa_detalhes_6970aspx 3 httpwwwashlandcompress_roomnews_detailasps=1543
- Structure Bookmarks
-