integration and dissemination of citizen reported and ... · pdf fileted (twitter earthquake...
TRANSCRIPT
Integration and Dissemination of Citizen Reported and Seismically Derived Earthquake Information via Social
Network Technologies
Michelle Guy1, Paul Earle1, Chris Ostrum1, Kenny Gruchalla2, Scott Horvath3 1U.S. Geological Survey National Earthquake Information Center, Golden, CO, USA
2National Renewable Energy Laboratory, Golden, CO, USA 3U.S. Geological Survey National Earthquake Information Center, Reston, VA, USA
Abstract. People in the locality of earthquakes are publishing anecdotal information about the shaking within seconds of their occurrences via social network technologies, such as Twitter. In contrast, depending on the size and location of the earthquake, scientific alerts can take between two to twenty minutes to publish. We describe TED (Twitter Earthquake Detector) a system that adopts social network technologies to augment earthquake response products and the delivery of hazard information. The TED system analyzes data from these social networks for multiple purposes: 1) to integrate citizen reports of earthquakes with corresponding scientific reports 2) to infer the public level of interest in an earthquake for tailoring outputs disseminated via social network technologies and 3) to explore the possibility of rapid detection of a probable earthquake, within seconds of its occurrence, helping to fill the gap between the earthquake origin time and the presence of quantitative scientific data.
Keywords: Twitter, micro-blogging, social network, citizen reporting, earthquake, hazard, geospatial-temporal data, time series
1. Introduction
Social network technologies are providing the general public with anecdotal earthquake hazard information before scientific information has been published from authoritative sources [1]. The United States Geological Survey (USGS) National Earthquake Information Center (NEIC) rapidly determines the location and size of felt earthquakes within the U.S. and most magnitude 5.0 and greater earthquakes worldwide. The USGS rapidly disseminates this information to National and international agencies, scientists and the general public. Due to the propagation time of seismic energy from an earthquake’s hypocenter to globally-distributed seismometers and the latencies in the collection, analysis, and validation of these global seismic data, published scientific alerts can take between two and twenty minutes to produce, depending on the size and location of the quake. In contrast, people in the vicinity of earthquakes are publishing information within seconds of their occurrence via social networking and micro-blogging technologies. This paper describes how the analysis of geospatial-temporal data from social networking sites is being adopted by the USGS in an attempt to augment its earthquake response products and the delivery of hazard information. While the anecdotal and qualitative
information from social networking sites is not a replacement for the high quality quantitative earthquake information from the USGS, mining and publishing this rapidly available information can provide 1) integration of first hand hazard accounts with scientific information, 2) a wide spread outreach tool and 3) potentially provide early detections of reported shaking events.
TED (Twitter Earthquake Detector) is a software application developed to mine real-time data from popular social networking and micro-blogging sites (e.g., Twitter, Jaiku), searching for indicators of earthquake (or other hazard) activity directly from the public. In addition, TED integrates traditional scientific earthquake information, location and magnitude, from the USGS internal global earthquake data stream with geospatial-temporal corresponding citizen reports from popular social networking and micro-blogging sites. One indication of the level of public interest can be inferred when the density of hazard-related chatter in time and a geographic locality corresponds to that of an actual hazard event. When an earthquake is picked up from the USGS internal global earthquake data stream, the system immediately integrates citizen reported firsthand accounts of experienced shaking with the corresponding scientific information. TED then uses these same social networking and micro-blogging technologies to rapidly disseminate the combined scientific and citizen information to a large number of people potentially already “listening”. Additionally, analysts working on earthquake response products currently have only scientifically derived location, corresponding population and magnitude information available in the minutes following an earthquake. The rapid integration of firsthand hazard accounts can potentially help guide the initial response actions taken to meet NEIC’s mission.
This same detected increase in earthquake related chatter used to infer public interest in an earthquake is being investigated for use as a real-time preliminary indicator of a potential earthquake. Early work has indicated that such detections are possible within seconds of an earthquake and could potentially be used to create preliminary alerts (e.g., emails, pages, and micro-blog updates) for USGS operations staff as an early hazard warning, thus filling the gap from when an earthquake occurs until the time scientific data become available to then confirm or refute the reported shaking event.
We describe the collection, filtering, archiving, and analysis of Twitter data and show how these data can be effectively correlated against the USGS internal earthquake stream as one indication of public interest in an earthquake. Integration of these data successfully augments current earthquake response products produced by the USGS. We also evaluate the usage of these Twitter data as a real-time hazard detection tool. Preliminary results suggest that these data, if handled carefully, can be useful as an early detection indicator.
2. Related Work
Twitter [2] is one of the more widely used micro-blogging platforms, with a global outreach spreading from developed, urban nations to developing countries [3]. It enables a form of blogging that allows users to send short status update messages

(maximum of a 140 characters) called tweets. Twitter provides access to thoughts, activities, and experiences of millions of users in real-time, with the option of sharing the user’s location. This rich source of data is motivating a growing body of scientific literature about micro-blogging. Most of the work has focused on social aspects such as studying user motivations [4,5] and user collaboration [6,7,8]. Some micro-blogging collaboration research has focused specifically on crisis management and collective problem solving in mass emergency events [9,10,11].
Our interest in the use of Twitter data is not for the crisis management that follows a hazard event, rather it is in the rapid assessment, reporting, and potentially the near real-time detection of a hazard event. De Longueville, et al. [12] performed a postmortem analysis of tweets related to a wild fire near the French city of Marseille. Their analysis showed that the Twitter traffic was generally well synchronized to the temporal and spatial dynamics of the Marseille fire event, but warns that tweets from media sources and aggregators (users that compile and republish existing sources) will complicate automatic event detection. Intelligent blog-based event detection has not been limited to hazard events. Online chatter has been used to predict the rank of book sales [13] and recommend topical news items [14]. Cheong & Lee [3] describe a general collective intelligence retrieval methodology that can be used to mine micro-blogs to identify trends for decision-making.
The USGS has an established history of Internet-based citizen reporting using the “Did You Feel It?” system (“DYFI?”) [15], which generates ground shaking intensity maps based on volunteered Internet questionnaires. The DYFI questionnaires allow a calibrated assignment of Modified Mercalli Intensity to each submission, producing quantitative map of intensity. The Modified Mercalli Intensity scale [16] is based on postal questionnaires where respondents summarize shaking effects, damage maps produced by emergency response agencies, and reports produced by the earthquake engineering community. The “DYFI?” system provides a calibrated quantitative assessment of an earthquake event; however, it depends on users visiting the USGS website and completing a questionnaire. Collecting a sufficient amount of data to generate an intensity map typically takes on the order of minutes. The data mined from Twitter are neither calibrated nor quantitative; however, an earthquake can be detected on the order of seconds and does not require direct interaction with the USGS website.
3. Methodology
3.1. Gathering Data
TED harvests real-time tweets by establishing a continuous HTTP connection to Twitter's Streaming API applying a query parameter to reduce the stream to only tweets that contain one or more of the specified keywords: namely earthquake, quake and tsunami in several languages. The stream of tweets returned from Twitter is in JSON format which is then parsed locally and inserted into a MySQL database. All of this runs 24x7 in multiple separated redundant processes, in order to compensate for network interruptions or other failures.

In addition to the keyword filtering, other data cleaning techniques are applied to the incoming tweets. Tweets from the multiple processes are merged, ordering the tweets, accounting for duplicates, and filling any data gaps. Data from aggregators, users who regularly redistribute second hand earthquake information, are removed from the data set. The number of aggregator users has thus far remained below one half of a percent of all users that have sent earthquake related tweets over the past five months. Additionally, tweets containing strings commonly used to indicate retweeting, rebroadcasting a tweet from another user, are removed. All of these removed tweets are archived in a separate table in the database currently preserved for historical analysis, as necessary.
For each keyword filtered tweet TED archives the tweet creation time, text, Twitter user location, Twitter tweet ID, Twitter user ID, and the time the tweet was inserted into the TED database. Additionally, after each tweet is inserted into the database, the latitude and longitude estimate of the sender’s location, if provided, is determined via the Google Maps API Geocoding Service [17] and stored with the tweet. Roughly 15% of the earthquake related tweets that we have archived have come from GPS enabled devices, generally providing very accurate locations at the time of each tweet. Another 35% percent of the tweets have generic user locations such as “123 A St. San Francisco, CA, USA”, or “San Francisco, CA, USA”, or “San Francisco”, or “The Bay Area”. The remaining 50% of the tweets do not provide a specific location and are not used by the TED system.
The TED system also ingests seismically derived earthquake information from the USGS near real-time internal global earthquake stream 24x7. From these earthquake messages TED archives the earthquake origin time, region name, hypocenter (latitude, longitude, and depth), the magnitude, and the authoritative source of the scientifically derived earthquake information. These scientific earthquake messages arrive anywhere from two minutes up to around twenty minutes after an earthquake’s origin time, depending on the size and location of the earthquake.
3.2. Integrating Seismically Derived and Citizen Reported Earthquake Information
TED integrates firsthand public accounts of shaking with the corresponding scientific information for an earthquake. For earthquakes in areas populated with active Twitter users, TED can then gauge a potential level of public interest in that earthquake by detecting a “significant” and rapid increase in the number of related tweets. When an earthquake location, from the USGS near real-time internal global earthquake stream, is inserted into the system, the tweet archive is searched for geo-spatially and temporally correlated tweets. Geo-spatial correlation is determined by computing distance from the hypocenter (latitude, longitude and depth) for which ground shaking may have been felt. We define an earthquake’s possible felt area as all points on the Earth’s surface whose hypo-central distance is less than an estimated maximum felt distance Rf, in km, which is a function of magnitude M defined as:
Rf = 10 0.3204*M+0.602 (0)
We derived Rf empirically from felt observations submitted to the “Did You Feel It?” system. This relation does not take into account such factors as spatial variation in ground-motion attenuation and rupture finiteness. However, for our current system this simple approximation has proved sufficient over the three months the system has been running.
Temporal correlation is accomplished by collecting the tweets, in the TED archive, from five minutes before the earthquake origin time up to the time when the data sets are being integrated, which may range anywhere from two to sixteen minutes after the origin time. The time frame before the event origin time measures the present noise level. The time frame after the event is limited to a maximum of sixteen minutes to help limit the input to context relative tweets with firsthand accounts of shaking rather than much of the conversational chatter, retweets, media reports and geographically wider spread reactions that occur in longer time frames following an earthquake.
3.3. Significance Detection
TED uses a geospatial-temporal correlated earthquake tweet data set to infer a level of public interest in an earthquake. Since there are dozens of located, unfelt earthquakes on the planet every day, a check for a significant increase in related tweets helps prevent flooding users with information that they may not find useful and cause users to ignore the information all together. We use a significance ratio function, S, to determine if an earthquake has generated a significant increase in tweet traffic to warrant public distribution. A trigger is declared if S exceeds one. The significance ratio function accounts for the possibility of zero pre-event noise and is defined:
S = A/(mB+Z) (1)
Where A is the tweets-per-minutes after the event, B is the tweets-per-minute before the event, Z is a constant that defines the required value for A when B is zero to cause a trigger, and m is a constant that controls how much A must increase with increasing noise levels to cause a trigger. For earthquakes with S greater than one, the TED system produces 1) an alert tweet with hypocenter, preliminary magnitude, and region, 2) an interactive map of the plotted epicenter and tweets, 3) a histogram of tweets per time unit around the earthquake origin time, 4) a downloadable KML file that plots tweets over time, 5) a list of the top ten cities with the highest number of tweets, and 6) a web page that includes all of the above and the actual text for all correlated tweets. The purpose of these integrated output products is to rapidly provide a summary of personal accounts from the impacted region to earthquake responders and the public. It is anticipated that TED products will be replaced as validated and calibrated information becomes available. TED will also rapidly provide information via Twitter (instead of only the web and email) and hopefully draw users to the USGS website for detailed information. These output products can augment current earthquake response information provided to USGS analysts and to the public.
3.4. Preliminary Hazard Detection

The analysis of the real-time spatio-temporal data being captured by the TED system may also allow for the rapid detection of an earthquake before quantitative scientific information is available. In fact, creating a time series of earthquake-related tweets and monitoring this time series for spatio-temporal spikes is analogous to how ground motion data from a seismometer are evaluated for earthquake activity. As a proof of concept, three months of filtered and archived tweets were discretized per time unit to create a time series of their temporal distribution. This time series was then scanned for spikes, which are temporally correlated indications of a citizen reported earthquake. The times of these spikes were then compared against the USGS scientifically confirmed catalog of earthquake events [18] as confirmation of an actual earthquake. The early results are promising however, more sophisticated heuristics need to be defined from historical data analysis to better characterize these spikes of chatter and further reduce false detections. This has been left for future work.
4. Difficulties and Issues
It is clear that significant limitations exist in a system based on citizen reporting. The issues that tend to plague the system are lack of quantitative information, out of context tweets, incorrect or lack of geo-locations, and the robustness of external data sources such as Twitter and geo-locating services. The main drawback, because the NEIC's mission is scientific information about earthquakes, is the lack of quantitative information such as epicenter and magnitude. Without quantitative verified data, alerts provoking response measures are not possible. The main advantage of Twitter is speed, especially in sparsely instrumented areas.
Not all tweets containing the word earthquake or quake, in any language, correspond to people feeling shaking caused by an earthquake. Analysis of data for the past few months indicates that the background level of noise (out of context tweets geographically and time clustered) is generally very low, except following major earthquakes. For example, after the magnitude 4.3 Morgan Hill, CA earthquake on March 30, 2009 the number of earthquake tweets sent from the surrounding region increased from roughly one tweet per hour before the event to 150 tweets per minute for a full five minutes after the event [1]. This is a signal to noise ratio of 9000. However, background noise levels are not constant. For example, in the hours and days following the magnitude 7 earthquake in Haiti in mid January 2010, people all over the planet were tweeting about earthquakes. Fortunately, this kind of chatter is generally not geographically centered and dies down a few days after the event. However, there are other types of chatter that could produce geographically and time centered “earthquake” tweets. For example, a geographically concentrated spike of tweets was observed during the Great California Shake Out [19] in October 2009. One can imagine a large enough group of twitter users enjoying a fun game of Quake while eating Dairy Queen's Oreo Brownie Earthquake dessert producing misleading data for an automated system.
Inaccurate tweet geo-locations are a serious issue when using geospatially related tweets for threshold detections and to map indications of the region exposed to the hazard, or shaking in the case of an earthquake. The location of a tweet is only as
accurate as the location string the user entered in their Twitter profile, as this is the location provided with tweets. A location is not required to set up a Twitter account and can be as vague or specific as the user wants. Some Twitter applications for GPS enabled devices update the location string on a per tweet basis, this is about 15% of the earthquake tweets we have seen in the past three months. However, most tweets that provide a location use the static location in the user’s profile. Given this, a tweet from a New Yorker on vacation in San Francisco will most likely mis-locate to New York. Since these tweets are likely not spatially correlated, requiring a minimum number of earthquake tweets in a region before declaring it a felt region will reduce their contaminating effect. We expect that tweet location accuracy will increase with time due to both the increased use of GPS enabled devices and Twitter’s introduction, in November 2009, of its Geolocation API that will allow users to have their tweets tagged with their current location.
Citizen reporting based hazard detection is only as good as the reporting. It is conceivable that a motivated group of citizens could attempt to spoof a hazard. To avoid “attacks” aimed at fooling the system, refined characterization of detection spikes would help to reduce malicious attacks, but unlikely eliminate them.
5. Results and Evaluation
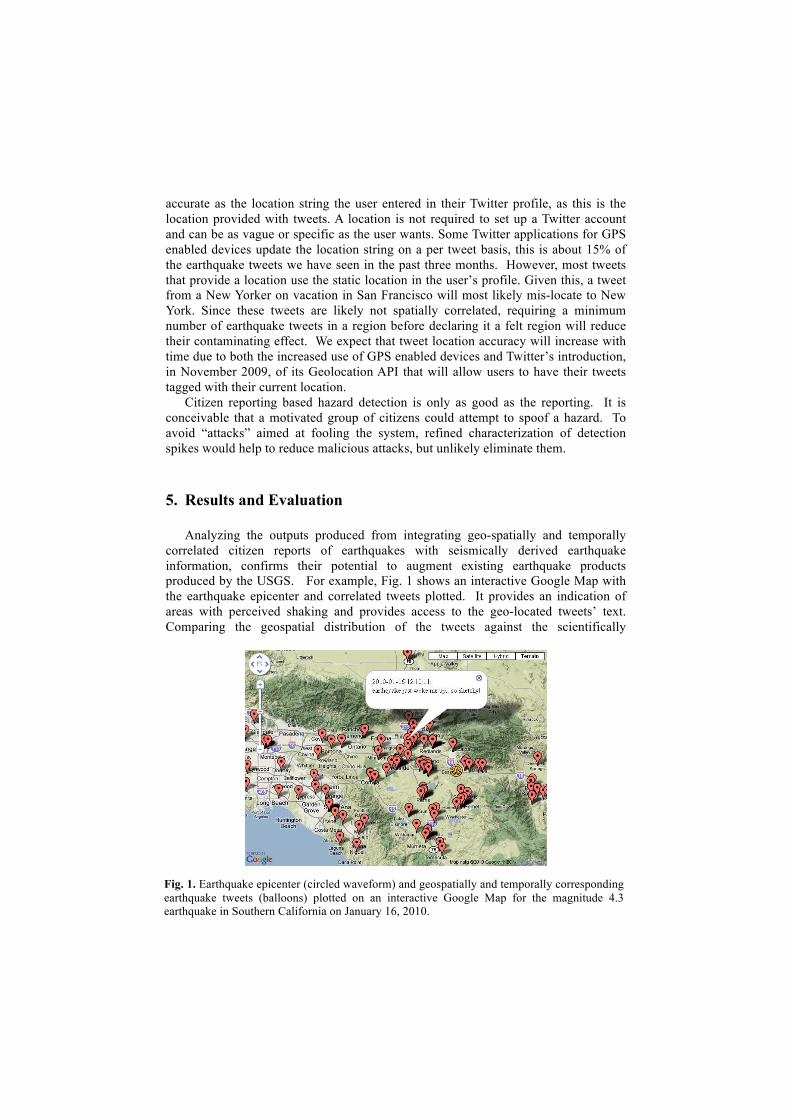
Analyzing the outputs produced from integrating geo-spatially and temporally correlated citizen reports of earthquakes with seismically derived earthquake information, confirms their potential to augment existing earthquake products produced by the USGS. For example, Fig. 1 shows an interactive Google Map with the earthquake epicenter and correlated tweets plotted. It provides an indication of areas with perceived shaking and provides access to the geo-located tweets’ text. Comparing the geospatial distribution of the tweets against the scientifically
Fig. 1. Earthquake epicenter (circled waveform) and geospatially and temporally corresponding earthquake tweets (balloons) plotted on an interactive Google Map for the magnitude 4.3 earthquake in Southern California on January 16, 2010.
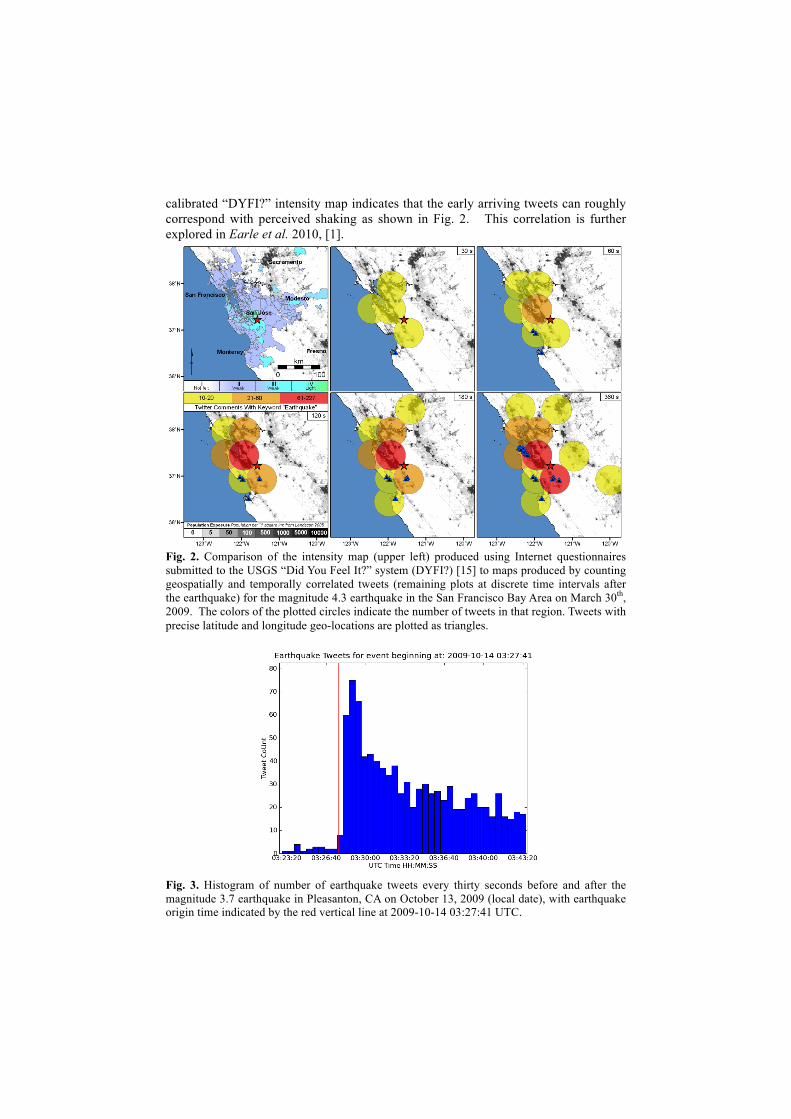
calibrated “DYFI?” intensity map indicates that the early arriving tweets can roughly correspond with perceived shaking as shown in Fig. 2. This correlation is further explored in Earle et al. 2010, [1].
Fig. 2. Comparison of the intensity map (upper left) produced using Internet questionnaires submitted to the USGS “Did You Feel It?” system (DYFI?) [15] to maps produced by counting geospatially and temporally correlated tweets (remaining plots at discrete time intervals after the earthquake) for the magnitude 4.3 earthquake in the San Francisco Bay Area on March 30th, 2009. The colors of the plotted circles indicate the number of tweets in that region. Tweets with precise latitude and longitude geo-locations are plotted as triangles.
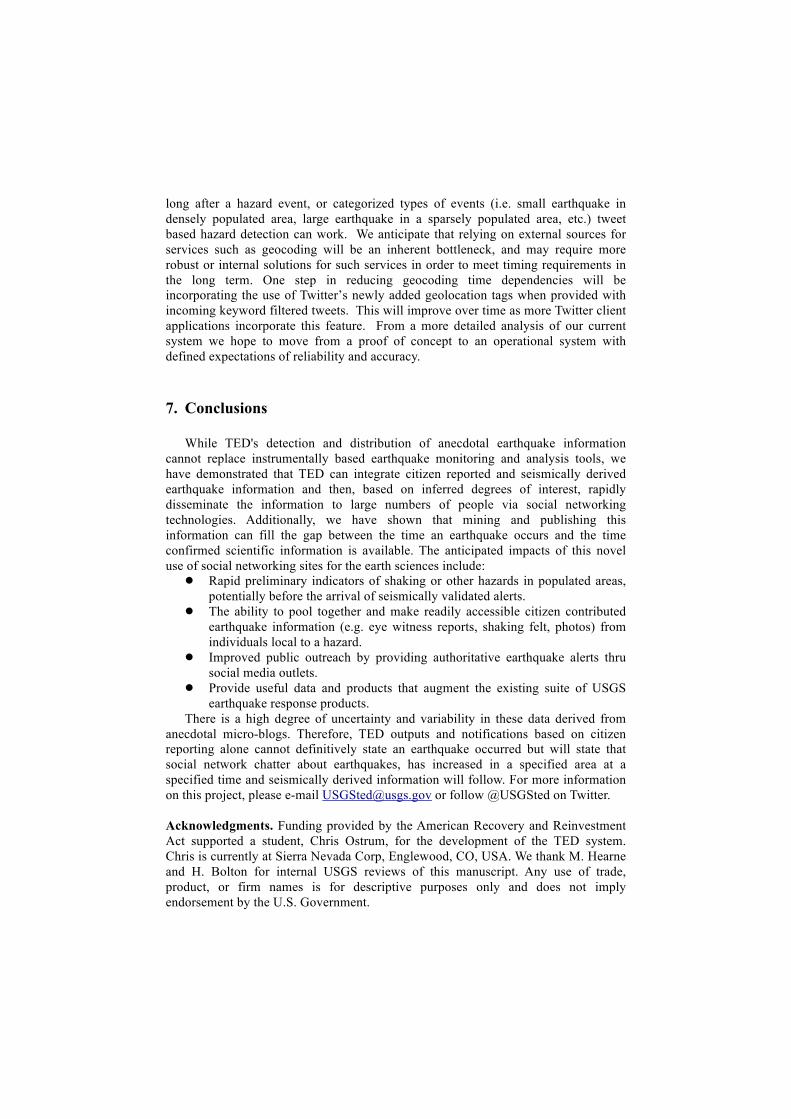
Fig. 3. Histogram of number of earthquake tweets every thirty seconds before and after the magnitude 3.7 earthquake in Pleasanton, CA on October 13, 2009 (local date), with earthquake origin time indicated by the red vertical line at 2009-10-14 03:27:41 UTC.

At a glance, the main advantage of mining citizen reports via Twitter is the speed of information availability, especially compared to areas that are sparsely instrumented with seismometers. Even using data from hundreds of globally distributed sensors we cannot detect many earthquakes below magnitude 4.5, due to a lack of available local instrumentation. In limited cases, these earthquakes can be identified. By manually scanning a real-time Twitter search for earthquake tweets, we detected two earthquakes in 2009 that were missed by our real-time seismometer-based earthquake association algorithm. The first was a magnitude 4.7 earthquake near Reykjavik, Iceland. The second was a magnitude 3.1 earthquake near Melbourne, Australia. These earthquakes likely would have been detected in days to weeks using late arriving data and locations from contributing foreign seismic networks, however, Twitter enabled quicker USGS distribution of earthquake magnitude and epicenter.
To further investigate the possibility of detecting earthquakes based on citizen reports, we compared earthquake related tweet activity against the USGS earthquake catalog. To do this comparison we created a time series of tweets-per-minute using a month and a half of archived keyword filtered tweet data as shown in Fig. 4. We then searched the time series for sudden increases in temporally related tweets and then correlated these peaks with earthquakes. All of the major spikes, with the exception of one on October 15th, coincide with earthquakes. The one on October 15th was an emergency preparedness drill conducted by the state of California [19]. It is interesting to note for this spike the onset was much more gradual than the onset for earthquakes. Fig. 3 shows an example of the rapid onset for an actual earthquake. Correct differentiation between rapid and gradual increases in tweet frequency may reduce false detections. It is important to note that earthquakes detected by tweets will only be those felt by human observers. There are dozens of located earthquakes on any given day that are not felt, because they are too deep, and or in sparsely populated areas. A tweet-based system will not detect such earthquakes. This comparison has demonstrated a match of tweet-based detection with actual felt earthquakes.
Fig. 4. Plotted time series of earthquake tweets per minute from September 20, 2009 through November 8, 2009 with major spikes identified with corresponding earthquake region and magnitude.
For a tweet based detection system to be viable, the number of false detections needs to be low. Background noise from out of context earthquake tweets can increase false detections. An evaluation of the background noise around geospatially and temporally related tweets was performed by comparing the number of tweets before and after a verified earthquake. For every event that TED picks up from the USGS near real-time internal global earthquake stream, it calculates the average number of geospatially and temporally correlated tweets-per-minute for ten minutes

prior and post the event origin time. Looking at this noise level for all earthquakes from December 1, 2009 through January 27, 2010 (2291 total) 99% of the earthquakes had 0.1 or less tweets-per-minute in the ten minutes prior to the event. The remaining 1% were typically in the range of 0.1 to 1.8 tweets-per-minute for the ten minutes prior to the earthquake. Figure 3 shows an example of an earthquake with high pre-event noise and still the onset of the earthquake related tweets is clear. The influence of background noise in a geospatially and temporally related tweet data set is small.
In order for tweet based earthquake detection to be useful, it must precede the availability of seismically derived information. From TED outputs we have seen many earthquakes that show an increase in earthquake related tweet frequency that precedes the availability of seismically derived data. For example, the USGS alert for a small, magnitude 3.7, earthquake in a densely instrumented region in central California was available 3.2 minutes after the earthquake’s origin time, while a detectable increase in correlated tweet frequency was seen in 20 seconds. In a second case, we examined a large, magnitude 7.6, earthquake in a moderately instrumented region of Indonesia. Initial seismically derived information was available 6.7 minutes after the earthquake’s origin time, while a rapid increase in "gempa" (Indonesian for earthquake) tweets was seen in 81 seconds. In both cases, numerous earthquake tweets were available in considerably less time than it took to distribute the initial seismically derived estimates of magnitude and location. This demonstrates that rapid tweet based detection can potentially fill the gap between when an earthquake occurs and when seismically derived information is available.
6. Future Work
Future work includes developing a more sophisticated hazard detection algorithm for the real-time input tweet stream. The current plan is to group keyword filtered tweets into five or ten second time intervals as the tweets are being archived from the Twitter stream in order to produce a continuous real-time tweet time series. A short time interval was chosen to both reduce latency and to help make the time series continuous around clustered earthquake chatter. From this real-time time series both a long term average (LTA) and short term average (STA) will be calculated and used to produce a second time series of STA/LTA ratio, which should further improve the signal to noise ratio (just as it does for automatic seismic phase arrival detection from ground motion time series data from seismometers). This noise reduced time series is what will be monitored for significant increases in the temporal density of hazard related chatter, with the goal of reducing false detections. Current evaluation has shown significant increases in the temporal density of hazard related chatter with a rapid, almost instantaneous, onset within seconds of an earthquake’s occurrence. Heuristics need to be further refined from continued historical data analysis to better characterize these spikes of chatter and further reduce false detections. This kind of real-time time series analysis is quite similar to how real-time waveform time series data from seismometers are monitored for seismic activity.
Additionally, further timing analysis is necessary to get a better handle on how
long after a hazard event, or categorized types of events (i.e. small earthquake in densely populated area, large earthquake in a sparsely populated area, etc.) tweet based hazard detection can work. We anticipate that relying on external sources for services such as geocoding will be an inherent bottleneck, and may require more robust or internal solutions for such services in order to meet timing requirements in the long term. One step in reducing geocoding time dependencies will be incorporating the use of Twitter’s newly added geolocation tags when provided with incoming keyword filtered tweets. This will improve over time as more Twitter client applications incorporate this feature. From a more detailed analysis of our current system we hope to move from a proof of concept to an operational system with defined expectations of reliability and accuracy.
7. Conclusions
While TED's detection and distribution of anecdotal earthquake information cannot replace instrumentally based earthquake monitoring and analysis tools, we have demonstrated that TED can integrate citizen reported and seismically derived earthquake information and then, based on inferred degrees of interest, rapidly disseminate the information to large numbers of people via social networking technologies. Additionally, we have shown that mining and publishing this information can fill the gap between the time an earthquake occurs and the time confirmed scientific information is available. The anticipated impacts of this novel use of social networking sites for the earth sciences include:
Rapid preliminary indicators of shaking or other hazards in populated areas, potentially before the arrival of seismically validated alerts.
The ability to pool together and make readily accessible citizen contributed earthquake information (e.g. eye witness reports, shaking felt, photos) from individuals local to a hazard.
Improved public outreach by providing authoritative earthquake alerts thru social media outlets.
Provide useful data and products that augment the existing suite of USGS earthquake response products.
There is a high degree of uncertainty and variability in these data derived from anecdotal micro-blogs. Therefore, TED outputs and notifications based on citizen reporting alone cannot definitively state an earthquake occurred but will state that social network chatter about earthquakes, has increased in a specified area at a specified time and seismically derived information will follow. For more information on this project, please e-mail [email protected] or follow @USGSted on Twitter. Acknowledgments. Funding provided by the American Recovery and Reinvestment Act supported a student, Chris Ostrum, for the development of the TED system. Chris is currently at Sierra Nevada Corp, Englewood, CO, USA. We thank M. Hearne and H. Bolton for internal USGS reviews of this manuscript. Any use of trade, product, or firm names is for descriptive purposes only and does not imply endorsement by the U.S. Government.

References
1. Earle, P., Guy, M., Buckmaster, R., Ostrum, C., Horvath, S., and Vaughan, A. “OMG Earthquake! Can Twitter Improve earthquake response?” Seismological Research Letters To appear (2010) 2. O'Reilly, Tim, and Sarah Milstein. The Twitter Book. O'Reilly Media, Inc., (2009) 3. Cheong, M., and Lee, V. “Integrating web-based intelligence retrieval and decision-making from the twitter trends knowledge base.” In SWSM '09: Proceeding of the 2nd ACM workshop on Social web search and mining, 1–8. (2009) 4. Zhao, D., and Rosson, M.B. “How and why people Twitter: the role that micro-blogging plays in informal communication at work.” In Proceedings of the ACM 2009 international conference on Supporting group work, 243-252. (2009) 5. Java, A., Song, X., Finin, T., and Tseng, B. “Why We Twitter: An Analysis of a Micro-blogging Community.” In Advances in Web Mining and Web Usage Analysis, 118–138, (2009) 6. Honeycutt, C., and Herring S. “Beyond Microblogging: Conversation and Collaboration via Twitter.” In HICSS '09: Proceedings of the 42nd Hawaii International Conference on System Sciences, 1–10. (2009) 7. Dixon, J., and Tucker, C.R. “We use technology, but do we use technology?: using existing technologies to communicate, collaborate, and provide support.” In SIGUCCS '09: Proceedings of the ACM SIGUCCS fall conference on User services conference, 309–312. (2009) 8. McNely, B. “Backchannel persistence and collaborative meaning-making.” In SIGDOC '09: Proceedings of the 27th ACM international conference on Design of communication, 297–304. (2009) 9. Starbird, K., Palen, L., Hughes, A., and Vieweg, S. “Chatter on The Red: What Hazards Threat Reveals about the Social Life of Microblogged Information.” In CSCW 2010: Proceedings of the ACM 2010 Conference on Computer Supported Cooperative Work. (2010) 10. Hughes, A., and Palen, L. “Twitter Adoption and Use in Mass Convergence and Emergency Events.” In ISCRAM 2009: Proceedings of the 2009 Information Systems for Crisis Response and Management Conference. (2009) 11. Vieweg, S., Palen, L., Sophia, L., and Hughes, A. “Collective Intelligence in Disaster: An Examination of the Phenomenon in the Aftermath of the 2007 Virginia Tech Shootings.” In ISCRAM ‘08: Proceedings of the Information Systems for Crisis Response and Management Conference. (2009) 12. De Longueville, B., Smith, R.S., and Luraschi, G. “"OMG, from here, I can see the flames!": a use case of mining location based social networks to acquire spatio-temporal data on forest fires.” In LBSN '09: Proceedings of the 2009 International Workshop on Location Based Social Networks, 73–80. (2009) 13. Gruhl, D., Guha, R., Kumar, R., Novak, J., and Tomkins, A. “The predictive power of online chatter.” In KDD '05: Proceedings of the eleventh ACM SIGKDD international conference on Knowledge discovery in data mining, 78–87. (2005) 14. Phelan, O., McCarthy, K. and Smyth, B. “Using twitter to recommend real-time topical news.” In RecSys '09: Proceedings of the third ACM conference on Recommender systems, 385–388. (2009) 15. Wald, D. J., Quitoriano, V., Dengler, L., and Dewey, J. W. “Utilization of the Internet for Rapid Community Intensity Maps.” Seismological Research Letters 70, 680–697. (1999) 16. Wood, and Neumann. “Modified Mercalli Intensity Scale of 1931.” Bulletin of the Seismological Society of America 21: 227-283. (1931) 17. http://code.google.com/apis/maps/documentation/geocoding/index.html 18. “Earthquakes.” http://earthquake.usgs.gov/earthquakes/ 19. “The Great California Shake Out.” http://www.shakeout.org