integrating strategy & finance through...
TRANSCRIPT

SCHOOL OF ECONOMICS & BUSINESS ADMINISTRATION
INTEGRATING STRATEGY & FINANCE
THROUGH STRATEGIC ALLIANCES:
ORGANIZATIONAL LEARNING &
VALUATION PERSPECTIVES
DOCTORAL DISSERTATION
IAN P. L. KWAN
PAMPLONA 2013

2
SCHOOL OF ECONOMICS & BUSINESS ADMINISTRATION
INTEGRATING STRATEGY & FINANCE
THROUGH STRATEGIC ALLIANCES:
ORGANIZATIONAL LEARNING &
VALUATION PERSPECTIVES
DOCTORAL DISSERTATION
IAN P. L. KWAN [email protected]
PABLO FERNÁNDEZ LÓPEZ CARMEN ARANDA LEÓN
DIRECTOR CO-DIRECTOR
PAMPLONA 5 JULY 2013

3
Contents
Acknowledgements .......................................................................................................... 7
Introduction ......................................................................................................................... 8
Paper One: A Literature Review of Strategic Alliances in the
Organizational & Financial Valuation Literatures ............................... 14
ABSTRACT ................................................................................................................................ 14
1. INTRODUCTION ............................................................................................................... 15
2. PRELIMINARY QUESTIONS ON STRATEGIC ALLIANCES ...................................... 15
2.1 What is a strategic alliance? ........................................................................................ 16
2.2 Where? How many? How significant? ........................................................................ 17
2.3 Why do firms form alliances? ..................................................................................... 18
2.4 Do alliances create value? How is it shared? .............................................................. 19
2.5 Do alliances fail? How often? Why are they unstable? ............................................... 20
2.6 Which one? Alliance or Acquisition? ......................................................................... 22
3. A REVIEW OF LITERATURE IN STRATEGY & VALUATION .................................. 23
3.1 Theories from the Strategy Literature ......................................................................... 23
3.1.1 Market Based View ............................................................................................. 23
3.1.2 Resource Based View .......................................................................................... 27
3.1.3 Knowledge Based View: Organizational Learning and Capabilities .................. 30
3.1.4 Transaction Cost Approach ................................................................................. 33
3.2 Theories from the Financial Valuation Literature ....................................................... 36
3.2.1 Discounted cash flow method ............................................................................. 38
3.2.2 Real options method ............................................................................................ 41
3.2.3 Event study method ............................................................................................. 44
4. A REVIEW STUDIES OF STRATEGIC ALLIANCE VALUE CREATION .................. 46
5. RESEARCH GAPS AND AGENDA ................................................................................. 48
5.1 Gap 1a: Alliance experience effects on acquisition performance (Paper Two) .......... 48
5.2 Gap 1b: Strategic alliances, absorptive capacity, and acquisition performance .......... 49
5.3 Gap 2a: Do strategic alliances create value for bond investors? (Paper Three) .......... 50
5.4 Gap 2b: Strategic alliances, real options, and firm capital structure ........................... 51
6. CONCLUSION ................................................................................................................... 53
7. REFERENCES .................................................................................................................... 54

4
Paper Two: Understanding Cross-form Transfer Effects:
Alliance Experience and Acquisition Performance ................................ 62
ABSTRACT ................................................................................................................................ 62
1. INTRODUCTION ............................................................................................................... 63
2. THEORY AND HYPOTHESES ........................................................................................ 66
2.1 Process similarities mechanism ....................................................................................... 69
2.2 Experience interactions mechanism ................................................................................ 72
2.3 Integrating into one mechanism ...................................................................................... 76
3. DATA AND METHODS .................................................................................................... 78
3.1 Data and Sample ............................................................................................................. 78
3.2 Measures ......................................................................................................................... 79
4. RESULTS ........................................................................................................................... 84
4.1 Descriptive Statistics ....................................................................................................... 84
4.2 Analysis ........................................................................................................................... 86
5. CONCLUSIONS AND FURTHER RESEARCH .............................................................. 90
6. REFERENCES .................................................................................................................... 92
7. RESULT TABLES .............................................................................................................. 96
Table 1a: Descriptive Statistics ............................................................................................... 96
Table 1b: Correlation Table .................................................................................................... 97
Table 2a: Inter-firm Perspective of Cross-form Effect ........................................................... 98
Table 2b: Intra-firm Perspective of Cross-form Effect ........................................................... 99
Paper Three: Do Strategic Alliances Create Value for Bond
Investors? ........................................................................................................................... 100
ABSTRACT .............................................................................................................................. 100
1. INTRODUCTION ............................................................................................................. 101
2. THEORY AND HYPOTHESES ...................................................................................... 105
2.1 Stocks and merger-alliance analogy .......................................................................... 106
2.2 Bonds and merger-alliance analogy .......................................................................... 107
2.3 Organizational learning and bond holder wealth ...................................................... 111
3. DATA AND METHODS .................................................................................................. 113
3.1 Data ........................................................................................................................... 113
3.2 Empirical methods .......................................................................................................... 118
4. RESULTS ......................................................................................................................... 123
4.1 Descriptive results ..................................................................................................... 123
4.2 Event study results .................................................................................................... 124

5
4.3 Regression Results .................................................................................................... 128
5. DISCUSSION & FURTHER RESEARCH ...................................................................... 129
6. CONCLUSION ................................................................................................................. 131
7. REFERENCES .................................................................................................................. 133
8. RESULT TABLES ............................................................................................................ 137
Table 3: Parallel Event Study: Daily Abnormal Returns of Partner A Stocks and Bonds vs.
Partner B Stocks .................................................................................................................... 137
Table 4: Parallel Event Study: Pooled Abnormal Returns of Partner A Stocks and Bonds vs.
Partner B Stocks .................................................................................................................... 138
Table 5: Parallel Event Study: Cumulative Abnormal Returns of Partner A Stocks and Bonds
vs. Partner B Stocks .............................................................................................................. 139
Table 6: Wealth Effects on Day 0 of Strategic Alliance announcement ............................... 139
Table 7a: Regressing Partner A Bond AR against Leverage ................................................ 140
Table 7b: Regressing Partner A Bond AR against Alliance Experience ............................... 140
Conclusion ........................................................................................................................ 141
1. CONTRIBUTIONS AND LIMITATIONS ...................................................................... 142
2. REFLECTIONS ................................................................................................................ 144
3. FUTURE DIRECTION ..................................................................................................... 145

6
Dedicated to
My Mother & Father

7
Acknowledgements
It gives me great pleasure to acknowledge the following people who have helped,
supported, and encouraged me to make this doctoral dissertation a reality in ways that
they know and probably don’t know!
Carmen Aranda León
Pablo Fernández López
Luis Ravina Bohórquez
José Antonio Alfaro Tanco
África Ariño Martín
Alberto Serna García
I want to also express my deep gratitude to the countless other people whose names do
not appear above but have helped me with their encouragement, patience, and prayers.
I would also like to especially acknowledge the Asociación de Amigos and the School
of Economics and Business Administration of the University of Navarra for the moral
and financial support they provided me throughout the development of the dissertation.
With gratitude I would also like to thank the many organizations which stretch from
Europe, Asia, and Australia which supported me in many different ways to help get me
to the finishing line, including but by no means limited to: IESE Business School,
School of Banking and Finance of the University of New South Wales, European
Institute for Advanced Studies in Management, Centro de Estudios Monetarios y
Financieros de Madrid, EuroMed Research Business Institute, and of course los
residentes de Colegio Mayor Belagua Fase 1.
DEO GRATIAS!

8
Introduction
Integrating Strategy & Finance
through Strategic Alliances:
Organizational Learning &
Valuation Perspectives

9
INTRODUCTION
The desire to integrate the vast fields of finance and strategy is not new.
Scholars of both have long felt the need to unify them, each having much to say on their
mutual subject in common – firms and the resources that they employ. Strategy for its
part is fundamentally concerned about the choices that firms make to seize competitive
advantage especially in regards to the directions they take and the resources they engage
(Schendel and Patton, 1978). On the part of finance, its main concern is how capital
markets value the choices firms make as going concerns (Myers, 1984). Although
scholars from both fields have dialogued over the past 30 years over this mutual
common ground, gaps still exist that provide opportunities for a continuing integration
effort, but not without difficulties. The obstacles vary widely and include amongst other
things very different languages and cultures in the respective research traditions (Myer,
1984), very different views on the notion of risk (Lubatkin and Schulze, 2003)1, and
even very different timeframes (Baden-Fuller, 2003)2. The bumpy history of the
integration effort reflects to some extent these difficulties.
Myers’ (1977) seminal idea on real options3 that presented a way of valuing
corporate liabilities provided an initial bridge between the two fields. In spite of Myers’
later lament (1984: 126) that finance theory had until then little impact on strategic
planning, a flurry of research followed that would soon develop the “real options
approach” in ways that would have a major impact on the strategy literature (see for
example, Bowman and Hurry, 1993; Kogut, 1991; Kogut and Kulatilaka, 1994; Chi,
1 Finance scholars view firm-specific risk as irrelevant because it can be diversified away in a portfolio of
assets leaving only the systematic part of risk. For strategy scholars, however, firm-specific risk falls at
the very heart of strategic management (Lubatkin and Schulze, 2003). 2 Whereas finance scholars work in a timeframe where time is measured in seconds, where prices are set
openly, and where economic modeling dominates, strategists focus on firms and managers whose
decisions take time and where the value of these decisions will not be manifested for years (Badden-
Fuller, 2003). 3 Analogous to financial options, a real option confers a right on a firm to make further (large)
investments in a project at a future date as time reveals more information by virtue of initial (small)
investments made earlier in the project’s life (Myer, 1977; Trigeorgis, 1996)

10
2000; Reuer and Tong, 2007). Yet the enthusiasm to unify strategy and finance through
a real options approach waned. Several surveys would show that only between 6% and
27% of firms would use real options thinking in their capital budgeting processes
(Graham and Harvey, 2000; Rigby and Gillies, 2000; Ryan and Ryan, 2002). Even
Bowman, who provided some of the early momentum for the real options approach in
the strategy field, expressed his reserve pointing to the inherent difficulties of the
approach in strategic analysis (Bowman and Moskowitz, 2001). But despite these
difficulties, scholars still continue their efforts to bring together finance and strategy
evidenced by the various special issues aimed at this task (see Lubatkin and Schulze,
2003; Silverman and Villalonga, 2013).
Against this background, for me there have been at least two challenges to write
a dissertation that bridges both these two fields. The first is developing a research
agenda that is relevant to both without being irrelevant to either one. My experience, for
example, writing Paper Two of this dissertation especially brought this challenge home
to me. From the start, this paper was written with the idea of publication in a strategy
journal. One helpful informal reviewer4, however, pointed out that the “empirical
flavor” with which it was written at the time meant that that version of the paper was
probably better suited for an economics or finance journal. This was indeed a helpful
early warning of the need to be relevant to the readership. The challenge to be relevant
does not seem to be unique to me. Lubatkin and Schulze summarize the notion
succinctly with the following words:
“Unfortunately, fundamental differences in the theoretical assumptions
on which modern financial theory […] and strategy were based, caused
their paths to diverge to a point where endorsement of one necessarily
implied the irrelevance of the other.” (Lubatkin and Schulze, 2003: 7)
4 I am especially thankful to Prof. Africa Ariño of IESE Business School for pointing this out to me
during the early drafts of the paper.
11
The second challenge, as with all doctoral dissertations, is researching topics
that are novel to their field, executable with the resources available, and ample enough
to provide a knowledge base on which to continue further research in the post-doctoral
phase. Furthermore, given my prior professional experience in business and finance,
developing a research agenda in both strategy and finance is of natural interest to me.
Facing both these challenges I chose, thanks to the advice of my two thesis
directors, to take a conservative approach that would integrate both strategy and finance,
and at the same time keeping them separate. I have aimed to integrate them by
harmonizing within each of the three papers the relevant theories of both fields; and I
have tried to keep them separate by giving each paper a distinct strategy or finance
“flavor” according to the theoretical framework employed, the writing style
corresponding to the field that the paper is aimed for, and the topic that is typically
found in that field.
To give further focus my dissertation topic, I chose the promising topic of
strategic alliances that has captured the attention of both strategy and finance scholars
and practioners. One revealing quote by two renowned finance scholars caught my
attention and helped me to decide on this topic:
“… a relative paucity of attention has been paid to [the increasing
importance of alliances in both number and complexity] in the
economics and finance literature. While strategic alliances have been a
focus of organizational and sociology literature, many economic
aspects of the arrangements remain unexplored [in the finance
literature]. Many of the newer organizational innovations have attracted
almost no scrutiny by researchers.” (Lerner and Rajan, 2006: 1)
Responding to this call, the three papers of this dissertation, while being separate
works of research, at the same time aim to integrate both strategy and finance in a way
that respects the research traditions of each field.

12
Paper One provides a literature review of extant research on strategic alliances
taking organization learning and financial valuation perspectives. After reviewing
relevant theories and methods as they apply to strategic alliances, I identify two pairs of
research gaps, one in strategy and the other in finance which become the focuses for
Papers Two and Three of this dissertation. One notable feature of the survey (and which
confirms Lerner and Rajan’s observation above) is the strong research tradition on
alliances in the strategy literature which is not found in finance. The paper is therefore
probably best suited for readers who come from a finance tradition and want to quickly
familiarize themselves with the strategy alliance literature.
Paper Two is a strategy oriented paper on a growing stream in the organizational
learning literature. It aims to unify two large related areas in this field, namely how
organizational learning is transferred under two different governance forms, namely the
mergers and acquisitions (M&A) and strategic alliances. I study how prior alliance
experience is transferred to affect M&A hence the study is about the cross-form effects
from alliance experience to acquisition performance. I contribute to the literature by
providing empirical evidence to support the theoretical explanations of how prior
alliance experience positively affects acquisition performance.
Finally, Paper Three is a finance oriented paper in which I analogously apply the
theories of coinsurance of corporate bonds of firms involved in M&As to the bonds of
firms involved in alliances. I show that like the bond holders of firms involved in
M&As, allying firm’s bond holders are positively affected by alliance formation. The
results of this paper complement those that show that alliance announcements are value
creating for stock holders, filling a gap in both the finance and strategy literatures.
IK
13
2. REFERENCES
Baden-Fuller, C. 2003. Editorial to: 36-1. Long Range Planning, 36(1): 1.
Bowman, E. H., & Hurry, D. 1993. Strategy through the option lens: An integrated view of resource
investments and the incremental-choice process. Academy of Management Review: 760-782.
Bowman, E. H., & Moskowitz, G. T. 2001. Real options analysis and strategic decision making.
Organization Science, 12(6): 772-777.
Chi, T. 2000. Option to acquire or divest a joint venture. Strategic Management Journal, 21(6): 665-687.
Graham, J. R., & Harvey, C. R. 2001. The theory and practice of corporate finance: Evidence from the
field. Journal of Financial Economics, 60(2–3): 187-243.
Kogut, B. 1991. Joint ventures and the option to expand and acquire. Management Science, 37(1): 19-33.
Kogut, B., & Kulatilaka, N. 1994. Operating flexibility, global manufacturing, and the option value of a
multinational network. Management Science, 40(1): 123-139.
Lerner, J., & Rajan, R. 2006. NBER conference on corporate alliances. Journal of Financial Economics,
80(1): 1-3.
Lubatkin, M., Schulze, W. 2003. Introduction. Risk, Strategy, and Finance: Unifying Two World Views:
By guest editors, Michael Lubatkin and Bill Schulze. Long range planning, 36(1): 7-8.
Myers, S. C. 1977. Determinants of corporate borrowing. Journal of Financial Economics, 5(2): 147-
175.
Myers, S. C. 1984. Finance theory and financial strategy. Interfaces, 14(1): 126-137.
Reuer, J. J., & Tong, T. W. (Eds.). 2007. Advances in Strategic Management: Real Options Theory, Vol
24, Emerald Group Publishing Limited.
Rigby, D., & Gillies, C. 2000. Making the most of management tools and techniques: A survey from bain
& company. Strategic Change, 9(5): 269-274.
Ryan, P. A., & Ryan, G. P. 2002. Capital budgeting practices of the fortune 1000: How have things
changed. Journal of Business and Management, 8(4): 355-364.
Schendel, D., & Patton, G. R. 1978. A simultaneous equation model of corporate strategy. Management
Science, 24(15): 1611-1621.
Silverman, B., & Villalonga, B. 2013. Call for Papers for Advances in Strategic Management: Finance
and Strategy, Edited by Belén Villalonga, upcoming 2014, Vol. 31, Emerald Group Publishing
Limited.
Trigeorgis, L. 1996. Real options: Managerial flexibility and strategy in resource allocation.
Cambridge, Mass. etc.: MIT Press.

Paper One:
A Literature Review of
Strategic Alliances in the
Organizational & Financial
Valuation Literatures
ABSTRACT
In this paper, I review relevant theories and methods found in the strategy literature on
organizational learning and finance literature on valuation as they concern strategic
alliances. On the basis on this review, I identify several research gaps, one of which is
the focus of Paper Two and another of Paper Three of this doctoral dissertation. The
remaining research gaps are extensions for further research work. The paper aims to
contribute to the literature that bridges the gap between the fields of finance and strategy
by identifying theories and methods of common interest through their application to
strategic alliances.

Literature Review Paper One
15
1. INTRODUCTION
The purpose of this review is to identify relevant theories and methods from the
strategy literature on organizational learning and the finance literature on valuation
concerning strategic alliances. These will form a basis for proposing several research
gaps that I intend to investigate in Papers Two and Three of this doctoral dissertation
and research work that will follow thereafter.
The review proceeds as follows: in Section 2, I review the answers to some
preliminary questions about strategic alliances that provide a basic introduction to the
subject of interest of this dissertation. Section 3 reviews earlier strategy literature on the
market-based view, resource-based view, knowledge-based view, and transaction cost
approaches and analyzes strategic alliances in the light of each one. It also reviews
relevant financial methods of valuation including the discounted cash flow method, real
options method, and event study method, again applying them to the case of alliances.
Section 4 provides a summary of selected studies on value creation by strategic
alliances. Section 5 introduces research gaps seen in the literature, and finally Section 6
concludes.
2. PRELIMINARY QUESTIONS ON STRATEGIC ALLIANCES
Literature on strategic alliances frequently begins by describing a significant
aspect of alliance activity to draw the reader’s attention. The preliminary issues that are
commonly raised in the early sections of the literature provide context for the reader to
introduce the main issue to be covered. I would like to do the same here by providing a
summary to some preliminary questions on strategic alliances whose answers are often
found in the introductory sections of this alliance literature.
Literature Review Paper One
16
2.1 What is a strategic alliance?
A strategic alliance is a cooperative agreement made between two or more
independent firms to achieve a mutual set of objectives (Kogut, 1988; Gulati, 1998;
Ireland, Hitt, and Vaidyanath, 2002). Through an alliance, firms necessarily commit to
share a subset of their tangible and intangible resources (Barney, 1991; Grant, 1991).
Tangible resources include physical assets such as plant and equipment, or services such
as a proprietary distribution network or computer system, while intangible resources
include access to intellectual capital tied up in licensed patents and production
processes.
An alliance is a hybrid organizational form through which two or more firms can
combine their business resources. The alliance organizational form lies in the
continuum between a market exchange contract and a merger of firms (Kogut, 1988;
Lerner and Rajan, 2006; Villalonga and McGahan, 2005). Firms can access the
resources of another through market exchange contracts quickly and without the buyer
and seller knowing each other. Market exchange contracts are characterized by their
standard terms, standard product or service quality, industry accepted delivery times,
common pricing methods, etc. Firms can also access the resources of another by
merging with that firm. Mergers are characterized by their complexity, extended
personal negotiations, and information asymmetries (Zollo and Reuer, 2010).
In this dissertation, I will use the term “strategic alliances” as a collective term
to mean licensing agreements, franchise agreements, contractual (non-equity) joint
ventures, and equity joint ventures (Inkpen, 1998a; Parkhe, 1991).

Literature Review Paper One
17
2.2 Where? How many? How significant?
Alliances are found in almost all industries, in both domestic and international
business environments. However, they are most prevalent in high technology, fast-
changing, highly competitive, research-intense industries, including computers,
telecommunications, pharmaceuticals, chemicals, electronics, biotechnology and
services (Kale, Dyer, and Singh, 2002; Rothaermel and Deeds, 2004). Alliances are less
common, however in stable, mature industries (Koza and Lewin, 1998).
The empirical findings of Eisenhardt and Schoonhoven’s (1996) provide a good
answer to the question of where to find alliances from both a strategic as well as social
point of view. (a) More alliances are formed in industries that have more competitors. In
competitive markets with many players, greater market power can be achieved through
an alliance. Alliances with well-known firms also provide legitimacy to less well-
known firms especially in a crowded market. (b) There is a greater rate of alliance
formation in industries that require greater innovation. As innovative products are costly
to create, firms tend to choose alliances to gain access to and share their innovative
know-how to reduce costs. (c) Alliances form more often when there are a large number
of top management team members. Top management members provide the necessary
connections to potential alliance partners. (d) The more previous employees the top
management team members have had, the greater will be the rate of alliance formation.
(e) The more senior were the previous positions of top management members the more
frequent is the rate of alliance formation. (f) Although the empirical support is not
strong, the frequency of alliance formation tends to be highest in emergent-stage
markets, lower in growth-stage markets, and lowest in mature-stage markets.
International joint ventures are the usual mode of entry for domestic firms to
enter into global markets (Berg, Duncan, and Friedman, 1982; Harrigan, 1985),

Literature Review Paper One
18
especially those of emerging economies (Peng, 2003; Fang, 2011) because their
structural attributes help firms to reduce risk (Reuer and Leiblein, 2000).
The number of alliances has grown significantly in the past 30 years. There was
a huge wave of 57,000 alliances for US firms between 1996 and 2001 (Dyer, Kale, and
Singh, 2004). World-wide, 20,000 alliances were formed between 1998 and 2000
(Anand and Khanna, 2000). According the Securities Data Corporation (SDC) Joint
Ventures and Alliances database in 2005 there were over 52,000 completed or pending
alliances reported. According to a 2009 study by KPMG International, the number of
joint venture strategic alliances continued to grow in spite of the global financial crisis1.
The volume of assets and revenue linked with alliances in mainstream business
is also very significant. Before the year 2000, many of world’s largest firms had over
20% of their assets and over 30% of their R&D budget tied up with alliances (Ernst,
2004; Kale and Singh, 2009). In the 2007-08 financial year, more than 80% of Fortune
1000 CEOs believed that alliances would account for 26% of their companies’ revenues
(Kale, Singh, and Bell, 2009; Kale and Singh, 2009). In sum, as a way of doing
business, alliances are here to stay for sometime into the future.
2.3 Why do firms form alliances?
Some commonly cited motives why firms form alliances include: strengthening
their competitive position through combined market power (Kogut, 1991); increasing
scale efficiencies through reduced transaction costs (Hennart, 1988; Ahuja, 2000);
gaining access to new and critical resources and capabilities (Hitt et al, 2000;
Rothaermel and Boeker, 2008); accessing new technologies and innovative know-how
of partners (Hamel, 1991; Vanhaverbeke, Duysters, and Noorderhaven, 2002);
1 This may be due to the sample of executives surveyed. In my own research conducted using SDC
Platinum data, there was a significant drop in the number of alliances from 2008 onward.
Literature Review Paper One
19
responding to strategic resource inter-dependence between partners (Gulati, 1998);
lowering the risk of entering new markets for the first time (Inkpen and Beamish, 1997;
Garcia-Canal, Duarte, Criado, and Llaneza, 2002); trust and repeated ties (Gulati, 1995);
complementarity of resource bases (Lin, Yang, and Arya, 2009); etc.
Other reasons why firms may form alliances include: following the momentum
created from successfully forming previous alliances (Dyer, Kale, and Singh, 2004);
taking advantage of the resources available through the rich industry network
(Mitsuhashi and Greve, 2009; Ahuja, Polidoro, and Mitchell, 2009); perceptions of
fairness of between firms negotiating an alliance (Ariño and Ring, 2010); and the
relative status of firms within the industry or alliance network (Lin, Yang, and Arya,
2009).
Rothaermel and Boeker (2008) provide a good summary of different motives for
alliance formation in the introductory section of their paper with the requisite citations
to the literature.
2.4 Do alliances create value? How is it shared?
On average, the formation of alliances creates value for the partners’ stock
holders, albeit in the short-term (McConnell and Nantell, 1985; Chan, Kensinger,
Keown, and Martin, 1997; Anand and Khanna, 2000). There is a positive correlation
between the short-term performance measured by stock market reaction to alliance
announcements and the long-term performance measured by alliance managers’
assessments of success (Kale, Dyer, and Singh, 2002).
Alliance value creation depends on the experience firms gain from forming
alliances and the type of alliance contract written (Anand and Khanna, 2000). For
example, experience in joint ventures creates more value than more experience in

Literature Review Paper One
20
licensing agreements. Furthermore, Anand and Khanna found that more experience in
joint ventures that involved research and production showed stronger learning effects
than those of marketing joint ventures. However there are conflicting results about the
effect of partner-specific experience on alliance value creation. While Hoang and
Rothermael (2005) find partner-specific experience or repeated alliances with the same
partner to negatively value creation, Zollo, Reuer, and Singh (2002) and Gulati, Lavie,
and Singh (2009) found it to have a significantly positive effect.
Asymmetries in sharing of value created from alliances depend on the position
in the value chain and the resource dependency between partners (Dyer, Singh, and
Kale, 2008). Partners of horizontal joint ventures tend to share equally the synergy
gains, while suppliers of vertical joint ventures tend to gain significantly more than
buyers (Johnson and Houston, 2000). Kumar (2010a) found that partners with a strong
resource dependency on the other joint venture partner experienced lower gains than the
less dependent partner. This finding agrees with other research (Adegbesan and
Higgins, 2011; Inkpen and Beamish, 1997) which shows that asymmetries in sharing of
value created depend also on the bargaining positions in terms of the partners’ mutual
resource dependency. Other factors that drive asymmetric gains include differences in
the firms’ ability to learn and benefit from that learning (Hamel, 1991) and differences
in information access by parent firms (Reuer and Koza, 2000).
2.5 Do alliances fail? How often? Why are they unstable?
Despite the fact that alliances on average create value, more than half of them
fail (Kale and Singh, 2009). In fact, different studies have estimated the failure rate to
be anywhere between 30% and 70%, where failure is defined as either not meeting the
goals set by the parent firms, or not delivering the operational or strategic benefits they

Literature Review Paper One
21
were designed to achieve (Bamford, Gomes-Casseres, and Robinson, 2004). Alliances
are particularly prone to failure in their earlier years following formation (Kogut, 1989;
Bleeke and Ernst, 1993).
International alliances are more instable because of the significant coordination
costs, cultural and language differences, difficulties reconciling conflicting goals with
between independently owned partners, and always the threat of creating a competitor
(Porter, 1990; Inkpen and Beamish, 1997; Peng and Shenkar, 2002; Fang, 2011). They
too are known for their 50% failure rates (Bleeke and Ernst, 1993; Kogut, 1988).
Alliances, both domestic and international, often fail because of poor partner
selection which later results in a mismatch of resources and insignificant synergy gains
(Hitt et al, 2000). Failure can also be due to poor management of the alliance which fails
to effectively build social capital that maximizes the trust between partners and to
properly develop its learning systems within the alliance (Ireland, Hitt, and Vaidyanath,
2002). Competitive rivalry between partners may also cause alliance failure (Kogut,
1989; Dussauge, Garrette, and Mitchell, 2000). While reducing competitive rivalry may
have been an initial reason allying firms decided to cooperate, the same competitive
forces may later drive them to take advantage of each other.
In general, the failure of or challenges in forming and managing alliances can be
understood in terms of the internal tensions between the partners. Specifically, three key
dimensions include: cooperation vs. competition, rigidity vs. flexibility, short-term vs.
long-term orientation (Das and Teng, 2000a). These internal tensions are feedback
mechanisms that force the partners to engage in the renegotiation of the alliance
contract or to modify their behavior to restore balance to the relationship (Ariño and de
la Torre, 1998). Coupled with the tensions caused by the simultaneous changes in the

Literature Review Paper One
22
external business environment, the alliance relationship is co-evolves in tandem, adding
further to the instability (Doz, 1996; Das and Teng, 2002).
2.6 Which one? Alliance or Acquisition?
Combining resources through an alliance or acquisition are potentially but not
perfect substitutes (Yin and Shanley, 2008). Acquisitions are competitive processes and
involve the displacement of the target firm’s management. Alliances on the other hand
are cooperative and require on-going dealings with the partner’s management (Dyer,
Kale, and Singh, 2004). Choosing between engaging in one or the other requires firms
to analyze at least three factors including: (1) the resources and synergies desired; (2)
the market place they compete in; and (3) their ability to collaborate with partner firm
(Dyer, Kale, and Singh, 2004: 110). However, firms may have a pre-specified
preference to engage in one governance form over another because of certain
characteristics of the firm itself rather than characteristics of the deal or partner/target
(Villalonga and McGahan, 2005).
Firms which are more likely to engage in an acquisition have similar resource
bases to the target and more prior acquisition experience, while firms more likely to
engage in an alliance will be ones that have complementary resource bases with the
target and more prior alliance experience (Wang and Zajac, 2007). Furthermore the
decision a firm makes to ally or acquirer is taken in view of its overall position the
network of firms it has relationships with rather than as if it was independent of these
influences (Yang, Lin, and Lin, 2010).
Firms may also engage in an alliance with the intention of investing in an option
to later acquire their partner (Kogut, 1991; Chi, 2000). Gaining partner-specific alliance
experience with a target before acquiring it is one way firms use to reduce information

Literature Review Paper One
23
asymmetries before engaging in an acquisition (Agarwal, Anand, and Croson, 2006;
Zaheer, Hernandez, and Banerjee, 2010; Porrini, 2004).
3. A REVIEW OF LITERATURE IN STRATEGY & VALUATION
3.1 Theories from the Strategy Literature
The following sections provide brief summaries of different theoretical views of
the firm that are found in the strategy literature. It is in no way complete. The idea is to
highlight relevant parts of theories that provide insight into strategic alliances and their
financial valuation. The four following sub-sections include: the market-based view,
resource-based view, knowledge-based view, and transaction cost approach.
3.1.1 Market Based View
The market-based view (MBV) is an outside perspective of the firm and
concerns how they position themselves in the market or industry in order to profitably
compete (Makhija, 2003). Originating from early industrial organization theory (see
Bain, 1950, 1956; Mason, 1964), MBV describes how firms affect long-term
profitability by erecting entry barriers to increase monopoly power over customers and
bargaining power over suppliers (Grant, 1991). Erecting entry barriers to prevent new
industry entrants include concepts such as developing: greater economies of scale, finer
product market differentiation, higher capital resource requirements, lower cost
advantages, more complex proprietary knowledge, more exclusive access to distribution
channels, and lobbying for government policy that discriminates against competitors
which don’t meet certain standards (Bain, 1956; Porter, 1979a). MBV is based on two
assumptions (1) that entry barriers provide common and equal protection to all

Literature Review Paper One
24
incumbent firms, conferring some degree of monopoly or oligopoly power; and (2) that
firm resources are homogeneous and hence relatively transferrable between incumbent
firms, i.e. mobile resources. This version of MBV, however, cannot explain why over
the long-term in the same industry different firms or groups of firms can co-exist each
pursuing different strategies while at same time earning different profit margins.
To explain this mutual but differential co-existence requires extending MBV to
include concepts such as strategic groups and mobility barriers (see Porter, 1979b;
Caves and Porter, 1978). It is worth summarizing these concepts in more detail because
of the similarities and relevance in respect to strategic alliances and valuation. As Porter
(1979b) and Caves and Porter (1977) explain, an industry consists of multiple strategic
groups which are groups of firms following a similar strategy that identifies the group.
Each strategic group erects its own set of entry barriers to prevent the mobility of new
rival groups entering the industry (inter-industry mobility), as well as to deter the
mobility of other strategic groups within the industry entering their territory (inter-group
mobility). Strategic groups with high mobility entry barriers are relatively more
insulated from competitive rivalry within the industry, have superior bargaining power
over other strategic groups within and without the industry, and have less threat from
substitutes. Thus the distribution of profitability rates enjoyed by individual firms will
depend on two structural influences: (1) the structural nature of the firm’s industry
relative to other industries: the greater the bargaining power the firm’s industry has
over its buyer or supplier industries, the more profitable will be the industry as a whole.
And (2) the structural nature of the firm’s strategic group relative to other strategic
groups: the higher the mobility barriers of the strategic group, the greater will be the
group’s share of the industry profits. Mobility barriers include investments in

Literature Review Paper One
25
advertising, R&D, or building an in-house service capability (Porter, 1979b: 217),
which while costly in the short-run protect long-run profits.
The presence of multiple strategic groups in an industry, Porter (1979b: 217-18)
goes on to explain, affects the nature of inter-firm rivalry and hence the average level
and dispersion of profits enjoyed by industry participants under the basic rule that the
greater rivalry, the lower the profits. Three factors affect the competitive rivalry
between strategic groups: (1) number and size distribution: the more groups and the
more they are equal in size, the greater will be the rivalry; (2) strategic distance: the
more similar they are in strategy, the more will be the rivalry. Strategic distance can be
described in terms of advertising, cost structure, R&D, etc.; and (3) market
interdependence: the more they share the same customers from the same market
segment, the greater the rivalry.
Porter (1979a; 1985) summarizes the principle concepts of MBV in his
celebrated five-forces model which includes: (i) threats of new entrants, (ii) threats from
substitutes, (iii) bargaining power of suppliers, (iv) bargaining power of customers, and
(v) industry rivalry. The model can be applied at either the firm or industry levels (i.e.
inter-firm and inter-group rivalry). Under MBV, the role of management is therefore to
assess the industry environment and to position the firm in attractive market segments
according to three generic competitive strategies: (a) low cost strategy in which it can
take high market share; (b) differentiation strategy in which it tries to dominate in a
certain number of segments; or (c) niche strategy in which it aims for high margins in
selected segments (Porter, 1985).
While MBV is an external view of the firm from the industry or market level,
Porter recognizes the importance of the structure and organization within firms. His
widely known value-chain (Porter, 1985) divides the firm into primary or line activities

Literature Review Paper One
26
and secondary or support activities. The ability for the firm to effectively manage the
linkages between these activities is a source of competitive advantage that positively
affects the profit margins the firm is able to make from customers above its competitors.
Application to alliances: MBV would therefore argue that strategic alliances of same-
industry firms are motivated to cooperate (i.e. collude) in order to achieve at least one of
three main objectives (Grant, 1991; Makhija, 2003): (1) to increase market power or
strengthen market position against other competing firms or alliances; (2) raise higher
entry barriers to prevent new rival firms or alliances from entering the market segment;
or (3) to increase bargaining power against common suppliers and customers of the
alliance partners. MBV would further argue that the formation of strategic alliances
dynamically changes the structure of market power of the industry as competing
alliances (i.e. strategic groups) change their mobility barriers with respect to each other.
If the formation of alliances consolidates the industry into a fewer number of alliances,
industry rivalry should decrease, positively affecting profit margins. If the number of
alliances increases, the opposite effect would be observed. Furthermore, Porter (1979b:
217) would argue that the strength of monopoly or oligopoly power enjoyed by alliance
firms is a function of the unity of strategy amongst the allying firms. However,
divergent strategies amongst allying firms reduces this power with a concomitant
decrease in margins because of increased difficulty in tacit coordination between
partnering firms and decreased information flow through common customers.
But not all alliances which may seem motivated by collusion are contrary to
public welfare, even among firms of a concentrated industry. As Kogut (1988: 322)
points out “Where there are strong network externalities, such as in technological
compatibility of communication services, joint R&D of standards can result in lower

Literature Review Paper One
27
prices and improved quality in the final market. Research joint ventures which avoid
costly duplication among firms but still preserve downstream competition can similarly
be shown to be welfare-improving.” Other studies do show however, that alliances are
motivated by market positioning motives. Vickers (1985) shows that firms may
sometimes use joint ventures to pre-emptively patent small technological innovations as
deterrents against new market entrants. Mathews (2006) shows using a simple model of
Cournot competition how an incumbent deters an entrepreneurial firm from market
entry by selling equity in his firm.
3.1.2 Resource Based View
In contrast to MBV, the resource-based view (RBV) is an inside perspective of
the firm and concerns how a firm combines its strategically important resources using
the capabilities it has developed to compete profitably against other firms (see Barney,
1991; Grant, 1991; Peteraf, 1993; Prahalad and Hamel, 1990). The origins of RBV stem
from the work of Penrose (1959) who observed that strategic resource heterogeneity
between firms was a source of earning sustainable Ricardian rents, i.e. firms with
superior resources have lower average costs than other firms (Peteraf, 1993) and that the
asymmetry of resource positions leads to the sustainability of above-average rents (Amit
and Schoemaker, 1993). Following Penrose’s work, RBV rose from a certain
“dissatisfaction with the static, equilibrium framework industrial organization
economics that [had] dominated much of contemporary thinking about business
strategy” (Grant, 1991: 114). It began to emerge in the 1980s as an alternative
explanation for the competitive strategies of firms (Wernerfelt, 1984; Barney, 1986).
Rather than focusing on the competitive position of a firm in the market, “managers

Literature Review Paper One
28
should instead [be focusing] their analysis on their unique skills and resources”
(Dierickx and Cool, 1989: 1504).
Unlike MBV which views strategic firm resources as homogeneous and mobile
between firms of the same strategic group (i.e. easily transferrable), RBV
conceptualizes each firm as a bundle of heterogeneous strategic resources that are
generally not easily transferrable between firms (Barney, 1991) and therefore are not
usually traded in strategic factor markets (Barney, 1986). Firms can develop a sustained
competitive advantage and achieve superior profitability if they have access to strategic
resources that possess four important attributes: (a) valuable, (b) rare, (c) non-imitable,
and (d) non-substitutable (Barney, 1991). However, competitive advantage is not
achieved merely by combining strategic resources, but requires a careful system of
coordination and control across an entire firm which in turn fits the firm’s corporate
strategy (Collis and Montgomery, 1998).
Scholars have put forward various classifications of a firm’s strategic resources.
Grant (1991) provides six major categories of resources: financial, physical, human,
technological, reputational, and organizational resources. Barney (1991) groups
resources into three categories: physical capital, human capital, and organizational
capital.
As strategic resources are generally not traded in strategic factor markets, to
access new ones firms either need to develop them internally or combine theirs with
those of other firms (Wernerfelt, 1984; Dierickx and Cool, 1989). The internal
accumulation of a strategic resource, however, requires choosing appropriate time paths
of flow variables to build the resource stocks (Dierickx and Cool, 1989), i.e. a firm
builds a strategic resource through a deliberate and consistent policy of acting which
requires time and constant effort. Dierickx and Cool (1989: 1507-09) distinguish
Literature Review Paper One
29
between stocks and flows of assets or strategic resources. The term “stock” refers to the
level of asset accumulation, while flow refers to the rate of accumulation. These authors
also identify several characteristics of the process of accumulating stocks of strategic
resources: (1) time decompression economies: certain resources take a minimum time to
build and shorting the process leads to diseconomies or lower quality stock; (2) asset
mass efficiencies: a minimum stock of existing resources is required to build new ones
efficiently, i.e. “success is needed to breed success”; (3) asset interconnectedness: the
growth in stock of one asset may also depend on the level of stock of other assets, i.e.
growth interdependencies; (4) asset erosion: the strategic value of resource stocks
decrease over time and certain “maintenance costs” need to be paid to keep them from
decaying excessively; (5) causal ambiguity: the direction of resource accumulation is
not a linear process, and depends on current levels of stock and on factors that are
beyond the firm’s control or simply random; and (6) asset substitution: stocks of
strategic resources can be substituted by other resources. These characteristics do not
apply to all resources, but to those of a strategic nature.
Application to alliances: If a firm cannot overcome the stock and flow process
limitations required to build its own strategic resources, it will need to resort to strategic
alliances and acquisitions in order to remain competitive. While these forms of business
combinations may help the firm catch up or overtake its competitors by “leap-frogging”
certain requirements of the resource building process, for example jumping over the
time diseconomies required to build a minimum asset base, it may still be limited by the
other requirements, such as managing the interdependencies between its existing asset
base and the assets to be combined. Firms that have developed a capability to combine
resources accessed through a strategic alliance or acquired through an acquisition are

Literature Review Paper One
30
therefore at a distinct advantage (Kogut and Zander, 1992; Bresman, Birkinshaw, and
Nobel, 1999; Hamel, 1991). The ability to learn as an organization is itself a strategic
firm resource (Grant, 1991; Kogut and Zander, 1993)
3.1.3 Knowledge Based View: Organizational Learning and Capabilities
The study of organizational learning and how firms develop organizational
capabilities has emerged from the knowledge-based view (KBV) of firms, an important
extension of RBV. Under KBV, the firm is conceived as an organizational structure
through which knowledge is created (Nonaka, 1991, 1994).
Knowledge is a special type of firm resource that has been categorized into two
types: (A) tacit knowledge and (B) explicit knowledge (Nonaka, 1994; Grant, 1996b).
The categories can be further analyzed according to three important characteristics
(Grant, 1996b): (1) transferability: explicit knowledge is transferred as soon as it is
revealed because it can be codified in a common format or language that others can read
and interpret, for example: statistics, lists, tables, descriptions, etc. Tacit knowledge, in
contrast, is “sticky” because it stays with the knowledge owner and transferred to the
learner only if it is constantly practices by use and experience. It is not easily codified or
expressed in a standard language; (2) aggregability: While explicit knowledge because
of its common format can be easily stored and transferred in limitless quantities, tacit
knowledge resides with the knowledge owner and is not easily duplicated or imitated;
(3) appropriability: refers to ability of the resource owner to receive a return equal to
the value created by the resource (Teece, 1987). While explicit knowledge becomes a
public good (i.e. has low marginal cost) and loses its appropriability as soon as it is
revealed, tacit knowledge increases in appropriability because its non-transferability and

Literature Review Paper One
31
non-aggregability make it a rare and valuable good. In sum, tacit knowledge is a
strategic resource, while explicit knowledge is not and quickly loses value.
Tacit knowledge is more easily transferred if the learner already has a base of
similar knowledge, i.e. has absorptive capacity (Cohen and Levinthal, 1990). Absorptive
capacity is firm’s ability to value, assimilate, and utilize new external knowledge and is
critical to its innovative capability and sustainable competitive advantage (Zahra and
George, 2002). The development of absorptive capacity is history- or path-dependent
and the failure of a firm to continue investing in its development, especially in fast-pace
and research intense industries, may foreclose future opportunities for absorptive
capacity development (Cohen and Levinthal, 1990; Dierickx and Cool, 1989). While
absorptive capacity is a firm-level resource, it can also be conceptualized as an
interfirm-level resource called relative absorptive capacity (Lane and Lubatkin, 1998).
Relative absorptive capacity is based on the dyadic relationship between two firms, for
example in a strategic alliance, and depends on the similarity between firms’ knowledge
bases, organizational structures and policies, and business strategy.
Application to alliances: Firms are able to access each others’ tacit knowledge
resources through strategic alliances (Inkpen, 1998b; Stuart, 2000; Gomes-Casseres,
Hagedoorn, and Jaffe, 2006). Value creation through strategic alliances is enhanced
because the tacit knowledge resources of each allying firm are imperfectly mobile (not
easily transferred), imperfectly imitable, and imperfectly substitutable (Das and Teng,
2000b; Grant and Baden-Fuller, 2004). Furthermore, as firms share their tacit
knowledge resources, they tend to become more specialized in their area of knowledge
expertise (Mowrey, Oxley, and Silverman, 1996). Specialization in knowledge creation
allows allying firms to prosper in competitive environments by allowing each one, on
Literature Review Paper One
32
the one hand, to focus efforts on creation of its specialized knowledge while on the
other, to access their alliance partners’ specialized knowledge and integrate it with their
own (Grant and Baden-Fuller, 1995, 2004).2
Firms also learn how to learn as they gain experience in strategic alliances
(Anand and Khanna, 2000). They internalize this ability by setting up intra- and inter-
organizational routines to increase the efficiency and effectiveness with which the
knowledge is accessed and transferred, positively affecting performance of the alliance
(Inkpen, 2000; Zollo, Reuer, and Singh, 2002). Firms also learn from their repeated
alliances with the same partner (Gulati, 1995), as well as learn from their alliance
failures (Ariño and de la Torre, 1998). Repeated alliances with the same partner,
however, in general lead to deterioration in the value created (Goerzen, 2007).
Organizational routines are patterns of behavior that are followed repeatedly,
but change if conditions change (Nelson and Winter, 1982; Dyer and Singh, 1998). In
markets that are moderately stable, organizational routines are internal firm processes
that are complex, detailed, and analytic and that produce predictable outcomes
(Eisenhardt and Martin, 2000: 1106; Cyert and March, 1963; Nelson and Winter, 1982).
Because of their tacit nature, organizational routines can become a source of
competitive advantage (Grant, 1996a; Dyer and Singh, 1998). For example, Dyer and
Hatch (2006) found a significant performance difference between auto manufacturers
that used the same supplier network. Whereas Toyota established greater knowledge
sharing routines with the common supplier network, resulting in faster learning and
lower defect rates, US auto manufactures shared much less knowledge with this same
supplier network, which learned slower and had a higher rate of defects, ceteris paribus.
2 While transfer of tacit knowledge through an alliance is more efficient than market exchange contracts,
transfer of tacit knowledge within a (multinational) firm itself is still more efficient than across an
alliance (Almeida, Song, and Grant, 2002).

Literature Review Paper One
33
However, in high-velocity markets where industry structure is blurred and
emergent, firms learn how to agilely adapt their organizational routines into flexible
modes of operating, converting them into dynamic capabilities (Teece, Pisano, and
Shuen, 1997; Eisenhardt and Martin, 2000; Helfat et al, 2007). Under these market
conditions, dynamic capabilities are processes that are simple, experimental, and
unstable and that produce unpredictable outcomes. Dynamic capabilities are a subset of
organizational routines that include product innovation, strategic decision making, and
alliancing, and a further source of sustainable competitive advantage (Eisenhardt and
Martin, 2000: 1111). Operating routines are another subset of organizational routines
that are geared to the normal or stable operation of the firm. While operating routines
are directed at the firm’s operations, dynamic capabilities are directed at the
modification of operating routines (Zollo and Winter, 2002: 340).
As firms learn to learn from their alliance experience, they develop alliance
capability (Kale and Singh, 2007; Kale, Dyer, and Singh, 2002; Simonin, 1997).
Alliance capability consists of how firm is able to coordinate, communicate with, and
integrate or bond an individual alliance into a firm’s network of alliances (Schreiner,
Kale, and Corsten, 2009). One of the key success factors for firms to build alliance
capability is setting up a dedicated alliance function. The alliance function plays the role
of articulating, codifying, sharing, and internalizing the organizational routines of
alliance management that make up the firm’s alliance capability (Kale and Singh, 2007;
Heimeriks and Duysters, 2007).
3.1.4 Transaction Cost Approach
The transaction cost approach has its origins in a classic paper on “The nature of
the firm” by Coase (1937) who observed that goods and services produced by firms are

Literature Review Paper One
34
the product of early stage processing and assembly of activities (Williamson, 1981:
550). The basic idea of the approach is that firms purchase production inputs based on
minimizing the sum of the production and transaction costs. Transaction costs include
“the costs of negotiation, drawing up contracts, managing the necessary logistics, and
monitoring the accounts receivables” (Child and Faulkner, 1998: 20). Furthermore,
firms will choose an organizational form that enables them to access or purchase their
production inputs at the lowest transaction cost (Williamson, 1979). These forms
include, at one extreme market exchange contracts, at the other extreme mergers or
acquisitions of suppliers, or a middle-ground hybrid form such as alliances, including
licensing contracts to joint ventures.
Three critical dimensions of the transaction to acquire inputs determine a firm’s
preferred organizational form: (1) frequency of transactions; (2) uncertainty of acquiring
inputs; and (3) asset specificity involved in input production and supply (Williamson
(1975, 1979, 1985). The second and third are the two most critical dimensions
(Williamson, 1991; Hennart, 1988; Dyer and Singh, 1998; Amit and Schoemaker,
1993). Market uncertainty incurs transaction costs involved with performance
monitoring, while asset specificity incurs transaction costs that concern acquiring inputs
at stable prices (Kogut, 1988; Hennart, 1988).
Application to alliances: Kogut (1988: 321) explains how uncertainty makes equity
joint ventures (alliances) the preferred organizational form: two or more firms vertically
contiguous in the supply chain will choose an alliance over other organizational forms
when uncertainties exist over downstream demand or upstream supply. The supplier’s
transaction cost involves monitoring the quality of the buyer’s market information about
downstream conditions, the buyer’s cost is monitoring the quality and timely delivery of

Literature Review Paper One
35
the supplier’s inputs, and both will incur price negotiation costs. The uncertainties over
the general market conditions amplify the monitoring costs for both firms. Under these
uncertain conditions, a market exchange contract would not be the preferred
organizational form. A merger of firms, on the other hand, would also be excluded
because again uncertainty over market conditions demands flexibility in the
organizational relationship. An alliance provides this flexibility in conditions of
uncertainty and at the same time introduces a mutual hostage situation through the joint
commitment of financial and real assets that aligns their incentives and reduces the
associated transaction costs of monitoring and negotiating the transaction of inputs and
market information.
Hennart (1988: 371) explains in a different way why an equity joint venture
(alliance) would be preferred when resources with high asset-specificity are involved.
Such resources require large investments over an extended period of time and include
tacit knowledge assets that are not readily marketable or physical assets with high
operating leverage3. Again, take two firms in vertically contiguous positions in the
supply chain. The downstream firm needs inputs from the upstream but a market
exchange contract for the inputs it needs don’t exist; developing its own source of
inputs is prohibitively expensive in terms of development costs and time; and acquiring
the upstream firm for the sake of accessing its inputs introduces other transaction costs
that complicate its problem such as managing a new business and displacing the old
management. For the upstream firm, acquiring the downstream to ensure a buyer again
incurs management transaction costs; and the downstream firm’s required input volume
may not match its current output. An alliance such as an equity joint venture between
3 Operating leverage can be thought of as the ratio of fixed costs to variable costs. Firms with high
operating leverage make large upfront investments and need large sales volume to break even. Each
dollar of sales contains a high percentage of profit because the variable or marginal costs of production
are relatively small or almost negligible. For example, an airline operator would have high operating
leverage compared with a supermarket chain.

Literature Review Paper One
36
the two firms however, will avoid many of these transaction costs. The upstream
alliance partner can produce the inputs at low or negligible marginal cost, while the
downstream partner can obtain the inputs at a lower total cost compared to producing
the inputs itself. The incentives of the alliances align their cost structures.
In sum, the transaction cost approach provides insights into the economic
incentives that drive firms to choose certain organizational forms over others by
focusing at the level of the transaction between firms. The approach is not an alternative
to MBV, RBV, or KBV. In fact all these theoretical views should be seen as
complementary explanations (Kogut, 1988: 322).
3.2 Theories from the Financial Valuation Literature
“A valuation is just an opinion” (Fernández, 2009: 8). Value should not be
confused with price, which is the quantity of money agreed between a buyer and seller
to exchange goods or services (Fernández, 2002). Value, on the other hand, is a
subjective judgment that depends on how important the good in question is to the buyer
or seller. A good may be more valuable to one buyer than another. Thus the valuation
made by a single investor on a firm’s traded stock is contingent on his or her
expectations of the future and on the risk assessment of the firm (Fernández and Bilan,
2007). The traded price for that stock, however, is the consensus of valuations made by
market participants who publicly manifest their opinion by buying or selling that stock.
The assessment and measurement of synergies are of fundamental importance to
valuation for any form of business resource combination such as an alliance or M&A. In
finance, there are two main sets of synergies, especially in case of mergers: operating
synergies and financial synergies (Damodaran, 2005, 2012). Operating synergies
include (1) greater economies of scale because of larger size with the same fixed; (2)

Literature Review Paper One
37
increased pricing power because of reduced competition and ability to earn higher
margins; (3) complementary functional strength brought by combining the best
practices of firms; and (4) increased sales in new or existing markets because of
extended sales network and complementary brand recognition. Financial synergies
from the merger of two firms include (1) increased debt capacity and hence lower cost
of debt capital because combining uncorrelated operating cash flows reduces their
overall volatility; (2) increased tax benefits especially if one of the firms has
accumulated tax losses that can be used to reduce the combined firm’s tax burden; (3)
diversification which reduces the overall cash flow volatility of the portfolio of firms,
although this synergy is usually only valid for privately held firms; and (4) cheaper
access to project capital, especially a capital constrained firm with good projects is
acquired by another with excess cash, thus avoiding to go to the capital markets. Both
types of synergies, if they are realized, show up in the valuation as increased cash flows
or lower discount rates (Damodaran, 2005).
While the valuation of M&As depend to a great degree on the assumptions upon
which they are based, valuing alliances has the added difficulty of defining the limits to
firm boundaries. As alliance partners commit to share both tangible and intangible
resources without legally merging as one entity, the boundary between them is blurred
making it difficult to accrue value created to one party or the other. A firm’s bargaining
power against its alliance partner will determine to a great extent the portion of the total
value pie created (Adegbesan and Higgins, 2011; Adegbesan, 2009).
The following section provides a summary of theories and methods that could be
used to value the wealth creation of strategic alliances. However, the purpose of the
summary is not to provide a comprehensive coverage of the available theories or
methods in the finance literature, but rather to highlight certain issues that could be

Literature Review Paper One
38
related to valuing strategic alliances within the context of this paper. For proper
treatment of the methods mentioned, please refer to the references provided.
3.2.1 Discounted cash flow method
The discounted cash flow (DCF) method of valuation is the finance “gold
standard” for both firm and project valuation. The basic economic intuition is that the
present value of a stream of cash flows (PV0) is the sum of the discounted value of those
cash flows (CF) each discounted by a rate (k), as shown in equation (1). The term “cash
flow” refers to the “future net cash in-flow” i.e., the difference between cash received
and cash paid out within each time period in the future. The discount rate is usually
simplified so that k1= k2 = … = k and depends on the risk of receiving the cash flows: if
the risk is low then the cash flows are discounted at a lower rate; if the risk is high, then
a higher discount rate. The net present value (NPV) is the remaining economic value
after making the investment (I0) today in order to receive the cash flows, as shown in
equation (2).
(1)
N (2)
DCF is easy to apply once the cash flows and discount rate have been
determined. However, the differences in the assumptions used to calculate these values
are where the difficulties lie. Determining the value of cash flows requires assessing and
measuring the operational and financial synergies outlined above, tasks that depend to a
great degree on the assumptions made. Calculating the discount rate also requires tacit
know-how on forecasting market interest rates, industry risks, and the systematic risk of
the firm. Understandably, these are all non-trivial tasks.

Literature Review Paper One
39
There are many “flavors” of DCF depending on whether one is valuing a firm or
project, a firm that is stable, growing or in decline, a high-technology or standard
technology firm, whether the firm has debt or is all equity funded, etc. Fernández (2002:
38) gives three basic methods of DCF4: (1) FCF method: Free cash flows (FCF)
discounted by the weighted average cost of capital (WACC) of the firm. Free cash flows
are defined as the after-tax surplus cash generated by a firm’s operations (or project)
regardless of any financing costs, and is a measure of a firm’s ability to make money
regardless of where it got its capital from; (2) CFe method: Equity cash flows
discounted by the required return to equity holders, ke; and (3) CFd method: Debt cash
flows discounted by the required return to debt holders, kd. A more comprehensive
treatment of the different methods of DCF is given in Fernández (2005a).
The FCF method (see Brealey, Myers, and Allen, 2008) enables the calculation
of the total value of the firm or project (VFCF). Theoretically (i.e. in the absence of
market inefficiencies and financial distress costs), the total value of the firm5 (or
project) equals the market value of the equity (E) and the market value of debt (D)
issued by the firm, as in equation (3).
VFCF = E + D = PV(FCF, WACC) (3)
where PV(FCF, k) is the DCF operator given by equation (1)
and NPVFCF = VFCF – I0 (3a)
where WACC = [Eke + (1-T)Dkd] / [E+D] (3b)
and T=firm’s marginal tax rate.
4 There are of course many more! See for example Copeland et al (2000) and Brealey et al (2008).
5 Another name for the value of the firm is enterprise value.

Literature Review Paper One
40
The FCF method, however, assumes that the capital structure of the firm (debt to equity
ratio) remains constant, which may not always be the case unless the firm continuously
rebalances its financing structure6.
A useful extension of the DCF method is the Adjusted Present Value (APV)
method, which does not assume a constant capital structure. The intuition to APV is that
the value of the firm or project (VAPV) is equal to the sum of the value generated by the
unlevered firm or project (Vu) 7
and the value generated by the tax benefits due to debt8,
as in equation (4). APV is a particularly useful method for project valuation as project
value should not depend on the source of financing for the project, but rather only on
the cash flows it generates and the risk of the project with respect to the firm’s risk.
VAPV = Vu + Value of tax benefits due to debt = VFCF (4)
where Vu = PV(FCF, ku) = Unlevered value of firm or project
and NPVAPV = VAPV – I0 (4a)
and where ku = rA = [Eke + Dkd] / [E+D] (4b)
rA is the expected return to assets9
ku is the unlevered expected return to equity
ke is the levered expected return to equity
and ke = Rf + β(Rm – Rf) CAPM (4c)
where Rf is the risk free rate
Rm is the market risk premium
β is the systematic risk of the firm’s stock.
6 This assumption is required to ensure no change in ku or kd such that WACC also remains constant.
7 Vu means the value of the firm or project as if it was entirely funded by equity, i.e. no debt or unlevered.
8 The equation states “value” of tax benefits due to debt and not “present value” as it does in Brealey et al
(2008: 546). This point is argued in Fernández (2004, 2005b) and Fieten, et al (2005). 9 This is also called the opportunity cost of capital and is the “simplest” formula to find ku the unlevered
expected return to equity (Brealey et al, 2008: 543). Note that, in this formula, ke and kd are observable
values, where ke is the levered return to equity, the return to equity when the firm also has debt financing.

Literature Review Paper One
41
Application to alliances: Strategic alliances can be considered joint projects between
allying firms who share a subset of their resources. Equations (3) and (4) can be
combined to give equations (5a) and (5b), one for each firm in the alliance, say firm A
and firm B:
EA + DA = VuA + VTDA (5a)
EB + DB = VuB + VTDB (5b)
where VTD = value of the tax benefits due to debt of firm A or B
If the risk of the alliance project is no different to the risk of the respective parent firms’
risk and no new debt is issued, then there should be no change in the market value of
debt and all the benefits of the project should go to the equity holders. However, if the
project risk is different to the respective partner firms’ risks, there may be change in the
market value of debt.
Research has shown that firms tend to choose alliances as the organizational
form through which they undertake projects that are more risky than their normal
business risk (Contractor and Lorange, 1988; Robinson, 2008). Given this result,
questions arise as to what the appropriate discount rate should be to value the expected
cash flows from the alliance and the commensurate effect on capital structure of each
allying firm. Further discussion on these questions is found in the section on Research
Gaps.
3.2.2 Real options method
One disadvantage of the discounted cash flow method is it assumes that once the
decision is made to accept or reject a project it will not be changed later on. In practice,
managers do change their decisions as new information arrives that gives them a better
indication of the future performance of the project. If the news is good, they may decide

Literature Review Paper One
42
to go ahead or even expand the project scope, while if it is bad, they may scale it back
or even abandon it altogether. The option to choose based on future market conditions is
therefore valuable. DCF methods, however, do not account for this strategic managerial
flexibility. The real options methods do.
Myers (1977) first used the term real option to refer to the present value of the
future assets a firm has the discretion to invest in depending on conditions of the market
in later periods. He observed that “most firms are valued as going concerns, and this
value reflects and expectation of continued future investment by the firm. However, the
investment is discretionary. The amount invested depends on the net present values of
opportunities as they arrive in the future. In unfavorable future states of nature, the firm
will invest nothing.” (p.148).
Some types of investment decisions a more suitable for using real options
methods (Amram and Kulatilaka, 1999: 25-27) such as: (a) irreversible investments:
large investments in fixed assets can be built in flexible stages or delayed until
favorable times; (b) flexibility investments: designing manufacturing processes so that
they can switch between several different products or uses; (c) insurance investments:
when exposed to the risk of loss, paying an insurance premium provides protection in
the event of a loss; (d) modular investments: stages of product design that can be
upgraded or changed independently of other modules allows flexibility to meet future
requirements; (e) platform investments: a technology platform, such as Apple’s iOs
operating system, allows many different yet to be designed products to be sold through
the same platform; (f) learning investments: exploration of oil or minerals allows for
future investments in oil production based on initial finding.
There are three main types of real options embedded in the investments made by
firms (Damodaran, 2008: 235): (I) option to expand an investment; (II) option to delay

Literature Review Paper One
43
an investment; and (III) option to abandon an investment. Real options methods
incorporate the flexibility of strategic managerial decision making into the valuation
process using the theories of financial options (Black and Scholes, 1973).
In financial options, the buyer of a call option pays a premium for the right but
not obligation to buy the underlying asset at a preset exercise price before the option
expiry date. If the price of the underlying is below the exercise price at the time of
expiry, the call option owner will obviously not exercise the option. Thus the option
owner has downside protection from loss as well as upside opportunity for gain. In an
analogous manner, the buyer of a put option buys right but not the obligation to sell the
underlying asset at a preset exercise price if the price of the underlying falls below the
exercise price before the option expires. Regardless of the type of option as long as it
has not expired, an option always has positive value. The underlying asset can be any
asset, including stocks, bonds, real estate, commodities, etc.
Table 1 presents the analogy between a financial American style call option and
a real option to expand a project (See Hull, 2000; Damodaran, 2008)
Table 1: A comparison of a financial and real option to expand
Financial Call Option Symbol Real Option to Expand Value of underlying asset
e.g. a stock price S
Estimated present value of project cash
flows
Exercise price of call option K Cost of investment in expansion if option
is exercised
Volatility of underlying asset
e.g. std dev of stock price returns σ
Standard deviation in project value,
usually obtained by simulations
Time remaining to option expiry T Time remaining to decide before expiry of
option to expand
Dividends of underlying asset δ Other income from the project.
Risk free rate r Risk free rate taken from government
Treasury Bills
Application to alliances: Alliances can be understood as joint investments by
the partnering firms in real options (Kogut, 1991; Chi, 2000; Folta and Miller, 2002).
Although they are started as a joint project, changes in the market conditions may make

Literature Review Paper One
44
it favorable for one partner to buy out the other’s share and expand the project under its
own management. Alliance contracts may be designed with this buy out option included
(see Reuer and Ariño, 2007). In a similar vein, in order to increase the number and
value of their growth options, Reuer and Tong (2010) show that cash-rich firms will
often use investments in alliances with new publicly-listed technology firms as a way of
discovering new technologies and market opportunities that they would otherwise not
have access to.
Alliance capability or capabilities in general can also be understood as a real
option. Firms which have invested in strengthening their alliance learning routines by
simplifying and making them more flexible especially in times of high market volatility
will be more able to respond and take advantage of market upswings (Kogut and
Kulatilaka, 2001).
Valuation of projects using real options methods, however, is not without
difficulties. Once touted as a way of unifying strategic thinking with financial option
methods (Kester, 1984; Bowman and Hurry, 1993), difficulties in customizing the
reality to the financial models has limited its wider use (Bowman and Moskowitz,
2001). Nevertheless, as a way of thinking about projects, real options methods continue
to provide a way forward for research (see Krychowski and Quélin, 2010)
3.2.3 Event study method
The discounted cash flow and real options methods require information inputs
that come from the within the firm to evaluate expected performance of the firm or a
project. Event study methods of evaluating firm performance however, rely solely on
publicly available sources, namely corporate security prices. The purpose of an event
study is to examine the market reaction reflected in corporate security prices to news of
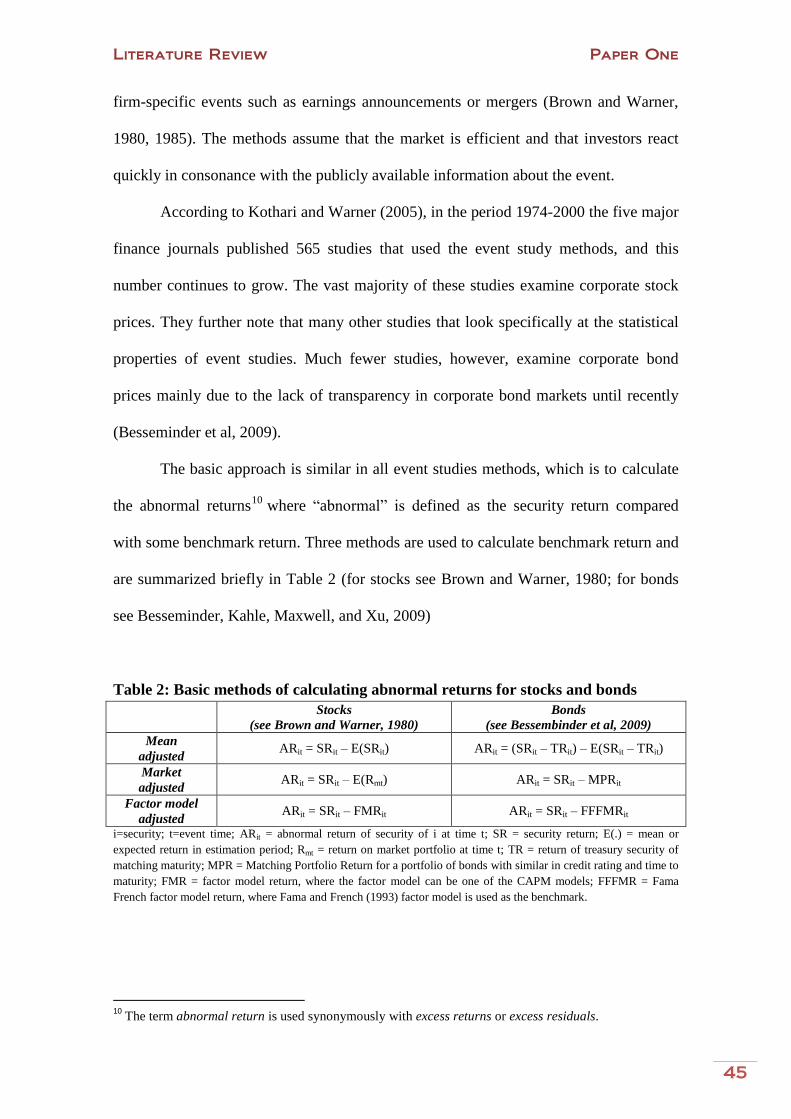
Literature Review Paper One
45
firm-specific events such as earnings announcements or mergers (Brown and Warner,
1980, 1985). The methods assume that the market is efficient and that investors react
quickly in consonance with the publicly available information about the event.
According to Kothari and Warner (2005), in the period 1974-2000 the five major
finance journals published 565 studies that used the event study methods, and this
number continues to grow. The vast majority of these studies examine corporate stock
prices. They further note that many other studies that look specifically at the statistical
properties of event studies. Much fewer studies, however, examine corporate bond
prices mainly due to the lack of transparency in corporate bond markets until recently
(Besseminder et al, 2009).
The basic approach is similar in all event studies methods, which is to calculate
the abnormal returns10
where “abnormal” is defined as the security return compared
with some benchmark return. Three methods are used to calculate benchmark return and
are summarized briefly in Table 2 (for stocks see Brown and Warner, 1980; for bonds
see Besseminder, Kahle, Maxwell, and Xu, 2009)
Table 2: Basic methods of calculating abnormal returns for stocks and bonds
Stocks
(see Brown and Warner, 1980)
Bonds
(see Bessembinder et al, 2009)
Mean
adjusted ARit = SRit – E(SRit) ARit = (SRit – TRit) – E(SRit – TRit)
Market
adjusted ARit = SRit – E(Rmt) ARit = SRit – MPRit
Factor model
adjusted ARit = SRit – FMRit ARit = SRit – FFFMRit
i=security; t=event time; ARit = abnormal return of security of i at time t; SR = security return; E(.) = mean or
expected return in estimation period; Rmt = return on market portfolio at time t; TR = return of treasury security of
matching maturity; MPR = Matching Portfolio Return for a portfolio of bonds with similar in credit rating and time to
maturity; FMR = factor model return, where the factor model can be one of the CAPM models; FFFMR = Fama
French factor model return, where Fama and French (1993) factor model is used as the benchmark.
10
The term abnormal return is used synonymously with excess returns or excess residuals.

Literature Review Paper One
46
The main disadvantage of the event study method is that it is only valid for
short-term security performance. Improvements have been made to the event study
methods for long-term horizons, but serious limitations still exist (see Kothari and
Warner, 2005). A more thorough review of the event study method used in the finance
and accounting literature can be found in Corrado (2011).
4. A REVIEW STUDIES OF STRATEGIC ALLIANCE VALUE CREATION
There are many studies in both the finance and strategy literatures that examine the
value creation effects of strategic alliance formation. The vast majority use the event
study methodology to measure the short-term market reaction of announcements of
alliances. In fact, in my review of the empirical literature, use of any other method was
more the exception than the rule.
Table 3a: Selected key studies on the value creation of strategic alliances Researchers Sample
Period
Sample Event
window
* = AR (day 0) /
** = CAR (over event window) McConnell and
Nantell (1985)
1972 –
1979
136 domestic US joint ventures
(in various industries: real estate
development, nuclear power, coal
mining, petrochemical, satellite
communication, others)
2 days
(-1 / 0)
*0.73% all joint ventures
*1.10% smaller partner
*0.63% larger partner
Dollar value gains smaller/ larger
partner were $4.5m / $6.6m
Chan, Kensinger,
Keown, and
Martin (1997)
1983 –
1992
345 alliances
114 all public partners
231 only one public partner
(involving 460 firms, with 394 in
hi-tech industries and 66 in low-
tech industries)
26 days
(-20 / +5)
*0.64% all alliances
*2.22% smaller partner
*0.19% larger partner
Dollar value gains: Smaller/larger
partner were $8.9m / $8.1m
Das, Sen, and
Sengupta (1998)
1987 –
1991
119 US-Japanese alliances:
49 technology alliances
70 marketing alliances
7 days
(-3 / +3)
**0.20% all alliances
**1.6% technology alliances
**-0.8% marketing alliances
Anand and
Khanna (2000)
1990 –
1993
1576 alliances:
870 joint ventures
1106 licensing agreements
12 days
(-10 / +1)
*0.67% / **1.82% JVs
*1.42% / **3.06% Licensing
Dollar value gains: JV / licensing
deals were $44.1m / $20.4m
Kale, Dyer, and
Singh (2002)
Kale, Dyer, and
Singh (2001)
1993 –
1997
1572 alliances reported by 78
companies with more than $500m
in 1997 in whose industries
alliances are generally considered
an important part of firm strategy
(e.g. computers, telecomm.,
pharmaceuticals, chemicals,
electronics, and services.)
14 days
(-10 / +3)
*0.84% all alliances
*1.35% with alliance function
*0.18% without alliance function
Dollar value gains: all/ with alliance
function / without alliance function
were $58.3m / $75.1m / $20.2m
Reuer, Park, and
Zollo (2002)
1995 -
1997
1318 international joint ventures 3 days
(-1 / +1)
**-1.83% all joint ventures

Literature Review Paper One
47
Table 3b: Other studies on the value creation of strategic alliances
Koh and Venkatraman (1991) – study joint venture announcements and find they are in general value creating
Chung, Koford, and Lee (1993) – study international joint ventures and find a strong negative effect on value creation
Mohanram and Nanda (1996) – find value creation at the parent-level but not at the firm-level
Johnson and Houston (2000) – study the motives of joint ventures and find asymmetries in partners’ value creation
Gupta and Misra (2000) – study effect of experience in international joint ventures and find it value creating for partners
Brooke and Oliver (2005) – study the source of gains for strategic alliances
Mantecon and Chatfield (2007) – compare value creation in short term market reaction with assets sales of terminating JVs
Kumar (2007; 2010a) – find asymmetric gains for the share holders of parents of joint venture partners.
Bösecke (2009) – study value creation in small European utilities and find significantly positive returns.
Keasler and Denning (2009) – large sample study confirms that strategic alliances on average create value
Gulati, Lavie, and Singh (2009) – study the effect of partner-specific experience on repeated alliances and find it significant
Sánchez-Lorda and García-Canal (2012) - study how equity investors value prior experience in alliances and acquisitions
Amici et al (2013) – study US and European banking sector alliances and find they create value for non-bank partners
Tables 3a and 3b provide summaries of a partial list this empirical literature. As
noted by Kothari and Warner (2005), more than 500 papers in the top five finance
journals alone have used the event study method.
Some conclusions that can be drawn from analyzing Tables 3a and 3b include
the following:
The most prevalent method for studying value creation from strategic alliance
formation has been the event study method.
Strategic alliances in general create value for their stock holders in the short-
term.
There are studies that show strong negative effects on value creation, although
they are in the minority. These studies are of international joint ventures (Reuer,
Park, and Zollo, 2002; Chung, Koford, and Lee, 1993)
There are no event studies that examine the effect of strategic alliance formation
on corporate bonds.
Literature Review Paper One
48
5. RESEARCH GAPS AND AGENDA
After having reviewed the relevant parts of the literature, I identify below two
research gaps that form my research agenda. As I have described in greater detail in the
Introduction to this dissertation, the agenda aims at contributing to both finance and
strategy with the intention of integrating these fields while also respecting their proper
research traditions. This is not an easy task. I have thus taken a conservative approach
which is to give a distinct “flavor” to each gap. Gap 1 has a notable strategy flavor and
into which I subdivide in two parts: Gap 1a forms the focus of Paper Two of this
dissertation and Gap 1b is an extension for future research. Gap 2 takes on a finance
flavor and into which I also divide in two parts: Gap 2a is the focus of Paper Three,
while Gap 2b is intended for future research work.
5.1 Gap 1a: Alliance experience effects on acquisition performance (Paper Two)
A great portion of the research that lies at the crossroad between strategic
alliances and organizational learning focus on the performance of the focal
organizations of the alliance in activities related to alliancing. That is, how a focal
alliance affects the performance of a focal firm (e.g. Anand and Khanna, 2000; Kale,
Dyer, and Singh, 2002), or performance of the focal alliance itself (e.g. Zollo, Reuer,
and Singh, 2002; Hoang and Rothaermel, 2005), or the performance of the alliance
portfolio in which the focal alliance is embedded (e.g. Lavie, 2006, 2007; Wassmer and
Dussauge, 2012).
A new and growing stream of research concerns how strategic alliances and
what firms learn from them affect other activities they do that are not directly related to
alliancing, for example, acquisitions. As firms view both alliances and acquisitions as
strategically alternative organizational forms (Wang and Zajac, 2007; Dyer, Kale, and

Literature Review Paper One
49
Singh, 2004), the organizational routines put in place and capabilities gained from
engaging in the activities of one organizational form may be transferred to the other.
This raises an interesting set of questions that would be of interest to both
scholars and practioners in the areas of organizational learning and financial valuation,
such as:
Does transferring experience from one organizational form to another have a
positive or negative effect on performance? i.e., does alliance experience positively
or negatively affect acquisition performance, and vice versa?
Is the transfer of experience and its affect on performance a bilateral transfer? i.e.,
does alliance experience have the same effect on acquisition performance as
acquisition experience has on alliance performance?
By what mechanism does the transfer of experience occur? Is it just one mechanism
or are there multiple transfer mechanisms?
Does the capability that firms develop to transfer experience from one
organizational form explain the performance heterogeneity between similar firms?
Paper Two of this dissertation addresses some of these questions.
5.2 Gap 1b: Strategic alliances, absorptive capacity, and acquisition performance
Research Gap 1a identified above is a growing stream of research that has a dual
focus on alliances and acquisitions. In support of conducting more research of this type,
Shi, Sun, and Prescott (2012: 195) note the following:
Given the fact that acquisition and alliance are two different yet complementary
means of corporate strategy, there are surprisingly very few studies that consider
both alliance and acquisition simultaneously (n = 6). This seems to be in contrast to
business reality, where firms engage in acquisition and alliance initiatives
simultaneously to address different resource or organizational needs.

Literature Review Paper One
50
While Paper Two showed that firms learn to develop cooperative capabilities
that can be transferred to acquisitions, an interesting extension is how firms learn to
develop absorptive capacity through their alliance experience that positively affects
acquisition performance. Absorptive capacity is defined as a “dynamic capability
pertaining to knowledge creation and utilization that enhances a firm's ability to gain
and sustain a competitive advantage” (Zahra and George, 2002: 185).
The research idea proposed here is different to Wang and Zajac (2007) or
Villalonga and McGahan (2005) which look at the complementarity of alternative
governance forms. Instead, the research into this gap should endeavor to answer
questions about transferability such as:
Do firms deliberately engage in alliances with the intent of developing
absorptive capacity in the industry of the alliance so that they can transfer what
they learn to make acquisitions in that industry?
Under what circumstances does the development of absorptive capacity in
alliances lead to a more favorable transfer to acquisitions?
Is the ability to transfer alliance experience to acquisitions a sustainable
competitive advantage over industry rivals? i.e., are these firms more successful
than their peers who have not developed such prior absorptive capacity through
their alliances?
5.3 Gap 2a: Do strategic alliances create value for bond investors? (Paper Three)
Almost all the event studies that have examined the effect of alliance
announcements on firm value have only examined the effect on stock holders’ wealth.
That no published study has examined the effect of alliances on bond holder wealth is
indeed surprising. Especially given that bond holders are major investors in the firm,

Literature Review Paper One
51
and that the corporate bond market is three times the size of corporate equities market in
terms of outstanding issues (Bessembinder and Maxwell, 2008).
In contributing to the literature to fill this gap, the research work should
endeavor to answer questions such as the following:
Do bond holders benefit from the formation of strategic alliances as do stock
holders?
If they do, is it because of a transfer of wealth from other (non-bond) investors
of the firm? What about transfer of wealth from the partner firm?
If indeed corporate bonds are positively affected by strategic alliance formation,
how is this effect explained? Since corporate bonds are senior to corporate
equities in case of bankruptcy, the theoretical mechanism by which corporate
bond values are affected by strategic alliance formation should be different from
that of equities.
Are there certain situations in which bond holders are more affected than in
other situations?
Does organizational learning and alliance capability have a role in determining
the value of debt?
Paper Three aims to fill this gap in the literature by answering some of the questions
raised here.
5.4 Gap 2b: Strategic alliances, real options, and firm capital structure
When Myers (1977) first coined the term real options, he used it to explain a
theory of corporate borrowing that has come to be known as the trade-off theory of firm
capital structure (Brealey et al, 2008: 504). He argues that the value of a firm equals the
Literature Review Paper One
52
value of the firm’s assets-in-place (AiP) and growth options (GO). The value of the firm
is also the market value of debt and equity, hence equation (5):
D + E = VAiP + VGO (5)
He further argues that if the firm is already levered and issues more (risky) debt
when it is already cash-constrained, a suboptimal future investment strategy is induced
that reduces the present value of the firm. The sub-optimality arises when the firm in
order to meet its increased debt obligations is forced to let expire unexercised some of
its valuable growth options since exercising them means further investment and more
cash constraints. Foreseeing this ex post abandonment of grow options, current stock
holder wealth is reduced (i.e. to balance equation (5)). This explains to some extent,
argues Myers, why firms do not borrow excessively and that there is an optimal capital
structure that is determined by a trade-off between the tax benefits of debt and the
opportunity cost due to lost growth options.
If strategic alliance formations do affect the value of corporate bonds, as Paper
Three concludes, then there will be a direct effect on the total value of the firm and
hence on the firm’s capital structure. Research questions that arise as a consequence of
this include:
If debt affects capital structure of firms that form alliances, is the source of
change in firm value and hence capital structure due only to changes in the value
of growth options (VGO) or is there also a role for changes in the value of assets
in place (VAiP)? What effect do the assets that are shared in the alliance have on
each of these values?
Illustrating with the example of Merck, Brealey et al (2008) ask how and why
some successful firms “survive and thrive at low debt ratios” (p. 500). Can the

Literature Review Paper One
53
growth options that are associated with alliances in technology intense industries
such as biotechnology and pharmaceuticals help explain this capital structure
question?
When should these technology firms that frequently engage in alliances start to
issue debt?
Some of these questions are further developed at the end of Paper Three and will form
the basis of on-going research.
6. CONCLUSION
In this literature review I highlighted relevant theories and methods in the
strategy and finance literature and applied them to help develop an understanding of
strategic alliances from an organizational learning and valuation point of view. I then
identified several research gaps for further study, two of which form the focus of Paper
Two and Paper Three respectively for this doctoral dissertation.

Literature Review Paper One
54
7. REFERENCES
Adegbesan, J. A., & Higgins, M. J. 2011. The intra-alliance division of value created through
collaboration. Strategic Management Journal, 32(2): 187-211.
Adegbesan, J. A. 2009. On the origins of competitive advantage: Strategic factor markets and
heterogeneous resource complementarity. Academy of Management Review, 34(3): 463-475.
Agarwal, R., Anand, J., & Croson, R. 2006. Are there benefits from engaging in an alliance with a firm
prior to its acquisition? In A. Ariño & J. J. Reuer (Ed.), Strategic alliances: Governance and
contracts. New York: Palgrave Macmillan Press.
Ahuja, G. 2000. Collaboration networks, structural holes, and innovation: A longitudinal study.
Administrative Science Quarterly, 45(3): 425-455.
Ahuja, G., Polidoro Jr., F., & Mitchell, W. 2009. Structural homophily or social asymmetry? the
formation of alliances by poorly embedded firms. Strategic Management Journal, 30(9): 941-
958.
Almeida, P., Song, J., & Grant, R. M. 2002. Are firms superior to alliances and markets? an empirical test
of cross-border knowledge building. Organization Science, 13(2): 147-161.
Amici, A., Fiordelisi, F., Masala, F., Ricci, O., & Sist, F. 2013. Value creation in banking through
strategic alliances and joint ventures. Journal of Banking & Finance, 37(5): 1386-1396.
Amit, R., & Schoemaker, P. J. H. 1993. Strategic assets and organizational rent. Strategic Management
Journal, 14(1): 33-46.
Amram, M., & Kulatilaka, N. 1999. Real options: Managing strategic investment in an uncertain
world. Boston MA: Harvard Business School Press.
Anand, B. N., & Khanna, T. 2000. Do firms learn to create value? the case of alliances. Strategic
Management Journal, 21(3, Special Issue: Strategic Networks): 295-315.
Ariño, A., & Ring, P. S. 2010. The role of fairness in alliance formation Strategic Management Journal.
Ariño, A., & Torre, J. d. l. 1998. Learning from failure: Towards an evolutionary model of collaborative
ventures. Organization Science, 9(3, Special Issue: Managing Partnerships and Strategic
Alliances): 306-325.
Bain, J. S. 1950. Workable competition in oligopoly: Theoretical considerations and some empirical
evidence. The American Economic Review, 40(2): 35-47.
Bain, J. S. 1956. Barriers to new competition. Cambridge, MA: Harvard University Press.
Bamford, J., Gomes-Casseres, B., & Robinson, M. 2004. Mastering alliance strategies. San Francisco:
Jossey-Bass.
Barney, J. B. 1986. Strategic factor markets: Expectations, luck, and business strategy. Management
science, 32(10): 1231-1241.
Barney, J. 1991. Firm resources and sustained competitive advantage. Journal of Management, 17(1):
99.
Berg, S. V., Duncan, J., & Friedman, P. 1982. Joint venture strategies and corporate innovation
Oelgeschlager, Gunn & Hain Cambridge.
Bessembinder, H., Kahle, K. M., Maxwell, W. F., & Xu, D. 2009. Measuring abnormal bond performance
Review of Financial Studies, 22(10): 4219-4258.
Bessembinder, H., & Maxwell, W. 2008. Markets: Transparency and the corporate bond market. The
Journal of Economic Perspectives, 22(2): 217-234.
Black, F., & Myron Scholes. 1973. The pricing of options and corporate liabilities. Journal of Political
Economy, 81(3): 637-654.

Literature Review Paper One
55
Bleeke, J., & Ernst, D. 1993. Collaborating to compete: Using strategic alliances and acquisitions in the
global marketplace. New York: John Wiley & Sons Inc.
Bösecke, K.2009. Value creation in mergers, acquisitions, and alliances (1st ed.). Wiesbaden: Gabler.
Bowman, E. H., & Hurry, D. 1993. Strategy through the option lens: An integrated view of resource
investments and the incremental-choice process. Academy of management review: 760-782.
Bowman, E. H., & Moskowitz, G. T. 2001. Real options analysis and strategic decision making.
Organization Science, 12(6): 772-777.
Brealey, R., Myers, S., & Allen, F. 2008. Principles of corporate finance Boston: McGraw-Hill/Irwin,
2008; 9th ed.
Bresman, H., Birkinshaw, J., & Nobel, R. 1999. Knowledge transfer in international acquisitions. Journal
of International Business Studies: 439-462.
Brooke, J., & Oliver, B. 2005. The source of abnormal returns from strategic alliance announcements.
Pacific-Basin Finance Journal, 13(2): 145-161.
Brown, S. J., & Warner, J. B. 1980. Measuring security price performance. Journal of Financial
Economics, 8(3): 205-258.
Brown, S. J., & Warner, J. B. 1985. Using daily stock returns: The case of event studies. Journal of
Financial Economics, 14(1): 3-31.
Caves, R. E., & Porter, M. E. 1977. From entry barriers to mobility barriers: Conjectural decisions and
contrived deterrence to new competition. The Quarterly Journal of Economics: 241-261.
Caves, R. E., & Porter, M. E. 1978. Market structure, oligopoly, and stability of market shares. The
Journal of Industrial Economics, 26(4): 289-313.
Chan, S. H., Kensinger, J. W., Keown, A. J., & Martin, J. D. 1997. Do strategic alliances create value?
Journal of Financial Economics, 46(2): 199-221.
Chi, T. 2000. Option to acquire or divest a joint venture. Strategic Management Journal, 21(6): 665-687.
Child, J., & Faulkner, D. 1998. Strategies of cooperation: Managing alliances, networks, and joint
ventures. Oxford: Oxford University Press.
Chung, I. Y., Koford, K. J., & Lee, I. 1993. Stock market views of corporate multinationalism: Some
evidence from announcements of international joint ventures. The Quarterly Review of
Economics and Finance, 33(3): 275-293.
Coase, R. H. (1937) 1952. The nature of the firm. In G. J. Stigler & K. E. Boulding (Ed.), Readings in
price theory: 386-405. Homewood, Ill.: Irwin.
Cohen, W. M., & Levinthal, D. A. 1990. Absorptive capacity: A new perspective on learning and
innovation. Administrative Science Quarterly, 35(1, Special Issue: Technology, Organizations,
and Innovation): 128-152.
Collis, D. J., & Montgomery, C. A. 1998. Creating corporate advantage. Harvard business review, 76(3):
70-83.
Contractor, F. J., & Lorange, P. 1988. Cooperative strategies in international business: Joint ventures
and technology, partnerships between firms: [papers presented in october 1986 at a
colloquium organized by the graduate school of management]. Lexington, MA: Lexington
Books.
Copeland, T., Koller, T., & Murrin, J. 2000. Valuation, measuring and managing the value of
companies, (3rd ed.). New Jersey: John Wiley & Sons Inc.
Corrado, C. J. 2011. Event studies: A methodology review. Accounting & Finance, 51(1): 207-234.
Cyert, R. M., & March, J. G. 1963. A behavioral theory of the firm. Englewood Cliffs, NJ: Prentice-Hall.
Damodaran, A. 2005. The value of synergy (Working Paper ed.). New York: Stern Business School.

Literature Review Paper One
56
Damodaran, A. 2008. Strategic risk taking: A framework for risk management. Upper Saddle River, NJ:
Prentice Hall.
Damodaran, A. 2012. Investment valuation: Tools and techniques for determining the value of any
asset Wiley.
Das, T. K., & Teng, B. 2002. The dynamics of alliance conditions in the alliance development process.
Journal of Management Studies, 39(5): 725-746.
Das, S., Sen, P. K., & Sengupta, S. 1998. Impact of strategic alliances on firm valuation. The Academy of
Management Journal, 41(1): 27-41.
Das, T. K., & Teng, B. 2000a. Instabilities of strategic alliances: An internal tensions perspective.
Organization Science, 11(1): 77-101.
Das, T. K., & Teng, B. 2000b. A resource-based theory of strategic alliances. Journal of Management,
26(1): 31-61.
Dierickx, I., & Cool, K. 1989. Asset stock accumulation and sustainability of competitive advantage.
Management science, 35(12): 1504-1511.
Doz, Y. L. 1996. The evolution of cooperation in strategic alliances: Initial conditions or learning
processes? Strategic Management Journal, 17(, Special Issue: Evolutionary Perspectives on
Strategy): 55-83.
Dussauge, P., Garrette, B., & Mitchell, W. 2000. Learning from competing partners: Outcomes and
durations of scale and link alliances in europe, north america and asia. Strategic Management
Journal, 21(2): 99-126.
Dyer, J. H., & Hatch, N. W. 2006. Relation-specific capabilities and barriers to knowledge transfers:
Creating advantage through network relationships. Strategic Management Journal, 27(8): 701-
719.
Dyer, J. H., Kale, P., & Singh, H. 2004. When to ally & when to acquire. (cover story). Harvard business
review, 82(7): 108-115.
Dyer, J. H., & Singh, H. 1998. The relational view: Cooperative strategy and sources of
interorganizational competitive advantage. The Academy of Management Review, 23(4): 660-
679.
Dyer, J. H., Singh, H., & Kale, P. 2008. Splitting the pie: Rent distribution in alliances and networks.
Managerial & Decision Economics, 29(2): 137-148.
Eisenhardt, K. M., & Martin, J. A. 2000. Dynamic capabilities: What are they? Strategic Management
Journal, 21(10/11, Special Issue: The Evolution of Firm Capabilities): 1105-1121.
Eisenhardt, K. M., & Schoonhoven, C. B. 1996. Resource-based view of strategic alliance formation:
Strategic and social effects in entrepreneurial firms. Organization Science, 7(2): 136-150.
Ernst, D. 2004. Envisioning collaboration. In J. Bamford, B. Gomes-Casseres, & M. Robinson (Ed.),
Mastering alliance strategies. San Francisco: Jossey-Bass.
Fang, E. 2011. The effect of strategic alliance knowledge complementarity on new product
innovativeness in china. Organization Science, 22(1): 158-172.
Fernandez, P. 2002. Valuation methods and shareholder value creation. California: Academic Press.
Fernandez, P. 2005a. Financial literature about discounted cash flow valuation (Working Paper No.
606 ed.). Spain: IESE Business School.
Fernandez, P. 2005b. Reply to comment on “The value of tax shields is NOT equal to the present value of
tax shields”. The Quarterly Review of Economics and Finance, 45(1): 188-192.
Fernandez, P. 2004. The value of tax shields is NOT equal to the present value of tax shields. Journal of
Financial Economics, 73(1): 145-165.
Fernandez, P., & Bilan, A. 2007. 110 common errors in company valuations (Working Paper No. 714
ed.). Spain: IESE Business School.

Literature Review Paper One
57
Fernandez, P. 2009. 100 questions in finance (Working Paper WP-817 ed.). Spain: IESE Business
School.
Fieten, P., Kruschwitz, L., Laitenberger, J., Löffler, A., Tham, J., Vélez-Pareja, I., & Wonder, N. 2005.
Comment on “The value of tax shields is NOT equal to the present value of tax shields”. The
Quarterly Review of Economics and Finance, 45(1): 184-187.
Folta, T. B., & Miller, K. D. 2002. Real options in equity partnerships. Strategic Management Journal,
23(1): 77-88.
Garc a-Canal, E., Duarte, C. L., Criado, J. R., & Llaneza, A. V. 2002. Accelerating international
expansion through global alliances: A typology of cooperative strategies. Journal of World
Business, 37(2): 91-107.
Goerzen, A. 2007. Alliance networks and firm performance: The impact of repeated partnerships.
Strategic Management Journal, 28(5): 487-509.
Gomes-Casseres, B., Hagedoorn, J., & Jaffe, A. B. 2006. Do alliances promote knowledge flows?
Journal of Financial Economics, 80(1): 5-33.
Grant, R. M. 1991. The resource-based perspective of competitive advantage. California Management
Review, 33: 114-135.
Grant, R. M. 1996a. Prospering in dynamically-competitive environments: Organizational capability as
knowledge integration. Organization Science, 7(4): 375-387.
Grant, R. M. 1996b. Toward a knowledge-based theory of the firm. Strategic Management Journal, 17(,
Special Issue: Knowledge and the Firm): 109-122.
Grant, R. M., & Baden-Fuller, C. 1995. A knowledge-based theory of inter-firm collaboration Academy
of Management Best Paper Proceedings, 17-21.
Grant, R. M., & Baden-Fuller, C. 2004. A knowledge accessing theory of strategic alliances. Journal of
Management Studies, 41(1): 61-84.
Gulati, R. 1995. Does familiarity breed trust? the implications of repeated ties for contractual choice in
alliances. The Academy of Management Journal, 38(1): 85-112.
Gulati, R. 1998. Alliances and networks. Strategic Management Journal, 19(4, Special Issue: Editor's
Choice): pp. 293-317.
Gulati, R., Lavie, D., & Singh, H. 2009. The nature of partnering experience and the gains from alliances
Strategic Management Journal, 30(11): 1213 -1233.
Gupta, A., & Misra, L. 2000. The value of experiential learning by organizations: Evidence from
international joint ventures. Journal of Financial Research, 23(1): 77-102.
Hamel, G. 1991. Competition for competence and inter-partner learning within international strategic
alliances. Strategic Management Journal, 12(, Special Issue: Global Strategy): 83-103.
Harrigan, K. R. 1985. Strategies for joint ventures. Lexington, MA: Lexington Books.
Heimeriks, K. H., & Duysters, G. 2007. Alliance capability as a mediator between experience and
alliance performance: An empirical investigation into the alliance capability development
process*. Journal of Management Studies, 44(1): 25-49.
Helfat, C. E., Finkelstein, S., Mitchell, W., Peteraf, M. A., Singh, H., Teece, D. J., & Winter, S. G. 2007.
Dynamic capabilities: Understanding strategic change in organizations. Malden, Mass.;
Oxford: Blackwell.
Hennart, J. 1988. A transaction costs theory of equity joint ventures. Strategic Management Journal,
9(4): 361-374.
Hitt, M. A., Dacin, M. T., Levitas, E., Arregle, J., & Borza, A. 2000. Partner selection in emerging and
developed market contexts: Resource-based and organizational learning perspectives. Academy
of Management Journal, 43(3): 449-467.

Literature Review Paper One
58
Hoang, H., & Rothaermel, F. T. 2005. The effect of general and partner-specific alliance experience on
joint R&D project performance. Academy of Management Journal, 48(2): 332-345.
Hull, J. 2000. Options, futures, and other derivatives (4th ed.). Upper Saddle River; London: Prentice-
Hall International.
Inkpen, A. 1998a. Learning, knowledge acquisition, and strategic alliances. European Management
Journal, 16(2): 223-229.
Inkpen, A. C. 1998b. Learning and knowledge acquisition through international strategic alliances. The
Academy of Management Executive (1993), 12(4, Competitiveness and Global Leadership in
the 21st Century): 69-80.
Inkpen, A. C. 2000. Learning through joint ventures: A framework of knowledge acquisition. Journal of
Management Studies, 37(7): 1019-1043.
Inkpen, A. C., & Beamish, P. W. 1997. Knowledge, bargaining power, and the instability of international
joint ventures. The Academy of Management Review, 22(1): 177-202.
Ireland, R. D., Hitt, M. A., & Vaidyanath, D. 2002. Alliance management as a source of competitive
advantage. Journal of Management, 28(3): 413-446.
Johnson, S. A., & Houston, M. B. 2000. A reexamination of the motives and gains in joint ventures.
Journal of Financial & Quantitative Analysis, 35(1): 67-85.
Kale, P., Singh, H., & Bell, J. 2009. Relating well: Building capabilities for sustaining alliance networks.
In P. Kleindorfer & Y. Wind (Ed.), The network challenge: Strategies for managing the new
interlinked enterprise. London: Pearson Press.
Kale, P., Dyer, J. H., & Singh, H. 2002. Alliance capability, stock market response, and long-term
alliance success: The role of the alliance function. Strategic Management Journal, 23(8): 747-
767.
Kale, P., Dyer, J., & Singh, H. 2001. Value creation and success in strategic alliances:: Alliancing skills
and the role of alliance structure and systems. European Management Journal, 19(5): 463-471.
Kale, P., & Singh, H. 2007. Building firm capabilities through learning: The role of the alliance learning
process in alliance capability and firm-level alliance success. Strategic Management Journal,
28(10): 981-1000.
Kale, P., & Singh, H. 2009. Managing strategic alliances: What do we know now, and where do we go
from here? Academy of Management Perspectives, 23(3): 45-62.
Keasler, T. R., & Denning, K. C. 2009. A re-examination of corporate strategic alliances: New market
responses. Quarterly Journal of Finance and Accounting: 21-47.
Kester, W. C. 1984. Today options for tomorrow's growth. Harvard business review, 62(2): 153-160.
Kogut, B. 1988. Joint ventures: Theoretical and empirical perspectives. Strategic Management Journal,
9(4): 319-332.
Kogut, B. 1989. The stability of joint ventures: Reciprocity and competitive rivalry. The Journal of
Industrial Economics, 38(2): 183-198.
Kogut, B. 1991. Joint ventures and the option to expand and acquire. Management Science, 37(1): 19-33.
Kogut, B., & Kulatilaka, N. 2001. Capabilities as real options. Organization Science, 12(6): 744-758.
Kogut, B., & Zander, U. 1992. Knowledge of the firm, combinative capabilities, and the replication of
technology. Organization Science, 3(3, Focused Issue: Management of Technology): 383-397.
Kogut, B., & Zander, U. 1993. Knowledge of the firm and the evolutionary theory of the multinational
corporation. Journal of International Business Studies, 24(4): 625-645.
Koh, J., & Venkatraman, N. 1991. Joint venture formations and stock market reactions: An assessment in
the information technology sector. The Academy of Management Journal, 34(4): 869-892.

Literature Review Paper One
59
Kothari, S. P., & Warner, J. B. 2005. The econometrics of event studies. In B. EckboEspen (Ed.),
Handbook of corporate finance: Empirical corporate finance (handbooks in finance series):
3-36. North-Holland: Elsevier.
Koza, M. P., & Lewin, A. Y. 1998. The co-evolution of strategic alliances. Organization Science, 9(3,
Special Issue: Managing Partnerships and Strategic Alliances): 255-264.
Krychowski, C., & Quélin, B. V. 2010. Real options and strategic investment decisions: Can they be of
use to scholars? The Academy of Management Perspectives, 24(2): 65-78.
Kumar, M. V. S. 2007. Asymmetric wealth gains in joint ventures: Theory and evidence. Finance
Research Letters, 4(1): 19-27.
Kumar, M. V. S. 2010. Differential gains between partners in joint ventures: Role of resource
appropriation and private benefits. Organization Science, 21(1): 232-248.
Lane, P. J., & Lubatkin, M. 1998. Relative absorptive capacity and interorganizational learning. Strategic
Management Journal, 19(5): 461-477.
Lavie, D. 2006. The competitive advantage of interconnected firms: An extension of the resource-based
view. Academy of Management Review, 31(3): 638-658.
Lavie, D. 2007. Alliance portfolios and firm performance: A study of value creation and appropriation in
the U.S. software industry Strategic Management Journal, 28(12): 1187-1212.
Lerner, J., & Rajan, R. 2006. NBER conference on corporate alliances. Journal of Financial Economics,
80(1): 1-3.
Lin, Z., Yang, H., & Arya, B. 2009. Alliance partners and firm performance: Resource complementarity
and status association. Strategic Management Journal, 30(9): 921-940.
Makhija, M. 2003. Comparing the resource‐based and market‐based views of the firm: Empirical
evidence from czech privatization. Strategic Management Journal, 24(5): 433-451.
Mantecon, T., & Chatfield, R. E. 2007. An analysis of the disposition of assets in a joint venture. Journal
of Banking & Finance, 31(9): 2591-2611.
Mason, E. S. 1964. Economic concentration and the monopoly problemAtheneum.
Mathews, R. D. 2006. Strategic alliances, equity stakes, and entry deterrence. Journal of Financial
Economics, 80(1): 35-79.
McConnell, J. J., & Nantell, T. J. 1985. Corporate combinations and common stock returns: The case of
joint ventures. The Journal of Finance, 40(2): 519-536.
Mitsuhashi, H., & Greve, H. R. 2009. A matching theory of alliance formation and organizational
success: Complementarity and compatibility. Academy of Management Journal, 52(5): 975-
995.
Mohanram, P., & Nanda, A. 1996. When do joint ventures create value? Academy of Management Best
Papers Proceedings: 36-40.
Mowery, D. C., Oxley, J. E., & Silverman, B. S. 1996. Strategic alliances and interfirm knowledge
transfer. Strategic Management Journal, 17(, Special Issue: Knowledge and the Firm): 77-91.
Myers, S. C. 1977. Determinants of corporate borrowing. Journal of Financial Economics, 5(2): 147-
175.
Nelson, R. R., & Winter, S. G. 1982. An evolutionary theory of economic change. Cambridge Mass.:
Harvard University Press.
Nonaka, I. 1991. The knowledge-creating company. Harvard business review, 69(6): 96-104.
Nonaka, I. 1994. A dynamic theory of organizational knowledge creation. Organization Science, 5(1):
14-37.
Parkhe, A. 1991. Interfirm diversity, organizational learning, and longevity in global strategic alliances.
Journal of International Business Studies: 579-601.
Literature Review Paper One
60
Peng, M. W. 2003. Institutional transitions and strategic choices. The Academy of Management Review:
275-296.
Peng, M. W., & Shenkar, O. 2002. Joint venture dissolution as corporate divorce. The Academy of
Management Executive (1993-2005): 92-105.
Penrose, E. T. 1959. The theory of the growth of the firm. London: Basil Blackwell.
Peteraf, M. A. 1993. The cornerstones of competitive advantage: A resource‐based view. Strategic
Management Journal, 14(3): 179-191.
Porrini, P. 2004. Can a previous alliance between an acquirer and a target affect acquisition performance?
Journal of Management, 30(4): 545-562.
Porter, M. E. 1979b. The structure within industries and companies' performance. The Review of
Economics and Statistics, 61(2): 214-227.
Porter, M. E. 1985. Competitive advantage: Creating and sustaining superior performance. New York:
Free press.
Porter, M. E. 1990. Competitive advantage of nations. New York: Free press.
Porter, M. E. 1979a. How competitive forces shape strategy. Harvard business review, 57(2): 137-145.
Prahalad, C. K., & Hamel, G. 1990. The core competence of the corporation. Harvard business review,
68(3): 79-91.
Reuer, J. J., Park, K. M., & Zollo, M. 2002. Experimental learning in international joint ventures: The
role of experience heterogeneity and venture novelty. In F. J. Contractor & P. Lorange (Ed.),
Cooperative strategies and alliances: 321-346. Amsterdam, Netherlands: Elsevier Science.
Reuer, J. J., & Ariño, A. 2007. Strategic alliance contracts: Dimensions and determinants of contractual
complexity. Strategic Management Journal, 28(3): 313-330.
Reuer, J. J., & Koza, M. P. 2000. Asymmetric information and joint venture performance: Theory and
evidence for domestic and international joint ventures. Strategic Management Journal, 21(1):
81-88.
Reuer, J. J., & Leiblein, M. J. 2000. Downside risk implications of multinationality and international joint
ventures. Academy of Management Journal, 43(2): 203-214.
Reuer, J. J., & Tong, T. W. 2010. Discovering valuable growth opportunities: An analysis of equity
alliances with IPO firms. Organization Science, 21(1): 202-215.
Robinson, D. T. 2008. Strategic alliances and the boundaries of the firm. Review of Financial Studies,
21(2): 649-681.
Rothaermel, F. T., & Boeker, W. 2008. Old technology meets new technology: Complementarities,
similarities, and alliance formation. Strategic Management Journal, 29(1): 47-77.
Rothaermel, F. T., & Deeds, D. L. 2004; 2004. Exploration and exploitation alliances in biotechnology: A
system of new product development Strategic Management Journal, 25(3): 201-221.
Sánchez–Lorda, P., & García–Canal, E. 2012. When and how previous experience affects the stock
market reaction to business combinations. European Journal of Cross-Cultural Competence
and Management, 2(3): 319-343.
Schreiner, M., Kale, P., & Corsten, D. 2009. What really is alliance management capability and how does
it impact alliance outcomes and success? Strategic Management Journal, 30(13): 1395 -1419.
Shi, W., Sun, J., & Prescott, J. E. 2012. A temporal perspective of merger and acquisition and strategic
alliance initiatives: Review and future direction Journal of Management, 38(1): 164-209.
Simonin, B. L. 1997. The importance of collaborative know-how: An empirical test of the learning
organization. The Academy of Management Journal, 40(5): pp. 1150-1174.
Stuart, T. E. 2000. Interorganizational alliances and the performance of firms: A study of growth and
innovation rates in a high-technology industry. Strategic Management Journal, 21(8): 791-811.

Literature Review Paper One
61
Teece, D. J. 1987. The competitive challenge. In D. J. Teece (Ed.), Profiting from technological
innovation: Implications for integration collaboration, licensing and public policy: 185-219.
Cambridge, MA: Ballinger.
Teece, D. J., Pisano, G., & Shuen, A. 1997. Dynamic capabilities and strategic management. Strategic
Management Journal, 18(7): 509-533.
Vanhaverbeke, W., Duysters, G., & Noorderhaven, N. 2002. External technology sourcing through
alliances or acquisitions: An analysis of the application-specific integrated circuits industry.
Organization Science, 13(6): 714-733.
Vickers, J. 1985. Pre-emptive patenting, joint ventures, and the persistence of oligopoly. International
Journal of Industrial Organization, 3(3): 261-273.
Villalonga, B., & McGahan, A. M. 2005. The choice among acquisitions, alliances, and divestitures.
Strategic Management Journal, 26(13): 1183-1208.
Wang, L., & Zajac, E. J. 2007. Alliance or acquisition? A dyadic perspective on interfirm resource
combinations. Strategic Management Journal, 28(13): 1291-1317.
Wassmer, U., & Dussauge, P. 2012. Network resource stocks and flows: How do alliance portfolios affect
the value of new alliance formations? Strategic Management Journal: 33(7): 871-883.
Wernerfelt, B. 1984. A resource-based view of the firm. Strategic Management Journal, 5(2): 171-180.
Williamson, O. E. 1979. Transaction-cost economics: The governance of contractual relations. Journal of
Law and Economics, 22(2): 233-261.
Williamson, O. E. 1981. The economics of organization: The transaction cost approach. American
journal of sociology: 548-577.
Williamson, O. E. 1991. Comparative economic organization: The analysis of discrete structural
alternatives. Administrative Science Quarterly: 269-296.
Williamson, O. E. 1975. Markets and hierarchies. New York: Free Press.
Williamson, O. E. 1985. The economic institutions of capitalism. New York: Free Press.
Yang, H., Lin, Z. (., & Lin, Y. (. 2010. A multilevel framework of firm boundaries: Firm characteristics,
dyadic differences, and network attributes. Strategic Management Journal, 31(3): 237-261.
Yin, X., & Shanley, M. 2008. Industry determinants of the "merger versus alliance" decision. Academy of
Management Review, 33(2): 473-491.
Zaheer, A., Hernandez, E., & Banerjee, S. 2010. Prior alliances with targets and acquisition performance
in knowledge-intensive industries. Organization Science, 21(5): 1072-1091.
Zahra, S. A., & George, G. 2002. Absorptive capacity: A review, reconceptualization, and extension. The
Academy of Management Review, 27(2): 185-203.
Zollo, M., & Reuer, J. J. 2010. Experience spillovers across corporate development activities.
Organization Science, 21(6): 1195-1212.
Zollo, M., Reuer, J. J., & Singh, H. 2002. Interorganizational routines and performance in strategic
alliances. Organization Science, 13(6): 701-713.
Zollo, M., & Winter, S. G. 2002. Deliberate learning and the evolution of dynamic capabilities.
Organization Science, 13(3, Knowledge, Knowing, and Organizations): 339-351.

Paper Two:
Understanding Cross-form
Transfer Effects: Alliance
Experience and Acquisition
Performance
ABSTRACT
We study the cross-form transfer effects between the alliance and acquisition
governance forms. One particular case of the cross-form (transfer) effect is how previous
alliance experiences of acquirers and targets affect acquisition performance. We extend the
literature by providing a more integrated and nuanced explanation of the cross-form effect
using two theoretical mechanisms. The first is the more familiar process similarities
mechanism which explains the cross-form effect as the extent to which alliance processes in
the same firm are transferred to acquisitions because of similarities between the processes
involved in the two governance forms. We extend the literature by enriching the explanation
of the cross-form effect with a second mechanism. The experience interactions mechanism
explains the effect as the extent to which alliance processes from different firms have mutual
influences on each other in the focal acquisition. By taking inter-firm and intra-firm
perspectives, the two mechanisms provide complementary explanations of the overall cross-
form effect and together form one integrated cross-form mechanism. Hypotheses derived
from the theoretical mechanisms are tested on a sample of 505 US acquisitions between 1988
and 1997 in the manufacturing sector. We find strong empirical support for our main
hypotheses on the cross-form mechanisms.

Cross-form effects Paper Two
63
1. INTRODUCTION
Understanding how organizational experience affects performance falls at the heart of
theories of organizational learning and strategic management (Levit and March, 1988; Kogut
and Zander, 1992; Zollo and Winter, 2002). Prior research has tended to restrict the scope of
study to the same organizational form, such as how prior acquisition experience affects
acquisition performance (Haleblian and Finkelstein, 1999; Hayward, 2002; Beckman and
Haunschild, 2002) or how prior alliance experience affects alliance performance (Zollo,
Reuer, and Singh, 2002; Hoang and Rothaermel, 2005; Sampson, 2005). Broadening the
scope of study, a new and growing area of research is the study of cross-form (transfer)
effects (e.g., Zollo and Reuer, 2010; Zaheer, Hernandez, and Banerjee, 2010; Yang, Lin, and
Peng, 2011; Agarwal, Anand, Berkovitz, and Croson, 2012), which is how experience gained
in one governance form (alliances or acquisitions) affects performance in another. Given the
relatively few studies that look simultaneously at both forms (Shi, Sun, and Prescott (2012:
195) count only six such studies), our understanding of cross-form effects is still rather
limited.
Our research general question concerns understanding the effect of cooperative
strategies learned from previous alliance experiences on focal acquisition performance. For
this study we define this effect to be the cross-form effect. More specifically, we extend the
literature by providing answers to two related sets of questions. Firstly, from an inter-firm
perspective: Are there mutually influential effects between the previous alliance experiences
of an acquirer and its target on focal acquisition performance? How are they manifested and
to what extent? And secondly from an intra-firm perspective: What influences are there from
the acquirer’s (target’s) previous alliance experiences on the performance of the focal
acquisition? How and to what extent?
Cross-form effects Paper Two
64
Our main contribution to the literature is the study of a new mechanism that explains
the cross-form effect. We call it the experience interactions mechanism because, as we shall
propose, firms with similar levels of alliance experience have mutually positive influences or
experience interactions that benefit the focal acquisition’s performance. Explaining the
mechanism in a nutshell, as a firm increases alliance experience it develops ever more
flexible alliance routines and operational language to manage its growing number of alliance
partners, i.e. alliance experience develops a firm-level alliance capability and alliancing
processes (Anand and Khanna, 2000; Kale, Dyer, and Singh, 2002; Kale and Singh, 2007).
We argue that in a focal acquisition, firms with similar levels of alliance experience will have
stronger positive mutual influences or interactions on each other’s ability to cooperate in the
acquisition compared to firms with dissimilar levels of alliance experience. In a word,
acquisition performance depends on the ability of both acquirer and target to cooperate, and
that these cooperative abilities are learned by each firm through the accumulation of alliance
experience.
As far as we are aware, there are at least two other theoretical mechanisms that have
been proposed to explain the cross-form effect. The process similarities mechanism is based
on the theory of transfer effects (see Zollo and Reuer, 2010; Finkelstein and Haleblian, 2002).
Process transfer effects are positive when two events are similar and processes learned from
and generalized in the first event and are appropriately applied in the second (Mazur, 1998).
Negative transfer effects, however, are the result of incorrect generalization or inappropriate
application of processes in the second event (Novik, 1988). We will discuss this mechanism
in further detail in the following section. The other mechanism, the prior alliance or partner-
specific alliance mechanism (see Porrini, 2004a; Zaheer et al, 2010; Al-Laham, Schweizer,
and Amburgey, 2010) argues that the cross-form effect can be explained by the existence of
one or more prior alliances between an acquirer and its target (i.e. repeated partner-specific
Cross-form effects Paper Two
65
alliances between two firms that later engage in an acquisition). We argue that this
mechanism is not sufficiently comprehensive at describing alliance experience or acquisition
activity and so is not included in this study.
The two mechanisms we study have contrasting explanations of the cross-form effect.
On the one hand, the process similarities mechanism argues that alliance processes produce a
cross-form effect to the extent that alliancing and acquisitioning activities using these
processes are similar. On the other hand, the experience interactions mechanism says that
these processes produce a cross-form effect to the extent that they have mutual influences or
interact with each other. Although the two mechanisms have two different theoretical
explanations, they are in fact complementary and can be combined into a single cross-form
mechanism because both are grounded in the same phenomenon: through alliance experience
firms develop cooperative alliancing processes that combine to affect performance in
different ways (Simonin, 1997; Zollo and Winter, 2002; Heimeriks and Duysters, 2007). By
further studying the two mechanisms from both inter-firm and intra-firm perspectives, we
develop a more nuanced and integrated explanation of the cross-form effect.
In this paper, the mechanisms are used to study a particular case of the cross-form
effect, namely how previous alliance experience affects focal acquisition performance.
However, the same mechanisms can also be used in the study of other types of focal events
involving previous alliance experience. In remainder of the paper, we derive hypotheses for
the case of alliance experience effects on acquisition performance and test them on a sample
of 505 acquisitions by publicly traded US acquirers of publicly traded US targets made
between 1988 and 1997 in which either the acquirer or target was in the manufacturing
sector. We find strong empirical support for our main hypotheses.

Cross-form effects Paper Two
66
2. THEORY AND HYPOTHESES
A central tenet of organizational learning theory concerns how firms develop routines
or processes as they gain experience (March and Simon, 1958; Levitt and March, 1988). How
routines become a source of competitive advantage is central to the concerns of strategic
management (Nelson and Winter, 1982). Routines are encoded behaviors of an organization
under familiar conditions that reflect its experience (Zollo and Winter, 2002). Because of
prior successful experience, organizations tend to repeat certain behaviors, such as engage in
alliances or acquisitions (Haleblian, Kim, and Rajagopalan, 2006; Wang and Zajac, 2007).
Good recent performance positively moderates the effect of experience reinforcing the
importance of the routines (Haleblian et al, 2006). Through experience, organizational
routines become dynamic capabilities as they are continuously renewed and adapted in
response to the changing competitive environment (Teece, Pisano, and Shuen, 1997;
Eisenhardt and Martin, 2000). By experience, a firm’s dynamic capabilities become a source
of its competitive advantage (Barney, 1991).
The literature speaks of three main types of alliance experience: general, related
industry, and prior alliance/ partner-specific (e.g. Reuer, Zollo, and Singh, 2002; Stuart,
2000; Barkema and Schijven, 2008. General alliance experience includes all alliances
regardless of the industry that the acquirer (target) has engaged in before the focal
acquisition. Related industry alliance experience refers to the alliances the acquirer (target)
has had before to the focal acquisition in industries which are similar to the industry of the
target (acquirer). Prior alliance/ partner-specific experience refers to the alliances the acquirer
has had with the target prior to a focal acquisition.
Despite favorable arguments for a cross-form mechanism that originates from prior
alliance / partner-specific experience, we do not consider such a mechanism in this study. For
example, a prior alliance between acquirer and target decreases information asymmetries

Cross-form effects Paper Two
67
prior to a focal acquisition reducing problems associated with over/ under valuations
(Vanhaverbeke, Duysters, and Noorderhaven, 2002), promotes the development of relation-
specific routines that reduce transaction costs of the acquisition (Dyer and Singh, 1998;
Hennart, 1988), and increases trust between focal firms’ managements which benefits the
post-acquisition integration process (Agarwal, Anand, and Croson, 2006). However, we
exclude such a mechanism for the following three reasons: (1) partner-specific alliance
experience acts at the dyad level to develop relation-specific routines and capabilities (Zollo
et al, 2002; Gulati, Lavie, and Singh, 2009). Because they are tacit to a particular
relationship, they are not easily transferrable to other alliances (Dyer and Singh, 1998), and
by logical extension not easily transferrable to other activities such as acquisitions; (2)
partner-specific alliances between firms which consummate in their acquisition make up only
a small fraction of acquisition activity and therefore do not represent any general trend that
firms have engaging in alliances. In prior studies, as few as only 1.3% (see Al-Laham et al,
2010) and at most a mere 8% (see Porrini, 2004a; Zaheer et al, 2010) of acquisitions involved
firms that had a prior alliance between the acquirer and target. Finally, (3) studies that have
investigated the effect of prior alliance / partner-specific alliance experience on performance
have contradictory conclusions1, which would seem to indicate some other factors external to
prior alliance / partner-specific alliance experience are at play.
We thus define the broad sense of the term “alliance experience” of a firm to mean the
combined experience it has gained from its general and related industry alliance experiences.
Alliance experience acts at the firm level and develops cooperative dynamic capabilities
required for dealing flexibly and adaptively with multiple and heterogeneous alliance partners
(Zollo et al, 2002; Gulati et al, 2009). Alliance experience, however, has been associated with
1 Studying the effects of partner-specific alliance experience on acquisition performance, Zaheer et al (2010:
1085) contradicts and even challenges the findings of Porrini (2004a), where as in studying the effects on
alliance performance, despite having very similar data sets Hoang and Rothaermel (2005) contradicts Zollo,
Reuer, and Singh (2002).
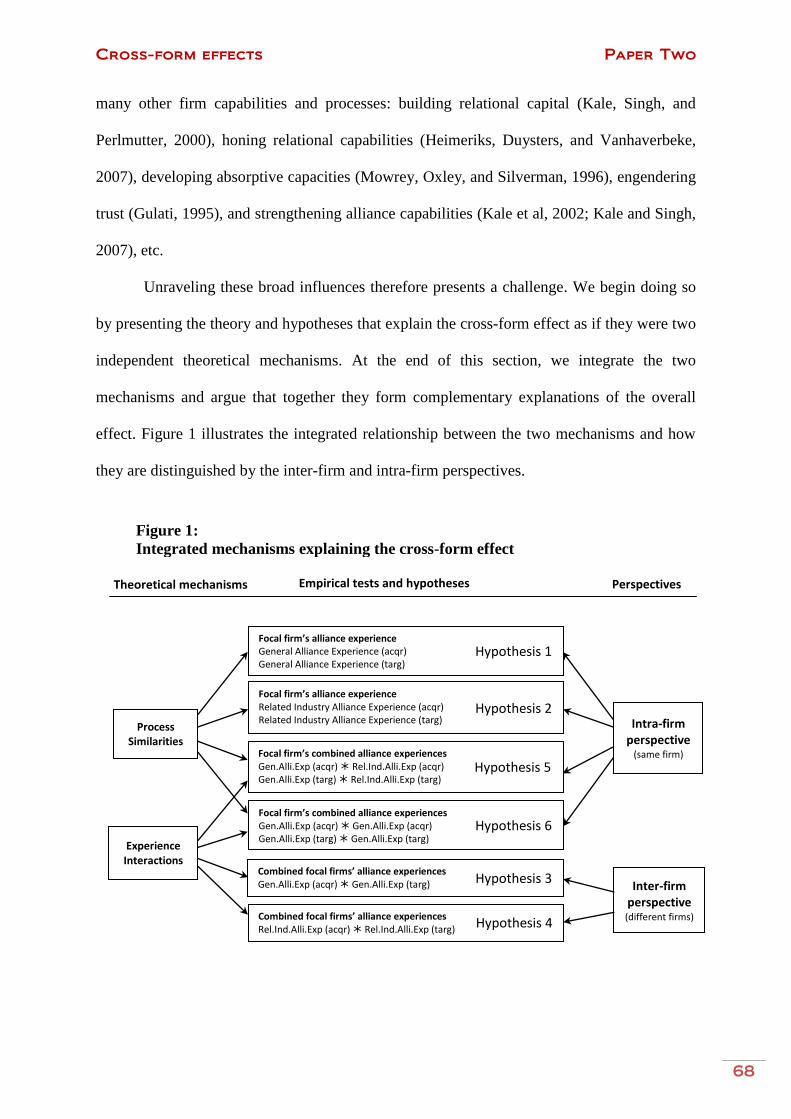
Cross-form effects Paper Two
68
many other firm capabilities and processes: building relational capital (Kale, Singh, and
Perlmutter, 2000), honing relational capabilities (Heimeriks, Duysters, and Vanhaverbeke,
2007), developing absorptive capacities (Mowrey, Oxley, and Silverman, 1996), engendering
trust (Gulati, 1995), and strengthening alliance capabilities (Kale et al, 2002; Kale and Singh,
2007), etc.
Unraveling these broad influences therefore presents a challenge. We begin doing so
by presenting the theory and hypotheses that explain the cross-form effect as if they were two
independent theoretical mechanisms. At the end of this section, we integrate the two
mechanisms and argue that together they form complementary explanations of the overall
effect. Figure 1 illustrates the integrated relationship between the two mechanisms and how
they are distinguished by the inter-firm and intra-firm perspectives.
Figure 1:
Integrated mechanisms explaining the cross-form effect
Theoretical mechanisms Empirical tests and hypotheses Perspectives
Experience Interactions
Intra-firm perspective
(same firm)
Inter-firm perspective (different firms)
Process Similarities
Focal firm’s alliance experience General Alliance Experience (acqr) General Alliance Experience (targ)
Hypothesis 1
Focal firm’s alliance experience Related Industry Alliance Experience (acqr) Related Industry Alliance Experience (targ)
Hypothesis 2
Focal firm’s combined alliance experiences Gen.Alli.Exp (acqr) Rel.Ind.Alli.Exp (acqr) Gen.Alli.Exp (targ) Rel.Ind.Alli.Exp (targ)
Hypothesis 5
Focal firm’s combined alliance experiences Gen.Alli.Exp (acqr) Gen.Alli.Exp (acqr) Gen.Alli.Exp (targ) Gen.Alli.Exp (targ)
Hypothesis 6
Combined focal firms’ alliance experiences Gen.Alli.Exp (acqr) Gen.Alli.Exp (targ) Hypothesis 3
Combined focal firms’ alliance experiences Rel.Ind.Alli.Exp (acqr) Rel.Ind.Alli.Exp (targ) Hypothesis 4

Cross-form effects Paper Two
69
2.1 Process similarities mechanism
The process similarities mechanism is inherently an intra-firm mechanism acting
within the same organizational structure and is based on the theory of transfer effects (Novik,
1988; Finkelstein and Haleblian, 2002). The theory predicts that a firm learns to generalize
correctly if the differences between past experience and a focal event are not too large.
Correctly generalized past experience that is appropriately applied to the focal event are
described as positive transfer effects (Novik, 1988). Furthermore, with more experience firms
may continue to correctly generalize even if differences between past experience and the
focal event become larger (Finkelstein and Haleblian, 2002). However, if differences are too
large and experience is low, the firm may incorrectly generalize and/ or inappropriately apply
past experience to the focal event, resulting in negative transfer effects (Finkelstein and
Haleblian, 2002; Porrini, 2004b).
Firms learn alliancing processes through experience engaging in alliances (Kale and
Singh, 2007; Anand and Khanna, 2000). The learned processes include tasks, behaviors, and
routines that together comprise the cooperative strategies or collaborative know-how that a
firm can use to improve performance in different events (Simonin, 1997), such as alliances
and acquisitions. In the process similarities mechanism, a firm first generalizes the alliance
processes it has learned and then applies the ones it finds appropriate to the focal acquisition
to the extent that previous alliance experiences are similar to the acquisition. If there are
strong similarities, the chance of correct generalization and appropriate application of the
alliances processes is high, resulting in positive cross-form effects; if the differences are
large, the chance of incorrect generalization and/ or inappropriate application is high, which
results in negative cross-form effects.
The key element of the process similarities mechanism is therefore the extent to
which the intra-firm processes in both alliances and acquisitions are similar. If the processes

Cross-form effects Paper Two
70
were predominantly similar, the net cross-form effect would be positive. Comparing the
processes in both these governance forms (Zollo and Reuer, 2010), some are similar in that
both have need for intensive cooperative negotiation processes. However, others are also
quite different. For example, while the acquisition process is highly structured and
hierarchical, the alliance process is fluid and flexible (Doz, 1996; Ariño and De La Torre,
1998) and involves co-evolution of trust, control, and learning (Inkpen and Currall, 2004).
What then is the net cross-form effect? Zollo and Reuer (2010: 1197) answer this question:
“…the experience spillover effects between alliances and acquisitions are indeterminate and
ultimately a matter to be resolved empirically… (and that) … predictions regarding the direct
linear effects of (general) alliance experience on post-acquisition performance are
ambiguous”.
It would seem that observing the cross-form effect based on process similarities will
be a data dependent phenomenon. This suggests that at the theoretical level we will not be
able to determine the net cross-form effect. This leads to our first baseline2 hypothesis:
Hypothesis 1 (Baseline). The correlation between a firm’s general alliance experience
and the performance of a focal acquisition is indeterminate.
Hypothesis 1 does not intend to suggest that there is no influence of general alliance
experience on acquisition performance. Rather that the theoretical interpretation of its
influence is not immediately obvious and caution is needed in drawing conclusions from
empirical results that may show significant effects. Theoretically, there may be indirect
influences under at least two of the following circumstances (Zollo and Reuer, 2010). Firstly,
through operating multiple alliances, firms develop the ability to work in flexible and less
2 As general and related industry alliance experiences are common measures used in prior literature, Hypotheses 1, 2 and 6
are described as “baseline” hypotheses for the sake of comparison.

Cross-form effects Paper Two
71
integrated environments (i.e. low hierarchical control). When they become an acquirer in a
focal acquisition that requires pursuing low levels of integration, a high level of alliance
experience is deemed appropriate and beneficial to the acquisition. Secondly, again through
engaging in multiple alliances, firms develop cooperative capabilities. When they become an
acquirer in an acquisition that requires a high level of relational quality, previously learned
cooperative behaviors and practices will be appropriate in making the acquisition successful.
In contrast with general alliance experience, the influence of related industry alliance
experience on acquisition performance may be clearer in two ways. Firstly, as an acquirer
(target) increases alliance experience prior to the focal acquisition in industries related to
those of its future target (acquirer), it becomes familiar with the target’s (acquirer’s)
technology and industry practices, growing in related industry alliance experience. Greater
related industry alliance experience means it is less likely that the acquirer (target) will
inappropriately apply alliance processes in the focal acquisition because of its deeper
knowledge of what is appropriate in the target’s (acquirer’s) industry. The result is less
negative transfers and a more significant cross-form effect. Secondly, the acquirer develops
increased relative absorptive capacity with respect to the target (Lane and Lubatkin, 1998).
Greater related industry absorptive capacity confers on the acquirer more valuable strategic
options (Kogut, 1991; Kogut and Kulatilaka, 2001) because it is better able to search, screen,
and value suitable targets within the related industries in which it has alliance experience.
Also, with greater related industry absorptive capacity, the acquirer can be more certain about
the size of the pool of its potential targets and about its chances of making a successful
acquisition.
Given these arguments related industry alliance experience should be a more superior
predictor of process transferability between organizational forms than general alliance
experience. Said differently, while increasing related industry alliance experience will still

Cross-form effects Paper Two
72
result in some negative transfers, they will be considerably less than those attributed to
general alliance experience. This leads to the second baseline hypothesis:
Hypothesis 2 (Baseline). A firm’s related industry alliance experience is positively
correlated with focal acquisition performance.
With alliance experience, firms often set up an alliance function, a formal/ informal
organizational structure that manages the intra-organizational alliance processes (Anand and
Khanna, 2000). The same alliance function can also develop inter-organizational alliance
processes (Zollo et al, 2002; Dyer and Singh, 1998). Inter-firm alliance processes develop as
firms gain experience engaging in multiple alliances in different industries and geographies
(Inkpen, 1998, 2000; Hoang and Rothaermel, 2005; Kale et al, 2002; Sampson, 2005). If
focal acquisition firms both have inter-firm alliance processes, then the natural question
arises as to whether the alliances processes they have developed independently of each other
can be combined to have a cross-form effect, and if so, by what mechanism?
2.2 Experience interactions mechanism
More specifically, how do a focal acquirer and its target combine their alliance
experiences to positively affect acquisition performance? We argue that the mechanism focal
firms use to achieve the cross-form effect is through experience interactions. We motivate the
explanation of the mechanism with the following intuitive example. If cooperation between
both focal firms were needed to achieve good performance, if one had strong cooperative
capabilities and the other had weak ones, the result would only be as good as the one with the
weakest and even possibly less than their combined capabilities. However, if both had strong

Cross-form effects Paper Two
73
cooperative capabilities, the result is more likely to be synergistic because of their mutual
positive influence or positive experience interactions.
Properly stated, prior to the focal acquisition both acquirer and target independently
develop cooperative alliance processes (including routines, practices, behaviors, and
operational language) to manage their multiple alliances. If both have similar maturities in
alliance experience, it is more likely that cooperation is more quickly established than if there
were large differences in their experience maturities or if both had no previous alliance
experience at all. In short we argue that synergies due to cooperation are inherently
dependent on the cooperative abilities of both focal firms. If general alliance experience is an
indicator for the alliance experience maturity of each of the focal firms, then we hypothesize
the following:
Hypothesis 3. The interaction between the general alliance experiences of an acquirer
and its target is positively correlated with focal acquisition performance.
Related industry alliance experience is another indicator of cooperative ability
although more specific to a particular industry. The related industry alliance experience of a
firm is gained from its alliances that operate in industries which are similar to those of its
future target (acquirer). Although a focal firm may be an outsider to an industry, by virtue of
its previous alliances in that industry it gains industry-specific experience and knowledge and
grows in situation similarity (see Finkelstein and Haleblian, 2002) 3
. Growing in situation
similarity means developing industry-specific absorptive capacity (Zahra and George, 2002),
deeper insight into the industry’s tacit knowledge and practices (Grant and Baden-Fuller,
3 In the context of understanding the effect of acquisition experience on acquisition performance, Finkelstein and Haleblian
(2002) referred to “situation similarity” as the similar industrial environments of an acquirer and its target. They said:
“Situation similarity may increase the potential for positive transfer (of practices and behaviors) because an acquirer from a
similar industrial environment can apply relatively more appropriate behavior to the target than could another acquirer from
a dissimilar industrial environment (p. 37-38).

Cross-form effects Paper Two
74
2004), and sensitivity to the needs of the industrial environment. In the focal acquisition, an
acquirer with a high level of related industry alliance experience with respect to its target will
have more specific knowledge and ability of how to gain the latter’s confidence and
cooperation, even more so than having a high level of general alliance experience that reflects
only a general type of cooperative ability.
If both the acquirer and target have similar levels of related industry alliance
experience, the mutual influence of their experiences will increase the likelihood of
maximizing their cooperation. Mutual situation similarity means there is a broader common
basis on which to address each other as industry peers of their respective industries. Mutual
situation similarity enables them to behave in reciprocally appropriate ways, positively
affecting the post-acquisition integration process (Finkelstein and Haleblian, 2002). In the
integration process, the acquirer can more appropriately apply industry practices that are
acceptable to the target, while the target will be less surprised by the practices being applied
to it.
If related industry alliance experience is a measure of the acquirer’s (target’s)
situation similarity with respect to the industry of its target (acquirer), then the interaction
between the acquirer’s related industry alliance experience and that of its target’s will provide
a measure for their mutual situation similarity. This suggests our next hypothesis:
Hypothesis 4. The interaction between the related industry alliance experiences of an
acquirer and its target is positively correlated with focal acquisition performance.
While the process similarities mechanism is fundamentally intra-firm, the experience
interactions mechanism is more versatile. Not only can it describe the cross-form effect from

Cross-form effects Paper Two
75
an inter-firm perspective as we have done for Hypotheses 3 and 4, but can also do so from an
intra-firm perspective.
Moreover and more importantly, we argue that first increasing alliance experience
stimulates intra-firm knowledge specialization and that then engaging in an acquisition
presents an occasion for intra-firm knowledge integration. The result of this succession of
knowledge specialization and integration is precisely the cross-form effect that we wish to
observe and can be described by the experience interactions mechanism as follows. As a firm
matures in its alliance experience and in order to optimally integrate within the firm itself
learning from its multiple alliance partners, either formal or informal alliance learning
structures are set up to manage the learning process (Anand and Khanna, 2000). This means
that while some groups of people in the firm continue to develop their specialized technical
knowledge, other groups specialize in the intra-firm dissemination of knowledge processes
and learning practices (Grant, 1996; Grant and Baden-Fuller, 2004). A focal acquisition
presents an occasion in which (at least) these two groups of people or knowledge specialists
need to cooperate in order to integrate their specialized know-how. Through formal and
informal processes of social interaction between these groups of knowledge specialists, they
cooperate and integrate their knowledge to transform it4 into new knowledge that can be
exploited (Zahra and George, 2002; Grant and Baden-Fuller, 2004). The extent to which
knowledge specialization and integration has successfully occurred within the firm can be
measured by the extent of the cross-form effect.
General alliance experience is a logical measure of the extent to which knowledge
specialists have developed knowledge dissemination practices across the firm. Related
industry alliance experience, on the other hand, provides measure of the level of specialized
technical knowledge that a firm has gained from working in industries related to the other
4 According to Zahra and George (2002: 190), the transformation of existing knowledge and creation of new knowledge
occurs through a process called bisociation, which occurs when a situation or idea is perceived in “two self-consistent but
incompatible frames of reference” (Koestler, 1966: 35).

Cross-form effects Paper Two
76
firm involved in a focal acquisition. The extent to which these two measures interact will
therefore provide an indication not only of the success of the integration of a firm’s
knowledge by its knowledge specialists, but also provide an indication of the intra-firm cross-
form effect, about which we can hypothesize as follows:
Hypothesis 5. The interaction between a firm’s general alliance experience and its
own related industry alliance experience is positively correlated with focal
acquisition performance.
2.3 Integrating into one mechanism
The description we have given so far of the cross-form effect started with the more
familiar and existing theory of the process similarities mechanism, a mechanism that
inherently takes an intra-firm perspective of a firm’s alliance processes (Hypotheses 1 and 2).
Venturing into new territory, we then introduced the experience interactions mechanism to
explain the cross-form effect from an inter-firm perspective (Hypotheses 3 and 4). However,
the experience interactions mechanism is also able to describe an important aspect of the
cross-form effect from an intra-firm perspective (Hypothesis 5). The question is therefore, are
the two mechanisms independent or can they be integrated into one?
We argue that while the path that each theoretical mechanism takes to explain the
cross-form effect is different, together they form one integrated theoretical mechanism5. We
give two reasons for this. Firstly from a theoretical point of view, both mechanisms are based
on the same phenomenon: that by increasing in alliance experience, a firm develops alliance
processes that affect performance (Simonin, 1997; Zollo and Winter, 2002; Heimeriks and
Duysters, 2007). As alliance experience has broad influences that are manifested in many and
5 One possible name for this unified mechanism is the “process similarities and interactions mechanism”.

Cross-form effects Paper Two
77
varied ways, it is not surprising that there are at least two paths or mechanisms that describe
the cross-form effect.
The second reason is some co-incidental evidence that consistently appears in
previous empirical studies (Porrini, 2004b; Zollo and Reuer, 2010; Haleblian and Finkelstein,
1999). These studies frequently discuss the mutual influence of current and earlier experience
on performance, an effect that is often tested as the “square of experience”. This literature
generally reports a non-linear U-shaped relationship between experience and performance.
The process similarities mechanism explains this U-shaped effect as follows: initial alliance
experience results in a baseline for acquisition performance; subsequent alliance experience
will result in acquisition performance that is lower than the baseline because of negative
transfers or inappropriate application of alliance processes to the focal acquisition; as alliance
experience increases, negative transfers or inappropriate application of processes will
diminish and acquisition performance will increase above the baseline.
However this same U-shaped cross-form effect can be explained using the experience
interactions mechanism: after firms engage in their initial alliance, they mark a baseline level
of acquisition performance, but with only a single alliance they will be unable to develop
significant alliance learning structures; with subsequent alliances but with still low levels of
alliance experience, firms will suffer from both diseconomies of scale (insufficient alliances
to develop alliance learning structures) and scope (more alliances with different knowledge
bases), resulting in acquisition performance below the baseline; finally, as alliance experience
increases, the diseconomies of scale and scope will start to disappear and synergies of the
alliance learning structure within the firm will improve acquisition performance beyond the
baseline.
The description of the cross-form effect using the “square of alliance experience”
provides a convenient point at which to unify and integrate the process similarities and

Cross-form effects Paper Two
78
experience interactions mechanism into one. Following the earlier literature, we finish with
another baseline hypothesis:
Hypothesis 6 (baseline). The squared interaction involving prior general alliance
experience is positively correlated with focal acquisition performance.
The theoretical arguments supporting the hypotheses we have proposed together
provide a comprehensive theory that integrates existing and new theoretical mechanisms that
explain the cross-form effect. Figure 1 illustrates this integrated view of both mechanisms.
By taking inter-firm and intra-firm perspectives with both mechanisms, we form a broader
yet more fine-tuned understanding of the cross-form effect.
3. DATA AND METHODS
3.1 Data and Sample
The data is from the Securities and Data Corporation’s (SDC) Platinum. The sample
is of acquisitions announced in the ten calendar years between 1 January 1988 and 31
December 1997 by public US acquirers of public US targets in which either the acquirer or
target were in the manufacturing sector. We initially obtain 853 completed acquisitions in
which the acquirer took a majority controlling share of the target. We also collect from the
SDC Platinum data for alliances and acquisitions that were announced by both the acquirer
and target firms in the four years preceding the focal acquisition announcement. We keep
only firms with available firm data in the Compustat database and final sample is reduced to
505 focal acquisitions.

Cross-form effects Paper Two
79
3.2 Measures
Dependent Variable. Change in Return on Assets (ROA change). A ROA-based
measure for acquisition performance provides a stable accounting measure across turbulent
times such as an acquisition (Meaks & Meaks, 1981). ROA Change is measured as the
difference between the post-acquisition ROA of the acquirer two years after the acquisition
announcement and the weighted pre-acquisition ROA of the acquirer and target one year
before the acquisition announcement, all divided by the weighted pre-acquisition ROA of the
acquirer and target. The weighted pre-acquisition ROA is the sum of the pre-acquisition
ROAs of the acquirer and target weighted by their respective assets two years before the
acquisition announcement date. Annual data from Compustat was used for the ROA
calculations with at least one calendar year before and two calendar years after the date of the
acquisition announcement. Equation (1) elaborates this definition.
(1)
Explanatory Variables. General alliance experience is calculated separately for the
acquirer and target firms. It is defined as the number of prior alliances in the previous four
years to the focal acquisition. This measure follows similar truncated experience variables
used by other researchers6. Due to the positive skewness of the alliance experience variables,
they are transformed using a monotonic logarithmic transformation following Zollo et al.
(2002)7
. Without the transformation, tests for multicollinearity identified the potential
problems with these variables.
6 For example, Porrini (2004a) uses the count of the number of alliances in the four previous years to the focal
acquisition; Anand and Khanna (2000) use the count of alliances since 1990 for their 1990 to 1993 data sample;
and Reuer, Park and Zollo (2002) use the number of alliances in the past ten years before focal alliance
announcement. 7 “New variable” = ln(1 + “old variable”)

Cross-form effects Paper Two
80
Related industry alliance experience is calculated separately for the acquirer and
target. However, for robustness testing, we have two different measures. Related Industry
Alliance (RIA) Experience is like general alliance experience in that only the four years of
alliances prior to the acquisition year are counted, and like general alliance experience, it is a
coarse-grained variable. RIA is a simple count variable of the number of previous alliances
that an acquirer (target) had whose industries overlap with those of the target (acquirer). For
example, if there is any overlap between the set of industries of one of the acquirer’s
(target’s) previous alliances and the set of industries of the target (acquirer) then RIA=1; if
there is an overlap between the industries of two of the acquirer’s (target’s) previous alliances
and the set of industries of the target (acquirer) then RIA=2; etc. The results we report use
SIC3 (3-digit Standard Industrial Codes), but for robustness checks we do the analysis also
using SIC2 and SIC4 with no qualitative change in the results. The SICs reported in SDC
Platinum database are considered highly accurate (Anand and Khanna, 2000; Schilling, 2009)
and are of fundamental importance for this study.
A second measure for related industry alliance experience is called Accumulated
Related Industry Prior Alliance (ARIPA) Experience. Making use of other alliance industry
information provided by SDC Platinum, ARIPA Experience is a finer-grained measure of the
industry relatedness that an acquirer (target) has with its target’s (acquirer’s) industry
allowing us to be more precise about the effect that we are measuring than the RIA
Experience variable. Unlike RIA which counts as one full unit of experience each acquirer
(target) alliance where there is overlap between any of the industries of an acquirer’s
(target’s) previous alliances with any of those of its target (acquirer), ARIPA only counts as
experience the fractional proportion of the overlap of industries between the previous
alliance’s industries and those of the focal firm. We capture the idea of ARIPA in Figure 2.

Cross-form effects Paper Two
81
More formally, the calculation of the acquirer ARIPA experience of the kth
focal
acquisition is the sum of the related industry prior alliance (RIPA) experiences for each of the
acquirer’s M prior alliances. RIPA, for each prior alliance i, is the ratio of the number of
SICs of prior alliance i that match the SICs of the focal target k divided by the sum of the
unique SICs of the target k and prior alliance i8. The same is used to calculate the target’s
ARIPA experience. Equations (3a) and (3b) define this measure.
(3a)
(3b)
8 For each acquirer, there are three types of SICs provided by SDC Platinum that could be compared with the
target’s SICs: the acquirer’s SICs (acquirer’s industry), the acquirer’s alliance partner’s SICs (partner’s
industry), and the SICs of the alliance’s business (alliance’s industry). We use the third type to calculate the
acquirer’s ARIPA variable. Similarly for the target ARIPA calculation.
Acquirer: Accumulated related industry
prior alliance experience
Focal acquisition Target / Acquirer
Prior alliance 1 Prior
alliance 2
Prior alliance N
Target: Accumulated related industry
prior alliance experience
Prior alliance 1
Prior alliance M
Prior alliance 2
Relatedness of industry bases between prior alliance & target (left-side) / prior alliance & acquirer (right-side) Individual Related Industry Prior Alliance (RIPA) experience Accumulated Related Industry Prior Alliance (ARIPA) experience
Figure 2:
Accumulated Related Industry Prior Alliance Experience (ARIPA)

Cross-form effects Paper Two
82
where k is the number of focal acquisitions, M and N are the number of prior alliances in the four years previous to
that of the focal acquisition for the of the acquirer and target respectively.
RIPA experience is the related industry prior alliance experience that alliance i had
with acquirer k (alliance j had with target k) prior to the focal acquisition in the industry of
target k (acquirer k) and is a continuous variable between 0 and 1. In addition, ARIPA
experience for acquirer k (target k) is the sum of all the related industry prior alliance
experiences that the M prior alliances of acquirer k (N prior alliances of target k) had in all
the industries of target k (acquirer k) and is a continuous variable between 0 and M (0 and
N).
To allay any concerns about the statistical independence between the measures for
general alliance experience and for related industry alliance experience (both RIA and
ARIPA), we follow Hoang and Rothaermel (2005) and adjust general alliance experience by
subtracting the number of prior alliances in which the acquirer (target) had a positive related
industry alliance experience (i.e. positive RIA or ARIPA). For example, if an acquirer had
five alliances prior to the focal acquisition and two of them were in the same industry as the
focal target, then the general alliance experience variable would be adjusted downward to
three (i.e. 5 minus 2).
Due to positive skewness, we also transformed the measures for related industry
alliance experience (RIA and ARIPA) using a monotonic logarithmic transformation
following Zollo et al. (2002).
Control Variables. As industries go through cycles of expansion and consolidation,
we controlled for industry change in return on assets. Relative size of focal acquisition was
measured as the ratio of the target to acquirer’s total assets prior to the focal acquisition
following Datta (1991). Relatively small acquisitions will have less material impact on
acquisition performance than larger ones, hence it is important to control for the different

Cross-form effects Paper Two
83
relative acquisition sizes. We controlled for the acquirer to target relatedness, which was
found to be positively associated with acquisition performance as situation similarity between
firms from related industries increases the potential for positive knowledge transfers
(Finkelstein and Haleblian, 2002).
Consistent with similar past studies (Ingram and Baum, 1997; Haleblian and
Finkelstein, 1999; Zollo and Reuer, 2010), we controlled for acquirer and target acquisition
experience measured as the number of past acquisitions in the four years prior to the focal
acquisition. Like Porrini (2004a), we controlled for the change in sales as an acquisition may
increase returns because of greater economies of scale in the combined firm with no increase
in the pre-acquisition combined sales. We controlled for the change in the debt to equity
ratio, but for the acquirer only. Past studies have shown that acquirer debt increases
following an acquisition (Kim and McConnell, 1977; Shrieves and Pashley, 1984; Bruner,
1988). If the deal is excessively leveraged, it may begin to affect the ability to service the
debt, lowering rates of return and acquisition performance. Method of payment was coded 1 if
the acquisition was an all cash deal or 0 if it was some other form of payment including
partially cash and stock or all stock. Acquisitions that are challenged by other bidders tend to
be done so at the cost of higher prices paid by the eventual acquirer, which in turn affects
acquisition performance. To control for this effect, we added the variable for deal challenged,
which was coded 1 if challenged by another bidder and 0 otherwise. The variable that
measured the attitude of the target to the acquirer was coded 1 if the deal was friendly and 0
if it was otherwise. The dummy variable, target is in a high technology industry was coded 1
if true and 0 otherwise. Year dummies were also included in the regression analysis for nine
of the ten years of the same from 1988 to 1996 with 1988 being the omitted year.

Cross-form effects Paper Two
84
Model
ROA change =
+ β1(industry change in roa) + β2(relative acquisition size)
+ β3(acqr to targ relatedness) + β4(acqr acquisition exp.)
+ β5(targ acquisition exp.) + β6(change in sales)
+ β7(change in debt equity ratio) + β8(method of payment)
+ β9(deal challenged) + β10(deal friendly)
+ β11(target high-tech) + β21-31(constant, year dummies)
+ β12(acquirer’s general alliance experience)
+ β13(target’s general alliance experience)
+ β14,16(acquirer’s related industry alliance experience)
+ β15,17(target’s related industry alliance experience)
+ β18(acquirer’s gen. alli. exp. target’s gen. alli. exp.)
+ β19,20(acquirer’s related ind. alli. exp. target’s related ind. alli. exp.)
+ β18,20(acquirer’s gen. alli. exp. acquirer’s related ind. alli. exp.)
+ β19,21(target’s gen. alli. exp. target’s related ind. alli. exp.)
+ β22(acquirer’s general alliance experience)2
+ β23(target’s general alliance experience)2
4. RESULTS
4.1 Descriptive Statistics
Table 1a shows the descriptive statistics of our full sample of 505 observations based
on an SIC3 industry definition. There are several points of interest in this table. There is a
considerable difference between the mean ROA change of 0.79 (sd 6.40) and the Industry
Median ROA change of -0.09 (sd 0.33). Compared with the industry median, our sample
median is performing considerably above the industry, however the wide standard deviation
makes the difference statistically insignificant.
Looking at other interesting descriptive statistics from Table 1a from the acquirer’s
perspective, there were 256 (51%) of the full sample of 505 acquisitions in which the acquirer
had alliance experience. In 173 of these acquisitions, the acquirer had related alliance
experience in the same industry as the target (i.e. had a positive value for ARIPA), which
Controls
H5
H6
H1, H2
H3
H4

Cross-form effects Paper Two
85
means 68% (173/256) of acquirers that had alliance experience had it in the same industry as
its future target. Similarly from the target’s perspective, there were 179 (35%) acquisitions in
which the target had alliance experience. In 125 of these acquisitions, the target had related
alliance experience in the same industry as the acquirer, which means that almost 70%
(125/179) of targets that had alliance experience had it in the same industry as its acquirer.
The high percentages of these conditional sub-subsamples seem to suggest to a limited extent
that there may have been strategic intent for acquiring in the industry signaled by alliance
activity in that industry well before the focal acquisition was announced.
Table 1b shows the correlation matrix of the full sample. A number of pairs of
variables have correlation coefficients close to one and with high statistical significance.
However, there only need be concern for those variables that enter the regression equation
together. Therefore, of specific concern should be the correlations pairs between Acquirer
General Alliance Experience with Acquirer RIA experience and with Acquirer ARIPA
experience, which are .68 and .67 respectively (both p<.01), and those between Target
General Alliance Experience with Target RIA experience and with Target ARIPA
experience, which are .5 and .45 respectively (both p<.01). These pairs of variables will have
naturally occurring correlations because industry experience is a subset of general experience.
However, we have specifically addressed the independence of these pairs of variables during
their construction using similar methods of prior studies (i.e. Hoang and Rothaermel, 2005).
The logarithmic transformations of the experience variables improved the results of
the tests for multicollinearity. The variance inflation factors (VIF) were calculated for all the
OLS regression models and the maximum individual VIF was 5.26, which is below the limit
of 10, and a mean VIF of 2.03, which is also well within the acceptable limits (Chatterjee,
Hadi, and Price, 2000).

Cross-form effects Paper Two
86
4.2 Analysis
We present and analyze the regression results according to the integrated view of both
mechanisms that explains the cross-form effect, starting first with the inter-firm perspective
and then intra-firm.
Inter-firm perspective. Table 2a shows the results of the regression for the inter-firm
perspective of the cross-form effect. This table answers the question: To what extent do the
acquirer and target’s previous alliance experience have mutual influences that affect the
performance of the focal acquisition?
Hypothesis 3 states that when the acquirer and target combine their general alliance
experience, their interaction will positively affect focal acquisition performance. Models (2)
and (6) show this to be true with a positive and highly significant coefficient estimate of 1.3
(p<.001) in both models. Even after controlling for the interactions of relative alliance
experiences between the acquirer and target, models (4) and (8) show this conclusion
continues to hold true in with statistically significant coefficient estimates of .99 (p<.05) and
.91 (p<.05) respectively. This is clear evidence that Hypothesis 3 is strongly supported.
Hypothesis 4 says that focal acquisition performance will be positively affected when
acquirer and target interactively combine their relative industry alliance experience. Similar
to the previous hypothesis, models (3) and (5) show this to be true for both versions of
relative industry alliance experience with highly statistically significant and positive
coefficient estimates of 1.2 (p<.001) and 2.5 (p<.001). The conclusion continues to hold even
after controlling for the interactions between general alliance experience in models (4) and
(8) with significant and positive coefficients of .82 (p<.05) and 1.9 (p<.05). Again we have
strong evidence that Hypothesis 4 is supported.
Figure 3 plots the interactions between the inter-firm alliance experiences of the
acquirer and target confirming their mutual positive influence on acquisition performance. It
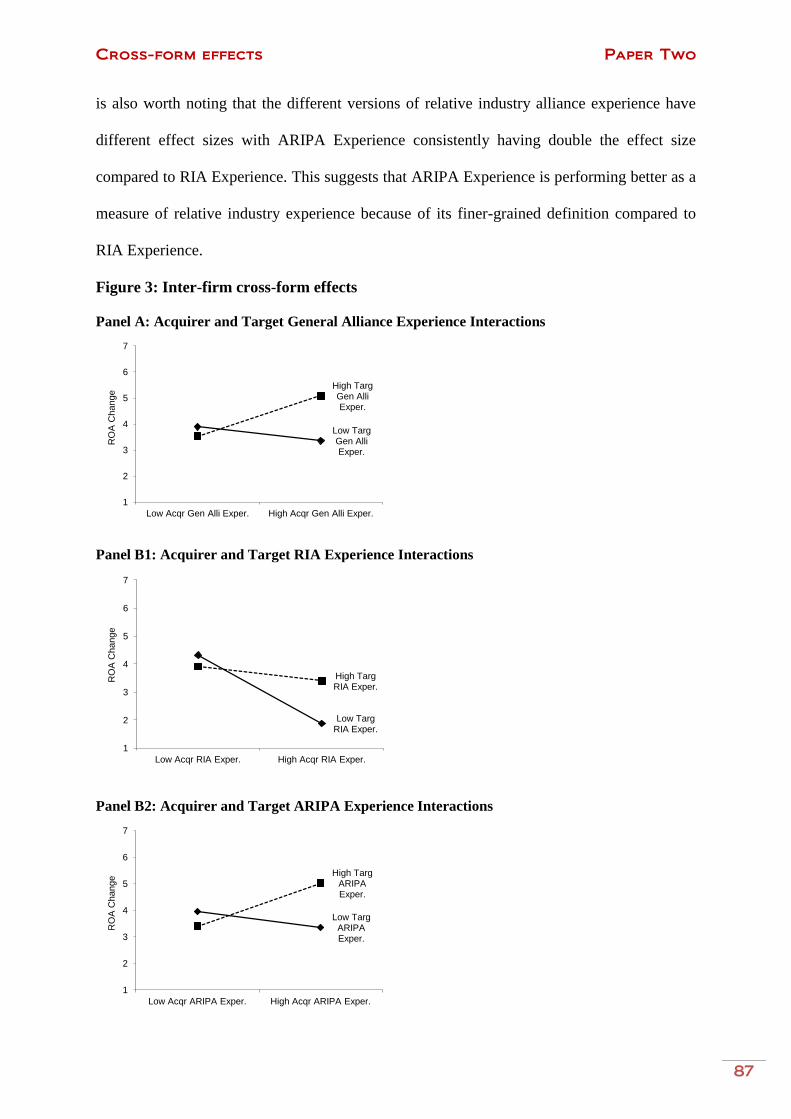
Cross-form effects Paper Two
87
is also worth noting that the different versions of relative industry alliance experience have
different effect sizes with ARIPA Experience consistently having double the effect size
compared to RIA Experience. This suggests that ARIPA Experience is performing better as a
measure of relative industry experience because of its finer-grained definition compared to
RIA Experience.
Figure 3: Inter-firm cross-form effects
Panel A: Acquirer and Target General Alliance Experience Interactions
Panel B1: Acquirer and Target RIA Experience Interactions
Panel B2: Acquirer and Target ARIPA Experience Interactions
Low Targ Gen Alli Exper.
High Targ Gen Alli Exper.
1
2
3
4
5
6
7
Low Acqr Gen Alli Exper. High Acqr Gen Alli Exper.
RO
A C
hange
Low Targ RIA Exper.
High Targ RIA Exper.
1
2
3
4
5
6
7
Low Acqr RIA Exper. High Acqr RIA Exper.
RO
A C
hange
Low Targ ARIPA Exper.
High Targ ARIPA Exper.
1
2
3
4
5
6
7
Low Acqr ARIPA Exper. High Acqr ARIPA Exper.
RO
A C
hange

Cross-form effects Paper Two
88
Intra-firm perspective. Table 2b shows the results of the regression for the intra-firm
perspective of the cross-form effect. This table answers the question: To what extent do the
previous alliance experiences within a firm (acquirer or target) interact to affect focal
acquisition performance?
Hypothesis 5 argues that a focal firm with increasing levels of alliance experience will
have greater ability to interactively combine within its own organization structure its general
alliance and relative industry alliance experiences positively affecting focal acquisition
performance. In model (2) when RIA Experience is used to measure relative alliance
experience, positive and highly significant coefficients are reported for the acquirer and target
with .69 (p<.001) and .13 (p<.05) respectively, supporting the hypothesis. The same support
is given in model (5) when ARIPA Experience is used for relative industry alliance
experience, which also reports positive significant coefficients of .85 (p<.001) and 2.2
(p<.05) for the acquirer and target respectively, providing strong empirical support for
Hypothesis 5.
Hypothesis 1 is a null hypothesis which states that using the process similarities
mechanism the cross-form effect of general alliance experience will be indeterminate and that
any significant effect is merely a data-dependent effect. An analysis of the results for models
testing this hypothesis gives conflicting conclusions. On the one hand, models (1) and (4)
would seem to confirm the indeterminacy of the effect, or more accurately stated, the results
of these two models do not reject the null hypothesis. On the other hand, models (2) (3) (5)
and (6) have significant but negative coefficients that together reject the null. One way of
resolving this conflict is to first look at the results of the tests for Hypothesis 6. This
hypothesis argues using both the process similarities and experience interactions mechanism
that the square of alliance experience will have a cross-form effect. The results of models (3)
and (6) provide strong evidence that confirm Hypothesis 6 with significant and positive

Cross-form effects Paper Two
89
coefficient estimates of .47 (p<.05) and 1.4 (p<.05) for the acquirer and .46 (p<.05) and 1.5
(p<.05) for target in each respective model. As we shall explain, it would seem that the two
mechanisms that gave rise to these two hypotheses cannot be separated, but are in fact two
aspects of the same single intra-firm mechanism.
Looking at the results of both Hypotheses 1 and 6 together, we make an important
observation about our results that is consistent with similar previous studies (Haleblian and
Finkelstein, 1999; Porrini, 2004b; Hoang and Rothaermel, 2005; Zollo and Reuer, 2010).
Like these studies, in models (3) and (6) not only is the coefficient estimate for general
alliance experience significant and negative, the coefficient estimate for the square of general
alliance experience is also significant and positive. As these studies argue, this particular
combination of results indicates that at low levels of alliance experience firms inappropriately
apply alliance processes in the focal acquisition resulting in negative (linear) performance, an
effect already explained by the process similarities mechanism. As alliance experience
increases, firms not only improve at applying alliance processes resulting in positive (non-
linear) performance, again explained previously by the process similarities mechanism, but
they also improve performance in a way that has been explained by the experience
interactions mechanism. The results that test Hypotheses 1 and 6 seem to provide strong
evidence, which is also consistent with the empirical findings of earlier studies that the
process similarities and experiences similarities mechanisms are in fact working as single
mechanism within the firm.
Finally, Hypothesis 2 does not have consistent results across all models in Table 2b.
We conclude, although only preliminarily, that there is no support for this hypothesis. We
leave the explanation of this conclusion to the next section.

Cross-form effects Paper Two
90
5. CONCLUSIONS AND FURTHER RESEARCH
The general research question we began with asked how cooperative strategies
learned from previous alliance experience influenced focal acquisition performance, which
we called the cross-form (transfer) effect. We identified and discussed the process similarities
and experience interactions mechanisms that seemed to provide explanations for the cross-
form effect and by taking inter-firm and intra-firm perspectives we were able to draw
complementary conclusions. The general question was thus divided into two.
Firstly, from the inter-firm perspective, how and to what extent did acquirers and
targets combine their alliance experiences to positively influence acquisition performance?
The theory and results we presented tell us that focal firms combine their alliance experiences
interactively through the experience interactions mechanism. This is one of the main
contributions this study makes to the literature on cross-form effects.
Secondly, from the intra-firm perspective, how and to what extent does a firm through
its own organizational structure combine its previous alliance experiences to positively affect
acquisition performance? We argued that a firm combines its previous alliance experiences
using both theoretical mechanisms. We also found strong empirical evidence that is
consistent with the findings of earlier studies that an integrated mechanism is at work which
consists of both mechanisms working together. Given the theoretical arguments and this
empirical finding, our original arguments that led to Hypotheses 1 and 6 should in fact be
changed to consider both mechanisms as one integrated cross-form mechanism. This is the
second main contribution that this study makes to the literature. Figure 1 illustrates the
integrated cross-form mechanism.
However, one hypothesis that was not supported was Hypothesis 2, which said that
relative industry alliance experience should have a positive cross-form effect. Since this
hypothesis is similar in nature to Hypothesis 1, we believe further investigation is needed to

Cross-form effects Paper Two
91
verify if this Hypothesis 2 is indeed not supportable, or like Hypotheses 1 should be
considered together with an analogous hypothesis like that of Hypothesis 6. For example,
further research into the “square of relative industry alliance experience” may provide more
insight into why Hypothesis 2 was not supported.
Another area for further research is to consider other measures of acquisition
performance. For example, Zollo and Reuer (2010) include both accounting and financial
performance measures that provide complementary evidence to support their arguments.

Cross-form effects Paper Two
92
6. REFERENCES
Agarwal, R., Anand, J., Bercovitz, J., & Croson, R. 2012. Spillovers across organizational architectures: The
role of prior resource allocation and communication in post-acquisition coordination outcomes.
Strategic Management Journal, 33(6): 710-733.
Agarwal, R., Anand, J., & Croson, R. 2006. Are there benefits from engaging in an alliance with a firm prior to
its acquisition? In A. Ariño & J. J. Reuer (Ed.), Strategic alliances: Governance and contracts. New
York: Palgrave Macmillan Press.
Al-Laham, A., Schweizer, L., & Amburgey, T. L. 2010. Dating before marriage? analyzing the influence of pre-
acquisition experience and target familiarity on acquisition success in the “M&A as R&D” type of
acquisition. Scandinavian Journal of Management, 26(1): 25-37.
Anand, B. N., & Khanna, T. 2000. Do firms learn to create value? the case of alliances. Strategic Management
Journal, 21(3, Special Issue: Strategic Networks): 295-315.
Ariño, A., & Torre, J. d. l. 1998. Learning from failure: Towards an evolutionary model of collaborative
ventures. Organization Science, 9(3, Special Issue: Managing Partnerships and Strategic Alliances):
306-325.
Barkema, H. G., & Schijven, M. 2008. How do firms learn to make acquisitions? A review of past research and
an agenda for the future. Journal of Management, 34(3): 594-634.
Barney, J. 1991. Firm resources and sustained competitive advantage. Journal of Management, 17(1): 99.
Beckman, C. M., & Haunschild, P. R. 2002. Network learning: The effects of partners' heterogeneity of
experience on corporate acquisitions. Administrative Science Quarterly, 47(1): 92-124.
Bruner, R. F. 1988. The use of excess cash and debt capacity as a motive for merger. Journal of Financial and
Quantitative Analysis, 23(02): 199.
Chatterjee, S., Hadi, A. S., & Price, B. 2000. Regression analysis by example (3rd ed.). New York: John Wiley
& Sons.
Datta, D. K. 1991. Organizational fit and acquisition performance: Effects of post-acquisition integration.
Strategic Management Journal, 12(4): pp. 281-297.
Doz, Y. L. 1996. The evolution of cooperation in strategic alliances: Initial conditions or learning processes?
Strategic Management Journal, 17(Special Issue: Evolutionary Perspectives on Strategy): 55-83.
Dyer, J. H., & Singh, H. 1998. The relational view: Cooperative strategy and sources of interorganizational
competitive advantage. The Academy of Management Review, 23(4): 660-679.
Eisenhardt, K. M., & Martin, J. A. 2000. Dynamic capabilities: What are they? Strategic Management Journal,
21(10/11, Special Issue: The Evolution of Firm Capabilities): 1105-1121.
Finkelstein, S., & Haleblian, J. 2002. Understanding acquisition performance: The role of transfer effects.
Organization Science, 13(1): 36-47.
Grant, R. M. 1996. Toward a knowledge-based theory of the firm. Strategic Management Journal, 17(Special
Issue: Knowledge and the Firm): 109-122.
Grant, R. M., & Baden-Fuller, C. 2004. A knowledge accessing theory of strategic alliances. Journal of
Management Studies, 41(1): 61-84.

Cross-form effects Paper Two
93
Gulati, R. 1995. Does familiarity breed trust? the implications of repeated ties for contractual choice in
alliances. The Academy of Management Journal, 38(1): 85-112.
Gulati, R., Lavie, D., & Singh, H. 2009. The nature of partnering experience and the gains from alliances
Strategic Management Journal, 30(11): 1213-1233.
Haleblian, J., Kim, J., & Rajagoplan, N. 2006. The influence of acquisition experience and performance on
acquisition behavior: Evidence from the U.S. commercial banking industry. Academy of Management
Journal, 49(2): 357-370.
Haleblian, J., & Finkelstein, S. 1999. The influence of organizational acquisition experience on acquisition
performance: A behavioral learning perspective. Administrative Science Quarterly, 44(1): 29-56.
Hayward, M. L. A. 2002. When do firms learn from their acquisition experience? evidence from 1990-1995.
Strategic Management Journal, 23(1): 21-39.
Heimeriks, K. H., & Duysters, G. 2007. Alliance capability as a mediator between experience and alliance
performance: An empirical investigation into the alliance capability development process. Journal of
Management Studies, 44(1): 25-49.
Heimeriks, K. H., Duysters, G., & Vanhaverbeke, W. 2007. Learning mechanisms and differential performance
in alliance portfolios. Strategic Organization, 5(4): 373-408.
Hennart, J. 1988. A transaction costs theory of equity joint ventures. Strategic Management Journal, 9(4): 361-
374.
Hoang, H., & Rothaermel, F. T. 2005. The effect of general and partner-specific alliance experience on joint
R&D project performance. Academy of Management Journal, 48(2): 332-345.
Ingram, P., & Baum, J. A. C. 1997. Opportunity and constraint: Organizations' learning from the operating and
competitive experience of industries. Strategic Management Journal, 18 (Summer 1997 Special Issue:
Organizational and Competitive Interactions): pp. 75-98.
Inkpen, A. C. 1998. Learning and knowledge acquisition through international strategic alliances. The Academy
of Management Executive (1993), 12(4, Competitiveness and Global Leadership in the 21st Century):
69-80.
Inkpen, A. C. 2000. Learning through joint ventures: A framework of knowledge acquisition. Journal of
Management Studies, 37(7): 1019-1043.
Inkpen, A. C., & Currall, S. C. 2004. The coevolution of trust, control, and learning in joint ventures.
Organization Science, 15(5): 586-599.
Kale, P., Dyer, J. H., & Singh, H. 2002. Alliance capability, stock market response, and long-term alliance
success: The role of the alliance function. Strategic Management Journal, 23(8): 747-767.
Kale, P., & Singh, H. 2007. Building firm capabilities through learning: The role of the alliance learning process
in alliance capability and firm-level alliance success. Strategic Management Journal, 28(10): 981-
1000.
Kale, P., Singh, H., & Perlmutter, H. 2000. Learning and protection of proprietary assets in strategic alliances:
Building relational capital. Strategic Management Journal, 21(3, Special Issue: Strategic Networks):
217-237.
Kim, E. H., & McConnell, J. J. 1977. Corporate mergers and the co-insurance of corporate debt. The Journal of
Finance, 32(2, Papers and Proceedings of the Thirty-Fifth Annual Meeting of the American Finance
Association, Atlantic City, New Jersey, September 16-18, 1976): pp. 349-365.

Cross-form effects Paper Two
94
Kogut, B. 1991. Joint ventures and the option to expand and acquire. Management Science, 37(1): 19-33.
Kogut, B., & Kulatilaka, N. 2001. Capabilities as real options. Organization Science, 12(6): 744-758.
Kogut, B., & Zander, U. 1992. Knowledge of the firm, combinative capabilities, and the replication of
technology. Organization Science, 3(3, Focused Issue: Management of Technology): 383-397.
Lane, P. J., & Lubatkin, M. 1998. Relative absorptive capacity and interorganizational learning. Strategic
Management Journal, 19(5): 461-477.
Levitt, B., & March, J. G. 1988. Organizational learning. Annual Review of Sociology, 14: 319-340.
March, J. G., & Simon, H. A. 1958. Organizations. New York: John Wiley.
Mazur, J., 1998. Learning and Behavior. Englewood Cliffs, NJ: Prentice-Hall
Meeks, G., & Meeks, J. G. 1981. Profitability measures as indicators of post-merger efficiency. The Journal of
Industrial Economics, 29(4): pp. 335-344.
Mowery, D. C., Oxley, J. E., & Silverman, B. S. 1996. Strategic alliances and interfirm knowledge transfer.
Strategic Management Journal, 17(Special Issue: Knowledge and the Firm): 77-91.
Nelson, R. R., & Winter, S. G. 1982. An evolutionary theory of economic change. Cambridge Mass.: Harvard
University Press.
Novick, L. R. 1988. Analogical transfer, problem similarity, and expertise. Journal Of Experimental
Psychology. Learning, Memory, And Cognition, 14(3): 510-520.
Porrini, P. 2004a. Can a previous alliance between an acquirer and a target affect acquisition performance?
Journal of Management, 30(4): 545-562.
Porrini, P. 2004b. Alliance experience and value creation in high-tech and low-tech acquisitions. The Journal of
High Technology Management Research, 15(2): 267-292.
Reuer, J. J., Park, K. M., & Zollo, M. 2002. Experimental learning in international joint ventures: The role of
experience heterogeneity and venture novelty. In F. J. Contractor & P. Lorange (Ed.), Cooperative
strategies and alliances: 321-346. Amsterdam, Netherlands: Elsevier Science.
Reuer, J. J., Zollo, M., & Singh, H. 2002. Post-formation dynamics in strategic alliances. Strategic
Management Journal, 23(2): 135-151.
Sampson, R. C. 2005. Experience effects and collaborative returns in R&D alliances. Strategic Management
Journal, 26(11): 1009-1031.
Schilling, M. A. 2009. Understanding the alliance data. Strategic Management Journal, 30(3): 233-260.
Shi, W., Sun, J., & Prescott, J. E. 2012. A temporal perspective of merger and acquisition and strategic alliance
initiatives: Review and future direction Journal of Management, 38(1): 164-209.
Shrieves, R. E., & Pashley, M. M. 1984. Evidence on the association between mergers and capital structure.
Financial Management, 13(3): pp. 39-48.
Simonin, B. L. 1997. The importance of collaborative know-how: An empirical test of the learning organization.
The Academy of Management Journal, 40(5): pp. 1150-1174.

Cross-form effects Paper Two
95
Stuart, T. E. 2000. Interorganizational alliances and the performance of firms: A study of growth and innovation
rates in a high-technology industry. Strategic Management Journal, 21(8): 791-811.
Teece, D. J., Pisano, G., & Shuen, A. 1997. Dynamic capabilities and strategic management. Strategic
Management Journal, 18(7): 509-533.
Vanhaverbeke, W., Duysters, G., & Noorderhaven, N. 2002. External technology sourcing through alliances or
acquisitions: An analysis of the application-specific integrated circuits industry. Organization Science,
13(6): 714-733.
Wang, L., & Zajac, E. J. 2007. Alliance or acquisition? A dyadic perspective on interfirm resource
combinations. Strategic Management Journal, 28(13): 1291-1317.
Yang, H., Lin, Z., & Peng, M. W. 2011. Behind acquisitions of alliance partners: Exploratory learning and
network embeddedness. Academy of Management Journal, 54(5): 1069-1080.
Zaheer, A., Hernandez, E., & Banerjee, S. 2010. Prior alliances with targets and acquisition performance in
knowledge-intensive industries. Organization Science, 21(5): 1072-1091.
Zahra, S. A., & George, G. 2002. Absorptive capacity: A review, reconceptualization, and extension. The
Academy of Management Review, 27(2): 185-203.
Zollo, M., & Reuer, J. J. 2010. Experience spillovers across corporate development activities. Organization
Science, 21(6): 1195-1212.
Zollo, M., Reuer, J. J., & Singh, H. 2002. Interorganizational routines and performance in strategic alliances.
Organization Science, 13(6): 701-713.
Zollo, M., & Winter, S. G. 2002. Deliberate learning and the evolution of dynamic capabilities. Organization
Science, 13(3, Knowledge, Knowing, and Organizations): 339-351.

Cross-form effects Paper Two
96
7. RESULT TABLES
Table 1a: Descriptive Statistics (see note 1)
Variable mean sd min max sum
ROA change 0.79 6.40 -49.29 47.48 n/a
Acqr General Alliance Experience (note 2) 0.67 1.02 0.00 5.43 338.50
Targ General Alliance Experience (note 2) 0.27 0.56 0.00 3.04 137.10
Acqr RIA Experience (note 2) 0.51 0.89 0.00 5.16 257.45
Targ RIA Experience (note 2) 0.33 0.66 0.00 3.61 166.25
Acqr ARIPA Experience (note 2) 0.36 0.71 0.00 4.83 181.88
Targ ARIPA Experience (note 2) 0.19 0.41 0.00 2.30 93.81
No. of prior acqr alli. with RIPA > 0 2.74 13.90 0 173 1382
No. of prior targ alli. with RIPA > 0 0.95 2.78 0 36 478
No. of acqr & targ alli. with RIPA > 0 3.68 15.45 0 206 1860
No. of acqr with prior alliance experience n/a n/a n/a n/a 256
No. of targ with prior alliance experience n/a n/a n/a n/a 179
No. of obsv where acqr with ARIPA > 0 n/a n/a n/a n/a 173
No. of obsv where targ with ARIPA > 0 n/a n/a n/a n/a 125
No. of obsv aqcr ARIPA > 0 & targ ARIPA > 0 n/a n/a n/a n/a 83
Industry Median ROA change -0.09 0.33 -1.01 1.93 n/a
Relative Acquisition Size 1.27 7.08 0.00 114.95 n/a
Acquire to Target Relatedness 0.28 0.29 0.00 1.00 n/a
Acqr Acquisition Experience 2.39 2.89 0.00 14.00 1206
Targ Acquisition Experience 0.86 1.44 0.00 12.00 436
Change in Sales 1.37 5.22 -0.97 74.67 n/a
Change in Debt Equity Ratio 2.15 7.05 -1.00 73.52 n/a
Method of Payment 0.31 0.46 0.00 1.00 157
Deal Challenged 0.07 0.25 0.00 1.00 34
Deal Friendly 0.96 0.19 0.00 1.00 486
Target hi-tech 0.53 0.50 0.00 1.00 269
N=505
Note 1: The industry definitions are based on SIC3.
Note 2: These variables are transformed according to ln(1+experience) following Zollo et al. (2002).

Cross-form effects Paper Two
97
Table 1b: Correlation Table
(1) (2) (3) (4) (5) (6) (7) (8) (9) (10) (11) (12) (13) (14) (15) (16) (17) (18)
(1) ROA Change 1
(2) Acqr General Alliance Experience -.0027 1
(3) Targ General Alliance Experience .021 .34** 1
(4) Acqr RIA Experience .0036 .68** .35** 1
(5) Targ RIA Experience .041 .43** .5** .57** 1
(6) Acqr ARIPA Experience .021 .67** .29** .97** .54** 1
(7) Targ ARIPA Experience .026 .37** .45** .53** .94** .52** 1
(8) Industry Median Change in ROA .057 -.022 -.055 -.039 -.059 -.051 -.088* 1
(9) Relative Acquisition Size -.089* -.045 .021 -.076 .015 -.07 .012 -.000061 1
(10) Acqr to Targ Relatedness .0042 -.029 .082 .24** .25** .24** .31** -.075 .031 1
(11) Acqr Acquisition Experience .061 .43** .11* .36** .16** .37** .13** .0074 -.11* -.035 1
(12) Targ Acquisition Experience .053 .18** .15** .13** .18** .14** .18** .01 .046 .082 .13** 1
(13) Change in Sales -.053 -.039 -.0085 .0031 .024 .0037 .035 -.082 -.023 .091* -.022 -.033 1
(14) Change in Debt Equity Ratio -.00047 .032 .075 .001 .013 -.0048 -.0038 .014 -.014 .041 -.025 .068 .064 1
(15) Method of Payment .1* .048 -.0015 -.026 -.066 -.0018 -.087* -.029 -.086 -.19** .056 .0043 -.12** .084 1
(16) Deal Challenged .082 -.082 -.029 -.072 -.11* -.087 -.097* .011 -.021 -.076 -.00054 -.04 -.03 .027 .076 1
(17) Deal Friendly -.18** .022 -.042 -.033 -.0085 -.026 .011 .016 .0094 .042 -.0059 -.041 .046 .021 -.14** -.11* 1
(18) Target Hi-tech -.14** .27** .27** .33** .33** .34** .33** -.13** .031 .27** .05 -.00068 .096* .042 -.18** -.16** .11* 1
N=505, unless otherwise stated
* p<.05
** p<.01

Cross-form effects Paper Two
98
Table 2a: Inter-firm Perspective of Cross-form Effect
Dependent Variable: ROA Change Model: (1) (2) (3) (4) (5) (6) (7) (8)
Hyp
Industry Median Change in ROA 1.1 .91 .9 .83 1.1 .9 .82 .75
(.91) (.9) (.9) (.89) (.91) (.9) (.9) (.9)
Relative Acquisition Size -.065 -.064 -.066 -.065 -.061 -.061 -.065 -.063
(.041) (.04) (.04) (.04) (.041) (.04) (.04) (.04)
Acqr to Targ Relatedness 1 1.2 1.4 1.4 .76 1 1.3 1.3
(1.1) (1.1) (1.1) (1.1) (1.1) (1.1) (1.1) (1.1)
Acqr Acquisition Experience .13 .11 .088 .089 .11 .099 .068 .07
(.11) (.11) (.11) (.11) (.11) (.11) (.11) (.11)
Targ Acquisition Experience .1 .075 .076 .063 .12 .091 -.0077 .0047
(.2) (.2) (.2) (.2) (.2) (.2) (.2) (.2)
Change in Sales -.034 -.038 -.039 -.04 -.034 -.038 -.038 -.039
(.055) (.054) (.054) (.054) (.055) (.054) (.054) (.054)
Change in Debt Equity Ratio .00072 -.0061 .0057 -.0011 .0022 -.0054 -.0012 -.0056
(.04) (.04) (.04) (.04) (.04) (.04) (.04) (.04)
Method of Payment .9 .91 .78 .83 .88 .9 .71 .77
(.64) (.64) (.64) (.64) (.65) (.64) (.64) (.64)
Deal Challenged 1.5 1.6 1.6 1.7 1.5 1.5 1.5 1.6
(1.2) (1.2) (1.2) (1.1) (1.2) (1.2) (1.1) (1.1)
Deal Friendly -5.2*** -4.6** -4.5** -4.3** -5.1*** -4.5** -4.4** -4.2**
(1.5) (1.5) (1.5) (1.5) (1.5) (1.5) (1.5) (1.5)
Target Hi-tech -1.6* -1.4* -1.5* -1.4* -1.7* -1.5* -1.4* -1.3*
(.65) (.64) (.64) (.64) (.65) (.65) (.64) (.64)
Gen. Alli. Exp: Acqr Gen. Alli Exp -.1 -.62 -.081 -.48 -.25 -.76+ -.094 -.48
(.42) (.44) (.42) (.44) (.42) (.44) (.41) (.44)
Targ Gen. Alli Exp .15 -1.7* .1 -1.3 .28 -1.6* .26 -1
(.6) (.79) (.59) (.81) (.59) (.79) (.58) (.81)
Rel. Ind Exp 1: Acqr RIA Exp. (Note1) -.36 -.43 -1.4* -1.1+
(.5) (.5) (.58) (.59)
Targ RIA Exp. 1+ .78 -.58 -.24
(.58) (.58) (.75) (.76)
Rel. Ind. Exp 2: Acqr ARIPA Exp. (Note 1)
.14 .0088 -1.5* -1.2
(.62) (.61) (.73) (.74)
Targ ARIPA Exp.
.97 .55 -1.5 -1.2
(.9) (.89) (1.1) (1.1)
Acqr Gen.Alli.Exp * Targ Gen.Alli. Exp H3
1.3***
.99*
1.3***
.91*
(.37)
(.4)
(.37)
(.39)
Rel.Ind.Exp 1: Acqr RIA Exp * Targ RIA Exp H4
1.2*** .82*
(.36) (.39)
Rel.Ind.Exp 2: Acqr ARIPA * Targ ARIPA H4
2.5*** 1.9**
(.63) (.68)
Regression constant 4.5* 4* 4* 3.8* 4.5* 4* 4* 3.8*
(1.8) (1.8) (1.8) (1.8) (1.8) (1.8) (1.8) (1.8)
Sample Size 505 505 505 505 505 505 505 505
R-Squared 0.094 0.118 0.115 0.126 0.091 0.115 0.120 0.129
Adjusted R-Squared 0.049 0.072 0.068 0.078 0.046 0.069 0.074 0.082
Model F 2.1** 2.6*** 2.5*** 2.7*** 2** 2.5*** 2.6*** 2.7***
Standard errors are given in parentheses. [ROA_15]
All models include year dummies (not shown) with 1988 as the omitted year.
Note 1: RIA and ARIPA are alternative measures of Related Industry Alliance experience.
+ p < .1;
* p < .05;
** p < .01;
*** p < .001.

Cross-form effects Paper Two
99
Table 2b: Intra-firm Perspective of Cross-form Effect
Dependent Variable: ROA Change Model: (1) (2) (3) (4) (5) (6)
Hyp
Industry Median Change in ROA 1.1 .85 .92 1.1 .78 .92
(.91) (.89) (.9) (.91) (.89) (.9)
Relative Acquisition Size -.065 -.068+ -
.068+ -.061 -.066+ -.065
(.041) (.04) (.04) (.041) (.04) (.04)
Acqr to Targ Relatedness 1 1.5 1.2 .76 1.4 .99
(1.1) (1.1) (1.1) (1.1) (1.1) (1.1)
Acqr Acquisition Experience .13 .096 .12 .11 .084 .11
(.11) (.11) (.11) (.11) (.11) (.11)
Targ Acquisition Experience .1 .11 .14 .12 .1 .15
(.2) (.2) (.2) (.2) (.2) (.2)
Change in Sales -.034 -.039 -.043 -.034 -.041 -.043
(.055) (.054) (.054) (.055) (.054) (.054)
Change in Debt Equity Ratio .00072 .0067 .0093 .0022 .0059 .01
(.04) (.04) (.04) (.04) (.04) (.04)
Method of Payment .9 .73 .72 .88 .69 .73
(.64) (.64) (.64) (.65) (.64) (.64)
Deal Challenged 1.5 1.8 1.7 1.5 1.7 1.7
(1.2) (1.1) (1.2) (1.2) (1.1) (1.2)
Deal Friendly -5.2*** -4.2** -4.6** -5.1*** -4.1** -4.5**
(1.5) (1.5) (1.5) (1.5) (1.5) (1.5)
Target Hi-tech -1.6* -1.4* -1.4* -1.7* -1.3* -1.4*
(.65) (.64) (.64) (.65) (.64) (.65)
Gen. Alli. Exp: Acqr Gen. Alli Exp H1 -.1 -.82+ -1.6* -.25 -.82+ -1.7*
(.42) (.46) (.69) (.42) (.44) (.68)
Targ Gen. Alli Exp .15 -.92 -2.4+ .28 -.73 -2.3+
(.6) (.78) (1.4) (.59) (.73) (1.4)
Rel. Ind Exp 1: Acqr RIA Experience (Note 1) H2 -.36 -1.8** -.58
(.5) (.64) (.51)
Targ RIA Experience 1+ .035 .92
(.58) (.69) (.58)
Rel. Ind. Exp 2: Acqr ARIPA Experience (Note 1) H2
.14 -2* -.29
(.62) (.85) (.63)
Targ ARIPA Experience
.97 -.7 .92
(.9) (1.1) (.89)
Rel. Ind Exp 1: Acqr Gen. Alli Exp * Acqr RIA Exp H5 .69***
(.2)
Targ Gen. Alli Exp * Targ RIA Exp 1.3*
(.56)
Rel. Ind Exp 2: Acqr Gen. Alli Exp * Acqr ARIPA
Exp H5
.85***
(.25)
Targ Gen. Alli Exp * Targ ARIPA
Exp
2.2*
(.91)
Gen. Alli. Exp: Acqr Gen. Alli Exp * Acqr Gen. Alli Exp
H6
.47* .46*
(.18) (.19)
Targ Gen. Alli Exp * Targ Gen. Alli Exp
1.4* 1.5*
(.7) (.7)
Regression constant 4.5* 3.7* 4* 4.5* 3.7* 4*
(1.8) (1.8) (1.8) (1.8) (1.8) (1.8)
Sample Size 505 505 505 505 505 505
R-Squared 0.094 0.132 0.118 0.091 0.133 0.114
Adjusted R-Squared 0.049 0.085 0.070 0.046 0.086 0.066
Model F 2.1** 2.8*** 2.5**
* 2** 2.8*** 2.4***
Standard errors are given in parentheses [ROA_15]
All models include year dummies (not shown) with 1988 as the omitted year.
Note 1: RIA and ARIPA are alternative measures of Related Industry Alliance experience.
+ p < .1;
* p < .05;
** p < .01;
*** p < .001.

Paper Three:
Do Strategic Alliances
Create Value for Bond
Investors?
ABSTRACT
Prior studies have found that the formation of strategic alliances creates value for stock
holders. In this study I analogously apply theories of coinsurance from the merger
literature to strategic alliances and find that bond holder wealth also increases at the
announcement of alliances. Through an event study of 725 announcements of US
industrial firms which formed alliances in the period 2003 to 2007, I find evidence of
coinsurance effects on the bonds of these firms. In particular, I find that bond holders of
firms with below investment grade credit ratings benefit more than those rated
investment grade. In accord with earlier literature, I also test for organizational learning
effects by regressing prior alliance experience on bond returns however I find no such
learning effects.

Alliances and Bonds Paper Three
101
1. INTRODUCTION
Empirical research has confirmed that strategic alliances in general create value
for stock investors (McConnell and Nantell, 1985; Chan, Kensinger, Keown, and
Martin, 1997). But do they also create value for bond investors? The published studies
to date have been silent on this question. Given the much larger size of the corporate
bond market compared with equities, lack of attention to the value creation potential for
the debt investors is indeed surprising. For example, during the decade 1997 to 2006,
US corporations issued $4.6 trillion in corporate bonds compared with $1.5 trillion in
new and seasoned equity issues (Bessembinder and Maxwell, 2008). The lack of
research on the effects of strategic alliances on corporate debt may be partially
explained by difficulties obtaining reliable trade data on corporate bonds. As of 2002,
trade data on US corporate bonds became publicly available through the introduction of
the Transaction Reporting and Compliance Engine (TRACE) database, opening
research opportunities in this area1.
To illustrate the effects of a strategic alliance announcement on both stock and
bond holder wealth, on 31 July 2007, CableVision (CV) Systems Corp and CNET
Network (CN) Inc “formed a strategic alliance to provide cable television services in
the United States. CV and CN launched "CNET TV-Powered by Optimum" for iO digital
cable customers on channel 607. The said free channel features hours of product
reviews, commentary shows like the Top 5, Insider Secrets and Prize Fight” (SDC
Platinum database). On this day, CV’s stock registered a 91.7 basis points abnormal
return or a gain of 79 million dollars, while its bonds registered a 212 basis point
abnormal return or a 21 million dollar gain (absolute returns were even higher). Clearly
1 As of July 2002, bond dealers were required to report all trades in publicly issued US corporate bonds to
the National Association of Security Dealers, which in turn made transaction data available to the public
(Bessembinder and Maxwell, 2008).

Alliances and Bonds Paper Three
102
in this instance and in many like it, the gains to both stock and bond investors are quite
significant. With the number and extent of strategic alliances continuously increasing,
attention to the value creation potential for both investor classes is important. Before the
turn of the century, almost 20,000 alliances were reported globally (Anand and Khanna,
2000); by 2005, SDC Platinum Alliances and Joint Ventures data base reported over
50,000 pending or completed alliances; and in 2012 in spite of the global financial crisis
a Deloitte Corporate Development survey reported that more than half the surveyed
executives believed their firm would increase alliance activity.
A strategic alliance is a cooperative agreement or contract between two or more
independent firms to commit and combine a subset of their resources for mutual benefit
(Parkhe, 1993; Das and Teng, 2000a). An alliance is more than a simple market buyer-
supplier agreement implying a certain level of exclusive access to the committed
resources above and beyond such market agreements (Kogut, 1988). The nature of
alliances can be described as a continuum where at one extreme are equity joint
ventures in which two or more parent firms agree to invest and establish a separate legal
business entity, while at the other extreme are cooperative agreements in which firms
work together on specified common activities. The SDC Platinum database offers a
practical definition for alliance contracts types by dividing them according to joint
ventures, licensing agreements, and strategic alliances. For this paper, I include all three
contract types under the generic term strategic alliance.
Strategic alliances are in some ways similar to mergers and acquisitions
(hereafter mergers) and may be considered alternate forms of combining firm resources
(Yin and Shanley, 2008; Wang and Zajac, 2007; Villalonga and McGahan, 2005). Like
mergers, firms can combine through alliances their tangible physical assets or intangible
knowledge assets (Das and Teng, 2000b; Kogut, 1988). In ways similar to mergers,

Alliances and Bonds Paper Three
103
asset combinations through alliances have the potential to create value for investors
because of synergies such as greater economies of scale, pooling of knowledge, and
reducing risk (Hennart, 1988). As an alliance develops, partnering firms learn and co-
develop new tangible and intangible assets that have future value creation potential
(Simonin, 1997; Dyer and Singh, 1998). Through strategic alliances, firms acquire
knowledge both for the common benefit of the alliance and for their own private benefit
(Khanna, 1998; Larsson, Bengsston, Henriksson, and Sparks, 1998; Kumar, 2010a).
They also learn to acquire knowledge more efficiently from their partners (Inkpen and
Crossan, 1995; Kale, Dyer, and Singh, 2002; Anand and Khanna, 2000).
However, strategic alliances are different to mergers because the management
executives of the partnering firms continue to keep their jobs and are required to
cooperate to ensure the alliance’s success. While mergers are able to eliminate
inefficient or ineffective management, those of partnering firms are required to
overcome the tensions working internally with each other and externally with their
competitive business environments (Das and Teng, 2000a). The relationship between
allying firms is thus forced to co-evolve along these two dimensions, making it unstable
and prone to failure (Doz, 1996; Ring and Van de Ven, 1994; Inkpen and Currall,
2004).
McConnell and Nantell (1985) was the earliest study to draw the analogy
between mergers and alliances and the similar effect they have on stock holder returns.
Many subsequent studies (e.g. Das, Sen, and Sengupta, 1998; Johnson and Houston,
2000; Anand and Khanna, 2000; Gao and Iyer, 2009; Amici et al, 2013) all imply the
existence of this “merger-alliance analogy”. However, like McConnell and Nantell’s
study, the focus has almost exclusively been on the wealth effects on stock holders.

Alliances and Bonds Paper Three
104
To my knowledge no study has looked at the effect of alliance formation on
bond holder wealth. If there is an effect, can the same merger-alliance analogy be used
to explain it? The aim of this paper is to study the effect of strategic alliance
announcements on bond investor wealth and develop the merger-alliance analogy as it
applies to corporate bonds. Specifically, in this paper I aim to answer three basic sets of
questions: (1) Do strategic alliances create value for the bond investors of allying firms?
(2) If so, how is value created for them? Is the merger-alliance analogy useful?
Since firms may engage in multiple alliances, scholars have been interested in
whether firms learn from this alliance experience and whether there is a positive effect
on firm performance measured by excess stock returns (e.g. Anand and Khanna, 2000;
Kale, Dyer, and Singh, 2002). With the aim of seeing how far the merger-alliance
analogy goes, I also aim to answer another basic question: (3) Do firms exhibit positive
alliance learning effects from their prior alliance experience as measured by bond
performance as they do by stock performance? Where are the limits of the merger-
alliance analogy?
Based on theories from the merger literature that explain the effects of co-
insurance on bond holder wealth, I show that the merger-alliance analogy can be
extended to explain the effects of strategic alliances on bond holder wealth. Using a
sample of 725 strategic alliance announcements by US industrial firms during the
period January 2003 to December 2007, I show that bond holders like stock holders in
general benefit from alliance formations 2,3
. Moreover, in a similar way to the bond
holders of merging firms, I show that the bond holders of firms that form alliances
experience co-insurance effects in two ways. Firstly, bond holders of allying firms with
2 The 725 observations include firm-alliance announcements made in the sample period where each firm
has both outstanding stocks and bonds. However, as bonds do not trade daily, the actual sample size of
the bond sample reduces to 467 bond observations of which 435 have complete firm-level data. 3 As explained further in Section 3, for firms with multiple bond issues outstanding, I combine them into
one single firm-bond. Thus a “bond” refers to a firm-level bond outstanding, or one bond per firm.

Alliances and Bonds Paper Three
105
below investment grade bonds benefit more than those of firms with investment grade
bonds; and secondly, bond holders of allying firms benefit from strategic alliances when
focal firms increase their level of financial leverage following the alliance formation.
However, I find at least one limit to the merger-alliance analogy. While prior
researchers have found a positive correlation between the organizational learning effects
from prior alliance experience and value creation for stock holders, I find no such
correlation between alliance experience and bond holder value creation.
The rest of the paper is organized as follows. In section 2, I develop in more
detail the theory that explains the merger-alliance analogy and propose five hypotheses.
In section 3, I explain the data and empirical methods used to test the hypotheses. In the
section 4 the results are shown, and in section 5 I provide a brief discussion of the
results and end with some conclusions about directions for future study.
2. THEORY AND HYPOTHESES
Table 1 presents some of the key theoretical and empirical studies that suggest
what I refer to as the “merger-alliance analogy”, which I define as the application of
theories describing the effects of asset combinations under mergers to asset
combinations under alliances4. The early finance literature (i.e. the studies that appear in
both the stock holder and bond holder columns of Table 1) developed the theoretical
foundations of how mergers affected the wealth of merging firms’ stock and bond
holders. Later researchers, in particular McConnell and Nantell (1985) applied the
merger-alliance analogy to study the effects of alliance announcements on stock holder
wealth. Most other studies that follow McConnell and Nantell imply the existence of the
analogy, but again they only study of the effects on stock prices. However, no study that
4 Like all analogies, some things are similar while others are different.

Alliances and Bonds Paper Three
106
I am aware of has extended this analogy to explain the effects of alliances on bond
prices.
Table 1: Key theoretical and empirical literature that suggest a “merger-alliance analogy”
Wealth effect Stock holders Bond holders
Literature
Mergers
(Theoretical
foundations)
Levy and Sarnat (1970)
Lewellen (1971)
Higgins and Schall (1975)
Galai and Masulis (1976)
Asquith and Kim (1982)
Levy and Sarnat (1970)
Lewellen (1971)
Higgins and Schall (1975)
Galai and Masulis (1976)
Asquith and Kim (1982)
Kim and McConnell (1977)
Billett, King, and Mauer (2004)
Penas and Unal (2004)
Alliances
(Empirical studies)
McConnell and Nantell (1985)
Koh and Venkatraman (1991)
Das, Sen, and Sengupta (1998)
Chan, et al (1997)
Anand and Khanna (2000)
Johnson and Houston (2000)
Can the merger-alliance analogy
extend the literature to describe the
effects of alliances on corporate
bonds?
2.1 Stocks and merger-alliance analogy
Two principal motives help explain the effect of merger announcements on stock
holder wealth (Jensen and Ruback, 1983; McConnell and Nantell, 1985). First, mergers
are driven by a “synergy creation” motive, such as increases in economies of scale,
gains from combining complementary assets, increases in market size and power,
increases in efficiencies in marketing and product distribution, and better deployment of
existing assets. The second is a “management displacement” motive, which are the
gains made by replacing the ineffective or inefficient management of the acquired firm.
However in a merger, isolating the effects of these two motives on stock holder wealth
can be empirically challenging.
Combining a subset of assets of two or more firms in an alliance, on the other
hand, provides an opportunity to separate the effects of the synergy motive from the
management displacement motive (McConnell and Nantell, 1985). McConnell and
Nantell (1985) show that the announcements of strategic alliances have similar effects

Alliances and Bonds Paper Three
107
on stock holder wealth as do announcements of mergers, with substantial positive
excess returns benefitting the stock investors of the allying firms. They are also of the
opinion that the gains to stock holders come from synergies created by the alliance.
Further empirical research has shown that the principal motive firms form
alliances is indeed to generate synergies (Johnson and Houston, 2000). Lack of synergy
creation under an alliance’s cooperative management is in fact a motive for alliance
dissolution or acquisition (divestment) of one partner’s share by (to) another. Such are
the internal tensions between partners and the external pressures between each firm and
its business environment that a lack of sustainable value creation for at least one of the
partners will lead to a renegotiation of the alliance agreement or its eventual break up
(Kogut, 1989; Ariño and de la Torre, 1998; Das and Teng, 2000a).
2.2 Bonds and merger-alliance analogy
The theoretical finance literature suggests that bond holders in corporate mergers
should experience significant positive wealth effects. Levy and Sarnat (1970), Lewellen
(1971), and Higgins and Schall (1975) argue that mergers increase bond holder wealth
through a financial effect called co-insurance. Simply stated, co-insurance is the
increase in value of outstanding bonds (1) because of the greater security offered by the
larger asset base of the merged firm, and more importantly (2) because the combination
of the imperfectly correlated cash flows of the two merging firms reduces the volatility
of the merged firm’s cash flows, which in turn reduces bond default probabilities. Co-
insurance thus effectively increases the debt capacity or ability of the merged firm to
support higher levels of financial leverage.
Galai and Masulis (1976) further argue that if the merger is non-synergistic,
bond holder’s wealth will increase by an amount that is exactly offset by the decrease in

Alliances and Bonds Paper Three
108
wealth of stock holders. If the aim of firm management is to protect stock holder wealth,
Kim and McConnell (1977) argue that firms would increase financial leverage after the
merger to offset the losses incurred by stock holders in order to expropriate back lost
wealth, effectively neutralizing the merger’s co-insurance effect. Other scholars have
also argued that because of the effects of coinsurance, the bond holders of firms with a
lower credit rating will benefit more from a merger because of an average decrease in
risk while firms with a higher credit rating will lose more because an average increase
in risk (Shastri, 1990; Dennis and McConnell, 1986; Billett, King, and Mauer, 2004).
Therefore, a merger-alliance analogy that describes the effects of alliance
formation on bond holder wealth should include the four effects discussed above that
are found in mergers, namely the coinsurance effect, credit rating effect, synergy effect,
and financial leverage effect. I do so in the following three points.
First, if we start by assuming that an alliance formation is non-synergistic and
that there are no expected changes in financial leverage, then just as the coinsurance
effect has a positive effect on the bond holder wealth of merging firms which combine
all their assets, we should also expect a positive effect on bond holder wealth of allying
firms which combine a subset of their assets5. The increase in bond holder wealth will
be accompanied by a concomitant decrease in stock holder wealth, i.e., a wealth transfer
between investor classes.
Furthermore, if we continue to assume a non-synergistic alliance and no
financial leverage, allying firms with bonds that have a lower credit rating will on
average experience an additional increase in their bond holder wealth. Allying firms
with bonds that have higher credit ratings, on the other hand, will on average experience
5 This assumes that allying firms contribute a significant part of their assets to the alliance. For example,
in a dyadic alliance in which the firms agree on an equal share of the alliance benefits, the greater the
portion of each firm’s assets that are shared in the alliance, the greater will be the coinsurance effect on
the bonds of these firms.

Alliances and Bonds Paper Three
109
a decrease in their bond holder wealth. In sum, assuming non-synergistic alliances, the
group of allying firms with lower credit rating will experience positive coinsurance and
positive credit rating effects, while group of allying firms with higher credit rating will
experience positive coinsurance and negative credit rating effects.
Second, if we believe that alliance formations are synergistic and still with no
changes in financial leverage, then for stock holders to whom will accrue the positive
wealth effects of the synergies, there will be some compensation for negative
coinsurance effects of the alliance. The stock holders of allying firms should therefore
experience on average either a net positive or net negative wealth effect. For the bond
holders of allying firms, regardless whether or not they receive any synergy benefits6,
the positive coinsurance effects should mean that the net wealth effect for this class of
investors is either net positive or zero. Given the empirical evidence that support the
synergy creation motive of alliances (McConnell and Nantell, 1985; Johnson and
Houston, 2000), we should expect that there is at a non-negative effect on bond holder
wealth when alliances are announced. The net effects on investor wealth discussed so
far can be summarized in Table A.
Table A: The net wealth effects of coinsurance, credit rating and synergy
given that alliances are synergistic
Bond holder wealth Stock holder wealth
Higher relative
credit rating
Coinsurance effect +
Credit rating effect +
Synergy effect 0 Coinsurance effect –
Credit rating effect 0
Synergy effect + Lower relative
credit rating
Coinsurance effect +
Credit rating effect –
Synergy effect 0
6 In general, bond holders should not expect to receive any of the benefits of synergy. I discuss this in a
little more detail in Paper One of this dissertation in the section on DCF applications to alliances.

Alliances and Bonds Paper Three
110
Thus in the absence of transfers of wealth between stock and bond holders
because of synergies, and given the large body of evidence that stock holders on
average benefit from strategic alliance formations, I hypothesize the following:
Hypothesis 1: Strategic alliances create value for both stock and bond holders of the
same firm.
Hypothesis 2: Strategic alliances create more value for bond holders of firms with
lower credit rated bonds than those with higher credit rated bonds.
Third, in general financial leverage has a positive effect on stock holder wealth
because of the tax benefits of debt and a neutral effect on bond holder wealth so long at
the level of leverage is not too high. However, if the financial leverage of a firm is high,
then as in mergers, bonds of a highly leveraged firm forming an alliance should
experience a reduction in default risk when combining it is assets with a less leveraged
firm and are therefore expected to experience a positive wealth effect, while bonds of
the less leveraged firm should experience a negative wealth effect (Billett, King, and
Mauer, 2004). I thus hypothesize as follows:
Hypothesis 3: High levels of firm leverage at the announcement of an alliance will be
positively correlated with the value creation for bond holders.
Forming an alliance may be a positive signal to investors of improvements in the
future growth and cash flows of the firm. This would mean an increase in its ability to

Alliances and Bonds Paper Three
111
support more debt financing, i.e., increased debt capacity. If investors foresee this, bond
values will rise. Hence I hypothesize as follows:
Hypothesis 4: Positive changes in the level of firm leverage after forming a strategic
alliance will be positively correlated with value creation for bond holders.
While the previous four hypotheses focus on finance related aspects of how
bond holder wealth may be affected by alliance formations, previous research from the
strategy literature has shown the prior alliance experience affects the performance of
firms’ stock returns (Anand and Khanna, 2000). The question that arises then, is does
the merger-alliance analogy extend to include these organizational learning effects as
well? The next section looks at this question.
2.3 Organizational learning and bond holder wealth
In all organizations, new knowledge enables experimentation and innovation,
which brings renewal and opportunities to increase competitiveness (Inkpen, 1998). The
competitive advantage of firms rests on their ability to create new knowledge (Kogut
and Zander, 1992). Because of these competitive pressures, firms may turn to their
alliance partners as a source of new knowledge (Sampson, 2007). Knowledge acquired
from alliances can be used for mutual benefit of the alliance but also private benefits
outside the alliance (Khanna, 1998; Kumar, 2010a). Alliances can therefore be as much
a source of gaining competitive advantage as of losing it, giving rise to learning races
between alliance partners (Khanna, Gulati, and Nohria, 1994).
However, firm’s that have a greater ability to learn from their alliance partners,
i.e., superior alliance capability, will not only tend to win these races but also have

Alliances and Bonds Paper Three
112
greater ability to take advantage of the knowledge acquired for their private benefit.
Additionally, while knowledge resource complementarity is in itself important for
creating alliance synergies, the effective integration and management of the shared
resources is even more important to realize the synergies intended (Harrison, et al,
2001). Thus the building of alliance capability through an alliance learning process that
involves articulation, codification, sharing and internalization of the know-how required
to manage alliances is an important avenue through which firms maintain competitive
advantage (Kale and Singh, 2007; Heimeriks and Duysters, 2007). As well as having a
dedicated alliance management function within the firm, alliance capability is
developed as firms gain experience forming alliances (Anand and Khanna, 2000).
As a cooperative agreement, firms have a choice of the resources and knowledge
they commit and share with their alliance partners. As some cooperative agreements
such as equity joint ventures tend to require a closer collaboration and a firmer
commitment, the resources and knowledge committed should be subject to fewer
restrictions than other forms of alliances such as a licensing agreement. However, on the
whole, we should expect that the more alliance experience a firm has, the more will be
the benefits achieved from subsequent alliances.
The benefits of learning from alliances as well as the increased ability to learn
because of alliance experience are synergies that positively affect all investors of the
firm, not only through increased future opportunities and greater competitiveness, but
also greater financial ability to generate future cash flows and service higher levels of
debt. Accordingly I propose the final hypothesis.
Hypothesis 5: Learning effects from strategic alliance experience creates more value
for bond holders in alliances with greater resource commitment such as joint ventures.

Alliances and Bonds Paper Three
113
The five hypotheses, if supported, will be evidence that bond holders are
affected in the same way as stock holders. If true, they will also help extend the merger-
alliance analogy to include bond holders.
3. DATA AND METHODS
3.1 Data
Sources: My sample is built from merging together data from five different data base
sources: TRACE US Corporate bond data, Mergent FISD bond issue data7, SDC
Platinum alliance data, CRSP stock prices, and COMPUSTAT firm-level data. I limit to
US based alliances by industrial firms that have issued US dollar dominated corporate
bonds. The period of data is from 1 July 2002 until 31 December 2007. The starting
date coincides with the beginning of the TRACE bond data and the ending date is
chosen to avoid the events of the 2008 global financial crisis.
Defining Partner A vs. Partner B: The main empirical objective of this paper is to
investigate whether firms that form alliances create or destroy value for their bond
holders. In order to ensure that the value created (or destroyed) for bond holders is not
transferred to or from either the stock holders of the same firm or the stock or bond
holders of the partner firm, I need to statistically test for possible value transfers
between these asset groups (see Tests for Value Creation vs. Value Transfer)
Few alliances involve firms with outstanding corporate bonds and even fewer
still involve firms in which more than one of the partner firms in the alliance have
outstanding bonds. Each observation of my sample is a single alliance announcement
7 “FISD” stands for the Fixed Income Securities Database provided by Mergent.
Alliances and Bonds Paper Three
114
containing data for “Partner A” firms and “Partner B” firms. I select all “Partner A”
firms to have valid return data for both their stocks and bonds, while “Partner B” firms
usually only have valid stock data. After employing data cleaning routines described
below, the final Partner A sample contains 725 firm-events or alliance announcements,
while the final Partner B sample contains 262 firm-events. There are only 22
observations in which both Partner A and B have valid stock and bond data, and only 5
observations which involve more than two alliance partners (i.e. partners A, B, and C)
and for which I have valid return data.
Of the 725 announcements, all 725 firms have outstanding stock that trade daily.
However very few bonds trade daily, reducing the sample of bond returns to 467
observations (on Day 0, which is used for regression analysis). Removing those firms
with no valid firm-level data, the bond sample size reduces further to 435 observations.
Data Cleaning: Prior research has reported problems with the accuracy of the alliance
announcement dates reported in the SDC Platinum Alliance database (Anand and
Khanna, 2000; Schilling, 2009). For the alliance announcement dates in my sample, I
cross-checked against Lexis-Nexis and if there was a disagreement in the dates I used
the earliest one between the two data sources, which meant usually deferring to the
media source within Lexis-Nexis. For other data items such as SIC codes and types of
alliance, I used what was reported in SDC given that this data is for the most part quite
accurate (Anand and Khanna, 2000).
Also using Lexis-Nexis, confounding events during the event window meant
that certain alliance announcement observations had to be discarded. These events
included the firm’s financing events (dividend announcements, seasoned issues, stock
splits, etc), strategic events (merger announcement, multiple alliance announcements,

Alliances and Bonds Paper Three
115
changes in senior management positions, etc), and major operational events (major new
project announcements, major customer changes, earnings announcements, etc).
Bond return data: As the principal results of this study hinge on the analysis and
interpretation of corporate bond return data I provide a more detailed explanation about
how this data was prepared. Unlike stock return data which is easily available through
WRDS and CRSP, firm-level bond return data needs to be assembled and calculated
separately. Given the particular nature and trading characteristics of corporate bonds,
such as thin trading, a market dominated by institutional investors, multiple issues by
the same firm, non-fungibility8, limited maturity, etc, certain adjustments need to be
made in the procedure, as will be discussed in some detail here.
Reliable and publicly accessible US corporate bond data is now available via
WRDS in the TRACE9 fixed income database. TRACE’s data coverage began on 1 July
2002 and by 2004 extended to include over 99% of all corporate bond trades
representing 95% of traded dollar value (Glushkov, 2007). The Mergent FISD provides
complementary bond issue information, such as coupon rates and credit rating histories
for example, that is not as available in TRACE.
The initial intersection of the TRACE, SDC, and FISD databases yields more
than 8000 strategic alliances in which at least one of the partners had bond data in
TRACE. To be included in the Partner A sample, I followed criteria similar to those
8 Common stocks of a firm, for example, are fungible because each share is exchangeable for another,
whether bought at IPO or in a seasoned issue or through the secondary market. Different bond issues,
however, may not be interchangeable with other issues even by the same firm as each issue differs in
seniority, coupon rate, maturity, credit rating, etc, which means that they are not completely fungible. 9 TRACE is the Trade Reporting and Compliance Engine and is available through the Wharton Research
Data Service (WRDS). Its purpose is to increase transparency in the corporate bond, agency bond, asset-
backed and mortgage-backed securities markets through the accurate and timely distribution of fixed
income data, including real-time dealer price quotes, trade volumes, yield offers, etc. In January 2001, the
SEC approved rules that obliged all US corporate bond over-the-counter (OTC) secondary market trading
to be reported through TRACE. It is owned and operated by FINRA, the Financial Industry Regulatory
Authority, the largest regulator for all securities firms doing business with the US public (TRACE
Factbook, 2011).

Alliances and Bonds Paper Three
116
used by Bessembinder, Kahle, Maxwell, and Xu (2009) and Elton, Gruber, Agrawal,
and Mann (2001): (a) Only bonds issued by industrial firms are included; (b) Only
straight coupon and variable coupon rate bonds are included, eliminating those with
special features for example, bonds that are putable, callable, sinking fund, index bonds,
etc; (c) Daily observations with an absolute value of returns greater than 20% are
excluded; (d) All bonds must have a corresponding credit rating and maturity index
amongst the Barclays Capital (formerly Lehman Brothers) corporate bond indices.
There are several empirical challenges conducting an event study on corporate
bonds (see Bessembinder, et al, 2009) that require certain adjustments to the standard
event study methodology. First is the problem of thin trading. Unlike equities which
trade almost daily, bonds trade at a wide range of frequencies. Some large issues may
trade daily, but the majority of issues do not. Furthermore, unlike stock trading, bond
trading is dominated by institutional or large investors resulting in wide range of prices
depending on dollar volume of trades. The lack of liquidity in the bond market requires
care in calculating the abnormal returns required for the event study. Secondly, unlike
equities where each firm typically has only one outstanding issue, firms often have
multiple bond issues each with its own return series. For the purposes of this study, I
combine abnormal bond returns of multiple issues from the same firm into a single
value-weighted abnormal bond return (following Bessembinder et al, 2009; Billett,
King, and Mauer, 2004). Thirdly, unlike stocks which are theoretically perpetual assets,
the time to maturity of bond issues progressively decreases, such that their value is less
sensitive to risk factors10
. Finally, while daily trade data is the norm in equities, earlier
research using bond data has been typically with monthly data. Since the advent of the
TRACE fixed income database, daily trade data is now easily available to researchers.
10
To illustrate, where present value of future cash flow (PVFCF) = FCF/(1+discount rate)t and t is the
time to maturity of the bond, PVFCF becomes less sensitive to changes in the discount rate as t decreases.

Alliances and Bonds Paper Three
117
Using daily bond data significantly increases the power of statistical tests to detect
shocks (Bessembinder, et al, 2009).
I use daily TRACE data for this paper, implementing several “TRACE cleaning”
routines suggested by Bessembinder and colleagues11
. These include eliminating non-
institutional trades and building daily trade-weighted bond prices for each issue’s time
series, which I use to calculate the issue’s returns series. To check robustness, I use
three different amounts to define the magnitude of institutional trades, starting from as
low as $10,000, then $50,000 and finally $100,000, which is what Bessembinder et al,
use. The results I show are based on the $100,000 definition. Access to the Mergent
FISD database12
allows me to calculate the actual daily bond returns as described in
Bessembinder et al (2009: 4226):
(1)
where AI is the accrued interest and Pit is the bond price for issue i on day t. Accrued
interest is the coupon interest that is owing to the bondholder but not yet paid since the
last coupon date. Since trade prices are in practice quoted as “clean prices” (i.e. P),
adding the accrued interest is closer to the actual price received by the bond seller (i.e.
“dirty price”). In order to calculate a return, valid prices on two consecutive trading
days are required. Due to thin trading, the number of calculable bond returns is
substantially less than the trades made.
11
See Footnote 7 of Bessembinder, et al (2009). It refers to a SAS program used for bond data cleaning. I
introduce improvements to correct errors in the original program, which include inadvertently deleting
some observations, not deleting other observations, and inappropriately excluding some trades. The
improved program is available on email request. 12
I would like to acknowledge and thank the School of Banking and Finance at the Australian School of
Business, University of New South Wales, for giving me access to their extensive database services.

Alliances and Bonds Paper Three
118
3.2 Empirical methods
Event Study: For the stock event study around the event day, defined as day 0, I use the
standard event study method with a 255 day estimation period ending 15 days prior to
event day, followed by a 5 day gap period, and then a 21 day event period or window (-
10, +10). I use a standard SAS program with adjustments available through WRDS
(Glushkov, 2011) and use the market model estimation method.
For the bond event study, I use the standard methodology with the following
adjustments (see Boehmer, Broussard, and Kallunki, 2002). I estimate the model
parameters for each bond issue over a 126 trading day estimation period ending 15 days
prior to the announcement date of the alliance followed by a 5 day gap period. I use a
matched portfolio model according to equation (2) (following Elton, et al, 2001; and
Bessembinder, et al, 2009), where BRit is the actual bond return on day t, αi0 and αi1 are
the issue-specific model parameters to be estimated, MatchedIndexit is the Barclays
Capital bond index that was matched with the bond issue according to similar credit
rating and time to maturity, and is the error term that is assumed to be i.i.d normal
with zero mean. Because of infrequent trading of corporate bonds, there may be
concerns over the quality of the abnormal return estimates of the event period because
of potentially poor quality parameter estimates that are based on infrequent return data
during the estimation period. To allay this concern, like Bessembinder, et al (2009), I
discard bond issues that had less than 10 trades in the last 20 days of the bond’s
estimation period13
. During the estimation, I obtained a corresponding estimate of the
variance for each issue, which I later used for hypothesis testing.
13
To be clear, the key time points of the set up are: -20, -15, -10, 0, and 10 days in event time which
correspond to: the start of the last 20 days in the estimation period during which there needs to be 10 or
more trades for the issue to considered valid, the start of the gap period, the start of the event period, the
event day when the alliance is announced, and the end of the event period.

Alliances and Bonds Paper Three
119
(2)
In the 21 day event period (-10, +10), I calculate the excess or abnormal returns
for each issue according to equation (3), where ARit is the abnormal return of bond issue
i on day t, and and are the estimates of the parameters.
(3)
For firms with multiple bond issues, I combine the issues of the same firm into a
value-weighted portfolio to make one firm-bond. I calculate the combined portfolio
variance according to standard portfolio theory assuming a correlation coefficient of 1
(see Brealey, Myers, and Allen, 2008). As a result, all bonds in the sample can be
considered firm-bond issues, i.e., one bond per firm.
CAR vs. Daily AR vs. Pooled AR: In order to calculate a cumulated abnormal return
(CAR), it is necessary to have a non-missing AR on each consecutive day of the CAR
window. However, because of the infrequent trading of bonds, this is usually not
possible for the full 21 day event window. In my sample, about one third of the bonds
do not have return data on any one trading day during the event window, and if the
missing returns on days of no trading were replaced with zero return values, the return
distribution will be radically distorted. Although short CAR windows, for example (-2,
2) or (-1, 1) are possible, once again there is the problem of interpreting results based on
a substantially reduced sample observations. In sum, although some results using CAR
as a measure for performance are provided for robustness, these are not considered the
main ones. Instead, in this study I use daily abnormal returns (Daily AR) and pooled
abnormal returns (Pooled AR) of several days for hypothesis testing.

Alliances and Bonds Paper Three
120
Tests for Value Creation vs. Value Transfers: To test whether Partner A bond holders
benefit from the value creation effects of strategic alliances, I need to ensure that (1)
value is not being transferred from the Partner A stock holders of the same firm (intra-
firm transfers); (2) value is not being transferred from its alliance partner, Partner B’s
stock holders (inter-firm transfers); and (3) value is being created contemporaneously
and not simply across the entire cross-section of firm-bonds (contemporaneous
transfers). To test for these conditions, I estimate the regression equation given in
equation (4) that links the abnormal returns of each of these three investor groups.
(4)
where AR( . , t) is are the abnormal returns of the Partner A bond in the sample,
Partner A stock sample, and Partner B stock sample, while β1 and β2 are the
respective coefficients estimated using OLS.
How should these coefficient estimates be interpreted? If the average abnormal
return of bond A is positive and significantly different from zero and β1 > 0, then the
abnormal returns of the stock and bond holders of Partner A are correlated and the
alliance deals can be considered in general to be value creating for both stock and bond
holders of Partner A. If however, β1 < 0, then the stock and bond returns of Partner A
would be moving in opposite directions to each other, in which case would be evidence
of value transfer between stock and bond holders.
If again the average abnormal return of bond A is positive and significantly
different from zero and β2 > 0, then the alliance announcements are causing abnormal
returns of Partners A and B to move in the same direction and can be considered value
creating for both partners. However, if β2 < 0, then the returns of Partners A and B
would be moving opposite directions which would imply that either value is being

Alliances and Bonds Paper Three
121
transferred between the two partners’ investors or there is an unequal sharing of value in
the value creation of the alliance.
Cross-sectional analysis of bond returns: In order to explain the effects of strategic
alliance announcements on abnormal returns on bonds, I estimate the cross-sectional
regression given in equation (7).
= γ0
+ γ 1 (Credit rating dummy: Non-investment = 1)
+ γ 2 (Financial leverage ratio prior to alliance)
+ γ 3 (Change in leverage over -1, +1 years)
+ γ 4 (Alliance experience by alliance type in past 6 years)
+ γ 5 (Control: Book Value of assets, Market to Book Value)
+ γ 6 (Control: Relative Size)
+ γ 7 (Other Controls: Year of Alliance, Alliance Industry, Firm) (7)
Credit Rating: I define the dummy variable Non Investment Grade that takes
the value 1 if the alliance one has a Moody’s credit rating of Ba1 or lower, or 0
otherwise. According to Hypothesis 2, a positive coefficient estimate is expected.
Leverage ratio: Leverage ratio is defined as the fiscal year-end ratio of book
value of debt to total firm value (Ghosh and Jain, 2000). The book value of debt is equal
to the sum of book value of long-term debt and the debt in current liabilities. Total firm
value is defined as sum of the book value of debt and the market value of equity. I
calculate this ratio with the fiscal year-end data one year prior to the alliance
announcement. A positive co-efficient estimate is predicted.
Change in leverage: Two definitions are used to test this variable. The first is
the difference between the leverage ratio one year after the alliance formation and the
leverage ratio one year before all divided by the leverage ratio one year before. The

Alliances and Bonds Paper Three
122
second definition is the leverage ratio one year after the alliance announcement divided
by the leverage ratio one year before. A positive coefficient estimate is expected.
Alliance experience: Anand and Khanna (2000) find that experience from prior
strategic alliance experience significantly explains the returns of stocks following the
alliance announcement. The number of prior alliances includes those in the past 6 years
to the focal alliance. A longer period of experience could have been chosen, although
this may call to question the relevance of alliance experience measured further in time
from the focal event. I calculate a separate experience variable for each of the three
alliance contract types, namely Joint Ventures, Strategic Alliances, and Licensing
Agreements.
Controls: Since larger firms have more resources, they may have a stronger co-
insurance effect, hence I control for the firm size effects with the book value of assets in
the fiscal year-end prior to the alliance announcement.
Firms with a higher market to book ratio have greater growth opportunities and
hence greater potential for synergy creation in an alliance, hence I control for market to
book ratio, where market value is the market value of outstanding common and
preferred shares.
As smaller partners of an alliance may benefit relatively more than the larger
partner, I control for relative size effects with the ratio of the Partner B firm’s total
assets divided Partner A’s total assets.
I control for the year, industry of the alliance, and firm fixed effects. I use the
Fama French 49 Industries to categorize the industry of the alliance.

Alliances and Bonds Paper Three
123
4. RESULTS
4.1 Descriptive results
Table 2a provides details of the number of alliances carried out in the full
sample of 725 Partner A firm-alliance announcements. IBM Corp has the most number
of alliance announcements with 55 alliances in the sample during the sample period
representing 7.7% of the entire sample. The top 10 and top 20 firms each make up 39%
and 52% (268 and 364 announcements) respectively of the full sample while the last
100 firms make up 14% (100 announcements) of the sample. Tables 2b and 2c provide
further descriptive details about the nature of the strategic alliances involved.
Table 2a: Alliance announcements by the top 10 firms for Partner A sample (Jul 2002 to Dec 2007)
The full sample consists of Partner A alliance announcements made by 185 unique firms. Each of the firms has outstanding bonds that trade on at least one day during the event period (-10, 10). Although I report 725 observations with alliance announcements in the period, three have missing data in various parts of the analysis.
Number of alliance Announcements
Portion of sample
Firm Name CUSIP6
55 7.68% IBM Corp 459200
45 6.28% Merck & Co Inc 589331
37 5.17% Motorola Inc 620076
31 4.33% Pfizer Inc 717081
24 3.35% Bristol-Myers Squibb Co 110122
23 3.21% Hewlett Packard Co 428236
14 1.96% Cisco Systems Inc 17275R
14 1.96% DuPont 263534
13 1.82% Lockheed Martin Corp 539830
12 1.68% Lucent Technologies Inc 549463
457 60.9% (others)
TOTAL: 725 100.0%
Table 2b: Strategic alliance announcements by year and type
As the TRACE bond database began on 1 July 2002 and an estimation period of 126 trading days was used to estimate the model parameters, the earliest alliance announcements began in 2003.
Year Announced Strategic Alliance Joint Venture Licensing
2003 78 6 14
2004 61 12 22
2005 116 14 36
2006 128 24 31
2007 136 16 31
TOTAL 519 72 134

Alliances and Bonds Paper Three
124
Table 2c: Strategic alliance announcements by industry and type
The industries are based on the Fama French 49 industries definitions.
Industries Strategic Alliances Joint Ventures Licensing
Business services 207 6 50
Computer Software 137 1 6
Wholesale 50 2 7
Telecommunication 23 1 .
Electronic equipment 20 4 .
Pharmaceutical products 10 1 3
Autos 9 8 .
Retail 8 . 1
Petroleum and natural gas 7 1 .
Entertainment 6 . 1
Real estate 3 1 .
Restaurants, hotel, motel 3 5 .
Apparel 2 . .
Chemicals 2 13 .
Computers 2 1 .
Others 30 28 66
TOTAL 519 72 134
4.2 Event study results
Table 3 shows the parallel event study results of daily abnormal returns (AR) of
Partner A bonds and stocks and Partner B stocks for each event day during the 21 day
event period window (-10, 10). Comparing the daily sample sizes of the three asset
groups shows that almost all 725 Partner A and 262 Partner B stocks trade daily. The
sample of Partner A bonds is between 422 and 467 observations, however the reality is
that the sample composition changes significantly each day reflecting the fact that
corporate bonds trade less frequently than the stocks of the same firms.
For the Partner A bonds, there appears to be some evidence of leakage of
information prior to the event day with positive and significant abnormal returns on day
-3 for both the mean and median estimates (0.115 bp14
with p<.05 and 2.753 bp p<.05).
Also on day -3, this same leakage seems to be reflected in the opposite direction for the
14
One “bp” or basis point is equal to one hundredth of one percent, i.e. 1 bp = 0.01% = 0.0001.

Alliances and Bonds Paper Three
125
Partner B stocks registering negative and significant mean and median returns (-37.133
bp with p<.05 and -25.014 bp with p<.05).
Hypothesis 1: The most significant result of Table 3 is the simultaneously
positive and highly significant cross-sectional abnormal returns on day 0 for Partner A
bonds, Partner A stocks, and Partner B stocks with respective means of 8.5 bp, 38.9 bp,
and 267.3 bp all significant at p<.001 with medians of 3.4 bp, 11.8 bp, and 52.8 bp
respectively. The stock reactions of the Partner A and Partner B firms are on the low
and high side respectively compared with earlier studies. For instance, McConnell and
Nantell (1985), Chan, et al (1997), Anand and Khanna (2000) obtain 74 bp, 64 bp, and
67 bp respectively for their full samples means.
One explanation for the difference in means with earlier studies is firm size. In
order to issue corporate bonds at reasonable interest rates, issuers, which include all the
Partner A firms, tend to be larger and more stable firms. Large firms tend to have a
lower abnormal return market reaction but a much higher dollar return, while smaller
firms show the reverse pattern (see McConnell and Nantell, 1985: 531). Looking at
Panel A of Table 6 confirms this. Partner A firms have a high dollar return market
reaction of 79.7 million dollars on day 0 (but a relatively low abnormal return), while
Partner B firms have a comparatively low dollar reaction of only 22.5 million dollars
(but a high abnormal return). These dollar reactions can be compared with Anand and
Khanna (2000: 305) which reports a mean dollar reaction of 44 million dollars (and a
mid-range abnormal reaction) for their sample of joint ventures whose parent firms may
or may not have had outstanding bonds.
These results lend some support to Hypothesis 1 which argues that the formation
of strategic alliances will be beneficial for both stock and bond holders of allying firms,

Alliances and Bonds Paper Three
126
but it is not conclusive. It is possible that the Partner A bond and Partner A stock means
are cross-sectionally positive and significant on a particular event day, but anti-
correlated within each pair of same firm bond and stock abnormal returns, implying a
transfer of value between different investor classes of the same firm. Furthermore,
Partner A and Partner B investors may be benefitting differently from the alliance.
The regression shown in equation (4) tests for these possibilities and the results
are shown the last three columns of Table 3. The positive and highly significant β1 on
many days of the event window indicate that the Partner A bond and stock abnormal
returns are moving in the same direction. This is stronger evidence in support of
Hypothesis 1, that strategic alliances create value for both stock and bond holders of the
same firm. However, the estimates of β2 are insignificant on most days of the event
window except on day 0.
For robustness, Table 5 presents results based on cumulative abnormal returns
(CAR) in a similar parallel event study to that shown in Panel A of Table 4. In all tests,
only β1 is positive and significant while β2 is statistically not different from zero. For
reasons explained earlier, these results are less reliable due to loss of observations in
working with CAR, however, the results still support Hypothesis 1.
Hypothesis 2: Panel A of Table 4 provides the same parallel event study as
Table 3 but for pooled abnormal returns. The regression coefficient estimates in the last
three columns of the table show a common pattern of statistically significant and
positive β1 and negative β2. However, when splitting the full sample into sub-samples
according to the Moody’s investment grade credit rating of the Partner A bond as I do in
Panels B1 and B2 of Table 4, only statistically significant and positive β1 are found in
the non-investment grade group (Panel B2), while only statistically significant and

Alliances and Bonds Paper Three
127
negative β2 are found in the investment grade group (Panel B1). This is evidence that
credit rating makes a difference to bond holder returns on the formation of an alliance.
Focusing on Panel B1 of Table 4, Partner A bonds and Partner A stock still show
positive and significant pooled abnormal returns, although these returns are not
significantly correlated as indicate by the insignificant coefficient β1 estimate. On the
other hand, the significant negative β2 coefficients and significant positive means for
Partner A bonds and Partner B stock together indicate that Partner B stock is earning
much more relative to Partner A bonds, hence the negative sign on the coefficient. I
conclude that for allying firms with investment grade bonds, value is created for both
stock and bond holders of those firms. Furthermore, the strategic alliance creates much
more value in terms of abnormal returns for Partner B stock holders than Partner A
stock holders due to a relative size effect, as described above.
Looking at Panel B2 of Table 4 and in particular AR(0,0) corresponding to day 0
in event time, Partner A bonds and stocks and Partner B stocks all have positive and
significant mean and median abnormal returns as well as positive and significant β1
estimates. Again I conclude that for allying firms with non-investment grade bonds,
value is created for both stock and bond holders of those firms on the alliance
announcement day. However, the β2 coefficient is insignificant, indicating that the
strategic alliance again creates value for both Partner A and Partner B investor, although
the value creation is not correlated.
Panels B1 and B2 of Table 6 show the corresponding dollar gains for the sub-
samples by investment grade. For Partner A firms with investment grade bonds, bond

Alliances and Bonds Paper Three
128
holders lose money by an average of 1.2 million dollars (median 0.70 million dollars)15
,
while those with non-investment grade bonds benefit significantly with an average gain
of 7.6 million dollars (median 0.95 million dollars).
In sum, compared with non-investment grade bonds, investment grade bonds
display smaller abnormal returns and smaller dollar returns. Taken together, the
evidence strongly confirms Hypothesis 2.
4.3 Regression Results
Tables 7a and 7b provide the results of multivariate regression model expressed
in equation (7). Table 7a presents the leverage effects on Partner A abnormal bond
returns, and Table 7b presents the organizational learning effects.
Hypothesis 3: In Table 7a, Model 1 is the full sample model of 435 firm-bond
abnormal return observations controlling for year and industry fixed effects but not firm
fixed effects. The positive and significant coefficient for Credit Rating once again
confirms Hypothesis 2. However, the negative and significant coefficient for Leverage
Ratio (-0.0125, p<.001) is the opposite of what is predicted in Hypothesis 3. Model 2 is
the same as model 1 but controls for relative size between the Partner B and Partner A
firms. It also shows the same negative correlation for the coefficient on Leverage Ratio
as model 1. However, in models 3 and 4, which control for firm fixed effects, the
Leverage Ratio coefficient estimate becomes insignificant. Table 7b shows that across
all three models, the estimated coefficients on Leverage Ratio are also consistently the
opposite of what is predicted by Hypothesis 3, although these models do not control for
15
That the median of the dollar gain of investment grade bonds is positive and that the sample contains
large firms that skew the mean together suggest that the mean is actually not significantly different from
zero.

Alliances and Bonds Paper Three
129
firm fixed effects. Given this fairly consistent result, especially when not controlling for
firm fixed effects, it would seem that either the statistical model is incorrectly specified
or in fact the opposite of Hypothesis 3 is the case; that high levels of leverage of firms
that form alliance is seen by bond investors as an increase in risk for these firms,
decreasing the value of bonds.
Hypothesis 4: Model 1 in Table 7a is the only model to show that the Change in
Leverage Ratio is positive and statistically significant (0.00347, p<.01). This is at best
weak evidence that supports Hypothesis 4.
Controlling for firm fixed effects seems to have a strong effect on the results as
reflected, amongst other things, in the dramatic change in the R-squared values of
models 1 and 3. Other models (not shown) were also shown to be “adversely” affected
by the addition of this control variable. Further investigation is required.
Hypothesis 5: None of the models of Table 7b show that learning effects from
prior alliances had an effect on bond abnormal returns. I conclude that there is no
support for Hypothesis 5.
5. DISCUSSION & FURTHER RESEARCH
Hypothesis 3 predicted that because of coinsurance effects high levels of firm
leverage would be correlated with positive increases in bond holder returns on the
announcement of alliances, but the results revealed otherwise. An interesting
explanation for this could be that what is happening here is not really a coinsurance
effect, but rather a trade-off theory effect (Myer, 1977; Brealey et al, 2008). Trade-off
theory says that firms will increase their level of debt to the point where the marginal
tax benefits due to debt will be traded for the marginal losses due to financial distress, at
which point the firm will maximize its overall value. Increasing debt levels beyond this

Alliances and Bonds Paper Three
130
point (ceteris paribus) means that debt holders will be put more at risk, which leads to a
reduction in debt value and therefore firm value. What may be happening when a firm
announces its new alliance is that the bond investors sees that the alliance will require
more investment which, in the absence of increasing equity, risky debt will have to be
issued putting more strain on the debt capacity of the firm. In other words, while the
alliance announcement of highly leveraged firms may be beneficial for stock holders, it
is not for existing and future bond holders.
I follow this line of thought a bit further. Because of the growth options that
come from alliances (Reuer and Tong, 2010; Kogut, 1991; Chi, 2000) and the fact that
the market value of equity and debt is equal to the sum of the value of the assets in place
(AiP) and the growth opportunities (GO), i.e. E + D = VAiP + VGO (Myer, 1977), what
may be happening is that firms with high levels of debt are actually unable to invest in
the growth opportunities or real options that the alliance would otherwise bring them
because of its cash constraints. As investors foresee this constraint, debt becomes more
risky if the firm goes ahead with the alliance. This may explain the results that are
contrary to the prediction of Hypothesis 3. Further research on this point may reveal
some interesting findings16
.
Hypothesis 5 predicted that organizational learning from alliance experience
would positively affect bond holder returns, however this was not supported. One
possible explanation for this is that while strategic factors such as the development of
knowledge assets or firm capabilities are beneficial for stock holder wealth, they are not
directly beneficial for bond holder wealth. Development of strategic assets that
strengthen competitive advantage affect the growth options of the firm, and these
benefits go to stock holders (in the absence of the risks of high leverage discussed
16
I elaborate further on this point in the Research Gap 2b discussed in Paper One of this dissertation.

Alliances and Bonds Paper Three
131
above). Bond holders are only affected indirectly in so far as debt is made less risky or
the firm’s debt capacity has increased. The difference is because stock holders are
residual income owners of the firm, while bond holders are fixed-income owners of the
firm and senior claimants to the firm’s assets in the event of bankruptcy. In sum, the
merger-alliance analogy seems only to be extendable at describing the effect of alliance
formation on bonds in so far as how alliances affect the credit risk and debt capacity
aspects of the firm. Strategic factors such as alliance capability and organizational
learning capability, on the other hand, are explained by the merger-alliance analogy for
stocks. Further investigation using other strategic variables as explanatory variables of
bond returns following alliance announcements may be able to verify this limitation of
the merger-alliance analogy.
6. CONCLUSION
Based on theories of coinsurance that predict the effects of mergers on corporate
bonds, I have argued that the merger-alliance analogy that was used to describe the
effects of alliance formation on stock holder wealth can be extended to explain the
effects of alliance formation on bond holder wealth. Through the results of an event
study and regression analysis there is (1) strong evidence suggesting that the formation
of strategic alliances creates value for both bond and stock holders of the same firm; (2)
strong evidence to say that bond holders of allying firms with below investment grade
bonds benefit more than bond holders of firms with investment grade bonds; and (3)
some evidence to show that bond holders of firms that form alliances benefit when these
firms have positive changes in the level of financial leverage following the alliance
formation.

Alliances and Bonds Paper Three
132
However, there seems to be a limit to how far the merger-alliance can explain
bond holder reactions to alliance formations. Unlike the known positive effects that
organizational learning from prior alliance experience has on stock holder wealth, it
appears that alliance experience has no effect on bond holder wealth. This could be
because of differences in the seniority claims between stock and bond holders. Stock
holder wealth is affected more by changes in strategic factors while bond holder wealth
is affected more by firm risk and debt capacity related factors.

Alliances and Bonds Paper Three
133
7. REFERENCES
Anand, B. N., & Khanna, T. 2000. Do firms learn to create value? the case of alliances. Strategic
Management Journal, 21(3, Special Issue: Strategic Networks): 295-315.
Amici, A., Fiordelisi, F., Masala, F., Ricci, O., & Sist, F. 2013. Value creation in banking through
strategic alliances and joint ventures. Journal of Banking & Finance, 37(5): 1386-1396.
Ariño, A., & Torre, J. d. l. 1998. Learning from failure: Towards an evolutionary model of collaborative
ventures. Organization Science, 9(3, Special Issue: Managing Partnerships and Strategic
Alliances): 306-325.
Asquith, P., & Kim, E. H. 1982. The impact of merger bids on the participating firms' security holders.
The Journal of Finance, 37(5): pp. 1209-1228.
Bessembinder, H., Kahle, K. M., Maxwell, W. F., & Xu, D. 2009. Measuring abnormal bond performance
Review of Financial Studies, 22(10): 4219-4258.
Bessembinder, H., Maxwell, W. F. 2008. Markets: Transparency and the Corporate Bond Market Journal
of Economic Perspectives, 22(2): 217-234
Billett, M. T., King, T. D., & Mauer, D. C. 2004. Bondholder wealth effects in mergers and acquisitions:
New evidence from the 1980s and 1990s. The Journal of Finance, 59(1): pp. 107-135.
Boehmer, E., Broussard, J. P., & Kallunki, J. 2002. Using SAS in financial research. SAS Press.
Brealey, R., Myers, S., & Allen, F. 2008. Principles of corporate finance Boston: McGraw-Hill/Irwin,
2008; 9th ed.
Brooke, J., & Oliver, B. 2005. The source of abnormal returns from strategic alliance announcements.
Pacific-Basin Finance Journal, 13(2): 145-161.
Brown, S. J., & Warner, J. B. 1980. Measuring security price performance. Journal of Financial
Economics, 8(3): 205-258.
Chan, S. H., Kensinger, J. W., Keown, A. J., & Martin, J. D. 1997. Do strategic alliances create value?
Journal of Financial Economics, 46(2): 199-221.
Chi, T. 2000. Option to acquire or divest a joint venture. Strategic Management Journal, 21(6): 665-687.
Das, S., Sen, P. K., & Sengupta, S. 1998. Impact of strategic alliances on firm valuation. The Academy of
Management Journal, 41(1): 27-41.
Das, T. K., & Teng, B. 2000a. Instabilities of strategic alliances: An internal tensions perspective.
Organization Science, 11(1): 77-101.
Das, T. K., & Teng, B. 2000b. A resource-based theory of strategic alliances. Journal of Management,
26(1): 31-61.
Dennis, D. K., & McConnell, J. J. 1986. Corporate mergers and security returns. Journal of Financial
Economics, 16(2): 143-187.
Doz, Y. L. 1996. The evolution of cooperation in strategic alliances: Initial conditions or learning
processes? Strategic Management Journal, 17(, Special Issue: Evolutionary Perspectives on
Strategy): 55-83.

Alliances and Bonds Paper Three
134
Dyer, J. H., & Singh, H. 1998. The relational view: Cooperative strategy and sources of
interorganizational competitive advantage. The Academy of Management Review, 23(4): 660-
679.
Elton, E. J., Gruber, M. J., Agrawal, D., & Mann, C. 2001. Explaining the rate spread on corporate bonds.
The Journal of Finance, 56(1): 247-277.
Galai, D., & Masulis, R. W. 1976. The option pricing model and the risk factor of stock. Journal of
Financial Economics, 3(1–2): 53-81.
Gao, L. S., & Iyer, B. 2009. Value creation using alliances within the software industry. Electronic
Commerce Research and Applications, 8(6): 280-290.
Ghosh, A., & Jain, P. C. 2000. Financial leverage changes associated with corporate mergers. Journal of
Corporate Finance, 6(4): 377-402.
Glushkov, D., 2007, Corporate Bonds and Ratings: Overview and Research Issues, WRDS User Meeting,
Wharton School, University of Pennsylvania.
Glushkov, D., 2011, SAS program for stock event study available through the Wharton Research Data
Service.
Harrison, J. S., Hitt, M. A., Hoskisson, R. E., & Ireland, R. D. 2001. Resource complementarity in
business combinations: Extending the logic to organizational alliances. Journal of Management,
27(6): 679.
Heimeriks, K. H., & Duysters, G. 2007. Alliance capability as a mediator between experience and
alliance performance: An empirical investigation into the alliance capability development
process*. Journal of Management Studies, 44(1): 25-49.
Hennart, J. 1988. A transaction costs theory of equity joint ventures. Strategic Management Journal,
9(4): 361-374.
Higgins, R. C., & Schall, L. D. 1975. Corporate bankruptcy and conglomerate merger. The Journal of
Finance, 30(1): pp. 93-113.
Inkpen, A. C., & Crossan, M. M. 1995. Believing is seeing: Joint ventures and organization learning.
Journal of Management Studies, 32(5): 595-618.
Inkpen, A. 1998. Learning, knowledge acquisition, and strategic alliances. European Management
Journal, 16(2): 223-229.
Inkpen, A. C., & Currall, S. C. 2004. The coevolution of trust, control, and learning in joint ventures.
Organization Science, 15(5): 586-599.
Jensen, M. C., & Ruback, R. S. 1983. The market for corporate control: The scientific evidence. Journal
of Financial Economics, 11(1–4): 5-50.
Johnson, S. A., & Houston, M. B. 2000. A reexamination of the motives and gains in joint ventures.
Journal of Financial & Quantitative Analysis, 35(1): 67-85.
Kale, P., Dyer, J. H., & Singh, H. 2002. Alliance capability, stock market response, and long-term
alliance success: The role of the alliance function. Strategic Management Journal, 23(8): 747-
767.

Alliances and Bonds Paper Three
135
Kale, P., & Singh, H. 2007. Building firm capabilities through learning: The role of the alliance learning
process in alliance capability and firm-level alliance success. Strategic Management Journal,
28(10): 981-1000.
Khanna, T. 1998. The scope of alliances. Organization Science, 9(3, Special Issue: Managing
Partnerships and Strategic Alliances): 340-355.
Khanna, T., Gulati, R., & Nohria, N. 1994. Alliances as learning racesAcademy of Management.
Khanna, T., Gulati, R., & Nohria, N. 1998. The dynamics of learning alliances: Competition, cooperation,
and relative scope. Strategic Management Journal, 19(3): 193-210.
Kim, E. H., & McConnell, J. J. 1977. Corporate mergers and the co-insurance of corporate debt. The
Journal of Finance, 32(2, Papers and Proceedings of the Thirty-Fifth Annual Meeting of the
American Finance Association, Atlantic City, New Jersey, September 16-18, 1976): pp. 349-365.
Kogut, B. 1988. Joint ventures: Theoretical and empirical perspectives. Strategic Management Journal,
9(4): 319-332.
Kogut, B. 1989. The stability of joint ventures: Reciprocity and competitive rivalry. The Journal of
Industrial Economics, 38(2): 183-198.
Kogut, B. 1991. Joint ventures and the option to expand and acquire. Management Science, 37(1): 19-33.
Kogut, B., & Zander, U. 1992. Knowledge of the firm, combinative capabilities, and the replication of
technology. Organization Science, 3(3, Focused Issue: Management of Technology): 383-397.
Koh, J., & Venkatraman, N. 1991. Joint venture formations and stock market reactions: An assessment in
the information technology sector. The Academy of Management Journal, 34(4): 869-892.
Kumar, M. V. S. 2010a. Differential gains between partners in joint ventures: Role of resource
appropriation and private benefits. Organization Science, 21(1): 232-248.
Larsson, R., Bengtsson, L., Henriksson, K., & Sparks, J. 1998. The interorganizational learning dilemma:
Collective knowledge development in strategic alliances. Organization Science, 9(3, Special
Issue: Managing Partnerships and Strategic Alliances): 285-305.
Levy, H., & Sarnat, M. 1970. Diversification, portfolio analysis and the uneasy case for conglomerate
mergers. The Journal of Finance, 25(4): pp. 795-802.
Lewellen, W. G. 1971. A pure financial rationale for the conglomerate merger. The Journal of Finance,
26(2, Papers and Proceedings of the Twenty-Ninth Annual Meeting of the American Finance
Association Detroit, Michigan December 28-30, 1970): pp. 521-537.
McConnell, J. J., & Nantell, T. J. 1985. Corporate combinations and common stock returns: The case of
joint ventures. The Journal of Finance, 40(2): 519-536.
Myers, S. C. 1977. Determinants of corporate borrowing. Journal of Financial Economics, 5(2): 147-
175.
Parkhe, A. 1993. Strategic alliance structuring: A game theoretic and transaction cost examination of
interfirm cooperation. The Academy of Management Journal, 36(4): pp. 794-829.
Penas, M. F., & Unal, H. 2004. Gains in bank mergers: Evidence from the bond markets. Journal of
Financial Economics, 74(1): 149-179.

Alliances and Bonds Paper Three
136
Reuer, J. J., & Tong, T. W. 2010. Discovering valuable growth opportunities: An analysis of equity
alliances with IPO firms. Organization Science, 21(1): 202-215.
Ring, P. S., & Ven, A. H. v. d. 1994. Developmental processes of cooperative interorganizational
relationships. The Academy of Management Review, 19(1): 90-118.
Sampson, R. C. 2007. R&D alliances and firm performance: The impact of technological diversity and
alliance organization on innovation. The Academy of Management Journal, 50(2): 364-386.
Sánchez–Lorda, P., & García–Canal, E. 2012. When and how previous experience affects the stock
market reaction to business combinations. European Journal of Cross-Cultural Competence
and Management, 2(3): 319-343.
Schilling, M. A. 2009. Understanding the alliance data. Strategic Management Journal, 30(3): 233-260.
Shastri, K. 1990. The differential effects of mergers on corporate security values. Research in Finance,
8: 179-201.
Simonin, B. L. 1997. The importance of collaborative know-how: An empirical test of the learning
organization. The Academy of Management Journal, 40(5): pp. 1150-1174.
Villalonga, B., & McGahan, A. M. 2005. The choice among acquisitions, alliances, and divestitures.
Strategic Management Journal, 26(13): 1183-1208.
Wang, L., & Zajac, E. J. 2007. Alliance or acquisition? A dyadic perspective on interfirm resource
combinations. Strategic Management Journal, 28(13): 1291-1317.
Yin, X., & Shanley, M. 2008. Industry determinants of the "merger versus alliance" decision. Academy of
Management Review, 33(2): 473-491.

Alliances and Bonds Paper Three
137
8. RESULT TABLES
Table 3: Parallel Event Study: Daily Abnormal Returns of Partner A Stocks and Bonds vs. Partner B Stocks
Regression: DailyAR(BondA,t) = β1DailyAR(StockA,t) + β2DailyAR(StockB,t)
Partner A BONDS Partner A STOCKS Partner B STOCKS REGRESSION
Event Time
(in days)
No. of
obs
in
sample
Partner A Bond
Mean AR (basis
points)
Partner A Bond
Median AR
(basis
points)
No. of
obs
in
sample
Partner A Stock
Mean AR (basis
points)
Partner A
Stock Median
AR (basis
points)
No. of
obs
in
sample
Partner B Stock
Mean AR (basis
points)
Partner B Stock
Median AR (basis
points)
No. of
obs
in
sample
β1estimate β2estimate
-10 450 2.899 0.733 725 3.765 -0.080 263 10.001 5.320 172 0.026 0.012
-9 467 3.022† 2.278 725 6.421 0.743 263 22.196 7.040 182 0.071* 0.023*
-8 463 0.495 1.780 725 0.380 -3.047 262 33.395† -2.885 183 0.156*** 0.011
-7 437 0.746 1.212 725 -1.242 -7.588 262 7.286 -6.836 168 0.151*** 0.006
-6 447 -0.909 2.017 725 -0.503 -2.388 262 11.557 -7.408 176 0.098*** 0.015
-5 453 -7.424 0.185 725 -9.361 -5.235 262 3.319 7.230 177 0.022 -0.002
-4 451 1.382 2.516 725 -1.128 -11.905 262 21.074 -4.252 181 -0.004 -0.004
-3 448 0.115* 2.753* 724 1.845 -5.910 262 -37.133* -25.014* 174 0.064* -0.027
-2 441 -1.708* 2.308 725 10.479 1.284 262 16.388 -5.232 169 0.043† 0.040
-1 453 -1.761 0.344 725 -3.688 1.333 261 2.722 16.662 171 0.233*** -0.028
0 467 8.527*** 3.391** 725 38.891*** 11.844** 262 267.294*** 52.789*** 183 0.145*** -0.019**
1 468 2.901* 2.990† 725 16.962* 5.279* 262 -6.411 3.519 191 0.175*** -0.009
2 446 1.400 2.365 725 4.162 -6.170 262 -47.692* -2.287† 171 0.047 -0.008
3 455 2.052* 2.237 723 -2.564 -3.994 262 23.567 -5.018 172 0.052 -0.025
4 427 0.693 2.681 721 6.826 3.658 261 3.401 11.922 167 0.112** 0.019
5 443 -7.479 1.417 721 -16.043* -13.998** 261 -12.813 -0.556 174 0.459*** -0.022
6 447 -6.221 -0.661 721 -10.854 -9.052 261 36.456† 2.583 175 0.208*** 0.004
7 438 -2.165 1.107 720 4.236 -3.448 261 -23.810 -16.232* 169 -0.152** 0.025
8 422 -3.868 -0.044 719 11.916† -4.115 261 -9.004 -12.532 169 0.098** 0.033
9 427 6.527† 2.800 719 -9.351 -8.336* 261 10.314 -5.144 174 0.044† 0.023
10 431 5.660 1.250 717 10.531 3.356 260 2.154 5.913 162 0.080*** 0.013
Statistical significance p-levels (two tail tests): † p<.1; * p<.05; ** p<.01; *** p<.001. Stock means tests: Brown & Warner (1980); Stock median tests: Wilcoxon Ranked Sign; Bond means
tests: Sign Test; Bond median tests: Wilcoxon Ranked Sign.

Alliances and Bonds Paper Three
138
Table 4: Parallel Event Study: Pooled Abnormal Returns of Partner A Stocks and Bonds vs. Partner B Stocks
Regression: PooledAR(BondA,t) = β1PooledAR(StockA,t) + β2PooledAR(StockB,t)
Panel A: Partner A Bond Grade=ALL GRADES
Pooling of Abnormal
Returns
Partner A BONDS Partner A STOCKS Partner B STOCKS REGRESSION
No. of
obs
in
sample
Partner A
Bond
Mean AR
(basis
points)
Partner A
Bond
Median
AR (basis
points)
No. of
obs
in
sample
Partner A
Stock
Mean AR
(basis
points)
Partner A
Stock
Median
AR (basis
points)
No. of
obs
in
sample
Partner B
Stock Mean
AR (basis
points)
Partner B
Stock
Median AR
(basis
points)
No. of
obs
in
sample
β1 estimate β2 estimate
Pooled AR(-1,1) 1388 3.272*** 2.514** 2175 17.389*** 5.800** 785 87.977*** 18.327** 545 0.180*** -0.018**
Pooled AR(-2,2) 2275 1.940*** 2.514*** 3625 13.361*** 2.770* 1309 46.494*** 9.289 885 0.139*** -0.013†
AR(0,0) 467 8.527*** 3.391** 725 38.891*** 11.844** 262 267.294*** 52.789*** 183 0.145*** -0.019**
Pooled AR(0,1) 935 5.711*** 3.210** 1450 27.927*** 7.925*** 524 130.442*** 20.848*** 374 0.156*** -0.018**
Pooled AR(0,2) 1381 4.319*** 3.052*** 2175 20.005*** 4.036* 786 71.064*** 11.928† 545 0.142*** -0.016*
Panel B1: Partner A Bond Grade=INVESTMENT
Pooled AR(-1,1) 1019 0.750*** 2.367** 1572 9.792** 4.185* 608 105.512*** 18.104** 437 0.018 -0.021***
Pooled AR(-2,2) 1679 -0.808*** 2.235*** 2620 4.830† 2.318 1014 57.729*** 9.505† 710 0.020 -0.019***
AR(0,0) 345 1.178** 2.560* 524 16.713** 10.263* 203 313.681*** 55.172*** 147 0.015 -0.018***
Pooled AR(0,1) 688 1.294*** 2.831** 1048 11.792** 6.248* 406 154.152*** 19.289** 301 0.006 -0.020***
Pooled AR(0,2) 1023 0.357*** 2.584** 1572 7.359* 3.058 609 83.155*** 10.121 439 0.014 -0.018**
Panel B2: Partner A Bond Grade=NON-INVEST
Pooled AR(-1,1) 369 10.237 4.353 603 37.193** 14.255† 177 27.744 19.274 108 0.270*** -0.022
Pooled AR(-2,2) 596 9.681 4.111† 1005 35.603*** 4.736† 295 7.876 8.070 175 0.195*** 0.027
AR(0,0) 122 29.307* 10.269* 201 96.708*** 18.949* 59 107.691** 32.778* 36 0.247*** -0.043
Pooled AR(0,1) 247 18.014† 6.655† 402 69.989*** 21.688** 118 48.861* 23.250 73 0.242*** -0.018
Pooled AR(0,2) 358 15.639† 6.399† 603 52.973*** 7.028* 177 29.463 17.970 106 0.223*** -0.009
Statistical significance p-levels (two tail tests): † p<.1; * p<.05; ** p<.01; *** p<.001. Stock means tests: Brown & Warner (1980); Stock median tests: Wilcoxon Ranked Sign; Bond means
tests: Sign Test; Bond median tests: Wilcoxon Ranked Sign.

Alliances and Bonds Paper Three
139
Table 5: Parallel Event Study: Cumulative Abnormal Returns of Partner A Stocks and Bonds vs. Partner B Stocks
Regression: CAR(BondA,t) = β1CAR(StockA,t) + β2CAR(StockB,t)
Partner A BONDS Partner A STOCKS Partner B STOCKS REGRESSION
CAR
(day start,
day end)
No. of
obs
in CAR
sample
Partner A
Bond Mean
CAR (basis
points)
Partner A
Bond Median
CAR (basis
points)
No. of
obs
in
sample
Partner A
Stock Mean
CAR(basis
points)
Partner A
Stock
Median
AR (basis
points)
No. of
obs
in
sample
Partner B
Stock Mean
CAR(basis
points)
Partner B
Stock Median
CAR(basis
points)
No. of
obs
in sample
β1 estimate β2 estimate
CAR(-2,2) 109 -17.901 6.255 109 78.210* 2.136 109 69.850 0.494 109 0.073** 0.013
CAR(-1,1) 147 17.502* 6.348† 147 93.020*** 13.400† 147 93.807* 51.575* 147 0.200*** -0.022
CAR(0,1) 169 23.833† 4.189† 169 111.382*** 46.210** 169 177.840*** 72.894*** 169 0.213*** -0.017
CAR(0,2) 143 11.831 2.639 143 113.199*** 13.345* 143 144.329** 38.871† 143 0.137*** -0.007
Statistical significance p-levels (two tail tests): † p<.1; * p<.05; ** p<.01; *** p<.001. Stock means tests: Brown & Warner (1980); Stock median tests: Wilcoxon Ranked Sign; Bond means
tests: Sign Test; Bond median tests: Wilcoxon Ranked Sign.
Table 6: Wealth Effects on Day 0 of Strategic Alliance announcement
Partner A BONDS Partner A STOCKS Partner B STOCKS
Event
Time
(days)
Number of
firm-bonds
in daily
portfolio
Partner A
Bonds
Outstdg -15
days
Partner A
Bonds
Mean
Dollar
Gain
Partner A
Bonds
Median
Dollar
Gain
Number of
stocks in
daily
portfolio
Partner A
Stocks
Outstdg -15
days
Partner A
Stocks
Mean
Dollar
Gain
Partner A
Stocks
Median
Dollar
Gain
Partner B
Number
of stocks
in daily
portfolio
Partner B
Stocks
Outstdg -15
days
Partner B
Stocks
Mean
Dollar
Gain
Partner B
Stocks
Median
Dollar
Gain
Panel A: Partner A Bond Grade=ALL GRADES
0 467 2,998.460 1.089 0.817 725 53,122.627 79.663 11.507 262 28,941.869 22.503 2.840
Panel B1: Partner A Bond Grade=INVESTMENT
0 345 3,432.789 -1.198 0.702 524 71,129.820 108.946 26.333 203 24,239.402 16.645 2.960
Panel B2: Partner A Bond Grade=NON-INVEST
0 122 1,866.177 7.556 0.949 201 6,178.501 3.321 2.680 59 44,851.883 42.658 1.686
Outstanding values and Dollar gains are in millions of dollars. Outstanding bond values are based on issued amounts outstanding. Outstanding stock values are based on market values of
outstanding stock. Dollar Gain equals the Day 0 stock (bond) abnormal return (AR) multiplied by the outstanding value of stocks (bonds) 15 days before the alliance announcement day, Day 0.
Wealth effects are calculated based on a single day AR (Day 0) as their calculation based on CAR for bonds are distorted by the infrequent trading of bonds. See AR(0,0) in Table 4 for the mean
and median AR that correspond with mean and median Dollar Gains of this Table.

Alliances and Bonds Paper Three
140
Table 7a: Regressing Partner A Bond AR against Leverage
Day 0 Abnormal Return: Model 1 Model 2 Model 3 Model 4
Credit Rating (Non Invest=1) 0.00736*** 0.00858*** 0.00909** 0.0319***
(0.0014) (0.0020) (0.0029) (0.0051)
Leverage Ratio -0.0125*** -0.0131** -0.00648 0.0175 (0.0028) (0.0042) (0.0091) (0.018)
Chg in Lev. Ratio 0.00347** -0.000423 -0.00152 -0.000702
(0.0012) (0.0017) (0.0012) (0.0019) Assets 1.65e-08* 2.43e-08* 4.52e-08* 1.98e-08
(7.6e-09) (0.0000) (0.0000) (0.0000) Market to Book -0.0000601 -0.00000831 0.000170** 0.000376***
(0.000059) (0.000074) (0.000061) (0.000098)
Rel size PtnB/PtnA 0.000229*** -0.000871* (0.000023) (0.00038)
Constant 0.00459 0.00428 -0.00246 -0.00601
(0.0083) (0.0072) (0.0091) (0.011) Year fixed effects Yes Yes Yes Yes
Industry fixed effects Yes Yes Yes Yes
Firm fixed effects No No Yes Yes
Observations 435 173 435 173 R2 0.200 0.554 0.707 0.855
Standard errors in parentheses; + p < .1, * p < .05, ** p < .01, *** p < 0.001
Model 2 and 4 have fewer observations because not every Partner A observation has the corresponding Partner B data.
Table 7b: Regressing Partner A Bond AR against Alliance Experience
Day 0 Abnormal Return: Joint Ventures Strategic Alliances Licensing Agree.
Credit Rating (Non Invest=1) 0.0158* 0.00704*** 0.00753+
(0.0069) (0.0015) (0.0042) Leverage Ratio -0.0301+ -0.0125*** -0.0307**
(0.017) (0.0030) (0.010)
Chg in Lev. Ratio -0.00505 0.000163 0.00364 (0.0088) (0.0015) (0.0024)
JV Experience prior 6 yrs 0.00119 (0.0012)
SA Experience prior 6 yrs -0.0000125
(0.000014) LIC Experience prior 6 yrs 0.0000232
(0.00022)
Assets -2.25e-08 2.47e-08** -1.70e-08 (0.0000) (8.3e-09) (0.0000)
Market to Book 0.00165 0.0000537 -0.00155***
(0.0016) (0.000058) (0.00025) Constant -0.0105 0.00212 0.0161**
(0.0098) (0.0077) (0.0055)
Year fixed effects Yes Yes Yes Industry fixed effects Yes Yes Yes
Firm fixed effects No No No
Observations 42 318 75
R2 0.888 0.108 0.579
Standard errors in parentheses; + p < .1, * p < .05, ** p < .01, *** p < 0.001
The full sample 435 bond AR observations are split according to alliance contract type.

Conclusion
Contributions & Limits
Reflections
Future Directions

142
CONCLUSION
The integration of the two traditional fields of strategy and finance is an
immense and continuous task that is still occupying the interest of scholars from both
fields. While there may be the temptation to discard important ideas that lie at the
foundations of either field in order to achieve this integration, scholars have so far
resisted it. The three papers I have presented in this dissertation follow their approach,
which is based on a mutual respect for the research traditions of each one.
1. CONTRIBUTIONS AND LIMITATIONS
Paper One reviewed relevant theories and methods in the strategy and finance
literatures on the subject of strategic alliances taking organizational learning and
financial valuation perspectives. The literature on strategic alliances, especially in the
strategy literature is vast, while those from the finance literature are much less
numerous. The review aimed to contribute to the literature stream that bridges the gap
between strategy and finance by identifying theories and methods that are of common
interest. I then identified research gaps which became the focus of Papers Two and
Three of this dissertation and of future research work.
Paper Two studied how a firm’s experience in one governance form, namely in
forming and managing alliances could be transferred to positively affect the
performance of another governance form, namely acquisitions. Acquisition performance
is measured over a three year period using change in return on assets (ROA), a long-
term financial variable based on accounting data. The paper contributes to the strategy
literature by identifying two different mechanisms through which the transfer of alliance
experience takes place to positively affect acquisition performance. The paper proposes

143
a way of measuring the accumulated related industry prior alliance (ARIPA) experience
as a more effective way of capturing how the prior alliance experience is transferred.
Paper Three investigated the effect of strategic alliance formations on the wealth
of bond holders of allying firms by developing an analogy between mergers and
alliances based on theories of coinsurance. The key findings were that like stock
holders, bond holders are also positively affected by the announcement of alliances
because of coinsurance, and that firms with below investment grade bonds benefit more
than those with investment grade bonds when an alliance is announced. The study found
no relationship between organizational learning from prior alliance experience and bond
holder value creation, indicating there are some limits to how far the analogy between
mergers and alliances can be taken when applied to bonds. The findings contribute to
the finance and strategy literatures by filling a gap in the understanding of how alliances
affect the debt holder class of investors.
The findings of the three Papers presented in this dissertation are not without
their limits and defects. I list three here, but the list is by no means complete:
Too general: A major limitation of the research conclusions presented is their
overly general nature. The lack of focus on specific industries within the
industrial and manufacturing sectors that were studied in Papers Two and Three
leaves the reader wondering about the usefulness of the findings beyond pure
academic interest. An industry-level benchmark could be more useful to
practioners and academics to compare against. In future revisions especially of
Paper Two, closer attention should be paid to the industry effects and other
relevant sub-samples that may reveal more specific and relevant conclusions.
Insufficient robustness: Paper Two for example, lacks robustness in the
calculation of the prior alliance experience variables. Perhaps more checks on

144
different versions of the ARIPA calculations would provide stronger verification
of the results and hence robustness of the conclusions. Paper Three, while it
provides interesting results, more robustness tests and checks are still needed to
make them conclusive. For example, Table 4 requires tests of differences
between sub-sample means in Panels B1 and B2 to ensure there really are
differences between abnormal returns of investment and non-investment grade
bonds.
Insufficient inclusion: Although the Papers presented in this dissertation aim to
bridge the gap between strategy and finance through the common subject of
strategic alliances, the majority of the literature has been drawn from the
strategy field. While the sample of papers may be representative of the amount
of research attention given by the respective fields to alliances, going beyond
these two may be beneficial in bridging the gap between them. For example,
alliance literature is also found in other fields such as economics, psychology,
sociology, and political science. Although it would be beyond the scope of this
or any dissertation to include literature from all these fields, acknowledgement
of their existence and contribution could make the dissertation more complete
and inclusive, in particular Paper One.
2. REFLECTIONS
When I first decided to focus my doctoral dissertation on strategic alliances, one
of the main tasks was to review the extant literature, especially in both strategy and
finance. It soon became clear the large differences in the amount of research attention
given to alliances between the two fields. The question I had from the very early on was
why the principal finance journals have so little on alliances? Based on my own

145
experience and through discussions with various finance scholars who conduct research
on alliances, I would like to share the following answer to this question.
At least three issues seem to limit alliance research, at least for finance scholars:
(1) Lack of firm-level data: while general public data on announcements of alliances,
what they intend to do, the industries they are from, etc, which are available from
widely used databases such SDC Platinum, there is a lack of firm-specific data that
allows finance researchers to gauge the size of alliance activity. For example, how much
firms invest in alliances, the portion of sales or profits that are due to alliances, the
prices paid to buy out an alliance partner’s share, etc. This sort of data is usually only
accessible through exclusive sources. (2) Alliances are not M&As: Alliances are like the
“poor cousins” of M&As. M&A is where the money is, especially given that the market
for corporate control is serviced by large investment banks and consulting firms which
have an interest to engage clients in large high profile M&As over short timeframes.
Alliances on the other hand, require long-term relationship building between the allying
firms, something that a third party such as an investment bank or consultant plays less
of a role. And (3) different research cultures: The dominant mathematical, empirical,
and transaction cost economics-based theories that pervade the finance literature are not
what you find in strategy. While rigorous empirical research in strategy may employ for
example, survey or case-based data, empirical research in finance is reticent to take
what it would consider a leap of faith. These differences in research cultures are strong
and I have observed this by the lack of cross-citations between the two literatures.
3. FUTURE DIRECTION
I would like to conclude my doctoral dissertation on a personal note regarding
my future professional direction of research. My reflections on the state of development

146
of strategic alliance research in the strategy and finance literature continue shaping the
direction I intend to take in my research work on this subject. As finance and strategy
scholars have found, the research gaps that bridge the two fields are many and the
opportunities tempting.
At the end of Paper One, I identified two in particular. One of the research gaps
was more oriented to strategy and I have begun working in it by contributing the
findings of my Paper Two. I have also interested other scholars to join me in research
projects in this gap. The other research gap was more oriented to finance and again I
have already begun to contribute to filling the gap through the results of my Paper
Three. Like the first gap, this one continues to be of keen interest for my future research
work on alliances.
While my personal research interests lie in both strategy and finance, in general
however, my preference is more tilted in favor of finance. The types of questions that I
will be directing my future research efforts include some of the following areas:
How do alliances affect corporate debt, especially bank debt?
How are alliances financed? Debt, equity, or retained earnings?
How do alliances affect the risk of firms? Various measures would be interesting
to know including bond rating, stock volatilities, beta estimates, etc.
How has the capital structure of firms changed over the past 30 years as a
function of the growth in alliances?
Ian P.L. Kwan
Pamplona, 2013
Deo Gratias!