integrating statistical and knowledge-based methods …€¦ · · 2017-11-28integrating...
TRANSCRIPT

Integrating Statistical and Knowledge-based
Methods for Automatic Phonemic Segmentation
by
Felice Sun
Submitted to the Department of Electrical Engineering andComputer Science
in partial fulfillment of the requirements for the degree of
Master of Engineering in Electrical Engineering and ComputerScience
at the
MASSACHUSETTS INSTITUTE OF TECHNOLOGY MASSACHLOF Ti
May 1999
@Felice Sun, 1999. All righs reserved.
The author hereby grants to MIT permission to reproduce anddistribute publicly paper and electronic copies of this thesis
document in whole or in part, and to grant others the right to do so.
A uthor .............................................. ~: ... ....Department of Electrical Engineering and Computer Science
May 21, 1999
C ert fie by ... ~ .- - . .... ... ...............Certified by.... T Joseph Perkell
-ch ScientistnPrvisor
Accepted by ........... )...........m,_iur C. Smith
Chairman, Department Committee on Graduate Students
Integrating Statistical and Knowledge-based Methods for
Automatic Phonemic Segmentation
by
Felice Sun
Submitted to the Department of Electrical Engineering and Computer Scienceon May 21, 1999, in partial fulfillment of the
requirements for the degree ofMaster of Engineering in Electrical Engineering and Computer Science
Abstract
This thesis presents a prototype system, which integrates statistical and knowledge-based methods, for automatic phonemic segmentation of speech utterances for use inspeech production research. First, Aligner, a commercial speech alignment software,synchronizes the speech waveform to the provided text, using hidden Markov modelsthat were trained on phones. Then, a custom built knowledge-based segmentationprogram is used to locate and label the segmentation boundaries. This thesis providesone example of automatic segmentation that specifically identifies the boundariesassociated with voiceless stop consonants. However, the structure of the segmentationsystem that is discussed in this thesis provides a framework for further development ofthe automatic segmentation system. The results of this prototype system are highlysuccessful.
Thesis Supervisor: Joseph PerkellTitle: Senior Research Scientist
2
Acknowledgments
I would like to thank my thesis advisor, Joseph S. Perkell, for his helpful guidance
and friendly nature. Dr. Perkell was never too busy to answer questions, discuss
progress, and offer suggestions to my work. Thanks also goes to the many members
of the Speech Communication Group who helped me with my research, especially
Professor Ken Stevens for his advice, Majidz Zandipour for helping me get started,
and Jannell Vick for providing the speech signals for my research. In addition I'd like
to thank Seth Hall, who helped me with all of my software and harware problems.
I would also like to thank my parents, my sister, and my brother for their ever-
lasting love and support. And thanks to my friends, JH, RV, LBF, FS, AP, SK and
SK for their company and laughter.
3
Contents
1 Introduction
1.1 Current Research in Speech Recognition . . . .
1.1.1 Statistical Algorithms . . . . . . . . . .
1.1.2 Knowledge-based Approach . . . . . . .
1.2 Thesis Outline . . . . . . . . . . . . . . . . . . .
2 Phonemes
2.1 V ow els . . . . . . . . . . . . . . . . . . . . . . .
2.2 Obstruent Consonants . . . . . . . . . . . . . .
2.2.1 Voiceless Stop Consonants: /p/, /t/, /k/
2.2.2 Voiced Stop Consonants: /b/, /d/, /g/
2.2.3 Voiceless Fricatives: /f/, /s/, /s/ . .
3 Aligner
3.1 Preparing the Speech Signal . . .
3.2 Performance Test . . . . . . . . .
3.2.1 Speech Database . . . . .
3.2.2 Methods and Results . . .
3.2.3 Summary of performance .
4 Knowledge-based Algorithm
4.1 Overview . . . . . . . . . . . . . .
4.2 General Algorithm . . . . . . . .
4
9
. . . . . . . . 10
. . . . . . . . 10
. .. . . . . * 11
. . . . . . . . 12
15
. . . . . . . . 16
. . . . . . . . 16
. . . . . . . . 17
. . . . . . . . 19
. . . . . . . . 21
24
25
29
29
30
33
34
35
35

4.2.1 Voiceless Stop Consonants . . . . . . . . . . . . . . . . . . . .
4.2.2 Generalization to Other Types of Phones . . . . . . . . . . . .
4.3 Implementation and Preliminary Results . . . . . . . . . . . . . . . .
5 Implementation
5.1 Structure of the Segmentation Module
5.1.1 ExtractTime . . . . . . . . . .
5.1.2 List2Matlab . . . . . . . . . .
5.1.3 Sort . . . . . . . . . . . . . . .
5.2 Summary . . . . . . . . . . . . . . . .
6 Case-Study, Results and Discussion
6.1 Test Case . . . . . . . . . . . . . . . .
6.2 Summary . . . . . . . . . . . . . . . .
6.3 Future Work . . . . . . . . . . . . . . .
A Hidden Markov Model Tutorial
B Phone list
C Utterance List for CC2SPC
5
39
40
40
43
45
46
47
49
49
50
50
54
55
58
61
63
. . . . . . . . . . . . . . . . .
. . . . . . . . . . . . . . . . .
. . . . . . . . . . . . . . . . .
. . . ... .. .. -. - . .- . . . .
. . . . . . . . . . . . . - . .- .-
. . . . . . . . . . . . . . . . .
. . . . . . . . . . . . . . . . .
. . . . . . . . . . . . . . . . .

List of Figures
2-1 Phonetic segmentation for the vowel /a/ in the utterance /sad/. A
marks the boundary of the end of the preceding phoneme, a fricative.
B and C delimit the boundaries for the segmentation of the vowel. . 17
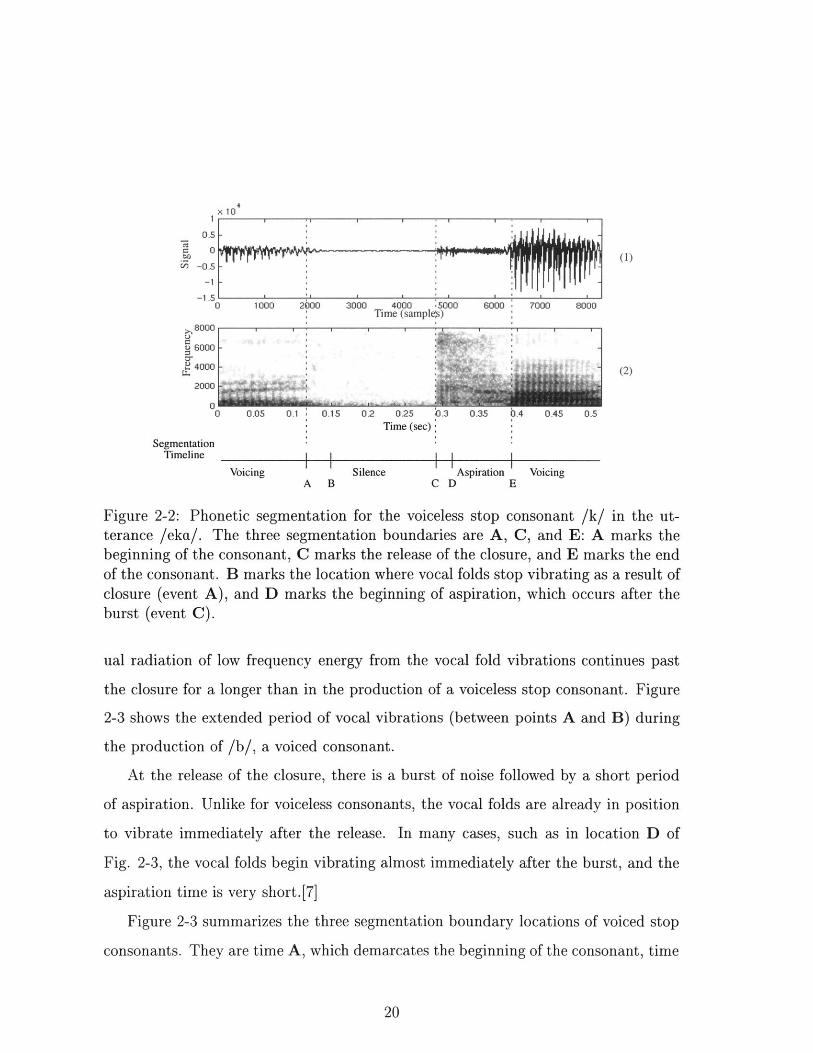
2-2 Phonetic segmentation for the voiceless stop consonant /k/ in the ut-
terance /eka/. The three segmentation boundaries are A, C, and E:
A marks the beginning of the consonant, C marks the release of the
closure, and E marks the end of the consonant. B marks the location
where vocal folds stop vibrating as a result of closure (event A), and D
marks the beginning of aspiration, which occurs after the burst (event
C ). . . . . . . . . . . . . . . . . . . . . . . . . . . . . . . . . . . . . . 20
2-3 Phonetic segmentation for the voiced stop consonant, /b/, in the ut-
terance /eba/. The three segmentation boundaries are A, C, and D.
A marks the beginning of the consonant, C marks the release of the
closure, and D marks the end of the consonant. B marks the location
where the vocal folds stop vibrating due to the closure (event A). . . 21
2-4 Phonetic segmentation of the voiceless fricative /s/ in /a sa/. The two
segmentation boundaries are B and C: B marks the beginning of the
consonant, C marks the release of the closure. A marks the end of the
preceding vowel, and D marks beginning of the subsequent vowel. . . 23
3-1 Process of preparing signal and text files for Aligner . . . . . . . . . . 25
6

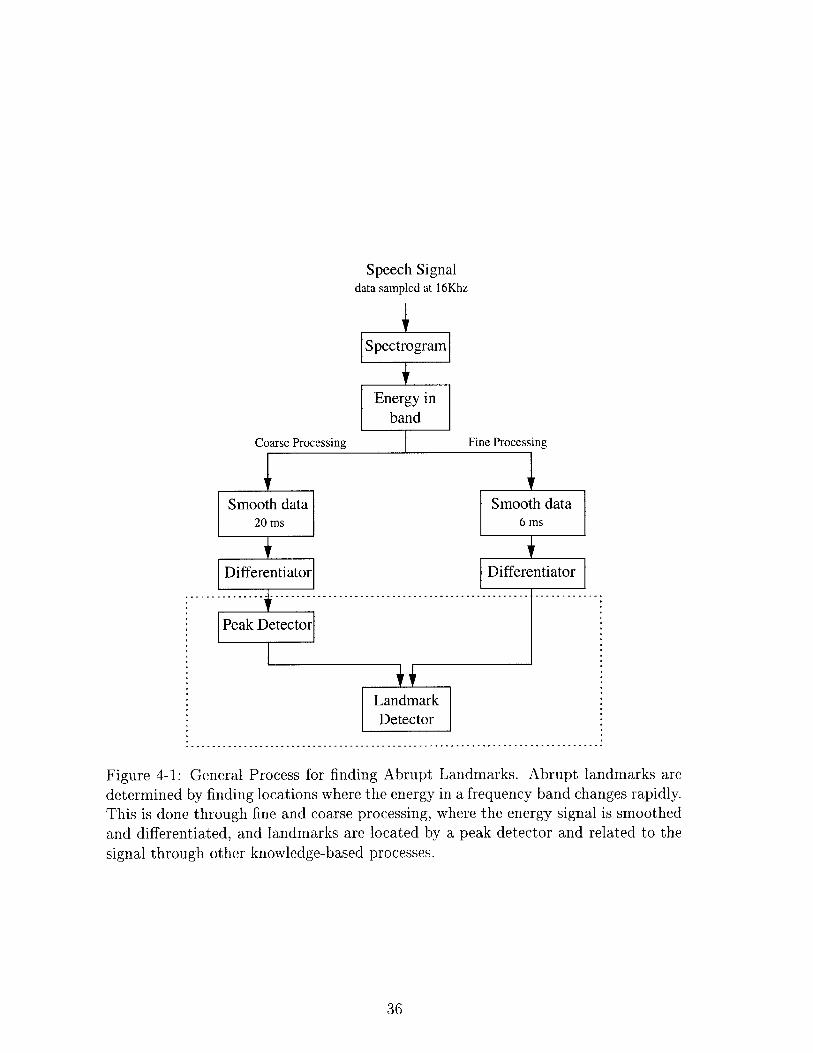
4-1 General Process for finding Abrupt Landmarks. Abrupt landmarks
are determined by finding locations where the energy in a frequency
band changes rapidly. This is done through fine and coarse processing,
where the energy signal is smoothed and differentiated, and landmarks
are located by a peak detector and related to the signal through other
knowledge-based processes. . . . . . . . . . . . . . . . . . . . . . . . . 36
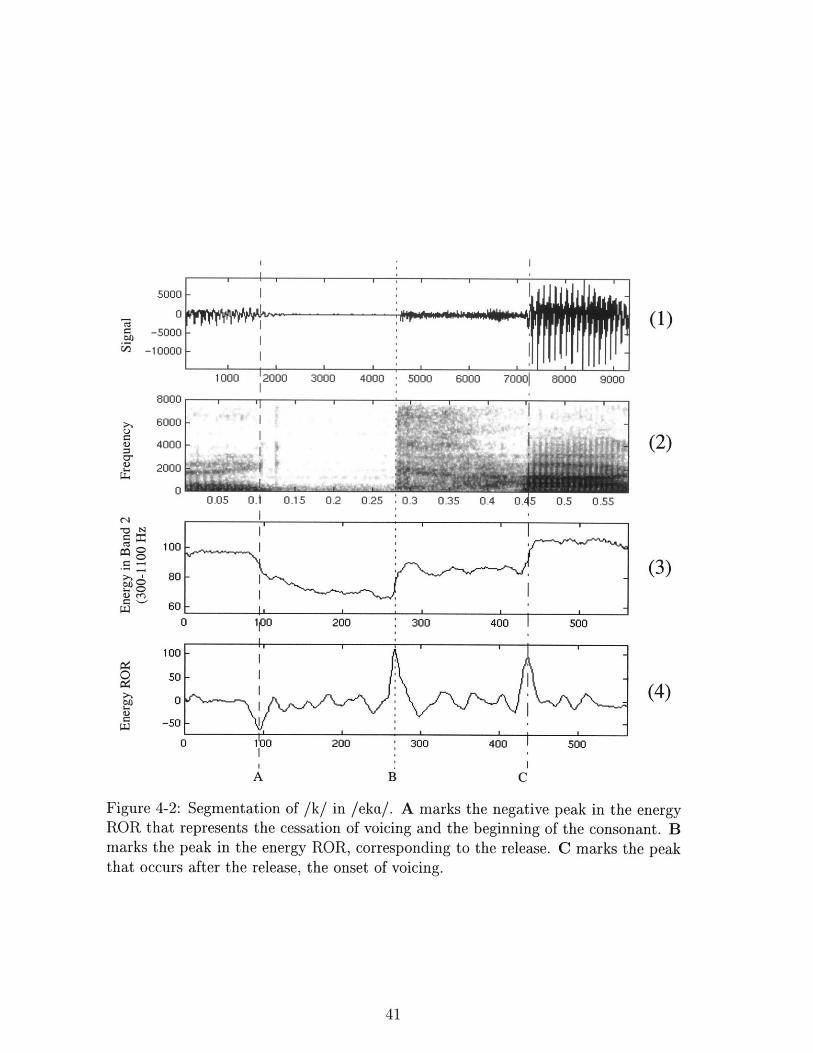
4-2 Segmentation of /k/ in /eka/. A marks the negative peak in the energy
ROR that represents the cessation of voicing and the beginning of the
consonant. B marks the peak in the energy ROR, corresponding to
the release. C marks the peak that occurs after the release, the onset
of voicing. . . . . . . . . . . . . . . . . . . . . . . . . . . . . . . . .. 41
5-1 Overview of the automatic segmentation system . . . . . . . . . . . . 43
5-2 Modularity of the segmentation system . . . . . . . . . . . . . . . . . 44
5-3 Three programs that compose the structure of a segmentation module,
ExtractTime, List2Matlab, and Sort. ..................... 46
5-4 Buffer allocation in ExtractTime . . . . . . . . . . . . . . . . . . . . 47
5-5 List2Matlab looping process . . . . . . . . . . . . . . . . . . . . . . 48
6-1 Segmentation Boundaries for the utterance /eka/. /s/, /ey/, /SIL/,
and /k/ are the result of Aligner's synchronization process. /C-rel/
and /C-end/ are the result of the automatic segmentation process. . . 51
6-2 Pre-burst noise which resulted in error of automatic segmentation pro-
cess. ....... .................................... 54
A-i Hidden Markov modeling of speech signal: Observation list O of the
signal corresponds one-to-one to speech signal fragments. Symbols Si
are derived from HMM process. Step 1 is the process of obtaining an
observation sequence, Step 2 is the hidden Markov modeling process. 59
A-2 State space model of the speech signal . . . . . . . . . . . . . . . . . 60
7
List of Tables
6.1 Percent of phoneme boundaries detected correctly in the clear speaking
condition. . . . . . . . . . . . . . . . . . . . . . . . . . . . . . . . . . 53
6.2 Percent of phoneme boundaries detected correctly in the normal speak-
ing condition. . . . . . . . . . . . . . . . . . . . . . . . . . . . . . . . 53
6.3 Percent of phoneme boundaries detected correctly in the 'fast clear'
speaking condition. . . . . . . . . . . . . . . . . . . . . . . . . . . . . 53
8

Chapter 1
Introduction
Current speech production research requires data extraction from acoustic, aero-
dynamic, electroglottographic and possibly other speech signals. These signals are
recorded from human subjects articulating a number of repetitions of a prescribed
set of utterances. The first step in the data extraction is processing the acoustic
speech signal to isolate and label significant events. These are acoustic 'landmarks'
that correspond to particular articulatory events such as the release of an articula-
tor in a stop consonant. This type of marking and labeling is called segmentation.
Presently, this first stage of speech data extraction is done manually and is the most
time consuming process in the overall data extraction task. An automatic algorith-
mic approach for segmenting and labeling acoustic speech signals would be useful in
minimizing the processing time.
Automatic segmentation is a very similar task, in many respects, to automatic
speech recognition. Many of the methods that have already been developed for auto-
matic speech recognition, such as hidden Markov modeling and the use of distinctive
features1 , can be utilized in the process of automatic segmentation. These algorithms
must be modified, however, for full effectiveness and efficiency in solving the problem
of segmentation. For example, in segmentation, the text for the speech is already
known. Thus, for the purposes of this project, the problem of deriving the text based
'A minimal set of binary acoustic and articulatory features that distinguish speech sounds fromone another.[2]
9

on the entire corpus of possible spoken words, as is the case in automatic speech
recognition, is eliminated. In addition, automatic segmentation requires precise po-
sitioning of boundaries that delimit the exact locations of acoustic manifestations of
particular articulatory events. This is not necessary in speech recognition. These two
distinctions must be kept in mind when building a segmentation algorithm based on
tools developed for speech recognition.
1.1 Current Research in Speech Recognition
Current speech recognition tools that are available commercially rely on a statistical
approach; large amounts of speech data are used to train speech models for word
recognition. This approach depends on statistical data to implicitly extract infor-
mation pertaining to the speech signal, in order to relate text to speech. Another
approach to speech recognition, currently only in the research stage, is knowledge-
based. Knowledge about speech, speech production, and human perception of speech
are used explicitly to build a speech recognizer.
1.1.1 Statistical Algorithms
Cutting edge statistical systems have the capability for speaker independent recogni-
tion that extends beyond simple voice commands. These statistical methods require
little knowledge of speech signals and are straight-forward to implement. The systems
generally produce probabilistic speech models based on speech training data. The re-
sults are therefore largely dependent on the training data; in situations when the
training environment does not closely match the operating environment, statistical
algorithms are not predicted to perform well.
10
Aligner
Many commercially available software have used hidden Markov models 2 (HMMs), a
statistical tool, to successfully create speech recognition systems. Entropic, a speech
signal processing corporation, has developed speech recognition tools for use in speech
research, where the researcher may build and train HMMs for a specific purpose. Ste-
fan Rapp[6], presents a method of using Entropic's software, HTK (Hidden Markov
Model Toolkit), to solve a problem similar to phonetic segmentation. The purpose
of Rapp's research is to align German phones to speech signals (without particular
attention to the precision of the phonetic boundaries) using a supplied transcrip-
tion. The first step in Rapp's algorithm translates the supplied text into a string of
phonemes using a dictionary lookup method. Then using the Entropic toolkit, hidden
Markov models are trained for German phonemes using a large corpus of phoneti-
cally balanced sentences. The results from this research indicate that this method is
successful for detecting and aligning acoustic manifestations of the phonemes to text.
Entropic also provides a commercial software that performs the same task with
models trained for phonemes in the English language. This program, Aligner, will
provide the first step in the automatic phonemic segmentation system described in
this thesis.
1.1.2 Knowledge-based Approach
The knowledge-based approach to speech recognition directly employs information
about speech signals, speech production, and speech perception. These systems in-
herently have a greater potential than statistical methods because the they model
speech signals directly. This approach has the flexibility to incorporate additional
information such as environmental factors and new knowledge about speech. Since
knowledge-based algorithms are designed to model the the human speech perception
process, difficulties arise due to the complexity of the process and the current limita-
tions of speech knowledge. A knowledge-based procedure for automatic segmentation
2 Information about hidden Markov models can be found in Appendix A.
11

is described in detail in Chapter 4.
Distinctive Features and Landmarks
Sharlene Liu[3] describes a multi-stage knowledge-based speech recognition process
that employs acoustic features present in speech signals. These acoustic features and
articulatory features, both known as distinctive features, compose a binary list that
uniquely and concisely describe every speech sound in any language. The locations
in the speech signal where the acoustic manifestations of these features are most
pronounced are called landmarks. The process Liu describes uses such landmarks to
extract distinctive features from the signal. The features are related to phonemes and
finally to word identification.
Liu discusses a specific technique of determining acoustically-abrupt landmarks
by finding regions in the speech signal where the rate of change of energy within a
frequency band is the greatest. Additional information about phoneme production
identifies the peaks in the energy derivative that are significant events. The success
rate for this method of abrupt landmark detection is relatively high.
Because segmentation boundaries often coincide with landmarks, Liu's technique
for landmark detection can also be used to find phoneme boundaries in phonemic
segmentation. It therefore provides the basis for the second part of the automatic
phonemic segmentation system described in this thesis.
1.2 Thesis Outline
This thesis discusses a method for combining statistical and knowledge-based algo-
rithms for speech recognition, specifically the methods mentioned above, into a system
for phonetic segmentation.
There are many benefits of combining statistical and knowledge-based algorithms
for the purposes of phonetic segmentation. By dividing the problem of phonetic
segmentation into two parts, each part becomes a problem that can be solved by
different algorithms, employing the advantages of each algorithm. The first step in
12
the process of phonemic segmentation is to roughly synchronize the speech waveform
to the known text. Statistical tools such as hidden Markov models, which are de-
signed for speech recognition, are likely to be successful in synchronizing speech to
text because synchronization is a simpler task than speech recognition. The second
step in phonetic segmentation is to locate the segmentation boundaries. Knowledge-
based algorithms for speech recognition are ideal for solving this problem because the
algorithms directly employ information about acoustic manifestations of articulatory
events. Given a speech fragment that is synchronized with the text, the phonemes,
and therefore the segmentation boundaries that exist in the signal are already deter-
mined. The problem of segmentation is therefore simplified to precisely locating the
given segmentation boundaries within a short fragment of speech.
This thesis presents a prototype system for phonetic segmentation of speech utter-
ances for use in speech production research. Entropic's Aligner is used to provide the
initial synchronization of the speech to the text, and a knowledge-based algorithm
similar to that described in Liu's thesis is used to find the exact locations of the
segmentation boundaries.
There are three distinct stages in the research that culminate in an automatic
segmentation system. The first part involves exploring the performance of Aligner to
determine Aligner's capabilities for this particular application. In the second stage of
the research, a knowledge-based program is built that uses the results from Aligner
to refine the location of the acoustic manifestations of articulatory events. The final
part of the thesis combines the two parts seamlessly, and provides a process prototype
that can be used as a framework for further development of the segmentation system.
Chapter 2 provides background information about phonemes and defines segmen-
tation boundaries for the various phoneme classes that are discussed in this thesis.
Chapter 3 explains the evaluation process of the commercial phonemic alignment
software, Aligner, including the performance of the software for use in speech pro-
duction research. Chapter 4 explores possibilities for improving the system by in-
corporating an example of a custom-built knowledge-based landmark detection algo-
rithm. Chapter 5 presents a framework and process for combining Aligner with the
13

knowledge-based algorithm so that the system may be seamless for the user. Chapter
6 summarizes the results and also provides suggestions for future work.
14
Chapter 2
Phonemes
In order to create a system that will automatically segment speech signals, the charac-
teristics of the segmentation boundaries must first be defined clearly for the purposes
of the research. Phonetic segmentation is the process of delimiting acoustic manifes-
tations of phonemes within a continuous acoustic speech signal. For this particular
research, the location of the segmentation boundaries correspond to particular articu-
latory events that occur in the production of certain phonemes. These include events
such as the closing of the lips or the onset of vocal fold vibrations. In general, the
acoustic properties of these articulatory events are rapidly changing.
The boundaries that mark these articulatory events also correspond to a subset
of the landmarks that are commonly used in knowledge-based speech recognition.
Whereas landmarks in knowledge-based speech recognition refer to all locations in
the speech signal where important acoustic information about the phoneme is most
apparent, segmentation boundaries refer only to those relating to particular articu-
latory events. In general these boundaries are synonymous to landmarks that are
classified as abrupt-consonantal.
The landmarks and segmentation boundaries that are discussed in this thesis
include the beginning and end of vowels; the beginning, release, and end of voiced
and unvoiced obstruent stop consonants, /p/, /t/, /k/, /b/, /d/, /g/; as well as the
beginning and end of unvoiced fricatives, /f/, /s/, /s/. Semi-vowels (glides), and
sonorants will not be dealt with in this thesis.
15
2.1 Vowels
Vowels are produced by the sound source of vocal fold vibration being filtered by an
un-obscured vocal tract. The vocal fold vibrations produce pulse-like waveforms with
a fundamental frequency of approximately 150 Hz for males and around 300 Hz for
females.
The un-obstructed vocal tract can be modeled as a filter whose frequency response
depends on the shape of the air cavity in the throat and mouth, which is influenced
by the placement of the tongue and the shape of the lips. The resonances in the vocal
tract can usually be described by three to five peak frequencies or formants within
the range of frequencies from approximately 150 Hz to 4000 Hz. Vowels are therefore
manifested in the time-varying frequency spectrum as signals with increased energy
in the formant frequency regions of the spectrum. In addition, the speech waveforms
of vowels are identified by having a much greater overall amplitude than consonants
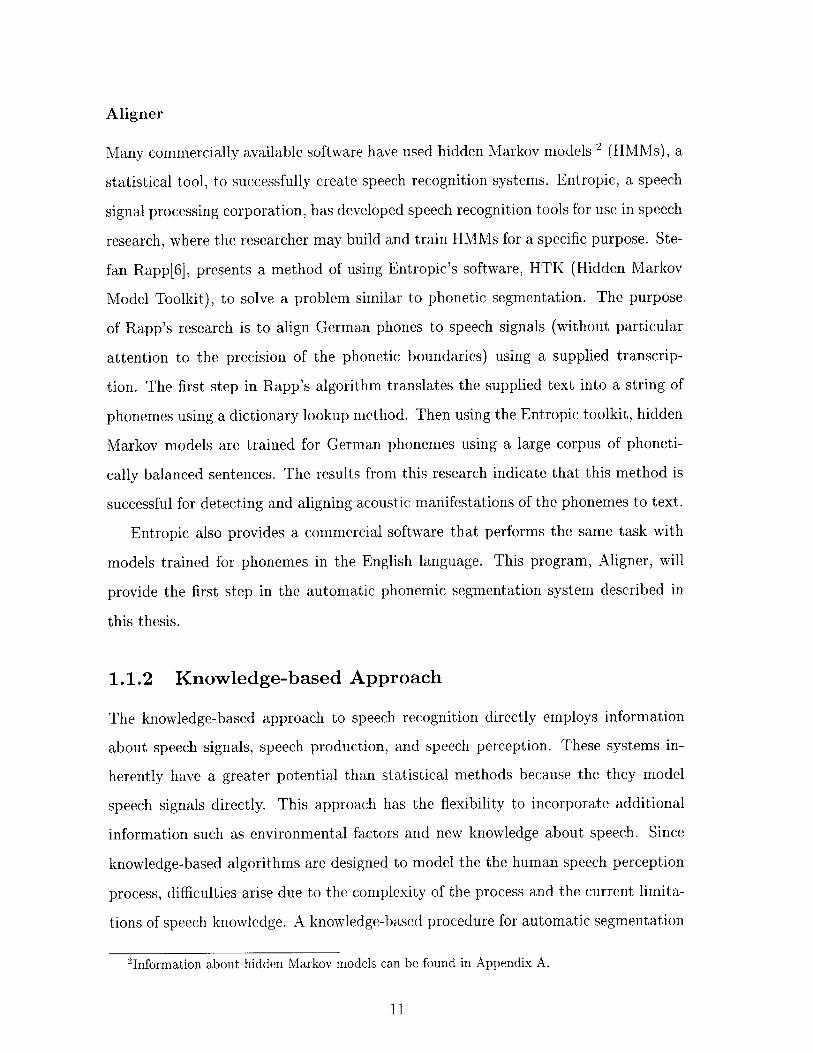
because of the open vocal tract. See the interval between points B and C of Fig.
2-1.[7]
The segmentation boundaries for a vowel are the beginning and end of the vowel
phoneme, manifested in the spectrogram as a rapid increase of energy in the formant
frequencies (vowel beginning) and decrease of energy in the formant frequencies (vowel
end). For example, the vowel a in the utterance /sod/, in Fig. 2-1 is delimited by
B, marking the beginning of the formant frequency excitation, and by C, marking
the end of the formant frequency excitation.
2.2 Obstruent Consonants
Obstruent consonants include phonemes that are produced with a complete or near
complete closure of the oral cavity by the lips, the tongue tip, or the tongue body.
The constriction creates a decrease in the overall signal amplitude. The closure and
release of the constriction creates discontinuities in the time-varying spectrum of the
acoustic signal. In addition to the articulatory motions, a physiological feature of an
16

(1)
ime (samples)
6000 -(2)
a 4000-
2000-
0 0.05 C.1 0.15 0.2 0.25 0.3 0.35
Segmentation Time (sec)Timeline
I |Frication Voicing
A B C
Figure 2-1: Phonetic segmentation for the vowel /w/ in the utterance /sod/. Amarks the boundary of the end of the preceding phoneme, a fricative. B and Cdelimit the boundaries for the segmentation of the vowel.
obstruent consonant is the build-up of pressure in the supra-glottal vocal tract caused
by the constriction.
The class of obstruent consonants may be divided into a category of stop con-
sonants, where a burst noise is created at the release of the closure, or continuant
consonants, where aspirated or fricative noise is generated during the entire length of
the consonant.
2.2.1 Voiceless Stop Consonants: /p/, /t/, /k/
Voiceless stop consonants are produced by a complete vocal-tract closure. At the
moment of closure, the vocal folds continue to vibrate for a brief time. The sound
produced by the residual vibrations radiates through the vocal tract walls, which act
as a a low pass filter that filters out the resonances of the oral cavity. The closure is
an articulatory event, which corresponds to the boundary that defines the beginning
of the consonant. The acoustic manifestation of this event is the rapid decline of
17

energy in frequencies above 300 Hz or so. An example of this boundary is shown in
Fig. 2-2 occurring at time A for the utterance /eka/.
As air continues to pass through the glottis into the obstructed oral cavity, pressure
builds in the supra-glottal region of the oral cavity. As a result, the pressure difference
across the glottis decreases. In addition, in the production of a voiceless consonant,
the vocal folds are stiffened and spread apart. These actions facilitate the cessation
of vocal fold vibrations. When the vocal folds cease vibrating and the vocal tract is
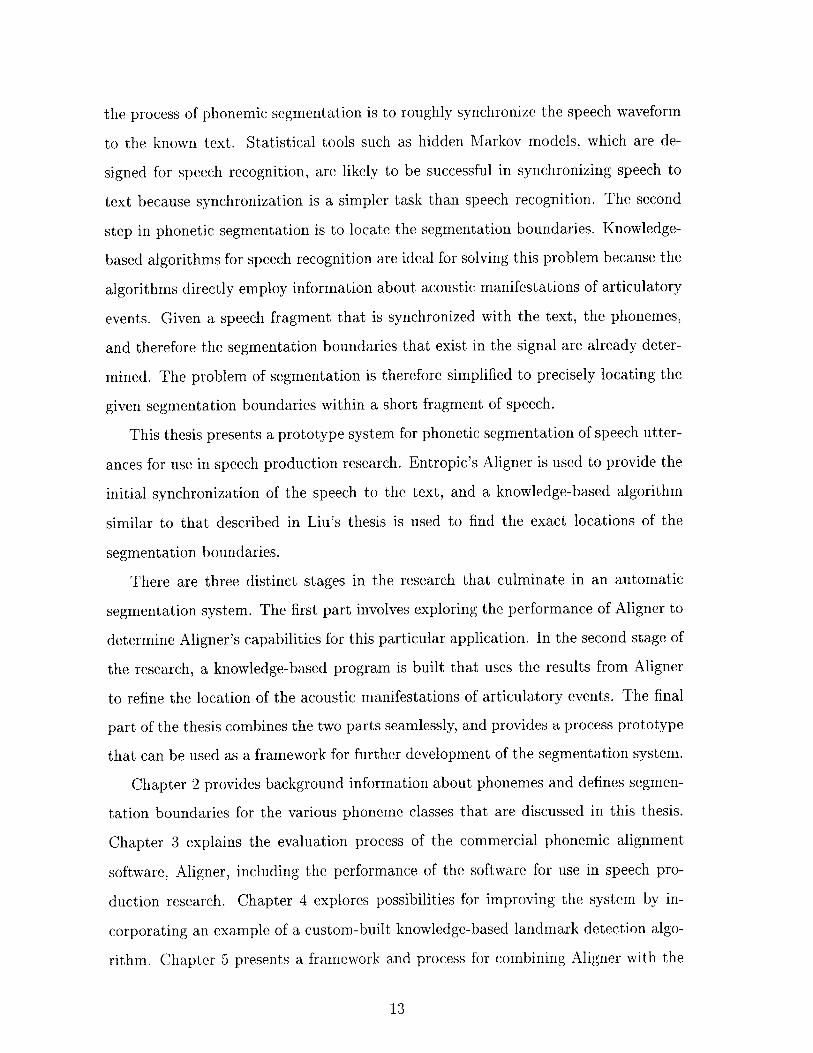
obstructed, no sound is produced. Time B in Fig. 2-2 marks the end of vocal fold
vibrations, manifested as the decay of the signal, in panel 1.
At the release of the closure, a high frequency burst noise is produced. This
burst, produced from air pressure that had up built up behind the closure, creates
turbulence noise when suddenly released. The spectrum of the burst noise contains
information about the type of closure and the subsequent vowel. Different voiceless
consonants produce different burst noises depending on whether the closure is with
the lips, tongue blade or tongue body. The release is considered a landmark and
boundary in the production of a voiceless consonant because of the rapid changes
that occur in the acoustic spectrum at that moment. Time C in Fig. 2-2 marks the
prominent release in the production of the voiceless stop consonant /k/.
After the release, there is a period of time before vocal folds begin to vibrate.
Air continues to flow through the glottis and past the lips. The air passing through
the stiff vocal folds produces aspiration noise. In Fig. 2-2 this is the period of time
delimited by locations D and E. The frequency content of aspiration noise is spread
across both the formant frequency range and the high frequency range. Because the
vocal tract is un-obstructed at this time, energy in the formant frequencies of the
subsequent vowel begins to develop as seen in the spectrogram (panel 2 of Fig. 2-2).
As the vocal folds move back together and slacken somewhat, the aspiration noise
created by the air flow past the glottis diminishes. When the pressure difference across
the glottis is restored, the vocal folds begin to vibrate again and voicing resumes. The
end of the voiceless obstruent consonant and the beginning of the following vowel
are marked by the onset of voicing as shown in time E of Fig. 2-2. The acoustic
18

manifestation of this articulatory event is the rapid increase of acoustic energy in the
formant frequency range. By the time voicing begins, the formant frequencies for the
subsequent vowel, produced by the resonances of the oral pharyngeal cavities, are at
or are approaching their target values.[7]
To summarize, the three boundaries that are used to segment voiceless aspirated
stop consonants are the beginning, which is the time when the closure is produced,
the release, and the onset of voicing, which signifies the end of the consonant. In Fig.
2-2 these refer to times A, C, and E, respectively. Important features relevant to
production of the voiceless stop consonant, such as the voicing onset time (VOT) can
be determined from these boundaries. Because these boundaries are also associated
with crucial spectral information about the consonant they are also the landmarks
that are associated with voiceless stop consonants.
2.2.2 Voiced Stop Consonants: /b/, /d/, /g/
Voiced obstruent consonants are produced with much the same supra-glottal artic-
ulatory movements as voiceless obstruent consonants. However, in the production
of a voiced obstruent consonant the vocal folds and vocal tract walls are slack and
the vocal folds do not spread apart during the closure. As explained below, voicing
continues for a longer period of time after the consonant closure, in voiced consonants
than in voiceless consonants, due to the decreased stiffness in both the vocal tract
walls and the vocal folds. In addition, because the vocal folds do not separate, voicing
may begin almost immediately after the burst release.
As with voiceless obstruent consonants, when the closure is created, sound from
the vocal fold vibrations radiates through the vocal tract walls. The acoustic manifes-
tation of closure is the relatively gradual waning of energy in the formant frequency
regions of the spectrum with some sustained energy in the low frequency regions.
Because of the decreased stiffness in the vocal tract walls, they can expand, allowing
pressure within the supra-glottal cavity to build up more slowly; thereby sustaining
the pressure drop across the glottis for a longer period of time. The slack vocal folds
allow the folds to vibrate with decreased trans-glottal pressure. Therefore, the resid-
19
0.5 --
S0
-0.5-1
0 1000 2000 3000 4000 :5000 6000 7000 8000Time (samples)
3000 T
6000 -
S4000 - - (2)2000 -
0
0 0.05 0.1 0.15 0.2 0.25 0.3 0.35 0.4 0.45 0.5
Time (sec)
SegmentationTimeline II I
Voicing Silence Aspiration VoicingA B C D E
Figure 2-2: Phonetic segmentation for the voiceless stop consonant /k/ in the ut-terance /eka/. The three segmentation boundaries are A, C, and E: A marks thebeginning of the consonant, C marks the release of the closure, and E marks the endof the consonant. B marks the location where vocal folds stop vibrating as a result ofclosure (event A), and D marks the beginning of aspiration, which occurs after theburst (event C).
ual radiation of low frequency energy from the vocal fold vibrations continues past
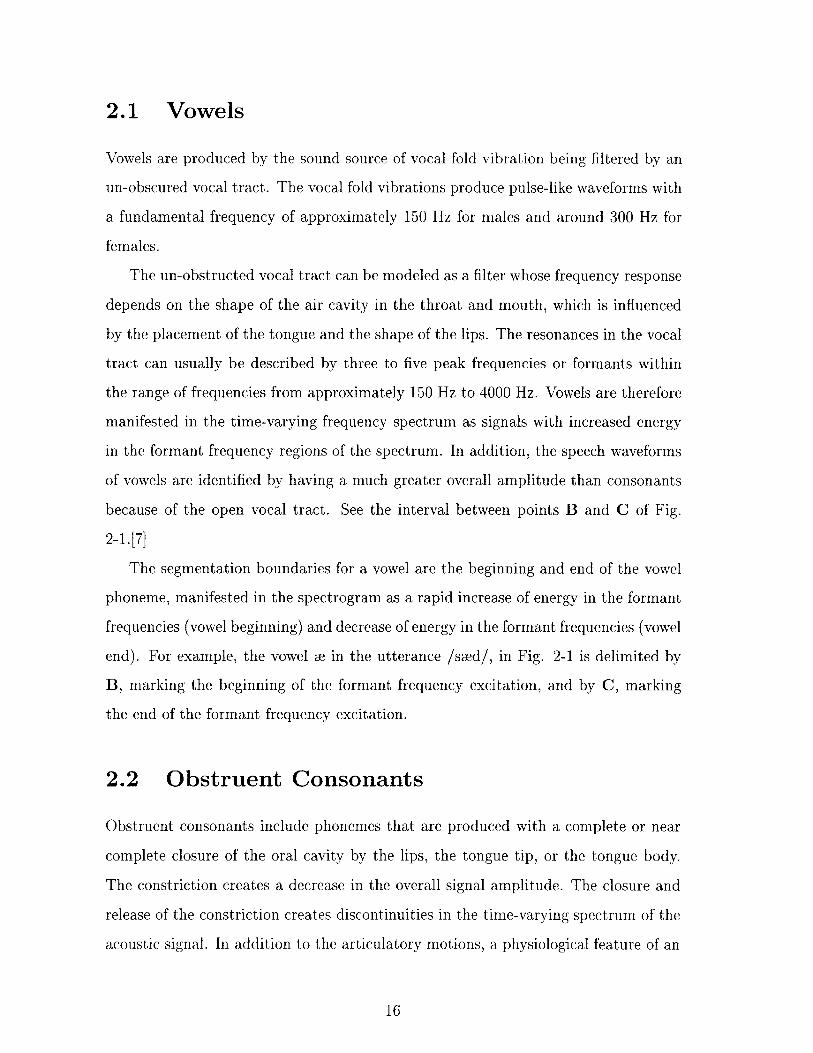
the closure for a longer than in the production of a voiceless stop consonant. Figure
2-3 shows the extended period of vocal vibrations (between points A and B) during
the production of /b/, a voiced consonant.
At the release of the closure, there is a burst of noise followed by a short period
of aspiration. Unlike for voiceless consonants, the vocal folds are already in position
to vibrate immediately after the release. In many cases, such as in location D of
Fig. 2-3, the vocal folds begin vibrating almost immediately after the burst, and the
aspiration time is very short.[7]
Figure 2-3 summarizes the three segmentation boundary locations of voiced stop
consonants. They are time A, which demarcates the beginning of the consonant, time
20

5000
-5000 - (1)
-10000 --
-1500010 1000 200Q 3000 4000 5000 o600D 7000 8000 9000
Time (samples)8000
4000 -(2)
2000
0 0.1 02 0.3 0.4 0.5
Time (sec)
SegmentationTimeline
Voicing Silence VoicingA B C D
Figure 2-3: Phonetic segmentation for the voiced stop consonant, /b/, in the utterance/eba/. The three segmentation boundaries are A, C, and D. A marks the beginningof the consonant, C marks the release of the closure, and D marks the end of theconsonant. B marks the location where the vocal folds stop vibrating due to theclosure (event A).
C, which marks the consonant release, and time D, which marks the consonant end.
2.2.3 Voiceless Fricatives: /f/, /s/, /s/
The production of voiceless fricatives requires a near closure in the vocal tract. This
closure causes both frication (high frequency noise) and a decrease in the overall
amplitude of the signal, as shown in Fig. 2-4 between points B and C. Between
the points A and B, the voicing diminishes. Two events in the production of a
voiceless fricative cause this diminution. The vocal folds begin spreading apart, and
the constriction begins to form. These events cause the pressure to increase in the
supra-glottal cavity, and the vocal folds to cease vibrating.
As the vocal folds cease vibrating, the glottal opening increases in size to facilitate
the generation of frication noise at the constriction. The expanded cross-sectional area
of the glottis and the raised supra-glottal pressure cause an increase in the airflow
velocity through the constriction. When this airflow is obstructed by the constriction,
21

turbulent high frequency noise is produced. The continuation of the turbulence is
aided by stiff vocal tract walls that help maintain the high supra-glottal pressure.
The segmentation boundary for the beginning of the fricative is defined by the onset
of turbulence noise. In the time-varying frequency spectrum, this is marked by the
increased energy in the high frequency bands, shown at time B in panel 2 of Fig. 2-4.
In the sound pressure waveform, turbulent noise is marked by a substantial increase in
zero crossings and a decrease in overall amplitude in relation to the preceding vowel.
The end of the fricative is determined by the release of the constriction. Unlike
the case of voiceless stop consonants, where the boundary delimiting the end of the
consonant is equivalent to the beginning of the following vowel (as shown in Fig.
2-2 at location E), the time of the end of the voiceless fricative is generally not the
beginning of the subsequent phoneme. The release of the constriction marks the end of
the fricative. At this time the turbulence noise diminishes, and the energy in the high
frequency bands discontinues. There maybe a short time period after the frication
ends before voicing begins again. In this time, the glottal opening narrows, and the
pressure drop across the glottis is re-established. This period of time is included in
neither the fricative nor the vowel.[7]
To summarize, the two important boundaries for segmenting a voiceless fricative
phoneme such as /s/, as shown in the utterance /a sa/ in Fig. 2-4, are time locations
B, marking the beginning of the consonant, and C, marking the end of the consonant.
22

x104
2
0
-2
-40
I I.LJ~MIU~IQM~(1)
1000 2000 3000 4000 5000 6000Time (samples)
7000
8000
>~6000
0
0 0.05 0.1 0.15 0.2 0.25 0.3 0.35 0.4
Segmentation Time (sec)Timeline .
Voicing I I Frication Voicing
A B CD
Figure 2-4: Phonetic segmentation of the voiceless fricative /s/ in /a sa/. The two
segmentation boundaries are B and C: B marks the beginning of the consonant, Cmarks the release of the closure. A marks the end of the preceding vowel, and Dmarks beginning of the subsequent vowel.
23
Chapter 3
Aligner
Aligner is a system developed by Entropic, as part of a speech recognition software
toolkit for use in research. Aligner was developed specifically for speech research, pro-
viding time-tagged word-level and phone-level transcriptions of speech signals. Such
transcriptions allow the researcher to easily locate and extract the speech fragments
that correspond to specific phones or words. Aligner first translates the supplied text
into a sequence of phones using a dictionary of phonetic pronunciations. Then us-
ing hidden Markov models, Aligner probabilistically correlates the words and phones
to the corresponding signal fragment in the speech waveform. Aligner returns two
text files, one is a list of time-tagged word labels and another is of phone labels.'[1]
Because of the similarities between phonetic alignment and phonetic segmentation,
Aligner was chosen as the first stage of the automatic segmentation system.
The first step in implementing Aligner as part of a phonetic segmentation system
is to investigate Aligner's performance for this particular purpose. There are three
goals: (1) to determine how much time and work is required to prepare the signal
for alignment and to gain an understanding of how to use Aligner, (2) to determine
whether aligner correctly detects and locates the relevant utterances and to gage the
reliability of the results, and (3) to determine which boundaries Aligner locates and
to what degree of precision and accuracy.
'An example of these output files are in Fig. 5-4.
24
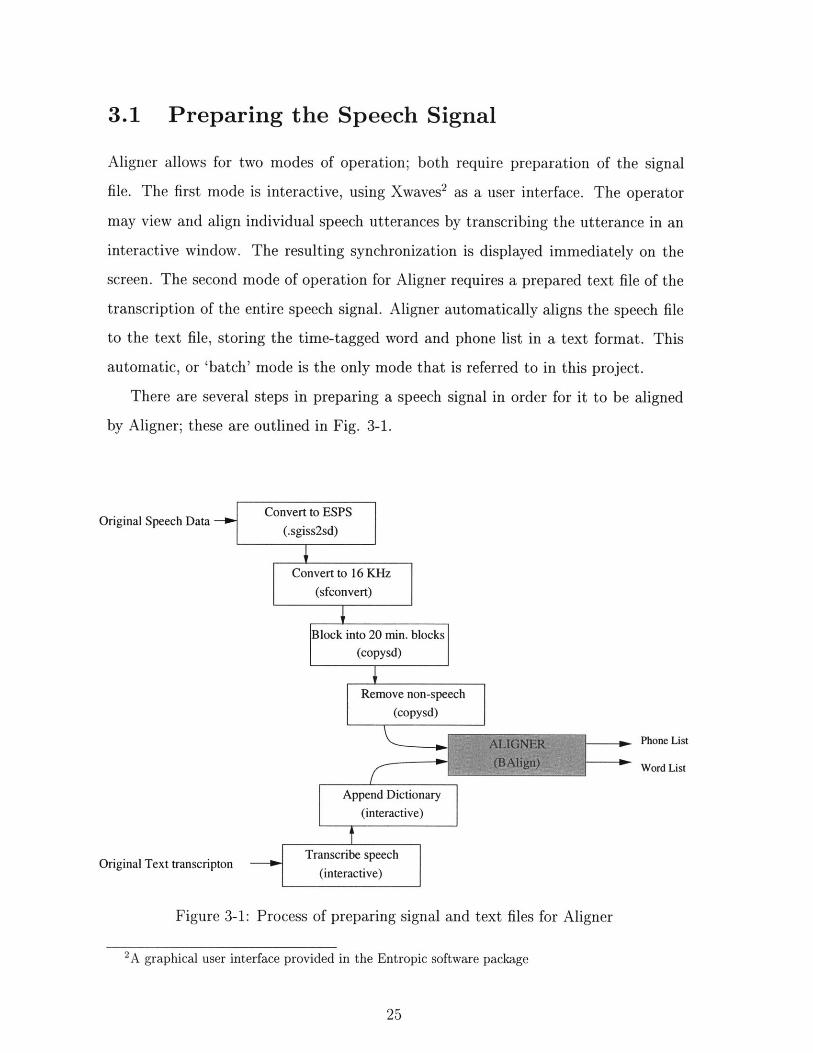
3.1 Preparing the Speech Signal
Aligner allows for two modes of operation; both require preparation of the signal
file. The first mode is interactive, using Xwaves2 as a user interface. The operator
may view and align individual speech utterances by transcribing the utterance in an
interactive window. The resulting synchronization is displayed immediately on the
screen. The second mode of operation for Aligner requires a prepared text file of the
transcription of the entire speech signal. Aligner automatically aligns the speech file
to the text file, storing the time-tagged word and phone list in a text format. This
automatic, or 'batch' mode is the only mode that is referred to in this project.
There are several steps in preparing a speech signal in order for it to be aligned
by Aligner; these are outlined in Fig. 3-1.
Original Speech Data
Phone List
Word List
Original Text transcripton
Append Dictionary
(interactive)
Transcribe speech
(interactive)
Figure 3-1: Process of preparing signal and text files for Aligner
2A graphical user interface provided in the Entropic software package
25

In order to prepare the speech signal for use in Aligner or any of the Entropic
tools, the signal must be in a file format that is ESPS3 compatible. Speech files
that are stored on VAX machines can be transferred to a UNIX machine through
the file transfer protocol (ftp) and converted to the ESPS file format using programs
within the Entropic toolkit. The current protocol for the file conversion is a program
.sgiss2sd. This program (run on an SGI machine) converts the signal to an Entropic
signal file and amends the header information. This process takes about 15 minutes
for a 100 MB speech signal.
Because Aligner has hidden Markov models trained for speech sampled at 8 kHz
and 16 kHz only, speech signals that are not sampled at 8 kHz or 16 kHz must also be
down-sampled to either 16 kHz or 8 kHz to optimize the HMM algorithm. Otherwise,
Aligner will automatically choose the model that is closest to the signal's sample rate.
In order to down-sample the files, the ESPS toolkit provides a re-sampling program,
sf convert. It takes the parameters [infile] [outfile] and the option '-s', which allows
the user to define a new sample rate. This program can be run from any workstation
with the ESPS toolkit, however it is most efficient to run the program from computer
where the signals are stored. This process takes about half an hour for a 100 MB
speech signal.
After the signal file has been converted to ESPS format and re-sampled to either
8 Khz or 16 Khz, the signal needs to be further processed for Aligner. A long speech
signal must be blocked into approximately 20 minute blocks; this is necessary for
Aligner to run in the automatic batch mode. Although, theoretically, the size of
the speech file does not matter because Aligner works only on a small segment of
speech at a time, the manual suggests speech files be limited to about 10 minutes.
The memory capacity of the computer may cause failure for longer files. In addition,
extraneous non-speech sounds must be removed; an example might be a tone used
to calibrate the sound level. The ESPS software package includes commands such as
copysd that can be used to copy parts of the speech signal while preserving the time
tags for the original signal. In this way, although the signal waveform is broken into
26
3 Entropic Speech Processing System
more than one file, the time tags of the phone and word list are still consistent with
the original signal file.
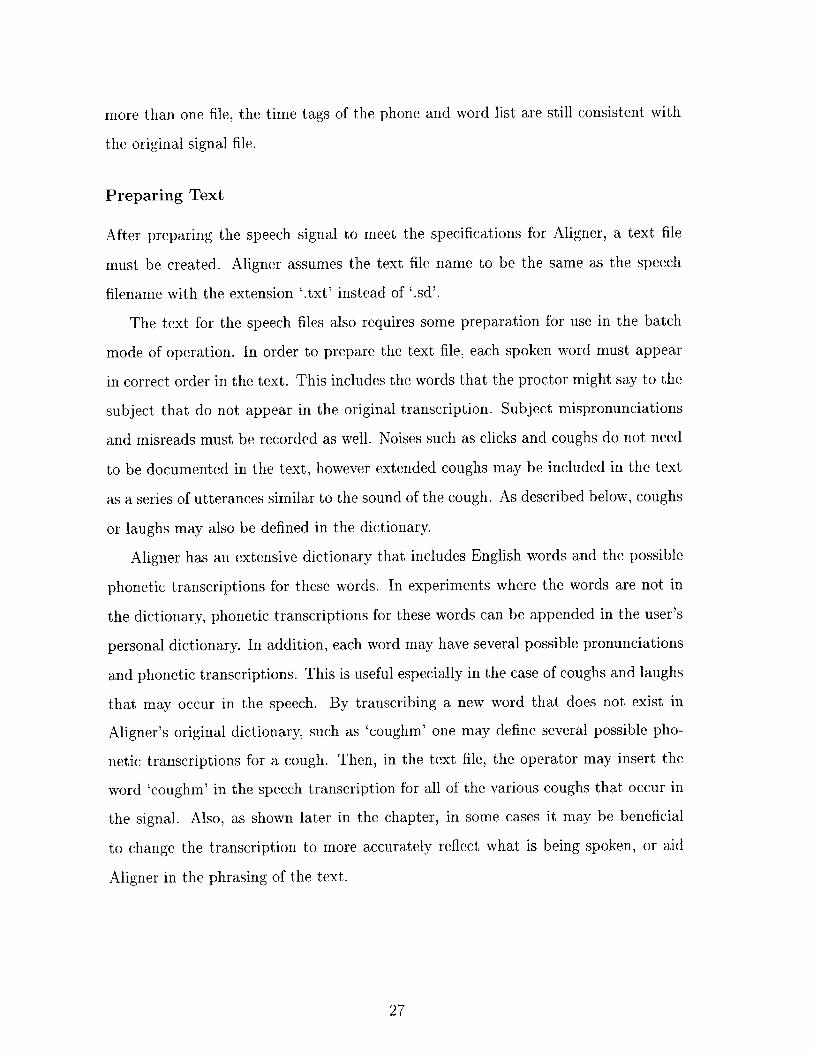
Preparing Text
After preparing the speech signal to meet the specifications for Aligner, a text file
must be created. Aligner assumes the text file name to be the same as the speech
filename with the extension '.txt' instead of '.sd'.
The text for the speech files also requires some preparation for use in the batch
mode of operation. In order to prepare the text file, each spoken word must appear
in correct order in the text. This includes the words that the proctor might say to the
subject that do not appear in the original transcription. Subject mispronunciations
and misreads must be recorded as well. Noises such as clicks and coughs do not need
to be documented in the text, however extended coughs may be included in the text
as a series of utterances similar to the sound of the cough. As described below, coughs
or laughs may also be defined in the dictionary.
Aligner has an extensive dictionary that includes English words and the possible
phonetic transcriptions for these words. In experiments where the words are not in
the dictionary, phonetic transcriptions for these words can be appended in the user's
personal dictionary. In addition, each word may have several possible pronunciations
and phonetic transcriptions. This is useful especially in the case of coughs and laughs
that may occur in the speech. By transcribing a new word that does not exist in
Aligner's original dictionary, such as 'coughm' one may define several possible pho-
netic transcriptions for a cough. Then, in the text file, the operator may insert the
word 'coughm' in the speech transcription for all of the various coughs that occur in
the signal. Also, as shown later in the chapter, in some cases it may be beneficial
to change the transcription to more accurately reflect what is being spoken, or aid
Aligner in the phrasing of the text.
27

Alignment
The command BAlign [infile.sd] is used to call Aligner using the batch mode. Aligner
first reviews the text file for words that are not in the dictionary and prompts the
user for the phonetic transcription of those words. If none of the words appear in
Aligner's dictionary, the process is immediately aborted. If all of the words are in
the dictionary, Aligner automatically continues to align the speech files. The process
takes about an hour for a 20 minute signal file.
Summary of Signal and File Preparation
The procedure for preparing a speech signal and its accompanying text for phone-
mic alignment involves several processes: formatting, down-sampling, blocking, tran-
scription, and definition. Formatting and down-sampling are both steps that involve
minimal operator involvement. Although they may take over an hour to process, for
large signals, the operator does not need to be present. Blocking and word-definition
require more interaction from the operator, however for many signals these steps may
not be necessary. One of the most important steps, producing the transcription of the
speech file, involves the most time and effort. The minimum time required for this
process is the length of time of the signal, as the operator must listen to the signal for
errors or differences between the text and speech files. This processing time increases
in cases where the original transcription does not reflect the speech signal.
Compared to the amount of work that is required to manually segment the speech
waveform, the preparation time for Aligner seems insignificant. There are many ways,
however, to minimize this time. Most of these can be addressed during the initial
recording and processing of the speech signal. For example during the recording, the
proctor may limit the recording of extraneous speech and simultaneously amend the
text to reflect the recording as changes occur. During the original pre-processing, it
is possible to digitize the speech signal at 8 kHz, or 16 kHz, and block the signal into
20 minute segments.
28

3.2 Performance Test
Aligner's phonetic synchronization performance is evaluated on speech signals that
were recorded previously for speech production related research. The speech files are
all recorded in the research environment. This means that the subjects are recorded in
a quiet environment, deliberately reading short prescribed utterances from a prompt.
Between each utterance there is a significant pause. In general, only one word changes
from one utterance to the next, for example, 'Say kok again. Say bob again.' These
speech files include both male and female speakers, as well as normal, fast, clear,
'fast clear', and slow speech. All of the speakers are native English speakers with no
prominent speech impairment.
The speech waveforms had been previously segmented manually by a phonetician
at the time of the original experiment. In order to test Aligner's performance as a
method of synchronizing phones to the speech waveform, the results from Aligner
were compared to the segmentation marks that were determined by a phonetician. In
each speech production experiment, there is a specific set of segmentation boundaries
that are important to the particular study. Aligner is evaluated on how reliably it
locates each utterance, whether it detects and locates each type of boundary, and the
degree of accuracy of the segmentation.
3.2.1 Speech Database
Primarily, three speech signals were used in the preliminary test to evaluate Aligner.
CK8FR
The first signal, ck8fr, is a recording of a male speaker reciting the phrases 'a shad',
'a said', 'a shed', and 'a sad' in a pseudo-random order. The important segmentation
boundaries for the original experiment are the boundaries for the voiceless fricative
/s/ and /s/, and the following vowel, both within the consonant-vowel-consonant
(CVC) word. This particular signal is used to test Aligner's reliability in locating
utterances in a relatively simple speech file.
29

FM9SGSP
This signal file is a recording of a female speaker reciting sentences such as 'Twelve,
say bot again. Thirteen, say dut again...' In the original experiment, the important
boundaries are those that correspond to the end of the /e/ in 'say', the beginning,
release, and end of the first consonant in the CVC, and the beginning and end of
the vowel in the CVC. This particular signal was chosen to test Aligner's potential
on speech utterances of medium difficulty. This signal also provides an indication of
Aligner's phonetic synchronization with a greater variety of phonemes.
CC2SPC
Cc2spc is a recording of a male speaker, reciting a list of sentences such as, 'Say
gug again. Say pop again...' The experiment is blocked into five distinctly different
speech styles: normal, clear, fast, 'fast clear', and slow. For the original experiment,
the important boundaries are the end of the /e/ in 'say', the beginning, and release of
the first consonant in the CVC and the beginning and end locations of the subsequent
vowel. This speech signal was chosen to test Aligner's performance on a variety of
speaking conditions that may be present in future speech-production experiments.
3.2.2 Methods and Results
For the purposes of the automatic segmentation system outlined in Chapter 1, the
primary intention of using Aligner is to roughly synchronize the signal to the phonetic
transcription. This involves correctly detecting and locating the utterances. In order
for Aligner to be useful in the synchronization part of the automatic segmentation
system, it is important that the detection of the utterances is highly reliable. The
location of the boundaries may be less precise, however, because subsequent processes
will refine their locations.
In order to evaluate Aligner's performance, its results were compared with bound-
ary marks that had been assigned by a phonetician.
30
Detection
Aligner's initial response to the detection of utterances in the ck8fr signal was medio-
cre. Aligner correctly detected the utterances only 88% of the time. This level
of accuracy would not be sufficient for the first stage of the automatic phonemic
segmentation system. For this particular signal, the main error that Aligner made
was appending a /a/ at the end of some utterances. An example of this error would
be if Aligner were to synchronize the phonetic transcription /a sad a/ to the acoustic
speech signal fragment representing 'a said.' Consequently, the subsequent utterance
would also have an error because the initial /a/ had been synchronized to the previous
utterance. This problem is particular to this specific type of speech phrase, however.
In the other signal files, fm9sgsp and cc2spc, the detection of the unmodified text file
is close to 100%.
In the case of ck8fr, it is possible to improve the reliability of the detection process
by redefining the utterance phrases as single words. That is, instead of 'a shed, a sad,'
the text would be transcribed as 'ashed, asad.' These words must then be defined in
the Aligner dictionary with their phonetic transcription. After doing so, the results of
the detection of the utterances is close to 100%. These result indicate that detection
rate is high for the types of speech utterances that are recorded for this particular
type of speech production research. Thus, in the limited case of repeated simple
phrases and sentences, Aligner is a reliable method for the purpose of synchronizing
speech waveforms to the text.
Location
The precision of the phone locations and the phonetic boundaries that Aligner de-
tects is much more difficult to evaluate quantitatively. In each of the speech signals,
the subject is different, and the contexts of the phonemes change. In addition, the
definition of the phone boundaries in Aligner may be different than those given in
Chapter 2.
The first step in the evaluation of boundary location is to identify which bound-
31

aries Aligner locates. As mentioned earlier, Aligner demarcates the end of each phone.
Unless it assigns a '<SIL>' symbol between phone boundaries to indicate silence,
Aligner assumes that the location of the end of one phone is the beginning of the
next phone. With the phone boundaries as defined in Chapter 2, this is not al-
ways the case, especially with voiceless fricatives. In addition, in the case of stop
consonants, it is ambiguous whether Aligner's phone boundary corresponds to the
consonant release or the consonant end as defined in Chapter 2.
In all three speech signals, important boundaries are those associated with the first
consonant and the vowel in the CVC. Except in the case of voiceless stop consonants,
Aligner's location for the end of the consonant is closest to the location that was
defined in Chapter 2 for the beginning of the subsequent vowel, that is, the onset
of voicing. On average, Aligner locates this boundary within 10 milliseconds of the
phonetician's boundary. For voiced stop consonants, the defined consonant end is
equivalent to the defined beginning of the following vowel (voicing onset). However,
there are problems with other phoneme classes. In the case of voiceless fricatives, the
defined consonant end is the cessation of frication, not the onset of voicing (as Aligner
would choose). In the case of the voiceless stop consonant, Aligner's boundary for the
consonant end does not necessarily coincide with the consonant release or consonant
end. It varies greatly, possibly because of the long period of aspiration, which is
associated with voiceless stop consonants between the burst and the voicing onset.
Aligner generally places the end of voiceless stops somewhere between the release and
the voicing onset.
In the case of the vowel-end boundary in the cc2spc signal, Aligner mostly locates
the boundary within 10 milliseconds of the phonetician's segmentation, when the
vowels are followed by a voiced stop consonant. In the case where the vowel is
followed by a voiceless consonant, such as /f/, or /k/, the average error for Aligner is
between 10 to 20 milliseconds. This result is consistent with the results for the end
boundary of the vowels in the utterances in ck8fr, as well.
The performance of Aligner also varies depending on the speaking conditions.
Aligner performs the better on speech that is fast and or clear, and worst on slow
32

speech. The fast and clear speech data are possibly more similar to the models that
were used to create the speech alignment algorithm.
3.2.3 Summary of performance
Aligner performs quite well and is reliable in the task of synchronizing speech to text.
The locations of the phone boundaries, however are incomplete and not precise. The
boundaries that Aligner does not locate are:
" consonant and vowel beginning when not equivalent to the end of the precedingphone
" consonant release for stop consonants
* vowel end when followed by a voiceless consonant
Overall, Aligner provides a sufficient first step in phonemic segmentation, however
it must be accompanied by a comprehensive boundary detection algorithm for a
complete automatic segmentation system.
33
Chapter 4
Knowledge-based Algorithm
The results from the preliminary test of Aligner show that it is reliable for synchro-
nizing the speech signal to the text; however, the specific phone locations that Aligner
labels are not necessarily useful segmentation boundaries. Although Aligner approxi-
mately locates boundaries such as vowel and fricative end locations, Aligner does not
at all locate the release or end of voiceless stop consonants.
The results from Aligner can be used as a first stage in a knowledge-based segmen-
tation system. Because Aligner performs the process of synchronization, the process
of segmentation is simplified. With a text-synchronized signal, it is possible to ex-
tract a fragment of the signal and know that the signal fragment contains the acoustic
manifestations of certain phonemes. Then the knowledge-based segmentation process
has only the relatively straightforward task of locating the boundaries associated with
those phonemes.
This chapter presents a knowledge-based algorithm that locates the acoustically
abrupt phonemic boundaries within a signal fragment. In addition, a prototype pro-
gram is built using the knowledge-based algorithm to locate the boundaries specif-
ically associated with voiceless stop consonants. Chapter 6 will discuss the results
of using this program in conjunction with Aligner as a prototype for a complete
automatic segmentation system.
34
4.1 Overview
Most often, segmentation boundaries occur in locations where the acoustic properties
of speech are rapidly varying. The segmentation boundaries for unvoiced obstruent
consonants generally fall in this category. The location of these boundaries can be
found by considering the relationship of the underlying articulatory events to rapid
changes in the energy content within a band of frequencies in the spectrogram repre-
sentation of the signal. The process of locating these events in the frequency spectrum
is similar to the process outlined by Liu[3].
First, the signal is represented in the frequency domain, where energy content in
different bands of frequency is found as a function of time. Then the energy plots are
smoothed to two levels of time resolution and differentiated to find the locations of
peak energy change. Using both the coarse and fine energy signals, the location peak
energy change in each frequency band can be determined.
Based on knowledge of the articulatory events that occur in the production of
a phoneme, the location of the segmentation boundaries are determined from these
peaks. This information includes both the acoustic properties of the articulation,
and specific timing information that is known about the articulation, such as the
speed at which articulators move. This process is tailored to each phoneme or class
of phonemes, in order to incorporate phoneme-specific information. For example in
voiceless fricatives, the rapid decrease in energy in the formant frequency bands due
to the closure occurs before the rapid increase of energy in the high frequency bands
due to the frication.
4.2 General Algorithm
The first step outlined above in the process of segmentation is to calculate the time-
varying energy content of the signal in different frequency bands. This is calculated
using a time-dependent discrete Fourier transform, or 'spectrogram'. The signal is
windowed over a short period of time, and the frequency characteristics for that
35
Speech Signaldata sampled at 16Khz
: Peak Detector
LandmarkDetector
Figure 4-1: General Process for finding Abrupt Landmarks. Abrupt landmarks aredetermined by finding locations where the energy in a frequency band changes rapidly.This is done through fine and coarse processing, where the energy signal is smoothedand differentiated, and landmarks are located by a peak detector and related to thesignal through other knowledge-based processes.
36
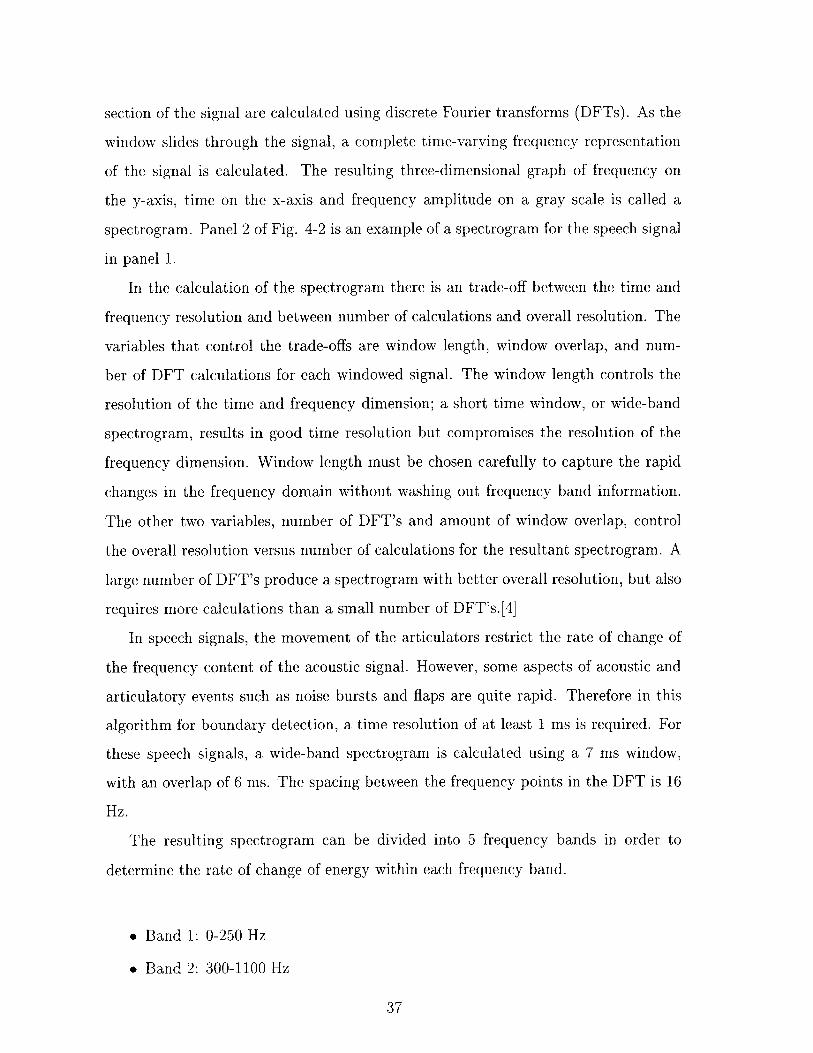
section of the signal are calculated using discrete Fourier transforms (DFTs). As the
window slides through the signal, a complete time-varying frequency representation
of the signal is calculated. The resulting three-dimensional graph of frequency on
the y-axis, time on the x-axis and frequency amplitude on a gray scale is called a
spectrogram. Panel 2 of Fig. 4-2 is an example of a spectrogram for the speech signal
in panel 1.
In the calculation of the spectrogram there is an trade-off between the time and
frequency resolution and between number of calculations and overall resolution. The
variables that control the trade-offs are window length, window overlap, and num-
ber of DFT calculations for each windowed signal. The window length controls the
resolution of the time and frequency dimension; a short time window, or wide-band
spectrogram, results in good time resolution but compromises the resolution of the
frequency dimension. Window length must be chosen carefully to capture the rapid
changes in the frequency domain without washing out frequency band information.
The other two variables, number of DFT's and amount of window overlap, control
the overall resolution versus number of calculations for the resultant spectrogram. A
large number of DFT's produce a spectrogram with better overall resolution, but also
requires more calculations than a small number of DFT's.[4]
In speech signals, the movement of the articulators restrict the rate of change of
the frequency content of the acoustic signal. However, some aspects of acoustic and
articulatory events such as noise bursts and flaps are quite rapid. Therefore in this
algorithm for boundary detection, a time resolution of at least 1 ms is required. For
these speech signals, a wide-band spectrogram is calculated using a 7 ms window,
with an overlap of 6 ins. The spacing between the frequency points in the DFT is 16
Hz.
The resulting spectrogram can be divided into 5 frequency bands in order to
determine the rate of change of energy within each frequency band.
" Band 1: 0-250 Hz
" Band 2: 300-1100 Hz
37

e Band 3: 1100-4000 Hz
" Band 4: 4000-5000 Hz
" Band 5: 5000-7000 Hz
The frequency bands are chosen to reflect articulatory information about the signal
production, particularly for a male speaker. For example, pronounced energy in the
frequency band below 250 Hz generally indicates glottal vibration, or voicing. Sounds
with energy in these frequencies may be emitted through the vocal tract walls even
when there is a closure in the vocal tract, such as in the production of a voiced
consonant. Energy in frequencies from 250 Hz - 3000 Hz generally indicates that the
oral tract is open and that the sound is produced by glottal vibrations filtered by
the resonant frequencies of the vocal tract and radiated through the lips. The vocal
tract resonant frequencies in this and higher bands are called the formant frequencies;
they are present in vowel production. The formant frequency range has been divided
into a low and high bands to reflect information about changes of the first formant
frequency versus changes in the second, third, and forth formants. Most energy above
4000 Hz is generally produced by some sort of turbulence noise, such as air flowing
through a narrow constriction, or a burst of air created at the release of a closure.
The turbulent noise region is also divided to two regions to provide useful information
about different types of fricative and burst noises.
Only selected bands of frequencies are processed through the subsequent stages
in order to determine the landmark locations. By selectively choosing only the bands
that carry the pertinent information for a particular landmark, the calculations are
minimized. For example in order to find the landmarks related to the phoneme /k/,
bands 2 and 5 are significant because they contain acoustic energy that is related to
consonant closure, consonant release, and voicing onset.
The energy in each of the selected bands is then calculated by summing the ab-
solute value of the energy content over the frequencies in each band for each time
instance. Because these 16 kHz sampled signals were transformed using a 1000 point
DFT, the frequency points are spaced 16 Hz apart. The sum is then converted to
38

energy by scaling the values by 20logio.
These energy signals are then passed through a two-level refinement process. The
first stage involves finding the average rate of change for a smoothed energy signal.
The energy signal is smoothed by an averaging filter of length 16. A rate of rise (ROR)
or derivative is calculated from this smoothed energy signal using a differentiator filter.
The places of abrupt acoustic changes can be determined by the peaks and minima
of these ROR signals. Often, there may be multiple peaks in the signal, some of
which are unimportant. In this case, knowledge of signal timing may be important in
identifying the correct peaks. An example of this is using the minimal voicing onset
time (VOT) for unvoiced consonants, to require that the release peak be at least 50
ms before the voicing onset peak.
In order to refine the location of these peaks, an identical process is performed
on the energy signal with a shorter smoothing and derivative filter. In this refined
processing, there are many irrelevant peaks due to noise, so the landmark is restricted
to be within some epsilon of the peak obtained in the coarse process.
Finally, the refined peaks are related to the signal. This process must take into
consideration how the signal fragments relate to the overall time signal, accounting for
the samples that are added or deleted in the process of transforming and convolving
the signal.
4.2.1 Voiceless Stop Consonants
One prototype of the knowledge-based algorithm was built specifically to segment
voiceless stop consonants. In the specific process of segmenting voiceless stop con-
sonants, regions of the speech signal that contain the phonemes are identified and
isolated along with the adjacent speech sounds.
The isolated speech signal fragment is processed by the above procedure in order
to locate the prominent landmarks. The most prominent and consistent peak of the
energy ROR signal occurs in the 4th and 5th frequency bands (bands that monitor
energy in the fricative and burst frequencies). This location coincides with the con-
sonant release. The consonant release is then used to help locate and identify the
39

instance of closure and voicing onset.
In voiceless consonants, the instance of closure and the onset of voicing can be
determined by negative and positive peaks in the second energy band. This band
includes the first formant frequency, the most prominent formant. The third panel
from the top of Fig. 4-2 shows the energy content of the second energy band (from
300 Hz to 1100 Hz). The derivative of this signal in panel 4 shows a prominent
negative peak where voicing ceases at location A, and a prominent positive peak
when voicing resumes at location C. In this knowledge-based algorithm, information
about the timing of the boundary locations can also be included. For example, in
voiceless consonants the cessation of voicing always occurs before the release, and the
onset of voicing always occurs after the release. Therefore the algorithm only searches
for the negative peak in the ROR of band 2 in the region of time before the release
peak, and the positive peak in the ROR of band 2 in the time after the release peak.
In addition, if it is known that the utterances are spoken clearly and distinctively,
the algorithm can also incorporate information about the amount of time between
the peaks.
4.2.2 Generalization to Other Types of Phones
This method of finding segmentation boundaries by finding areas in the signal where
energy in the frequency spectrum is rapidly varying is useful for other phonemes
besides voiceless consonants. For example in the production of a vowel, the onset of
voicing is marked by a rapid increase of energy in the formant frequency bands. In
general, this algorithm can be modified to find the boundary locations of vowels and
obstruent consonants.
4.3 Implementation and Preliminary Results
The prototype knowledge-based algorithm for the boundary location of voiceless stop
consonants and was programmed in MATLAB. Because it has a signal processing
library that contains many of the procedures required in this algorithm, such as
40
5000
0
-.5000
-10000
8000
U
U
-o N
0~ '-4
'-4 0U~
[J.~
0
'-4U
6000
4000
2000
0
100
(1)
0.05 0.1 0.15 0.2 0.25 0.3 0.35 0.4 0.45 0.5 0.55
60
0
100
50
-50
0
100 200 300 400 500
100 200 300 400
A B C
(2)
(3)
(4)
Figure 4-2: Segmentation of /k/ in /eka/. A marks the negative peak in the energyROR that represents the cessation of voicing and the beginning of the consonant. Bmarks the peak in the energy ROR, corresponding to the release. C marks the peakthat occurs after the release, the onset of voicing.
41
80
I

spectrogram calculation, MATLAB is an ideal programming environment for building
the prototype versions of the knowledge-based segmentation program. In addition,
MATLAB's graphing capabilities provide valuable insight into the various steps in the
process, such as graphing the energy in different bands to visually locate the peaks.
Finally, MATLAB programs are easy to edit, so changes in the prototype programs
can be made easily.
Preliminary tests on the knowledge-based segmentation algorithm were performed
using test signal fragments from the signal cc2spc. Signal fragments were manually
extracted from the entire signal to isolate the phoneme that required segmentation
(/k/, /t/, and /p/) with the adjacent phonemes in the signal. Because these phonemes
were all located in similar utterances, the adjacent phonemes were /e/ (occurring be-
fore the consonant) and /a/ (occurring after the consonant). Therefore, each signal
fragment contained the acoustic manifestation of three phonemes. In the fully auto-
mated system that is explained in Chapter 5, these extractions depend on the results
from Aligner; therefore, the signal fragments that were manually extracted for this
test were also derived from Aligner's results. The event locations that Aligner found
to be the beginning of the first phoneme (/e/) and the end of the third phoneme (/a/)
were used to extract the signal fragment regardless of the precision of the synchroniza-
tion labels. The preliminary results of the knowledge-based segmentation algorithm
for voiceless stop consonants showed that the algorithm is successful in locating the
correct segmentation boundaries.
In the process of testing the algorithm, variables within the knowledge-based
algorithms were modified slightly in order to optimize the results. These variables
include the cut-off frequencies for the frequency bands, the resolution of the fine
and coarse processing, and the timing factors that aid the location of segmentation
boundaries. It is very time consuming to fully optimize the algorithm for a particular
speech signal. In addition, variables that are optimized for one speech signal my not
be optimized for another speech signal. Therefore it may not be beneficial to fully
optimize the variables for one signal.
42

Chapter 5
Implementation
The knowledge-based program described in Chapter 4, which determines the locations
of acoustic landmarks, does not make a sufficient segmentation system since the user
must painstakingly identify and label each speech utterance to be processed by the
program. The segmentation process described below is able to take the results from
Aligner to segment the entire signal, using the knowledge-based algorithm described
in Chapter 4 as the core processor.
Segmentation Process
Figure 5-1 shows how the segmentation process fits into the entire automatic phonemic
segmentation system. The first part of the system is the process of preparing the
signal and text files from the raw files. This step, as described in Chapter 3, includes
editing the text file and formatting the signal file. The conventions for naming the
prepared speech and text files are filename.sd and filename.txt, respectively. The
Raw
Figure 5-1: Overview of the automatic segmentation system
43
Phoneme Class A & Segmentation Phoneme Class B & SegmentationSignl~sdModule 1 Module 2
Signal.words
Signal.phones Sgetio ignal.phones (new emntto Signal.phones (new)
Segmentation
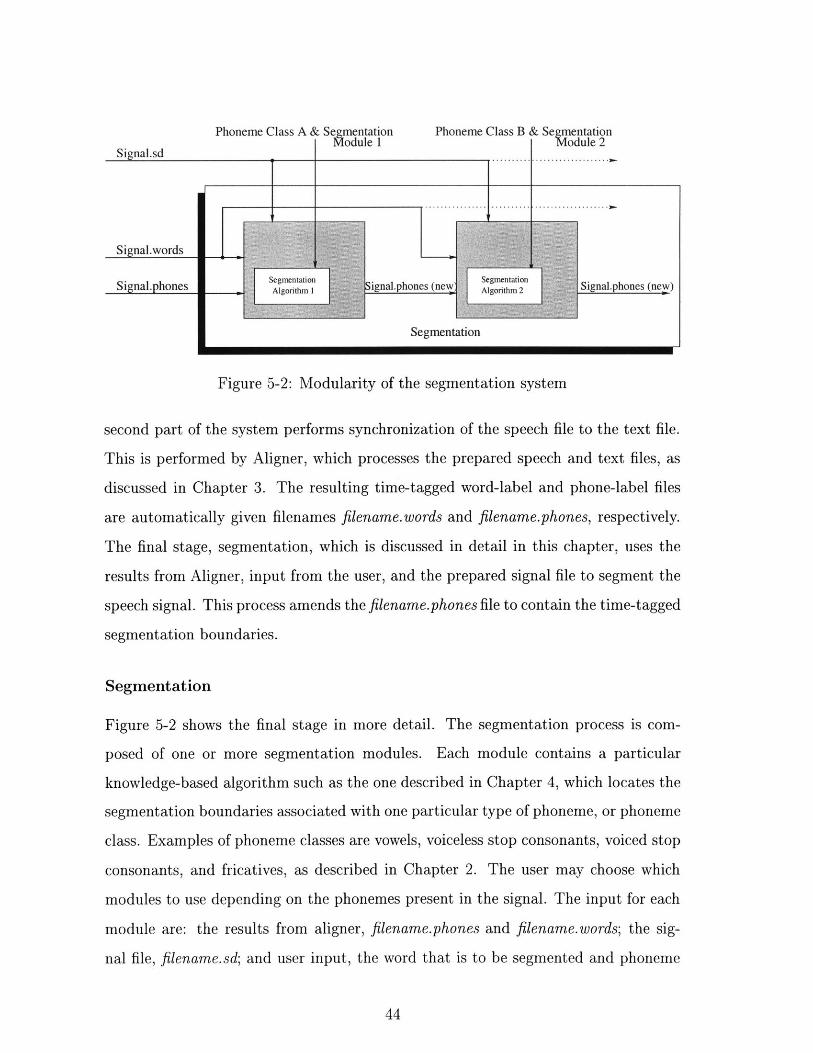
Figure 5-2: Modularity of the segmentation system
second part of the system performs synchronization of the speech file to the text file.
This is performed by Aligner, which processes the prepared speech and text files, as
discussed in Chapter 3. The resulting time-tagged word-label and phone-label files
are automatically given filenames filename.words and filename.phones, respectively.
The final stage, segmentation, which is discussed in detail in this chapter, uses the
results from Aligner, input from the user, and the prepared signal file to segment the
speech signal. This process amends the filename.phones file to contain the time-tagged
segmentation boundaries.
Segmentation
Figure 5-2 shows the final stage in more detail. The segmentation process is com-
posed of one or more segmentation modules. Each module contains a particular
knowledge-based algorithm such as the one described in Chapter 4, which locates the
segmentation boundaries associated with one particular type of phoneme, or phoneme
class. Examples of phoneme classes are vowels, voiceless stop consonants, voiced stop
consonants, and fricatives, as described in Chapter 2. The user may choose which
modules to use depending on the phonemes present in the signal. The input for each
module are: the results from aligner, filename.phones and filename.words; the sig-
nal file, filename.sd; and user input, the word that is to be segmented and phoneme
44

class module name. The module processes the entire signal and returns the file-
name.phones file edited with the new boundary locations. The input for additional,
subsequent modules in the segmentation process (e.g. phoneme module 2 in Fig.
5-2), are the original speech and text files, new input from the user, and the newly
modified phone file.
Segmentation Module
Within each segmentation module are several components, (as shown in Fig. 5-3)
including a knowledge-based segmentation algorithm, such as the one discussed in
Chapter 4. The module contains the core functionality for integrating the segmenta-
tion algorithm with the results from Aligner. The module uses the phone and word
lists (results from Aligner) to extract portions of the speech signal, which are then
segmented by the knowledge-based algorithm. The results from the knowledge-based
algorithm are stored in a file until the entire signal is processed. Finally the result
file is appended to the original phone file. The structure of the segmentation module
is discussed in more detail the next section.
5.1 Structure of the Segmentation Module
There are three programs that constitute the structure of the segmentation module.
As shown in Fig. 5-3 these are ExtractTime, List2Matlab, and Sort. ExtractTime,
creates a list of all of the locations of the speech file that contain the phoneme to be
segmented. The second stage, List2Matlab is a loop that copies those fragments of
the signal, invokes the knowledge-based MATLAB segmentation algorithm, and stores
the results to a file. The third and final stage, Sort, sorts the resulting output file
with the original phone file, according to the time-tagged segmentation label, so that
the results are automatically integrated with the rest of the landmarks. These three
programs are all joined by a simple script that automatically invokes each component
using the output of the previous program as part of the input.
45

Word
-- " - - [ a Loaton || Result i nlpoe Siew)Signal.words ExtractTime fist List2Matlab list Sort
Fra t OO Result
Matlab Program
knowledge-based
segmentation algorithm
Figure 5-3: Three programs that compose the structure of a segmentation module,ExtractTime, List2Matlab, and Sort.
5.1.1 ExtractTime
The ExtractTime program uses both the filename.phones and filename.words files to
create a list of times that mark the speech fragments to be segmented. ExtractTime
first reads each line of the word file, filename.words until the word in the file matches
the word designated by the user (see part 1 of Fig. 5-4 in the example of extracting the
word 'kok'). In each case of a word match, the program stores the value of the time
associated with the word. This is the time in the signal file that Aligner synchronized
to the end of the word.
Next, ExtractTime uses the stored time to find the appropriate phone in the
phone file, filename.phones. ExtractTime reads each line of the phone file, reserving
a buffer of 5 lines (excluding those associated with SIL, silence), as shown in the
right half of Fig. 5-4. When the time in the file matches the time that was stored
from part 1, the program has reached a location in the phone list that is the last
phoneme of the word designated by the user. In the particular case of segmenting
'kok,' the researcher was interested in finding the boundaries associated with the
46

Word List
1'1029.000000 122 <SIL>1029.370000 122 POP1029.730000 122 again1030.000000 122 Say1030.160000 122 <SIL>1030.580000 122 KOK1030.950000 122 again1031.280000 122 Say
= "KOK"Then go tophone listwith time
12
Buffer + 34
Phone List
1 0 1
1029.400000 122 ax1029.510000 122 g1029.600000 122 eh1029.730000 122n1029.890000 122 s1030.000000 122 ey1030.160000 122 SIL1030.280000 122 k1030.480000 122 aa1030.580000 122 k1030.610000 122 ax1030.720000 122 g1030.770000 122 eh1031.950000 122 n
= 1030.580000Then store timesfrom row I androw 4 of bufferinto file
Figure 5-4: Buffer allocation in ExtractTime
first consonant in the CVC. Therefore, ExtractTime was programmed specifically to
extract the times associated with this consonant. These times include both of the
phones adjacent to the consonant. In the example in Fig. 5-4 the times associated
with this phone string, /eka/, are in lines 1 and 4 of the buffer; line 1 is essentially the
time of the beginning of the phone /e/, and line 4 is the time of the end of the phone
/a/'. These two times are stored as a pair in an output file. Then ExtractTime
returns to the word buffer and repeats the cycle from the place where it left off. The
filename.phones and filename.words files are in chronological order, and ExtractTime
continues through the list until all of the times in the signal associated with the
particular utterance are recorded. This method is especially useful for speech signals
where an utterance is repeated multiple times within a speech signal file.
5.1.2 List2Matlab
List2Matlab is the crucial part of the module. It is responsible for applying the
1Although this is particular to this type of utterance, the step can be easily modified by choosingdifferent rows in the phone buffer to extract different utterances.
47
Buffer --
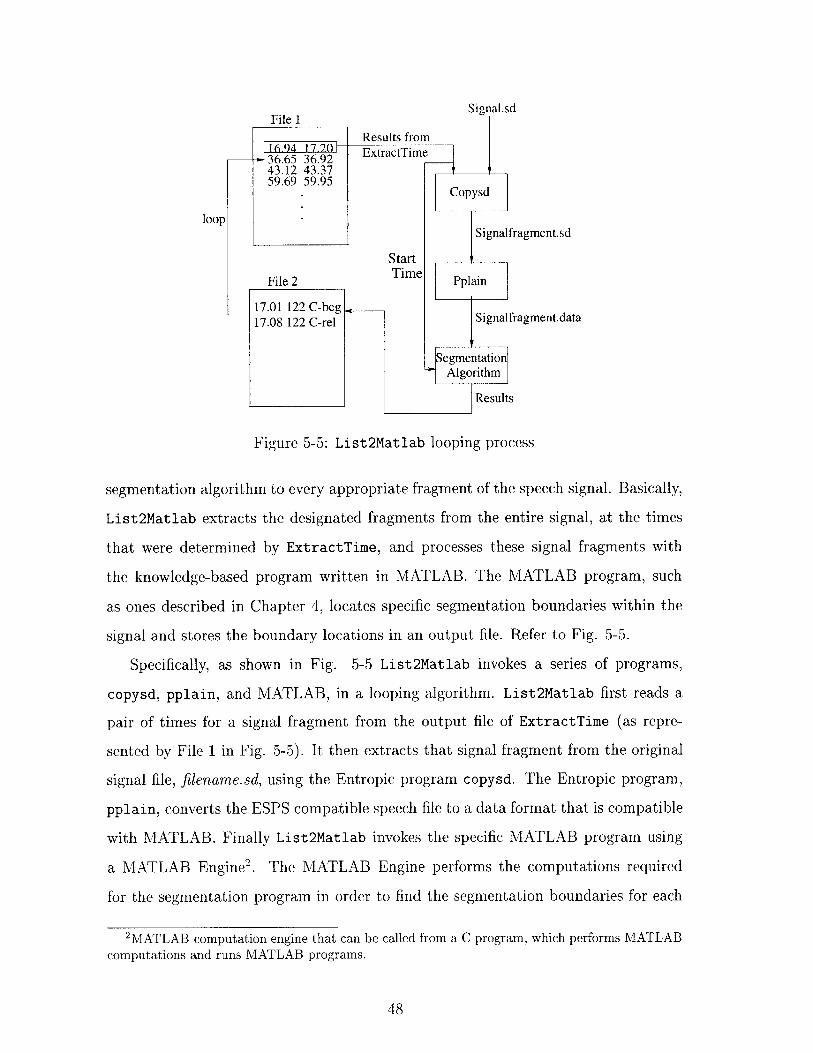
Signal.sd
Signalfragment.sd
Start
File 2 Time Pplain
17.01 122 C-beg Signalfragment.data
Segmentation*Algorithm
Results
Figure 5-5: List2Matlab looping process
segmentation algorithm to every appropriate fragment of the speech signal. Basically,
List2Matlab extracts the designated fragments from the entire signal, at the times
that were determined by ExtractTime, and processes these signal fragments with
the knowledge-based program written in MATLAB. The MATLAB program, such
as ones described in Chapter 4, locates specific segmentation boundaries within the
signal and stores the boundary locations in an output file. Refer to Fig. 5-5.
Specifically, as shown in Fig. 5-5 List2Matlab invokes a series of programs,
copysd, pplain, and MATLAB, in a looping algorithm. List2Matlab first reads a
pair of times for a signal fragment from the output file of ExtractTime (as repre-
sented by File 1 in Fig. 5-5). It then extracts that signal fragment from the original
signal file, filename.sd, using the Entropic program copysd. The Entropic program,
pplain, converts the ESPS compatible speech file to a data format that is compatible
with MATLAB. Finally List2Matlab invokes the specific MATLAB program using
a MATLAB Engine2 . The MATLAB Engine performs the computations required
for the segmentation program in order to find the segmentation boundaries for each
2MATLAB computation engine that can be called from a C program, which performs MATLABcomputations and runs MATLAB programs.
48

signal fragment. As shown in Fig. 5-5 the signal time from File 1 is also used in
the MATLAB program; the signal start time is added to the relative signal fragment
segmentation boundary times, located by the knowledge-based algorithm, in order
to relate the times to the original signal. When the MATLAB program results are
stored in the output file (File 2 in Fig. 5-5), List2Matlab returns to File 1. The
cycle repeats until all of the signals in File 1 have been segmented. The three items
in each record of the output, File 2, are boundary location (in seconds, relative to
the beginning of the signal), a numeric divider, which is always '122', and the event
label. (Figure 5-5).
5.1.3 Sort
The final step in automatic segmentation is the Sort program that merges the new
phone list into the old phone list. The result file from List2Matlab (as shown in
File 2 of Fig. 5-5) is in the same format as filename.phones, so the lists can be
automatically sorted together. The new phone list can now be used by Aligner and
viewed on Xwaves, or be processed further by simple text editing to sort phone times
for the researchers purposes.
5.2 Summary
In order to implement the knowledge-based algorithm, each segmentation module is
designed to search through a signal file for all the locations that are relevant to the
particular knowledge-based program. It then runs the knowledge-based program and
returns the results, which are time-tagged segmentation boundaries, to the phone
file. This system is developed specifically for research speech files where the speech
utterances are well defined and repetitive. In addition, though each piece is devel-
oped specifically for the experiment discussed in Chapter 6, the design of the system
provides a framework for all types of research signal files.
49

Chapter 6
Case-Study, Results and
Discussion
The entire automatic segmentation process, as discussed in Chapter 5, includes both
Aligner and knowledge-based segmentation algorithms to detect and locate specific
boundaries that are associated with acoustic manifestations of particular articulatory
events. The preliminary investigation of Aligner shows that it reliably synchronizes
the text to the speech signal, however it does not locate all of the segmentation
boundaries accurately or consistently. In fact, in the case of voiceless consonants,
Aligner does not consistently locate the boundaries associated with either the con-
sonant release or the consonant end. The knowledge-based algorithm discussed in
Chapter 4 uses knowledge about speech production and the actual signal itself to lo-
cate voiceless consonant release and consonant end boundaries. Chapter 5 presents a
framework for combining the results from Aligner with the knowledge-based algorithm
in order to automate the segmentation process. The following test case examines the
performance of this prototype segmentation system.
6.1 Test Case
This test case examines how well the prototype system locates and detects the seg-
mentation boundaries for voiceless stop consonants in a speech signal. The test is
50
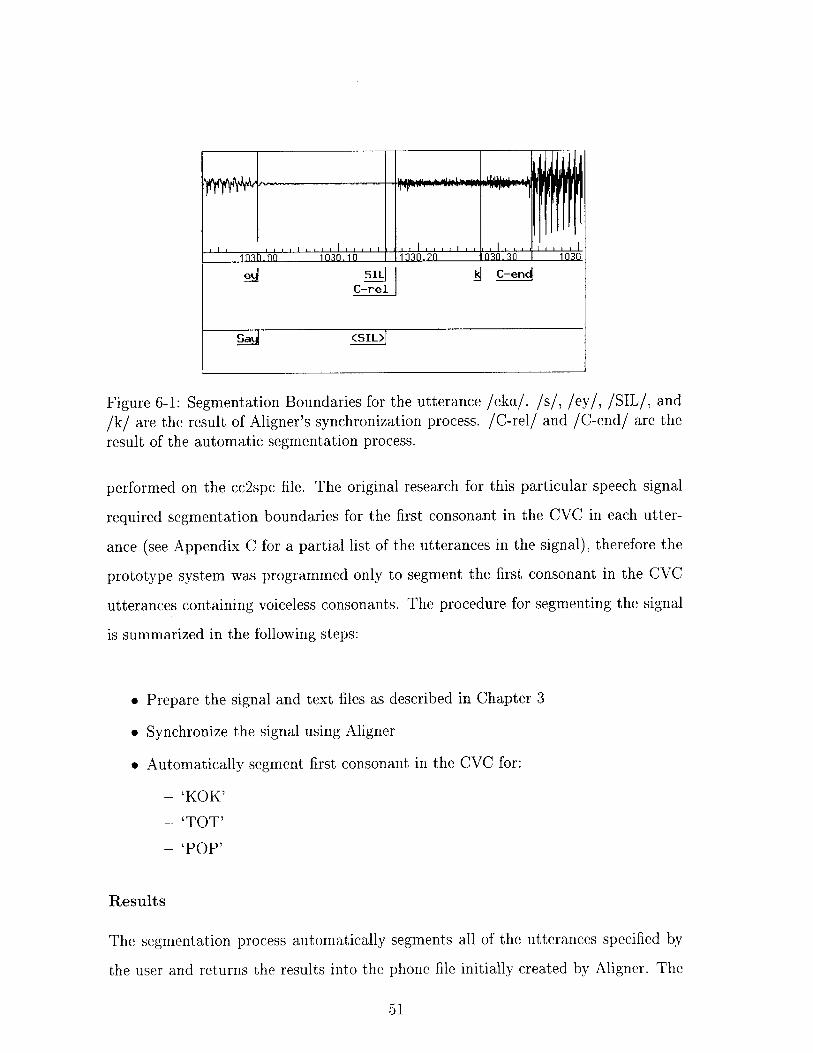
1 03h.'00 1030.1031.13 .32n1'33
e~ SII_ C-enC-rel
Sa (SIL>
Figure 6-1: Segmentation Boundaries for the utterance /eka/. /s/, /ey/, /SIL/, and/k/ are the result of Aligner's synchronization process. /C-rel/ and /C-end/ are the
result of the automatic segmentation process.
performed on the cc2spc file. The original research for this particular speech signal
required segmentation boundaries for the first consonant in the CVC in each utter-
ance (see Appendix C for a partial list of the utterances in the signal), therefore the
prototype system was programmed only to segment the first consonant in the CVC
utterances containing voiceless consonants. The procedure for segmenting the signal
is summarized in the following steps:
" Prepare the signal and text files as described in Chapter 3
* Synchronize the signal using Aligner
" Automatically segment first consonant in the CVC for:
- 'KOK'
- 'TOT'
- 'POP,
Results
The segmentation process automatically segments all of the utterances specified by
the user and returns the results into the phone file initially created by Aligner. The
51

segmentation boundaries can then be viewed with Xwaves and compared to the results
from Aligner. Figure 6-1 shows an example of the segmented speech fragment /eka/
from the utterance 'say kok again'. ExtractTime extracted the signal fragment from
the beginning of the phoneme /e/ to the end of the phoneme /a/. The figure shows
both the results of Aligner and of the segmentation process. Aligner places the label
'ey' at the location of the end of the vowel /e/, and an 'SIL' for the silent region in
the signal (part of the consonant). Aligner also incorrectly places the label 'k' for the
phoneme /k/ near 1030.28. This location reflects neither the consonant release nor
the consonant end. The automatic segmentation process marks the correct locations
of the boundaries at the consonant release and consonant end (or voicing onset). The
labels for these boundary markers are 'C-rel' for the release of the consonant, and
'C-end' for the end of the consonant.
Cc2spc is composed of five distinct speaking conditions, fast, clear, 'fast clear',
normal and slow. Of these five speaking conditions, the normal, clear, and 'fast clear'
signals contain multiple occurrences of the CVC 'kok,' 'tot,' and 'pop.' The results
of the voiceless stop consonant segmentation algorithm on the different speaking con-
ditions are displayed in tables 6.1 - 6.3.
In each of the different speaking conditions, there are thirteen occurrences of each
of the utterances 'kok' and 'pop,' and twenty-six occurrences of the utterance 'tot.'
The percentage represents the number of segmentation boundaries produced by the
automatic segmentation system that are within 10 ms of the actual boundary as
defined in Chapter 2. The accuracy of the boundary conditions is determined by
individually examining each signal fragment using Xwaves. 100% detection means
that every occurrence of that particular boundary was detected correctly.
Error Analysis
Because the knowledge-based segmentation program is based on the change of energy
of the time-varying frequency content, it is difficult to indicate exactly why the errors
occur. Most often the errors occur because of discontinuities in the spectrogram that
are not related to the specific articulatory events that correspond to boundaries. For
52
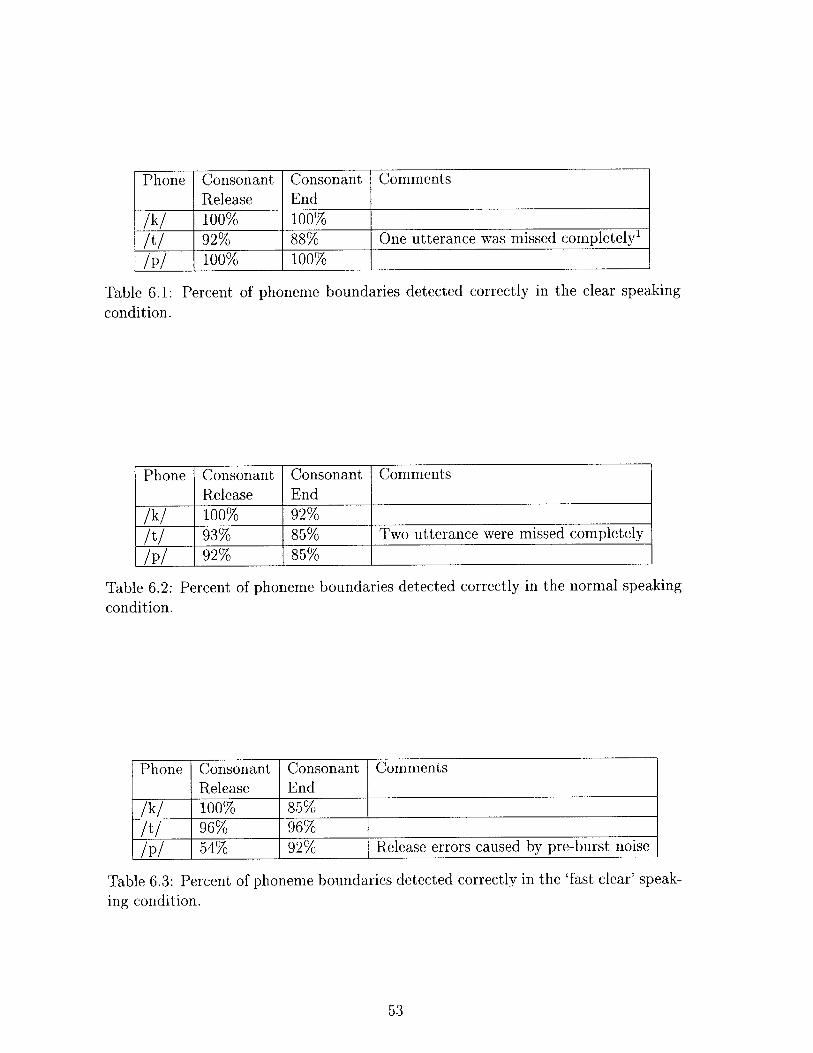
Phone Consonant Consonant Comments
Release End/k/ 100% 100%/t/ 92% 88% One utterance was missed completely1
/p/ 100% 100%
Table 6.1: Percent of phoneme boundaries detected correctly in the clear speakingcondition.
Phone Consonant Consonant Comments
Release End/k/ 100% 92%/t/ 93% 85% Two utterance were missed completely
/p/ 92% 85%
Table 6.2: Percent of phoneme boundaries detected correctly in the normal speakingcondition.
Phone Consonant Consonant CommentsRelease End
/k/ 100% 85%/t/ 96% 96%/p/ 54% 92% Release errors caused by pre-burst noise
Table 6.3: Percent of phoneme boundaries detected correctly in the 'fast clear' speak-ing condition.
53
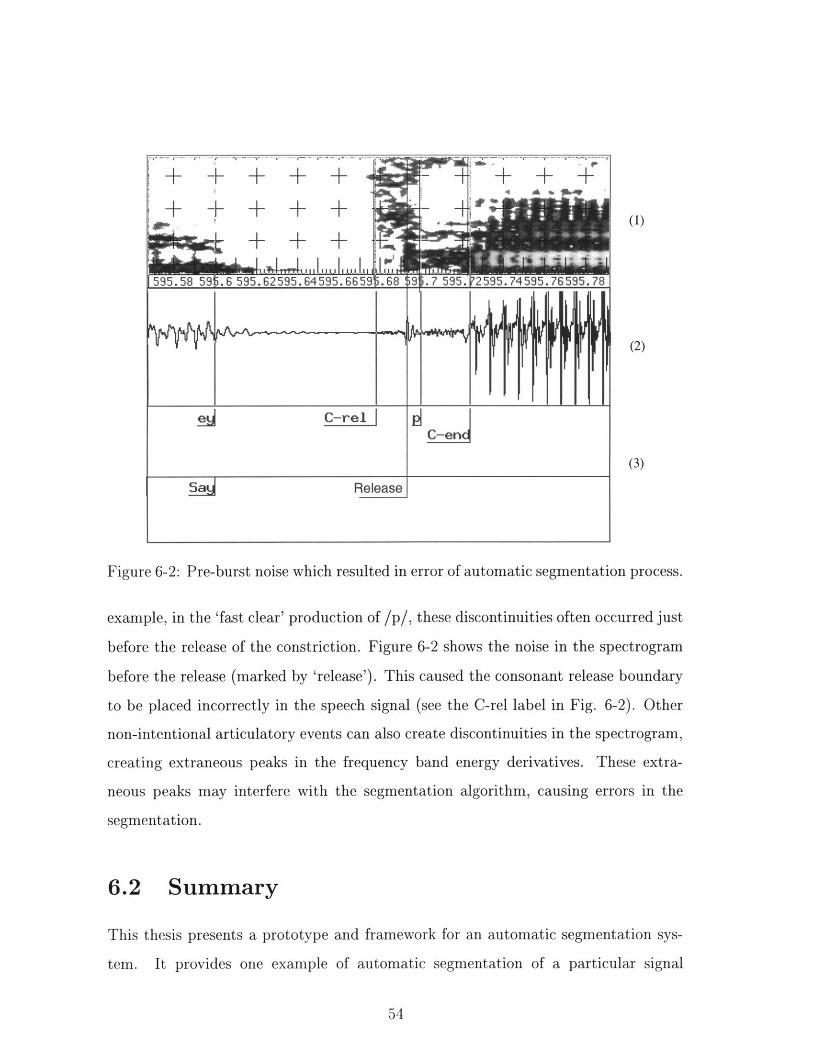
(1)
595.58 5M .6 595. 62 595. 64 595. 6659M.68 9 .7 595.V2595.74595.76595.78
(2)
ej C-rel|C-en
Sa Release
(3)
Figure 6-2: Pre-burst noise which resulted in error of automatic segmentation process.
example, in the 'fast clear' production of /p/, these discontinuities often occurred just
before the release of the constriction. Figure 6-2 shows the noise in the spectrogram
before the release (marked by 'release'). This caused the consonant release boundary
to be placed incorrectly in the speech signal (see the C-rel label in Fig. 6-2). Other
non-intentional articulatory events can also create discontinuities in the spectrogram,
creating extraneous peaks in the frequency band energy derivatives. These extra-
neous peaks may interfere with the segmentation algorithm, causing errors in the
segmentation.
6.2 Summary
This thesis presents a prototype and framework for an automatic segmentation sys-
tem. It provides one example of automatic segmentation of a particular signal
54

(cc2spc), however the process can be generalized to encompass many different types
of speech signals used in speech production research, particularly signals composed of
multiple repetitions of the same utterances. The segmentation portion of the system
has been developed in such a way to allow for modifications and extensions. For ex-
ample, the knowledge-based algorithm calculates the rate of rise for energy in several
different energy bands. The values of the frequency bands can be changed easily to
reflect information about the particular speaker in each study. The extraction al-
gorithm, which extracts the appropriate speech fragment for segmentation, can also
be altered to reflect the particular type of utterance and to extract the pertinent
information.
These preliminary results indicate that the method of combining statistical and
knowledge-based algorithms is relatively successful for building an automatic phone-
mic segmentation system. Although further optimization in the segmentation process
is required, this thesis shows that a fairly robust automatic segmentation can be de-
signed specifically for speech signals used in speech production research, where the
utterances are prescribed and repetitive. The segmentation process, incorporating
commercial speech alignment software and custom knowledge-based algorithms, de-
pends largely on a-priori knowledge of the utterances as well as knowledge about
speech production.
6.3 Future Work
This statistical and knowledge-based automatic segmentation system represents a
first step. Several parts of the system require further development and completion.
These are itemized below:
e Optimization of knowledge-based segmentation algorithms
e Development of a complete set of 'modules' for segmentation
e Provision of an interactive procedure to identify and correct mistakes
e Incorporation of the results into the database that is native to the research
55
Currently, the knowledge-based segmentation algorithm needs to be optimized
manually for each specific speech file, depending on individual speaker characteris-
tics, such as whether the speaker is female or male. Because the algorithm is sensitive
to energy in specific frequency bands, the result of the algorithm for different speakers
may vary. A more robust knowledge-based segmentation algorithm that accounts for
variance among speaker characteristics would be most ideal. This may not necessar-
ily be possible, however, as knowledge-based algorithms usually depend on spectral
information of the speech signal, some of which may be speaker dependent. A more
realistic solution may be to develop a method or program to quickly fine-tune the
knowledge-based segmentation algorithm to be optimized for each particular speaker.
In addition, more knowledge about the speech signal may be incorporated to create
a more effective and efficient segmentation algorithm.
In addition to making the knowledge-based algorithm more robust, different types
of phoneme segmentation modules should be incorporated into the entire system. This
thesis provides an example module for voiceless stop consonants. Other segmenta-
tion boundaries that are associated with abrupt landmarks, such as the beginning,
release and end of voiced stop consonants, and the beginning and end of vowels can
be detected using algorithms similar to the one discussed in Chapter 4, using peaks
of the derivative of energy content in various frequency bands. Other segmentation
boundaries that do not correspond to abrupt acoustic changes, such as those asso-
ciated with glides may require a different algorithm, such as the one proposed by
Walter Sun[8]. A complete set of modules, which segments all types of phonemes,
would allow the user to choose which modules are necessary to completely segment
the signal.
Because automated processes are generally not infallible, it is important to devise
a method to interactively identify and correct mistakes made by the automatic seg-
mentation process. One possible method of simplifying this task is to create a user
interface that can scan through the signal and locate all of the new segmentation
boundaries. The process can allow the user to quickly view these signal fragments for
accuracy and allow the user to delete the signal fragments containing segmentation
56
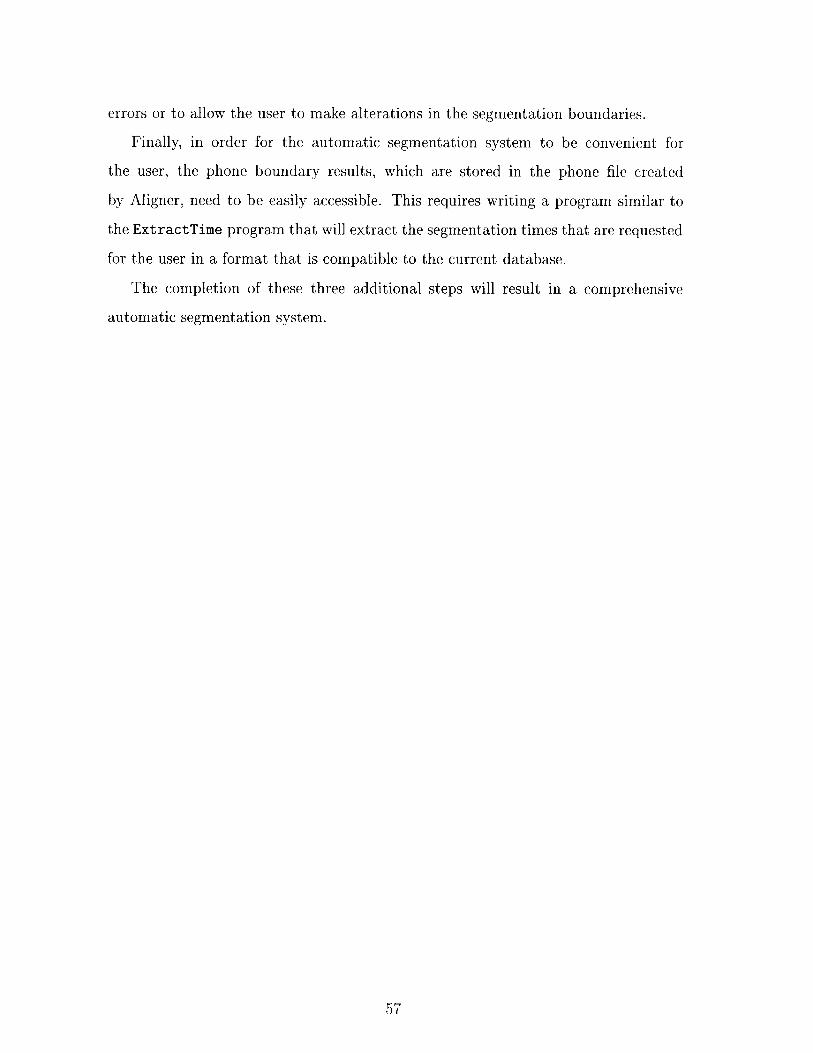
errors or to allow the user to make alterations in the segmentation boundaries.
Finally, in order for the automatic segmentation system to be convenient for
the user, the phone boundary results, which are stored in the phone file created
by Aligner, need to be easily accessible. This requires writing a program similar to
the ExtractTime program that will extract the segmentation times that are requested
for the user in a format that is compatible to the current database.
The completion of these three additional steps will result in a comprehensive
automatic segmentation system.
57

Appendix A
Hidden Markov Model Tutorial
The underlying assumption in hidden Markov modeling is that a continuous speech
signal is a representation of a series of discrete symbols such as words or sounds.
The processing therefore first devides the speech signal to a sequence of uniform-
length, equally-spaced observations. An example of this process is shown in step I of
figure A-1. Each observation is assumed to be a stationary signal, meaning that the
frequency characteristics of the signal do not vary significantly through the duration
of the observation. [9]
The purpose of the hidden Markov model speech recognizer is to relate a sequence
of observations, Oj, to a discrete entity or symbol, Si. See step 2 of figure A-i
Statistically, this problem relates to finding the highest probability that a word, W,
was spoken given the observed sequence 0 where O = [01, 02,03, ... ]:
argmaxi{P(WIO)} (A.1)
Calculating this probability directly is impossible, however, when restated by
Bayes' Rule (A.2), the separate probabilities can be calculated independently.
P(WZIO) = 01W)P(i (A.2)P(O)
P(W), the probability the word Wi was spoken, and P(O), the probability that
the sequence 0 is observed, are determined statistically from the data. P(OlWj),
58

Speech Utterance
STEP I
Observation Sequence 01 02 03 04 05 06 07 08
STEP 2
Symbol Sequence S S2
Figure A-1: Hidden Markov modeling of speech signal: Observation list Oi of thesignal corresponds one-to-one to speech signal fragments. Symbols Si are derivedfrom HMM process. Step 1 is the process of obtaining an observation sequence, Step2 is the hidden Markov modeling process.
the probability of Wi given 0 is calculated using the Markov models created in the
training stage. During the training phase of the recognition system, a Markov model
is created for each word using the training speech data. This state-space model
represents probabilities of all the possibilities of the symbol sequence S that can occur
in the production of the word. Figure A-2 shows a possible state-space representation
of the speech fragment shown in figure A-1. [9]
These state sequences are similar to observation sequences where each state cor-
responds to an observable signal or speech sound.In the speech signal, however the
state sequence is hidden, and only the observation sequence is known. As shown in
figure A-2, the observation sequence is related to the hidden state sequence through
a stochastic process calculated and modeled from the training data. This entire mod-
eling process to calculate P(O|W) is the hidden Markov model. Rabiner goes into
great detail about this process in 'A Tutorial on Hidden Markov Models and Selected
Applications in Speech Recognition' [5].
59
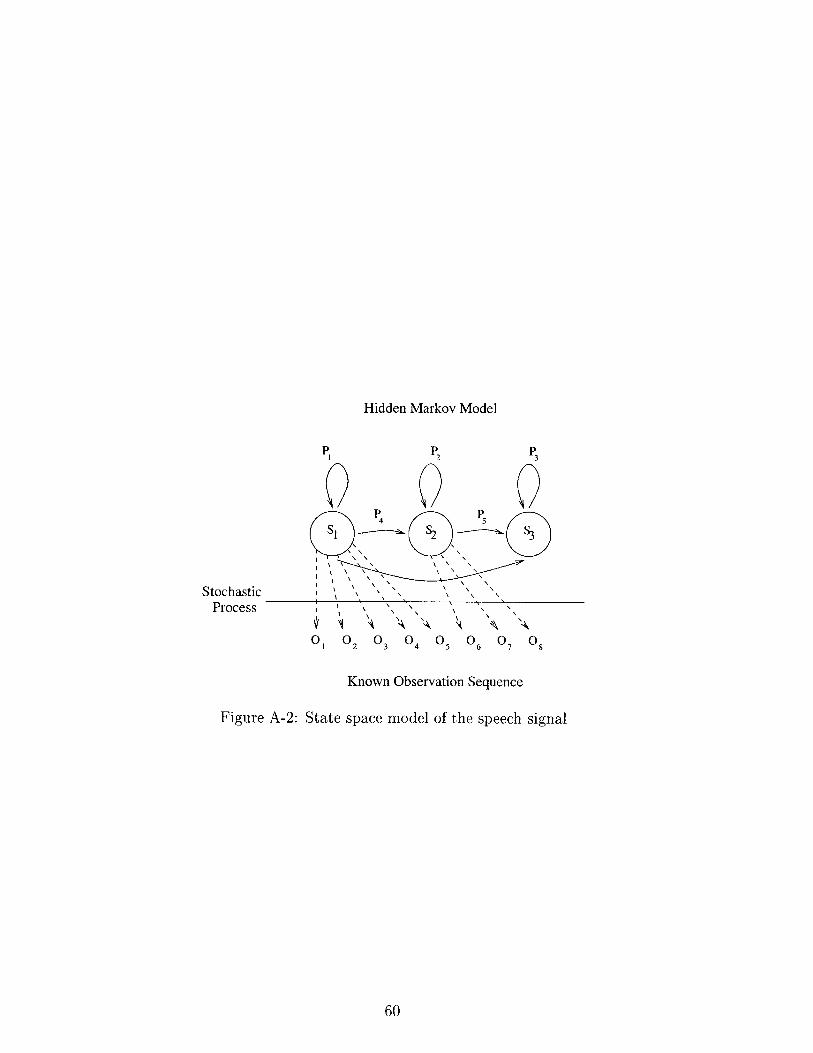
Hidden Markov Model
P
Stochastic ,Process
0 02 0 00 001 02 03 04 05 06 07 08
Known Observation Sequence
Figure A-2: State space model of the speech signal
60
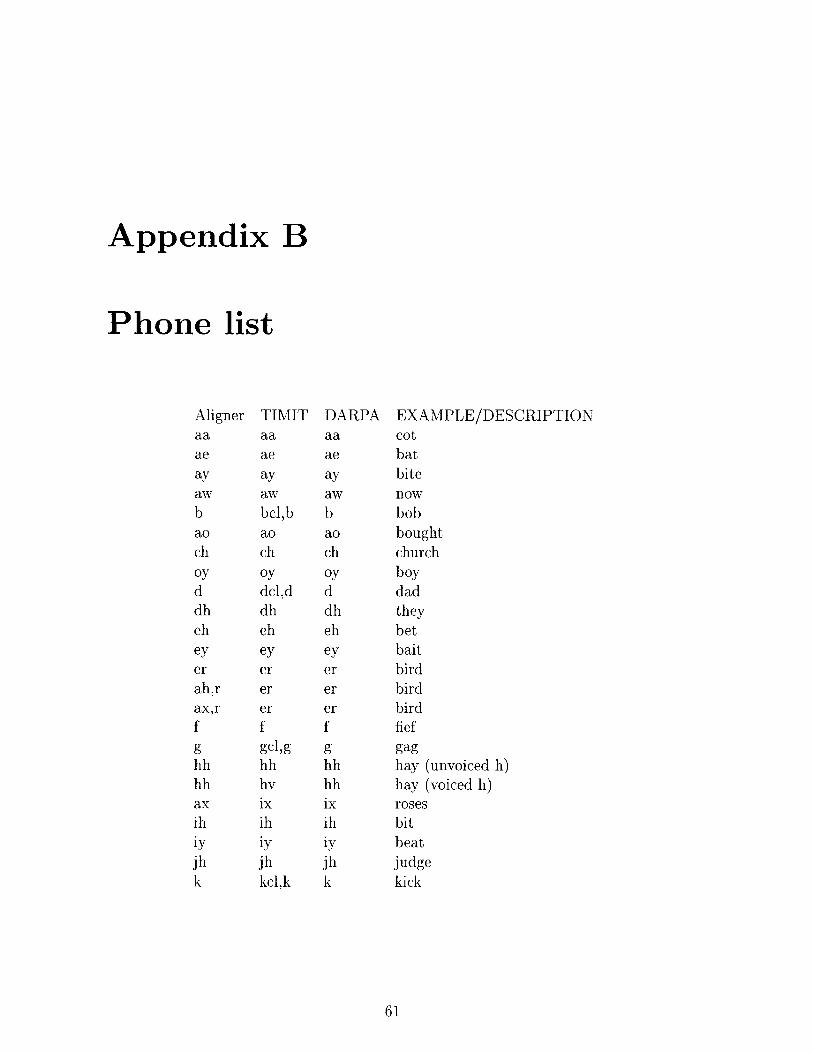
Appendix B
Phone list
Aligner TIMIT DARPA EXAMPLE/DESCRIPTIONaa aa aa cotae ae ae batay ay ay biteaw aw aw nowb bcl,b b bobao ao ao boughtch ch ch churchoy oy oy boyd dcl,d d daddh dh dh theyeh eh eh betey ey ey baiter er er birdah,r er er birdax,r er er birdf f f fiefg gcl,g g gaghh hh hh hay (unvoiced h)hh hv hh hay (voiced h)ax ix ix rosesih ih ih bitiy iy iy beatjh jh jh judgek kcl,k k kick
61
Aligner TIMIT DARPA EXAMPLE/DESCRIPTION1 I I led
el el el bottle (syllabic 1)ah,l el el bottle (syllabic 1)ax,l el el bottle (syllabic 1)m m m momeh,m em m 'em (syllabic m)n n n nun
n,t nx nx center (nasal flap)ng ng ng singng eng ng singen en en button (syllabic n)ax,n en en button (syllabic n)ah,n en en button (syllabic n)ow ow ow boatp pcl,p p popr r r redaxr axr axr dinnerax,r axr axr dinnerah,r axr axr dinners s s sistersh sh sh shoedx dx dx butter (alveolar flap)t dx dx butter (alveolar flap)t tcl,t t totth th th thiefuh uh uh bookah ah ah buttax ax ax the (schwa)ax ax-h ax the (unvoiced schwa)uw uw uw bootuw ux uw beautyv v v vervew w w wety j y yet
y y y yetz z z zoozh zh zh measureSIL sil sil silenceSIL h# sil silenceSIL pau sil silence
62

Appendix C
Utterance List for CC2SPC
Page one
Say dod AGAIN.Say GUG again.Say DAD again.Say GOG again.Say DOD again.Say tot AGAIN.Say gog AGAIN.It's a GOG again.Say BUB again.Say KOK again.
Page two
Say TOT again.Say DUD again.Say SOS again.Say dud AGAIN.Say FOF again.Say bob AGAIN.Say GAG again.Say GEG again.Say SHOSH again.Say BOB again.
63

Page three
SaySaySaySaySaySaySaySaySaySay
bub AGAIN.POP again.gug AGAIN.TOT again.FOF again.BUB again.GUG again.DAD again.dud AGAIN.bob AGAIN.
Page four
Say GOG again.Say BOB again.Say DOD again.Say GEG again.Say gug AGAIN.Say dod AGAIN.Say GAG again.Say DUD again.Say gog AGAIN.It's a GOG again.
Page five
SaySay
SaySaySaySaySaySaySaySay
bub AGAIN.POP again.KOK again.SOS again.SHOSH again.tot AGAIN.GOG again.GUG again.dud AGAIN.KOK again.
64
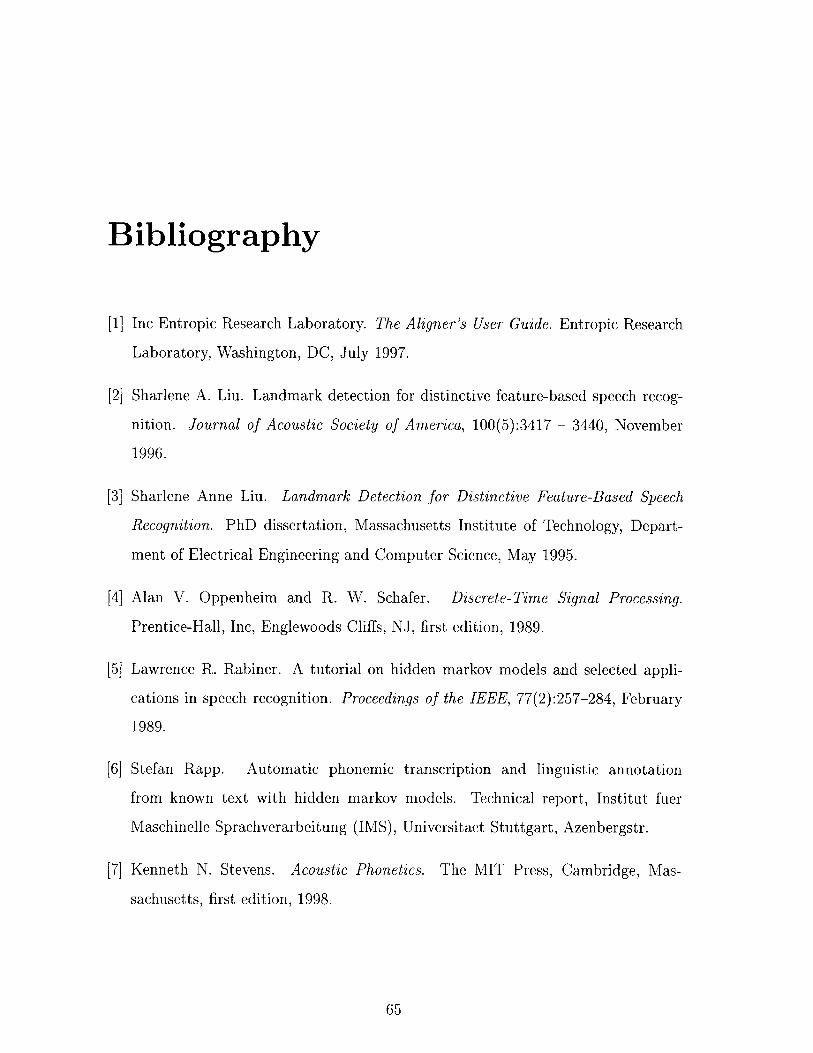
Bibliography
[1] Inc Entropic Research Laboratory. The Aligner's User Guide. Entropic Research
Laboratory, Washington, DC, July 1997.
[2] Sharlene A. Liu. Landmark detection for distinctive feature-based speech recog-
nition. Journal of Acoustic Society of America, 100(5):3417 - 3440, November
1996.
[3] Sharlene Anne Liu. Landmark Detection for Distinctive Feature-Based Speech
Recognition. PhD dissertation, Massachusetts Institute of Technology, Depart-
ment of Electrical Engineering and Computer Science, May 1995.
[4] Alan V. Oppenheim and R. W. Schafer. Discrete-Time Signal Processing.
Prentice-Hall, Inc, Englewoods Cliffs, NJ, first edition, 1989.
[5] Lawrence R. Rabiner. A tutorial on hidden markov models and selected appli-
cations in speech recognition. Proceedings of the IEEE, 77(2):257-284, February
1989.
[6] Stefan Rapp. Automatic phonemic transcription and linguistic annotation
from known text with hidden markov models. Technical report, Institut fuer
Maschinelle Sprachverarbeitung (IMS), Universitaet Stuttgart, Azenbergstr.
[7] Kenneth N. Stevens. Acoustic Phonetics. The MIT Press, Cambridge, Mas-
sachusetts, first edition, 1998.
65

[8] Walter Sun. Analysis and interpretation of glide characteristics in pursuit of an
algorithm for recognition. Master's project, Massachusetts Institute of Technology,
Department of Electrical Engineering and Computer Science, November 1996.
[9] Steve Young, J. Janson, J. Odell, D. Ollason, and P. Woodland. The htk book.
Entropic Research Laboratory, November 1995.
66