integrating investment and foreign exchange...
TRANSCRIPT

Integrating Investment and Foreign Exchange Returns in a Classroom Portfolio Simulation
Gregory K. Faulk Belmont University
College of Business Administration 1900 Belmont Boulevard
Nashville, TN 37212
Joseph C. Smolira*
Belmont University College of Business Administration
1900 Belmont Boulevard Nashville, TN 37212
[email protected] 615.460.6463
Sean Sehyun Yoo
Belmont University College of Business Administration
1900 Belmont Boulevard Nashville, TN 37212
10/19/09 *Contact author

Integrating Investment and Foreign Exchange Returns in a Classroom Portfolio Simulation
Abstract This paper describes a class project used in the international finance class at the authors’ university. The project combines investment and exchange rate movements to provide a realistic model of international investment. The simulation project introduces students to purchasing power parity, the international Fisher effect, interest rate parity, the expectations theory of forward rates, and the return components of international investing. The simulation provides students the opportunity to see these theories in action over time using current data and reinforces the applicability of these concepts in the “real” world.

1
INTRODUCTION Simulations can provide a connection between classroom and professional environments
and offer a more dynamic learning experience (Seaton and Boyd, 2008). This occurs because
simulations involve the student directly with the components of the simulation rather than just
theorizing about the material or solving static problems (Doyle and Brown, 2000). Students feel
that simulations are an effective means of learning material. Research indicates that they can
learn decision making, strategy development, and group dynamics from a properly constructed
and implemented simulation (Betts and Knaus, 2006). Simulations in the form of classroom
gaming exercises have also been shown to enhance student learning (Cebula and Toma, 2002).
Business education accrediting agencies have adopted standards that encourage
simulation. One of the assessment goals of the Association to Advance Collegiate Schools of
Business International (AACSB International) is to more closely align what students are learning
in the classroom with the skills they need in business. Simulations can be an effective
pedagogical tool to achieve this charge since they encourage students to develop a strategic focus
in that they often consist of multiple period analyses where students are forced to examine the
results of decisions they made.
In finance, simulations are most commonly used in investments. There are three
commercially available, web based, widely used investment portfolio simulations: Stock Trak,
OTIS, and Stocknavigator. The existence of an active market in portfolio simulations indicates
the widespread usage of these simulations. These portfolio simulations offer the professor and
student a well-developed simulated trading platform. With the exception of book publisher
simulations, other areas of finance offer fewer commercially available simulations. Thus,

2
professors who wish to use simulations are often forced to develop their own. This may explain
why only about 23 percent of finance faculty use simulations in the classroom (Faria and
Wellington, 2004).
Although the commercially available investment portfolio simulations allow students to
trade a variety of financial instruments, they are not conducive to teaching international
investing. For example, Stock Trak allows students to trade stocks, bonds, mutual funds, futures,
options, futures options, and a limited number of spot currencies and commodities. Additionally,
students can trade stocks on approximately 20 international stock markets. However, a drawback
to Stock Trak and other commercially available portfolio simulators is that in international
investing they only show the total return. An important part of international investing is that
home currency returns are derived from not only the domestic return of the underlying
investment, but the gain or loss on the currency when converting to dollars.
For the most part, existing simulations and classroom exercises for international topics
are designed to teach students basic international concepts. For example, Sandler (2008) provides
a project that requires students to use regression analysis to forecast foreign exchange rates. This
project allows the student to compare their forecast to a market based forecast calculated using
spot and forward rates. Classroom exercises use Excel to develop interest rate parity (Arnold and
Buchanan, 2004) and teach students how to take advantage of triangular or covered interest rate
arbitrage (Marshall, 2004). Holowczak (2007) presents exercises using real time data to examine
triangular arbitrage, covered interest arbitrage, and forward rate quote spread models.
Neither commercially available portfolio simulators nor published research provides a
model that combines an investment simulation with exchange rate quotes to create an integrated
international investment simulation that reflects both investment and foreign exchange risk and

3
returns. This paper seeks to fill that void. The remainder of the paper is organized as follows.
The next section details the portfolio simulation. Section III describes the pedagogical
importance and the last section concludes the paper.
Details of the International Portfolio Simulation
Understanding international financial markets and currencies is critical for today’s
finance graduates. Practically all U.S. based Fortune 500 corporations have about half of their
assets and income in foreign countries (Shapiro, p. 10). The recent downturn of financial markets
worldwide instigated by sub-prime mortgages and the resultant banking carnage in the United
States underscores the inter-relationship of domestic and foreign economies and financial
markets. The soon-to-be-graduate needs a thorough grounding in the theories undergirding
international finance and exposure to their application. The simulation is designed to do this in
an international investment portfolio setting.
A U.S. based investor seeking dollar returns by investing in domestic and foreign stock
markets is confronted with three challenges: determining whether the domestic or foreign
markets will rise or fall, when converting foreign holdings to dollars determining whether
foreign exchange (FX) gains or losses will augment or offset any market gains or losses, and
determining what portfolio weights to assign to each market. Crucial to understanding
movements in a country’s economy, markets and currency are the four fundamental economic
theories of foreign exchange: purchasing power parity, interest rate parity, the international
Fisher effect and the expectations theory of forward rates. These theories are best understood by
observing financial currency and market movements. The portfolio simulation is designed to
give students “hands on” experience with the challenges of investing in foreign markets and
currencies.

4
The simulation is designed to track the movement of major stock indexes and foreign
exchange rates relative to the United States dollar in seven countries: Mexico (MXX, MXN),
Brazil (Bovespa, BRL), Australia (AORD, AUD), Japan (N225, JPY), China (SSEC, CNY),
Germany (DAX, EUR) and the United Kingdom (FTSE100, GBP). In addition, domestic
investments are allowed (Dow, USD). These indexes were chosen based upon three factors: the
portfolio’s geographic scope, the mix of advanced and emerging markets, and currencies. A
correlation analysis filtered out many potential indexes. For example, the S&P 500, NASDAQ
100, Toronto market index were excluded because their high correlations with Dow. Likewise,
the CAC40 of France was excluded. China, Mexico and Brazil were selected to account for
emerging markets. Although other indexes such as Hong Kong and/or India could be added, it
was felt that this would unnecessarily increase the weight of Asia and emerging markets. The
resulting indexes represent a broad geographic cross section and include countries with floating
and fixed (within a narrow band) exchange rates.
Students are grouped into two member teams. Each team is given USD 10,000,000 at the
inception of the simulation, which lasts for 12 weeks. Teams can convert their dollars and invest
in the various indexes by taking a long or short positions. Teams also can invest in the Dow
Jones Index. Any monies not invested in foreign indexes or the Dow are automatically invested
in 10-year U.S. Treasury Notes. All teams use the same pricing and FX information (source:
http://finance.yahoo.com) which is posted once a week on the class website. Teams are only
allowed to make one portfolio adjustment per week. To facilitate the mechanics of the
simulation, teams are given pre-formatted spreadsheets which they use to input the values of the
various indexes, FX values and their portfolio rebalancing choices. The spreadsheets
automatically convert all foreign currency transactions to USD values.
5
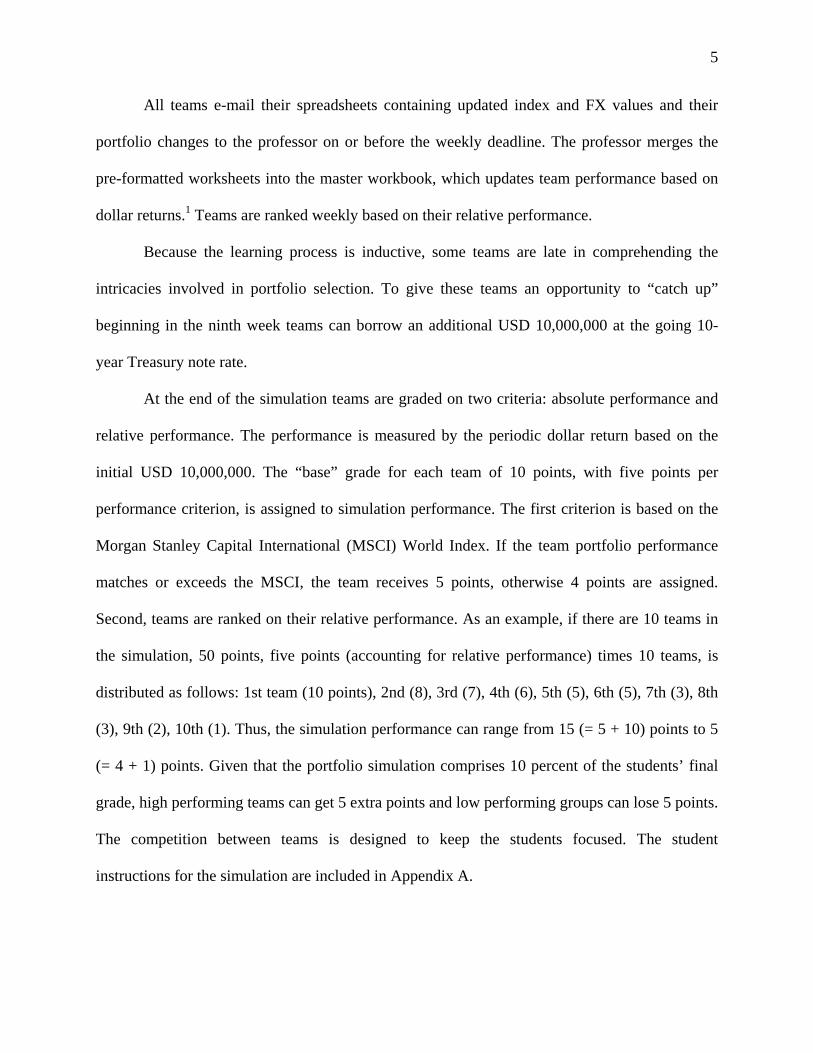
All teams e-mail their spreadsheets containing updated index and FX values and their
portfolio changes to the professor on or before the weekly deadline. The professor merges the
pre-formatted worksheets into the master workbook, which updates team performance based on
dollar returns.1 Teams are ranked weekly based on their relative performance.
Because the learning process is inductive, some teams are late in comprehending the
intricacies involved in portfolio selection. To give these teams an opportunity to “catch up”
beginning in the ninth week teams can borrow an additional USD 10,000,000 at the going 10-
year Treasury note rate.
At the end of the simulation teams are graded on two criteria: absolute performance and
relative performance. The performance is measured by the periodic dollar return based on the
initial USD 10,000,000. The “base” grade for each team of 10 points, with five points per
performance criterion, is assigned to simulation performance. The first criterion is based on the
Morgan Stanley Capital International (MSCI) World Index. If the team portfolio performance
matches or exceeds the MSCI, the team receives 5 points, otherwise 4 points are assigned.
Second, teams are ranked on their relative performance. As an example, if there are 10 teams in
the simulation, 50 points, five points (accounting for relative performance) times 10 teams, is
distributed as follows: 1st team (10 points), 2nd (8), 3rd (7), 4th (6), 5th (5), 6th (5), 7th (3), 8th
(3), 9th (2), 10th (1). Thus, the simulation performance can range from 15 (= 5 + 10) points to 5
(= 4 + 1) points. Given that the portfolio simulation comprises 10 percent of the students’ final
grade, high performing teams can get 5 extra points and low performing groups can lose 5 points.
The competition between teams is designed to keep the students focused. The student
instructions for the simulation are included in Appendix A.

6
Figures 1 and 2 show an entire worksheet for a 12-week simulation period for the
winning team in the Spring 2009 semester. The worksheet consists of five sections. The first
section on the top of the worksheet to row 6 shows a summary view on performance. It includes
the bank balance in row 3, the U.S. dollar portfolio balance in row 4 and its periodic return in
row 5, and the net periodic return of the MSCI world index in row 6. Row 2 indicates whether
students violate the funding size of U.S. 10 million dollars and additional borrowing of the same
amount. The second section, from rows 7 to 23, provides price information: closing prices of
stock market indexes, 10-year Treasury note yield, exchange rates and the benchmarking MSCI
index. The next two sections show buying and selling decisions and their market values in local
currency and U.S. dollar terms, respectively. The last section, from rows 72 to 95, tracks the
portfolio balances in terms of the number of holdings, market values in local currency and U.S.
dollar terms. For example, cells C24 and C28 show this group decided to buy 30 shares of the
Dow and 275 shares of the DAX. Cell D54 shows that the group decided to sell back 50 shares
of the DAX. The market values are calculated below in both currencies. These trading activities
are reflected on the portfolio balance section of the worksheet both in the share volume and
money value terms.
<<INSERT FIGURES 1 AND 2 ABOUT HERE>>
The professor monitors group performance on a weekly basis. Figure 3 shows the
performance log, which contains the periodic return of each portfolio and the MSCI world index.
The former is used to rank portfolios while the latter is used to measure the absolute performance
of each portfolio. To stimulate competition, the professor posts the weekly ranking and periodic
returns on the class website.
<<INSERT FIGURE 3 ABOUT HERE>>

7
There are two items of note in Figure 3. Team 1 and Team 3 both show a penalty of
minus one percent. Even if a team does not want to buy or sell any index, it is required to submit
this information to the professor. A team is permitted one week in which they do not submit the
required trading information. Each time a team exceeds this limit it is penalized one percentage
point on its final portfolio return.
In the next to last week, Team 3 and Team 9 both show an extraordinarily high balance.
These teams were near the bottom of the performance rankings and both decided to take large
short positions in the billions. Under the rules, this was permitted. In fact, for both teams this
strategy is optimal since they had little to lose even if the position was a loss. This simulation
had been used for six semesters prior to this and no team had ever attempted this strategy. In
future iterations, a short sale limit will be implemented that will limit the amount a team can
short to the total money available, USD 20 million, or some fraction of the total funds such as 90
percent.
Pedagogical Importance
The simulation begins approximately three weeks into the semester. The topics of the
determination of exchange rates, international portfolio investment and the international
monetary system have been covered. Students have been introduced to the concepts of
purchasing power parity, the international Fisher effect, interest rate parity, and the expectations
theory of forward rates as well as the value of international diversification. The simulation
provides students the opportunity to see these theories in action over time using current data.
This reinforces the applicability of these concepts in the “real” world.
The first choice that students have to make is which countries to invest in. The students
already understand the diversification role that indexes play within a country’s stock market. The

8
purpose of the simulation is to explore diversification across countries. When extending
diversification across national boundaries, the question arises: does the nationality of the host
index matter? In other words, should returns of the FTSE 100 (UK) be different from returns of
the Nikkei 225 (Japan) or the Dow (US) when measured in dollars? Since returns are based on
price changes, this leads to discussion of three fundamental issues: how are prices set in various
countries, how is the exchange rate set between two countries, and are arbitrage opportunities
available? This engenders discussions on absolute and relative purchasing power parity and the
role of arbitrage in FX equilibrium.
To encourage students to conduct a more rigorous examination of the country choice,
each team is required to submit a country analysis report. The country analysis report includes an
examination of macroeconomic indicators and their effects on stock market performance. Before
the simulation game began, a special session was held on the country economic analysis. The
deadline for this report is set at the end of the sixth week of the simulation. The assignment is
included in Appendix B.
An investment-related issue that is discussed but not fully explored through the
simulation is the use of derivatives in international investing. As stated above, the investment
choices are designed to address the concepts of international diversification, purchasing power
parity and arbitrage. Discussion of sophisticated international investment strategies is beyond the
scope of the course.
As the simulation marches across time, students observe movement in spot FX rates. This
gives students the opportunity to observe the effect on FX rates over time of changes in interest
rates (interest rate parity) which in turn are composed of changes in expected real interest and
inflation rates (Fisher theory). This leads to the topic of estimating forward rates (expectations

9
theory of forward rates). This concept is further explored when the simulation is in its fourth
week and the futures market is more closely examined.
In addition to covering the major concepts in FX, the simulation provides fodder for
discussion of other international finance topics. The constant change of FX rates lends itself to
discussion of the calculation of currency appreciation and depreciation. The repeated observation
of exchange rates over 12 weeks gives students an appreciation for the magnitude of different
currencies relative to the dollar. Students gain an appreciation for direct and indirect quotes. The
fixed Yuan exchange rate compared to the floating rate nature of the other currencies allows
students to observe the different effects of fixed and floating rate currencies on dollar
denominated returns.2
In summary, the simulation gives students the opportunity to understand the roles of
purchasing power parity, the international Fisher effect, interest rate parity and the expectations
theory of forward rates in modeling the complex relationships between domestic and foreign
prices, nominal, real and inflation rates, and foreign exchange rates over time. These concepts
usually are not intuitively obvious to students taking their first international finance course. The
international portfolio simulation is designed to pique students’ interest in and develop their
knowledge of these topics. It reinforces the link between classroom instruction and “real world”
decisions in an international setting.
The simulation can be used as a foundation for a broader macroeconomic discussion of
the effect of a country’s competitiveness and role of fiscal and monetary policy on prices,
interest rates, inflation and FX. The theories of purchasing power parity, the international Fisher
effect, interest rate parity and the expectations theory of forward rates show the relations
between expected inflation, real interest rates, nominal interest rates, prices and spot and forward

10
exchange rates, but do not discuss the cause(s) of change. International macroeconomics delves
into this issue. The domestic value of a country’s stock market (as measured by a market index)
depends in part on the domestic and international desire for the goods and services provided by
the underlying companies as well as domestic inflation. The value of a country’s currency
relative to the United States dollar depends in large measure on two things: the desirability of
that country’s goods and services by the rest of the world and the fiscal and monetary policies of
the host government relative to that of the United States. Furthermore, the appreciation
(depreciation) of a currency makes its goods and services more (less) expensive and less (more)
desirable on the world market, reducing (increasing) exports and possibly reducing (increasing)
stock prices and the underlying market index. The portfolio simulation is designed to help
students understand the basic theories of international finance and is a starting point for students’
understanding of the macroeconomic complexities of international finance.
CONCLUSION
Simulations can provide a connection between the classroom environment and the real
world. In this paper, we present an international investing simulation that allows the student to
examine the components of international returns, the underlying asset return and the currency
return. In contrast to commercially available investment simulations, this simulation shows the
students the effect of each of these return components. Additionally, students see how spot
exchange rates move over the period of the simulation.
More broadly, this simulation project introduces students to the basic economic theories
of international finance: purchasing power parity, the international Fisher effect, interest rate
parity and the expectations theory of forward rates. The simulation also exposes students to
macroeconomic differences between countries. Each team submits a country analysis report

11
which details the various macroeconomic factors in the country and provides a basis for the
investment decision in that country’s index. By observing changes in the value of investments in
various countries in conjunction with FX changes over time, students’ knowledge of the
fundamental theories of international finance are both broadened and deepened.

12
ENDNOTES 1 Although done on Excel spreadsheets, this simulation may be performed using a web based system or software package. However to the authors’ knowledge none are available that perform the tasks specific to this simulation. Furthermore, once the initial workbooks and spreadsheets are set up, the mechanics of running the simulation aren’t onerous. Data can be copied and pasted from the Yahoo web site to the class web site and from the class web site to the students’ spreadsheets. The only other input required of students is entering the number of shares of their buy/sell investment choices. The students’ spreadsheets are e-mailed to the professor who copies them into the master workbook, which performs the calculations and updates the rankings. 2 On July 21, 2005, Chinese authorities announced that the Yuan exchange rate would be determined by a managed float. The People’s Bank of China would manage a conceptual basket of currencies including not only the dollar but also other major currencies such as the euro and the yen. Without knowing how the basket is managed, outsiders could only observe that the Yuan exchange rate is ‘sticky,’ or practically ‘fixed.’

13
Bibliography
Arnold, Tom and Bonnie Buchanan. 2004. Interest Rate Parity in Excel. Journal of Financial
Education. Vol. 30, Fall 2004. 28-41. “Eligibility Procedures and Standards for Business Accreditation.” The Association to Advance
Collegiate Schools of Business. 25 March 2008. <http://www.aacsb.edu/accreditation/process/documents/AACSB_STANDARDS_Revised_Jan08.pdf >
Betts, Stephen, and Roy Knaus. 2006. Student Perceptions of the Teaching Effectiveness of
Management Simulation in a Business Policy and Strategy Course. Allied Academies International Conference. Academy of Educational Leadership. Proceedings. Vol. 11, Iss. 1. 3-6.
Cebula, Richard and Michael Toma. 2002. The Effect of Classroom Games on Student Learning
and Professor Evaluations. Journal of Economics and Finance Education, Vol. 1, No. 2, 1-10.
Doyle, Declan and F. William Brown. 2000. Using a Business Simulation To Teach Applied
Skills-The Benefits and the Challenges of Using Student Teams from Multiple Countries. Journal of European Industrial Training. Vol. 24. No. 6. 330-336.
Faria, Anthony and William Wellington. 2004. A Survey of Simulation Game Users, Former-
Users, and Never-Users. Simulation & Gaming. Jun 2004. Vol. 35. Iss. 2. 178-207. Holowczak, Richard D. 2007. Real Time Foreign Exchange Data Modeling in International
Economics and Finance. Journal of Financial Education. Vol. 33, Summer 2007. 22-35. Marshall, Beverly B. 2004. A Classroom Exercise to Simulate Triangular and Covered Interest
Arbitrage. Journal of Financial Education. Vol. 30, Summer 2004.73-86 Sandler, Ralph. 2008. Forecasting Exchange Rates Within the Context of an International
Financial Management Course. Advances in Financial Education. Vol. 6, Winter. 119-135 Seaton, L. Jeff, and Michael Boyd. 2008. The Effective use of Simulations in Business Courses.
Academy of Educational Leadership Journal. Vol. 12, Iss. 1. 107-118. Shapiro, Alan C. and Atulya Sarin, Foundations of Multinational Financial Management,
Shapiro & Sarin, 6th ed., 2009, Wiley, Hoboken, NJ

14
Figure 1 Figure 1 shows the top of the student input spreadsheet. Because of the number of rows, the student input spreadsheet is continued in Figure 2.

15
Figure 2 Figure 2 is a continuation of the student input spreadsheet.

16
Figure 3
Figure 3 shows the spreadsheet using for comparing team performance and team ranking.

17
Appendix A A simulation game of foreign exchange trading and market index investing is designed to help participants to be familiar with foreign exchange and stock markets and apply financial principles to real-world situations. • Each team starts the game with USD10 million. In April, additional USD10 million can be borrowed from the bank. • Each index point costs USD1; e.g., ten shares of Dow Jones Industrial at 9,000 cost USD90,000 • http://finance.yahoo.com/ is the sole source of trading information. The price information (an Excel worksheet) will be posted in Blackboard every Friday after 3 pm when the New York Stock Exchange closes. • The portfolio adjustment is made once a week. • There are no transactions cost. • The game lasts 12 sessions from February 6 to May 1 (excluding the spring break). • Any unused cash balance will be automatically deposited in the money-market instrument (in USD). Borrowing and lending rates are the same as the going market rate of the 10-year Treasury note. • Two decimal points are used for the whole number as well as the percentage number; e.g., an index point of 4,905.21 and a bond yield of 4.58%. • Each team can take a short-sale position of any index shares: any remaining uncovered short-sale position will be covered (i.e., bought back) weekly for portfolio valuation in the USD term (See the portfolio balance in USD in the excel worksheet). • The information collected from the yahoo-finance webpage is used for portfolio adjustments. Any change in portfolio positions (hence updated worksheets) must be emailed to the professor by 6 p.m. each Saturday. • Each team should send their current worksheet, which will be also used for verification. Each team should designate one member as a bookkeeper and communication contact. Even if there is no change in portfolio, it must be communicated to the professor. No submission indicates no change in portfolio. Any two non-submissions will cost one percentage point from the final portfolio performance. • The portfolio performance is measured with the information as of 3 p.m. on May 8, 2009. All investments are converted to USD, and the USD period return is finally used for performance ranking.

18
• The 10 assigned percentage points are evaluated in two ways. First, the absolute performance is measured relative to MSCI index “The World Index in USD”. The weekly index information is also posted with other price information. The web address of MSCI is as follows: http://www.mscibarra.com/products/indices/stdindex/performance.jsp. If the portfolio performance is at least as good as MSCI, 5 percentage points will be given; otherwise, 4 points will be assigned. • Second, the relative performance is measured by return ranking, and the total of 50 points (5 points by 10 teams) will be distributed as follows: rank (points) 1st (10), 2nd (8), 3rd (7), 4th (6), 5th (5), 6th (5), 7th (3), 8th (3), 9th (2), 10th (1)
Thus, the simulation performance can range from 15 (= 5 + 10) points to 5 (= 4 + 1) points.
19
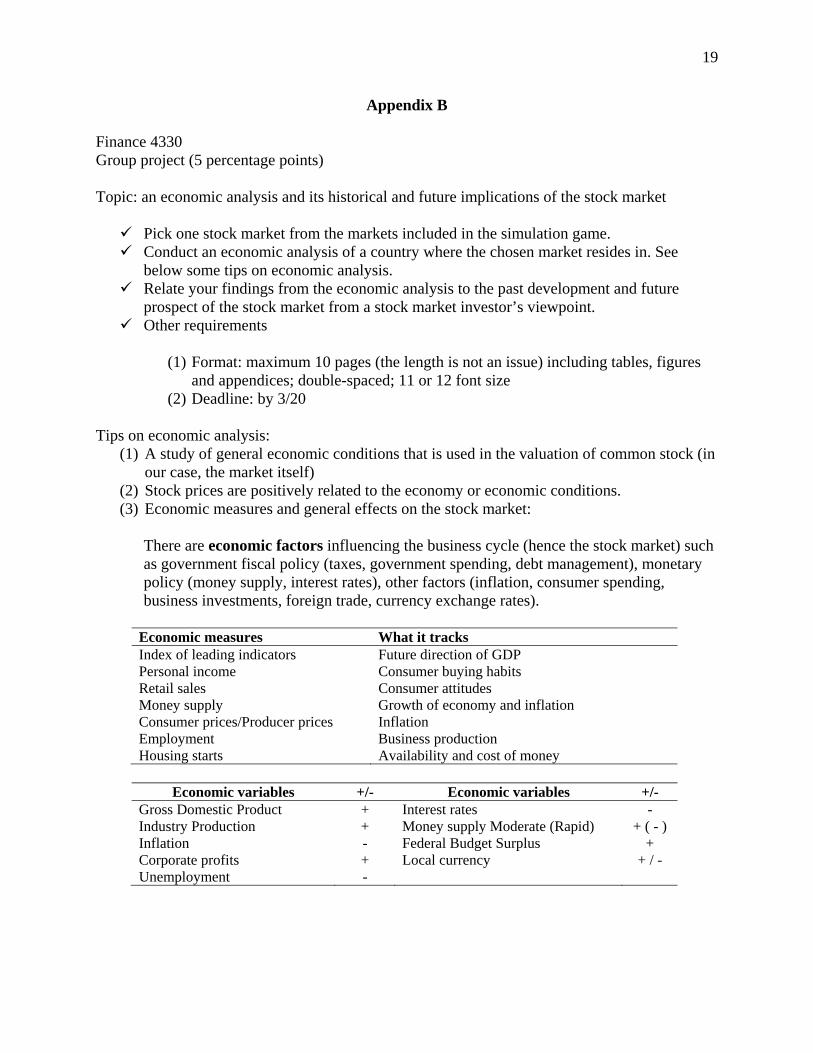
Appendix B
Finance 4330 Group project (5 percentage points) Topic: an economic analysis and its historical and future implications of the stock market
Pick one stock market from the markets included in the simulation game. Conduct an economic analysis of a country where the chosen market resides in. See
below some tips on economic analysis. Relate your findings from the economic analysis to the past development and future
prospect of the stock market from a stock market investor’s viewpoint. Other requirements
(1) Format: maximum 10 pages (the length is not an issue) including tables, figures
and appendices; double-spaced; 11 or 12 font size (2) Deadline: by 3/20
Tips on economic analysis:
(1) A study of general economic conditions that is used in the valuation of common stock (in our case, the market itself)
(2) Stock prices are positively related to the economy or economic conditions. (3) Economic measures and general effects on the stock market:
There are economic factors influencing the business cycle (hence the stock market) such as government fiscal policy (taxes, government spending, debt management), monetary policy (money supply, interest rates), other factors (inflation, consumer spending, business investments, foreign trade, currency exchange rates).
Economic measures What it tracks Index of leading indicators Future direction of GDP Personal income Consumer buying habits Retail sales Consumer attitudes Money supply Growth of economy and inflation Consumer prices/Producer prices Inflation Employment Business production Housing starts Availability and cost of money
Economic variables +/- Economic variables +/-
Gross Domestic Product + Interest rates - Industry Production + Money supply Moderate (Rapid) + ( - ) Inflation - Federal Budget Surplus + Corporate profits + Local currency + / - Unemployment -