integrating distributed generation: regulation and · pdf file2 integrating distributed...
TRANSCRIPT

Integrating Distributed Generation: Regulation
and Trends in Three Leading Countries
EPRG Working Paper 1423
Cambridge Working Paper in Economics
Karim L. Anaya and Michael G. Pollitt
Abstract We explore trends in the deployment and integration of distributed generation
in Germany, Denmark and Sweden. In particular, we examine the regulation of renewable
energy generation with a focus on grid access and connection mechanisms. The high rate of
distributed generation penetration in these countries is the result of early support given to the
expansion of renewable energy generation – mainly wind and solar - within their respective
national policies. Germany and Denmark are the countries with the most sophisticated
support schemes, which have shown changes over time. In terms of connections, Germany
is the country with the most favourable connection regime. It provides not only priority
connection but also priority use of the grid to generation units that produce electricity from
renewable energy sources. Sweden guarantees equal treatment among different
technologies (i.e. a non-discrimination principle) and is thus the least favourable. High
connection costs have been observed, especially in Germany and Denmark. The costs of
network upgrades are usually socialised across customers. The use of smart solutions
combined with novel business models might allow more efficient use of the current
distribution electricity infrastructure. Hence, integration issues should be taken into
consideration in order to avoid expansion of distributed generation in a way that
unnecessarily raises total system costs, via high connection costs.
Keywords distributed generation, renewable energy, support schemes,
connection arrangements
JEL Classification H25, L94, L98, Q48
Contact [email protected] Publication December 2014 Financial Support UK Power Networks via the Low Carbon Networks Fund’s Flexible
Plug and Play Project

2
Integrating Distributed Generation:
Regulation and Trends in three leading
countries
By
Karim L. Anaya1,2and Michael G. Pollitt2
Abstract
We explore trends in the deployment and integration of distributed generation in Germany,
Denmark and Sweden. In particular, we examine the regulation of renewable energy generation with
a focus on grid access and connection mechanisms. The high rate of distributed generation
penetration in these countries is the result of early support given to the expansion of renewable
energy generation – mainly wind and solar - within their respective national policies. Germany and
Denmark are the countries with the most sophisticated support schemes, which have shown
changes over time. In terms of connections, Germany is the country with the most favourable
connection regime. It provides not only priority connection but also priority use of the grid to
generation units that produce electricity from renewable energy sources. Sweden guarantees equal
treatment among different technologies (i.e. a non-discrimination principle) and is thus the least
favourable. High connection costs have been observed, especially in Germany and Denmark. The
costs of network upgrades are usually socialised across customers. The use of smart solutions
combined with novel business models might allow more efficient use of the current distribution
electricity infrastructure. Hence, integration issues should be taken into consideration in order to
avoid expansion of distributed generation in a way that unnecessarily raises total system costs, via
high connection costs.
Key words: distributed generation, renewable energy, support schemes, connection arrangements
1 Corresponding author.
2 The authors are with the Energy Policy Research Group (EPRG), University of Cambridge, Trumpington Street, Cambridge,
CB2 1AG, England. E-mail: [email protected], [email protected]; phone: +44 1527 759858, +44 1223 339615.

1
1. Introduction
The EU 2020 target of 20% of the EU energy consumption produced from renewable resources; and
the associated national renewable energy targets, are the main drivers for the expansion of
distributed generation (DG). The empirical evidence suggests that there is a substantial increase in
the rate of DG penetration over total installed capacity. The connection of more DG units to the
distribution grid poses a number of key challenges for electricity distribution utilities. First, there are
the technical issues associated with the operation of the network in the face of intermittent
generation embedded in a network built to serve loads. Second, there is the question of how to set
up the right economic incentives for connection and operation especially given that there are
multiple parties involved. Third, there is the issue of how to set up the regulatory framework to
facilitate – rather than impede – the connection of more DG connecting in a cost efficient way.
The aim of this paper is to explore and analyse the experience of three leading countries in the
deployment and integration of DG within the distribution grid. We want to know about the influence
that regulation and other factors have had on the deployment of DG. The paper analyses the
different grid access methods (e.g. deep, shallow) and connection arrangements (including
associated charges) for connecting DG facilities. The case studies we look at are Germany, Denmark
and Sweden due to the high rate of DG penetration and the maturity of the regulatory framework
with a focus on renewable generation.
This paper is structured as follows. Section 2 summarises the challenges and opportunities of DG and
its development. Section 3 explains and introduces our case studies from Germany, Denmark and
Sweden. Section 4 discusses the case studies and main findings. Section 5 concludes.
2. Background on Distributed Generation
2.1 Challenges and Opportunities
It is generally accepted that DG may produce a negative impact on the distribution network
operation. Among the main issues are voltage fluctuation, thermal capacity congestion, fault-level
contributions, frequency variation, regulation and harmonics (Currie et al. 2006; Lai and Chan, 2007;
Passey et al., 2011; Wojszczyk and Brandao, 2011). There are also some benefits associated with the
integration of DG to the distribution grid. Among the main benefits are the reduction of power losses
(subject to the level of DG penetration), provision of ancillary services (e.g. reactive power control
and energy balancing)3, the deferral of distribution and transmission system upgrades (especially in
constrained areas), improvements in the security of energy supply (via reduction of the dependency
on imported fossil fuels), customer bill savings (net metering) and quick construction (in comparison
with conventional centralised generating plants) (Gil and Joos, 2006; Mendez et al., 2006; Harrison et
al., 2007; Lai and Chan, 2007; Passey et al., 2011; Wang et al., 2009; Hung and Mithulananthan,
2012). IEEE (2012) indicates that the top three benefits for DG (based on frequency of response to a
survey of 460 global smart grid executives) are related to (1) supply issues (supply can be added
when needed – 47%), (2) cost reduction (for larger-scale generation facilities – 37%) and (3)
improvement reliability (– 36%).
3 However, following Cossent et al. (2009) the contribution of DG to the provision of ancillary services in Europe is still low.

2
2.2 Distributed Generation Development
Based on the number of respondents in the IEEE (2012) survey, the region that is expected to see the
most growth in DG over the next five years is Europe (32 %) followed by North America and Asia-
Pacific regions (26% both). Solar and wind technologies are likely to see the most significant growth
in the next five years, see Figure 1.
Figure 1: Distributed generation technologies with the highest expected demand over the next 5 years (% of executives surveyed)
This is in agreement with the trends in the solar and wind energy primary production over the last
years in the 27 European Union Member States (EU-27 MS). Solar technology and wind technologies
are among those with the highest growth across the EU-27 MS. Figure 2 illustrates this trend.
Figure 2: Solar and Wind renewable energy primary production in the EU-27 MS (period 2000/2011)
Even though biomass and waste, and hydro technologies are among those with the largest share of
renewable energy, around 67% and 16% respectively, their respective growth rate over the last five
years is relatively low, in comparison with solar and wind technologies.
Own elaboration. Source: IEEE (2012)
49%
18%
12%
8%
8%
3%
3%
Solar
Wind
Aggregated (virtual) resources
Diesel/gas turbines
Electric vehicles
Other
Micro nuclear
Own elaboration. Source: Eurostat.
0
2,000
4,000
6,000
8,000
10,000
12,000
14,000
16,000
18,000
2000 2001 2002 2003 2004 2005 2006 2007 2008 2009 2010 2011
1 0
00
ton
nes
of
oil
eq
uiv
ale
nt
Solar Wind

3
3. Case Studies
The cases studies of other countries have been selected based on the maturity of the regulatory
framework with special interest in the support for renewable energy sources in those countries. The
implementation of early subsidies and support schemes to electricity generation from renewable
energy sources is closely related to the expansion of DG.
Germany and Denmark are among the first movers in implementing substantial support schemes for
promoting the use of green technologies through the Feed-in Tariff approach, starting in 1990 and
1993 respectively. Currently both countries apply sophisticated subsidies schemes and incentives.
For instance, in Germany before the recent modification of the Renewable Energy Sources Act (EEG
2104), it was possible to make a selection between different methods. In Denmark, premium Feed-in
Tariff is the methodology selected. In both cases, specific bonuses (i.e. balancing costs, ancillary
services, repowering)4, digression rates (fixed and flexible)5 and stepped tariff schemes apply
depending on the technology. The early implementation of support mechanisms is reflected in the
highest penetration of DG in both countries.
Sweden is also an interesting case, with a very high level of renewable generation electricity, mainly
from hydro resources, however wind and solar generation are becoming increasingly utilised over
the last years. Sweden has the same subsidy scheme as Great Britain, the Green Electricity
Certificates scheme, where green certificates can also be traded with Norway.
A brief description of the country’s electricity market and key energy policies is given first, followed
by a discussion of the trend in DG and the related connection methods and charging.
3.1 Germany
3.1.1 Background on Electricity Market
Germany is the largest electricity market in Europe and was opened to competition in 1998. It has a
decentralised structure with a large number of private and publicly owned utilities. In contrast with
many other countries, there is not a single system operator or a separate energy regulator. The
German transmission system is the most important electricity-transit country and hub in the
mainland European electricity market (IEA, 2013b). Table 1 summarises the German electricity
market.
Table 1: German Electricity Market
4 Some of the bonuses applied in Germany have been recently abolished under EEG 2014.
5 Flexible rates depend on the expansion of the renewable generation capacity.
Electricity
Market
liberalisation
Distribution
Grid (km)
Distribution voltage
level
Transmission
Grid (km)
Transmission
voltage level # DSOs #TSO
Customers
(m)
Electricity
Production
(TWh)
Installed
capacity
(GW)
Installed
capacity
Renewable
(GW)
1998 1,753,290 <= 110 kV 34,841
150 kV, 220 kV,
380 kV 888 4 48.8 576.6 178.3 75.6
Source: BNetzA (2014)
Electricity Market

4
Four utilities dominate the electricity market: RWE AG, E.ON Energy AG, Vattenfall Europe AG and
EnBW AG, known as supra-regional utilities or Big 4 utilities. Based on IEA (2013b) the continuation
of their expansion is in response to the closure of eight nuclear plants and the expansion of
renewable energy capacity. The four utilities are involved in the generation activity (together
generate around 73% of the total electricity generated in 2012) and supply activity (with a retail
market share of 45.5% in 2012). The rest of suppliers comprises circa of 900 regional and local
vertically integrated utilities that own generation assets, and are involved in the distribution and
supply business (BNetzA, 2014; IEA, 2013b).
In terms of generation installed capacity, the share of generation facilities using renewable energy
sources accounts to 43% of total installed capacity. Coal and nuclear remain the major sources for
electricity generation with a share of 45.1% and 18% respectively. The share of renewable energy
sources in gross final energy consumption has risen from 5.8% (2004) to 12.4% (2012). Even though
this important increase, the average share in Germany over the period 2004-2012 is still below the
average of the 28 EU MS. Germany is among the 16 of the EU MS that expect to exceed its national
2020 target regarding the share of renewable energy sources in gross final energy consumption, set
at 18% (EREC, 2011), see Figure 3.
Figure 3: Share of renewable energy in gross final energy consumption
In terms of policies, the decisions made under the Energy Concept of 2010 and the Transformations
of the Energy System of 2011 (Energiewende) constitute the current (late 2014) federal
Government’s energy policy. The Energy Concept 2010 represents a long term strategy for the
implementation of a reliable, affordable and environmentally sound energy supply system by 2050
and at the same time constitutes the roadmap to the age of renewable energy (BMU, 2011).
Energiewende is associated with the move towards an energy portfolio focus on renewable
generation and the phase out of nuclear power6. In addition, the EEG is a key element in the success
6 In 2011 the role assigned to nuclear power in the Energy Concept was reassessed due to the nuclear meltdown at
Fukushima in March 2011. As a result the seven oldest nuclear plants and the one at Krummel were shut down permanently. In addition, it was proposed to phase out the operation of the remaining nine nuclear power plants by 2022 (instead of 2036)
Ow n elaboration. Source: Eurostat
0
2
4
6
8
10
12
14
16
18
20
2004 2005 2006 2007 2008 2009 2010 2011 2012 2020
% o
f re
ne
wa
ble
en
ergy
in g
ross
fin
dal e
nerg
y co
nsu
mp
tion
Germany average 28 EU MS

5
of the renewable energy expansion. The Act entered into force in 2000 and has been amended
several times. For instance, with the latest implementation of the modified Act (EEG 2014),
generators with an installed capacity of at least 500 KW that operate new plants are required to sell
their electricity in the power market thus the option of Feed-in Tariff is not applicable anymore
however some exceptions may apply. The threshold is reduced to 100 KW from 2016 onwards. In
addition, from 2017 onwards, a tendering process will be implemented and will replace both the
Feed-in Tariff and the market premium.
Specific renewable energy, energy efficiency and climate targets have been also set. Table 2
summarises them. Its implementation requires the increase of energy efficiency, expansion of
renewable energy sources, reduction of the greenhouse emissions and additional investment in the
electricity grid.
Table 2: The German Targets and Goals
3.1.2 Distributed Generation
3.1.2.1 Distributed Generation Figures
In 2010, the installed capacity allocated to DG was 83 GW and represented 51.7% of the total. In
addition, around 97% of renewable energy sources were connected to the distribution grid (BMU,
2012). Wind power and solar PV are those with the highest share of DG. By the end of 2012, wind
power and solar PV accounts to 83% of the total renewable installed capacity. In terms of solar PV,
the majority of DG customers are connected to low voltage (LV) level (230/400V) and medium
voltage (MV) level (11-60 kV). 65% of generators are connected to LV level and 35% to MV level. Only
a few plants are connected to high voltage (HV) level (110 kV). In relation to wind energy, 95% of the
DG customers are connected to MV (Ackermann, 2013). Figure 4 illustrates the trend in DG with a
focus on renewable energy sources for the period 1990-2012.
Regarding electricity generation, wind energy, biomass and solar PV are the technologies that
contribute the most to the generation mix. Solar PV is the one with the highest growth rate in the
period 2004-2012. On the other hand, electricity generation from hydro sources has remained nearly
the same over time.
Concept Targets and Goals 2020 2030 2040 2050
Climate Reduction of greenhouse gases -40% -55% -70% -80%
(base year 1990)
Renewable Energy Share in total final energy consumption 18% 30% 45% 60%
Share in electricity consumption 35% 50% 65% 80%
Energy efficiency Reduction of primary energy consumption -20% -50%
(base year 2008)
Reduction of electricity consumption -10% -25%
(base year 2008)
Reduction of final energy consumption in the
transport sector (base year 2005) -10% -40%
Building renovation rate
Own eleboration. Source: BMU (2011)
From 1% a year to 2% of total building stock

6
Figure 4: DG Installed capacity
By the end of 2012, electricity generation from DG accounted to 143.5 GWh with a share of gross
electricity consumption of 22.5%. In the 1990’s the share of gross electricity consumption was mainly
driven by hydro with an average share of only 4%. After this, an important increase in other
renewable energy sources is observed. This increase is in line with the implementation of the EEG,
which entered into force in 2000. Figure 5 depicts the trend of electricity generation from DG over
time.
Figure 5: Electricity generation from DG
Concerning ownership, more than 50% of DG is owned by customers (private owners, industrial
companies and farmers) and only 5% is owned by the Big 4 utilities (Trendresearch, 2012). The
integration of more electricity from renewable energy sources to the system grid is affecting
negatively the Big 4 utilities due to the reduction of wholesale prices. Utilities such as RWE, which is
the largest power producer in Germany, are one of the most negatively affected due to the
reduction of wholesale price especially based on the expansion of solar PV. In general, the expansion
Ow n elaboration. Source: AGEE-Stat (2013) and BMU (2013)
0
10
20
30
40
50
60
70
80
90
19
90
19
91
19
92
19
93
19
94
19
95
19
96
19
97
19
98
19
99
20
00
20
01
20
02
20
03
20
04
20
05
20
06
20
07
20
08
20
09
20
10
20
11
20
12
inst
all
ed c
ap
aci
ty (G
W)
Hydro power Wind energy Biomass Photo-voltaics Geothermal energy
Ow n elaboration. Source: AGEE-Stat (2013) and BMU (2013)
0%
5%
10%
15%
20%
25%
0
20
40
60
80
100
120
140
160
19
90
19
91
19
92
19
93
19
94
19
95
19
96
19
97
19
98
19
99
20
00
20
01
20
02
20
03
20
04
20
05
20
06
20
07
20
08
20
09
20
10
20
11
20
12
TWh
Total electricity generation from renewable energy (TWh) share of gross electricity consumption (%)

7
of renewable energy generation is fostering competition. The RWE strategic roadmap suggests a
radical change that allows the firm to create value by leading the transition to the future energy
world (from its traditional business model based on large-scale thermal power production to project
enabler, operator and system integrator of renewables)7.
3.1.2.2 Grid access and Charging Methodologies for connections
The EEG requires that grid operators priority connect generating facilities that produce electricity
from renewable energy sources and from mine gas. In addition, they are required to prioritise the
purchase, transport and distribution of the entire available quantity of that electricity. Thus,
distributed renewable generators have to be connected before conventional power plants. The first
Feed-in Tariff scheme did not define the sharing of connection costs between the generator and the
grid operator (DSO). The 2000 amendment suggested the connection of the generating facility to the
technically and economically most appropriate grid connection point. This approach would help to
prevent grid operators from using their dominant position to exclude potential competitors from
power generation (Jacobs, 2012). A shallow connection charging methodology was adopted, in which
the renewable generator has to pay the costs for connecting the renewable generating unit to the
grid connection point based on the closest or technically and economically most suitable connection
point; including any installation of metering devices for recording the quantity of electricity
transmitted and received. Any required additional work (e.g. network reinforcement) should be
borne by the grid system operator (DSO) but only when the related costs are economically
reasonable. Germany was among one of the first countries in Europe to implement a shallow
connection charging approach. The introduction of this approach was made after the liberalisation of
the electricity market. The shallow connection methodology applies to most types of renewable
generation installations (excluding offshore wind). In relation to use of system charges, renewable
generators are not required to pay these charges to the DSO but only the costs associated with the
connection to the grid.
In order to facilitate the reduction of the generation output by remote generators in the event of
grid overload and to call up the current electricity feed-in at any given point in time, grid operators
need to take technical control over the installations (including CHP) connected directly or indirectly
to their grid system. Following the EEG 2014, installations with a capacity over 100 kW (including
CHP) are required to install the control and communication equipment. Solar PV with a capacity
between 30 kW and 100 kW may decide between installing the control and communication
equipment that allows the reduction of generation output remotely or face being limited to 70% of
their maximum effective exported capacity.
A compensation of 95% of the lost income is provided to the generator including additional expenses
(net of any savings) as a result of a grid bottleneck. However, if the lost income in a year exceeds 1%
of the income for that year, a compensation of 100% of the lost income is applicable. The
methodology for estimating compensation payments for electricity generated from wind, biogas,
biomass and CHP installations can be found at the BNetzA Guidelines on renewables energy feed-in
management.
7 See: http://www.energypost.eu/exclusive-rwe-sheds-old-business-model-embraces-energy-transition/

8
3.2 Denmark
3.2.1 Background on Electricity Market
The Danish electricity market was opened to competition in 2003. Similar to Germany, it has a
decentralised structure with a large number of private and publicly owned utilities. There is a single
transmission system operator (Energinet) and a single independent energy regulator (Danish Energy
Regulatory Agency). Energinet, a state-owned company created in 20058, covers both electricity and
gas markets. In general, the number of distribution electricity firms is decreasing primarily due to
acquisition/merger of very small firms (DERA, 2011). In terms of generation, the market is dominated
by central generation plants, the majority of them owned by DONG Energy (publicly-owned) and
Vattenfall (Swedish-owned). The rest of firms in the market are owned by other private companies,
local authorities, larger industries and cooperatives (Poblocka et al., 2011a). Denmark is integrated
into the Nord Pool, one of the world’s most successful international electricity markets. Table 3
summarises the Danish electricity market.
Table 3: Danish Electricity Market
By the end of 2012 the total generation installed capacity was around 14.17 GW from which large-
scale units (electricity and combined heat power - CHP) account for 51% of total installed capacity;
from this CHP alone accounts for 45% of total installed capacity. Up until the early 1990s electricity
production capacity was dominated by large-scale power units (DEA, 2012). The share of renewable
energy sources in gross final energy consumption has risen from 14.5% (2004) to 26% (2012), see
Figure 6.
Figure 6: Share of renewable energy in gross final energy consumption
8 Energinet was created by the merger of Eltra, Elkraft System, Elkraft Transmission and Gastra; and as of August 2012,
acquired the 10 former regional transmission firms.
Electricity
Market
liberalisation
Distribution
Grid (km)
Distribution voltage
level
Transmission
Grid (km)
Transmission
voltage level # DSOs #TSO
Customers
(m)
Electricity
Production
(TWh)
Installed
capacity
(GW)
Installed
capacity
Renewable
(GW)
2003 168,000 <= 60 kV 6,300
132 kV, 150 kV,
400 KV 77 1 3.2 35 13.6 6.4
Source: IEA (2011), DERA (2011)
Electricity Market
Ow n elaboration. Source: Eurostat
0
5
10
15
20
25
30
35
40
2004 2005 2006 2007 2008 2009 2010 2011 2012 2020
% o
f re
ne
wa
ble
en
ergy
in g
ross
fin
dal e
nerg
y co
nsu
mp
tion
Denmark average 28 EU MS

9
In contrast with Germany, the average share in Denmark over the period 2004-2011 (19.5%) is above
the average of the 28 EU MS (10.9%). Similar to Germany, Denmark is among the EU MS that expects
to exceed its target of share of renewable energy in gross final energy consumption, set at 35% by
2020 (EREC, 2011).
In relation to the key energy policies, the Danish Energy Agreement of March 2012 is one of the most
ambitious national energy plans. The new agreement supplements the energy policies already
proposed in the Energy Strategy 2050 published in February 2011. The Energy Agreement was
launched by the Danish Minister of Climate, Energy and Building and established, among others,
specific targets along with different investment programmes by 2020 with a focus on energy
efficiency, renewable energy and the energy system. This will facilitate the transition to a low carbon
economy by the phase out of fossil fuels and the expansion of energy supply to be covered only by
renewable energy by 2050, with an intermediate target of 33% reduction in the use of fossil fuels
(KEBMIN, 2011). Table 4 summarises the main targets and goals.
Table 4: The Danish Targets and Goals
3.2.2 Distributed Generation
3.2.2.1 Distributed Generation Figures
In 2009 the share of DG in total electric power was around 43%, of which 50% from wind (Cherian,
2013). In general, most renewable energy sources, including onshore wind, are connected to the
distribution grid and only the biggest offshore plants are connected to the transmission grid (132 or
150 kV) (Poblocka et al., 2011a). According to Energinet, as of 2013 the total DG installed capacity
was around 6.6 GW (including small scale CHP). Wind power generation is the one with the highest
share of DG (53%) followed by CHP installations (36%). Solar PV only represents around 8.1% of total
DG connected capacity however an impressive increase in solar PV connected capacity has been
observed in the last four years. The installed capacity increased from 6 MW in 2009 to 563 MW in
2013. On the other hand, biomass installations have remained without any relevant changes over
the last four years. Following Energinet, the number of distributed generators by the end of 2013
was 97,952 of which solar PV generators have the highest share (93%) followed by wind generators
(5.5%). Figure 7 depicts the trend in DG installed capacity over the period 2005-2013.
Concept Targets and Goals 2020 2050
Climate Reduction of greenhouse gases -34% -80%
(base year 1990)
Renewable Energy Share in total final energy consumption >35%
Share in electricity consumption (wind power). Total of
3,300 MW new power capacity (includes repowering) by
2020 50%
Energy efficiency Reduction in gross energy consumption -7.6%
(base year 2010)
Energy companies: energy savings by consulting energy
experts, subsidies to households/business.
Own elaboration. Source: KEBMIN(2012)
100% renewable
energy in the energy
and transport sector

10
Figure 7: DG installed capacity
Wind power generation plays an important role on the expansion of DG. According to IRENA-GWEC
(2012), the long-term commitment from the government to address climate change and to achieve
energy independence have been the main drivers for developing wind energy. There are many
conditions that have contributed to this expansion. Denmark is a first mover in the implementation
of an industrial and export-driven strategy for commercial scale wind. In addition, it has the most
developed permitting and sitting procedures which have improved over time. Priority access to the
grid is given to wind energy along with long-term targets for wind development. As of 2012, there
were around 5,020 wind turbines which accounted for 30% of the domestic electricity supply. The
size of the majority of wind turbines are between 0.5 and 0.9 MW and represent 42% of the total
wind capacity (DEA, 2012).
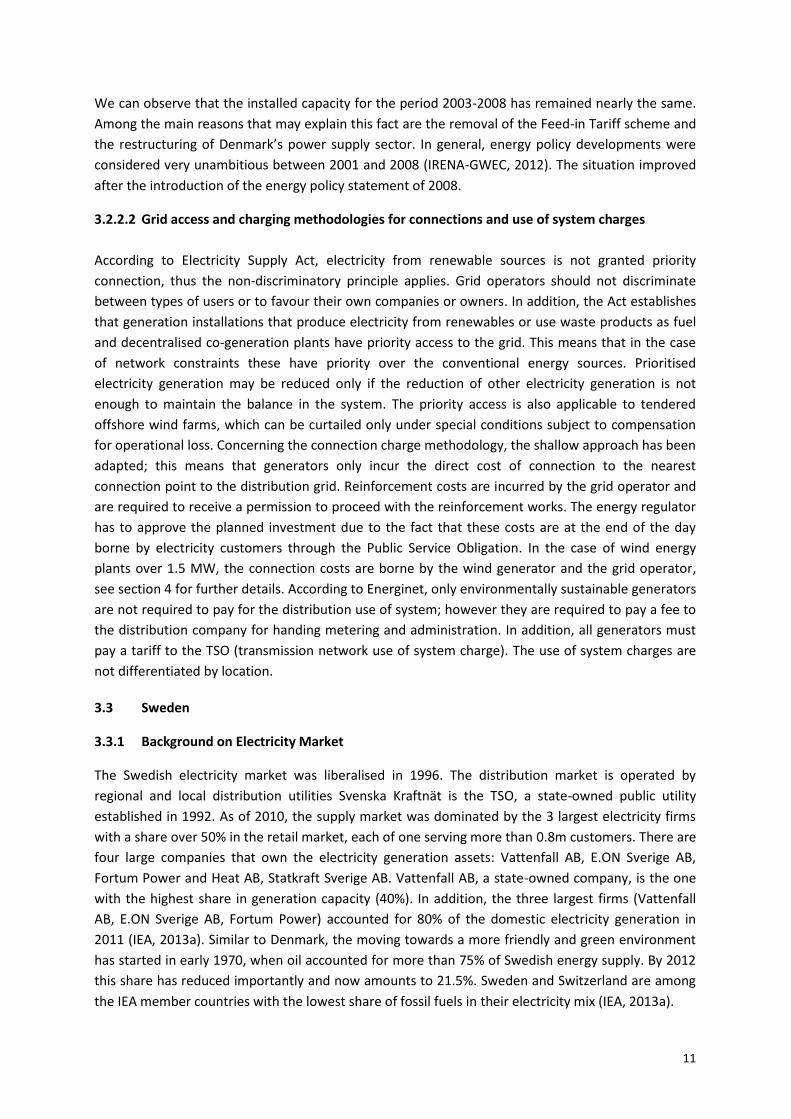
Figure 8 illustrates the trend in wind energy (onshore and offshore) installed capacity during the last
decade.
Figure 8: Accumulated wind capacity (MW)
Own elaboration. Source: DG data provided by Energinet
0
1,000
2,000
3,000
4,000
5,000
6,000
7,000
2005 2006 2007 2008 2009 2010 2011 2012 2013
inst
all
ed c
ap
aci
ty (M
W)
Wind onshore Biomass Solar PV Small scale CHP
Own elaborat ion. Source: Danish Wind Industry Associat ion (DWEA). 2013-15: projected f igures.
0
1,000
2,000
3,000
4,000
5,000
6,000
2003 2004 2005 2006 2007 2008 2009 2010 2011 2012 2013 2014 2015
inst
all
ed c
ap
aci
ty (M
W)
accumulated wind capacity onshore accumulated wind capacity offshore
11
We can observe that the installed capacity for the period 2003-2008 has remained nearly the same.
Among the main reasons that may explain this fact are the removal of the Feed-in Tariff scheme and
the restructuring of Denmark’s power supply sector. In general, energy policy developments were
considered very unambitious between 2001 and 2008 (IRENA-GWEC, 2012). The situation improved
after the introduction of the energy policy statement of 2008.
3.2.2.2 Grid access and charging methodologies for connections and use of system charges
According to Electricity Supply Act, electricity from renewable sources is not granted priority
connection, thus the non-discriminatory principle applies. Grid operators should not discriminate
between types of users or to favour their own companies or owners. In addition, the Act establishes
that generation installations that produce electricity from renewables or use waste products as fuel
and decentralised co-generation plants have priority access to the grid. This means that in the case
of network constraints these have priority over the conventional energy sources. Prioritised
electricity generation may be reduced only if the reduction of other electricity generation is not
enough to maintain the balance in the system. The priority access is also applicable to tendered
offshore wind farms, which can be curtailed only under special conditions subject to compensation
for operational loss. Concerning the connection charge methodology, the shallow approach has been
adapted; this means that generators only incur the direct cost of connection to the nearest
connection point to the distribution grid. Reinforcement costs are incurred by the grid operator and
are required to receive a permission to proceed with the reinforcement works. The energy regulator
has to approve the planned investment due to the fact that these costs are at the end of the day
borne by electricity customers through the Public Service Obligation. In the case of wind energy
plants over 1.5 MW, the connection costs are borne by the wind generator and the grid operator,
see section 4 for further details. According to Energinet, only environmentally sustainable generators
are not required to pay for the distribution use of system; however they are required to pay a fee to
the distribution company for handing metering and administration. In addition, all generators must
pay a tariff to the TSO (transmission network use of system charge). The use of system charges are
not differentiated by location.
3.3 Sweden
3.3.1 Background on Electricity Market
The Swedish electricity market was liberalised in 1996. The distribution market is operated by
regional and local distribution utilities Svenska Kraftnät is the TSO, a state-owned public utility
established in 1992. As of 2010, the supply market was dominated by the 3 largest electricity firms
with a share over 50% in the retail market, each of one serving more than 0.8m customers. There are
four large companies that own the electricity generation assets: Vattenfall AB, E.ON Sverige AB,
Fortum Power and Heat AB, Statkraft Sverige AB. Vattenfall AB, a state-owned company, is the one
with the highest share in generation capacity (40%). In addition, the three largest firms (Vattenfall
AB, E.ON Sverige AB, Fortum Power) accounted for 80% of the domestic electricity generation in
2011 (IEA, 2013a). Similar to Denmark, the moving towards a more friendly and green environment
has started in early 1970, when oil accounted for more than 75% of Swedish energy supply. By 2012
this share has reduced importantly and now amounts to 21.5%. Sweden and Switzerland are among
the IEA member countries with the lowest share of fossil fuels in their electricity mix (IEA, 2013a).

12
Table 5 summarises the Swedish electricity market.
Table 5: Swedish Electricity Market
In terms of installed capacity, hydro and nuclear power are the ones with the highest share in total
installed capacity. By the end of 2012 the share was 62.5% and 25.1% respectively. Excluding hydro
power, wind power had the highest share among renewables (10%). The share of renewable energy
sources in gross final energy consumption has risen from 38.7% (2004) to 51% (2012), which would
imply that the 2020 target has been already met (set at 50%), see Figure 9. This fact is explained by
the large proportion of hydropower and biofuels in the energy system. Sweden, along with Norway,
is among the EU MS with the highest share of renewable energy sources in gross final energy
consumption.
Figure 9: Share of renewable energy in gross final energy consumption
Regarding the energy policies, the integrated climate and energy policy approved by Swedish
Parliament in 2009, sets the strategic targets in line with the EU Directives. A share of renewable
energy in the gross final consumption of at least 50% is envisaged by 2020. Among other targets are
those related to climate, transport, energy efficiency, vehicles, and reduction of fossil fuels in
heating. Table 6 summarises most of them.
Electricity
Market
liberalisation
Distribution
Grid (km)
Distribution voltage
level
Transmission
Grid (km)
Transmission
voltage level # DSOs #TSO
Customers
(m)
Electricity
Production
(TWh)
Installed
capacity
(GW)
Installed
capacity
Renewable
(GW)
1996 530,000 Regional: 40-130 kV 15,000 220 kV, 400 kV 168 1 5.2 142.2 37.3 23.4
Local: <40 kV
Source: SEMI (2013), SVK (2012)
Electricity Market
Ow n elaboration. Source: Eurostat
0
10
20
30
40
50
60
2004 2005 2006 2007 2008 2009 2010 2011 2012 2020
% o
f re
ne
wa
ble
en
ergy
in g
ross
fin
dal e
nerg
y co
nsu
mp
tion
Sweden average 28 EU MS

13
Table 6: The Swedish Targets and Goals
In addition, under the Climate Roadmap 2050, launched in December 2012, different emission
scenarios in several sectors are proposed in order to achieve the 2050 vision of zero net GHG
emissions. The proposal suggests different types of actions such as the reduction of domestic
emissions, contributions from an increased net uptake of carbon in forests and fields, and by
purchasing allowances on the international markets.
3.3.2 Distributed Generation
3.3.2.1 Distributed Generation Figures
As indicated by the Sweden Energy Agency, the definition of DG in Sweden is related to micro
generation which usually is associated with those plants behind a fuse of 100 A9. This kind of
installation usually corresponds to a plant with a maximum capacity of 40 kW. In terms of solar PV,
the Swedish Energy Agency has stated that in general not all solar PV plants are approved for green
certificates because this requires that the power output be metered every hour and usually the
associated costs exceed the income they would receive for the certificates. For this reason, many
solar PV plants remain outside of the green certificate system. The information provided by the
Swedish Energy Agency is based on the annual survey conducted by the International Energy Agency
under the Co-operative Programme on Photovoltaic Power Systems (IEA, 2013c). Even though the
data refer to the total solar PV connected capacity in Sweden, we believe that these figures reflect
the trend in distributed solar PV connected capacity (solar PV installations are usually connected at
the distribution grid). Figure 10 depicts the trend in solar PV connections over the period 1992-2012.
9 In order to make proper comparisons we have asked the energy regulators to provide DG connected capacity data in the
format required, this means installed capacity data of generation plants connected within the distribution network. However, the DG data provided by the regulator was not in the format required, except for solar PV.
Concept Targets and Goals 2020 2030 2050
Climate
Reduction of greenhouse gases or
20m tonnes of carbon dioxide
equivalent -40% -100%
(base year 1990)
Renewable Energy
Share in gross final energy
consumption >50%
Share in transport sector 10%
Energy efficiency Reduction in gross energy consumption -20.0%
(base year 2008)
Vehicle
Vehicle stock
independent
of fossil fuels
Own elaboration. Source: IEA (2013a)

14
Figure 10: Solar PV installed capacity
By the end of 2012 the solar PV installed capacity was around 24.3 MW. An important upward is
observed in the last years. The increase may be explained by the implementation of the support
scheme for solar PV in July 2009. The category of grid-connected distributed is the one with the most
impressive growth in the last years. As of 2012, this category is the most representative of the total
solar PV installed capacity with a share of 65%.
3.3.2.2 Grid access and charging methodologies for connections and use of system charges
Based on the Electricity Act, grid operators are obliged to connect on reasonable terms generation
plants regardless of technology, unless there are special reasons. Thus, the principle of non-
discrimination applies. However grid operators are not required to incur the costs of grid expansion.
Following Poblocka et al. (2011b), the main connection issue is the so-called threshold effect. This
means that if reinforcement is required in a specific area, the first generator to ask for a connection
would bear the whole investment cost. This fact contributes to delays in the expansion of renewable
energy sources. The TSO and the DSO are the ones that make the decision on cost sharing. Based on
the same principle of non-discrimination, electricity produced by renewable energy sources is not
given preference. The Electricity Act proposes a similar treatment for the use of grid across all
generation installations regardless of technology. This means that electricity produced by renewable
energy sources will not have priority over electricity produced by conventional energy sources. In the
case of curtailment, the TSO has the right to reduce the generation of electrical power. Generation
plants will be compensated based on the market value of the electricity. Grid operators are required
to pay the use of system charges. However, a reduced tariff is applied to those generation plants
with installed capacity less than 1.5 MW.
Own elaboration. Data provided by Swedish Energy Agency based on IEA (2013c)
0
5
10
15
20
25
30
19
92
19
93
19
94
19
95
19
96
19
97
19
98
19
99
20
00
20
01
20
02
20
03
20
04
20
05
20
06
20
07
20
08
20
09
20
10
20
11
20
12
inst
all
ed c
ap
aci
ty (M
Wp
)
Off-grid domestic (MWp) Off-grid non-domestic (MWp)
Grid-connected distributed (MWp) Grid-connected centralized (MWp)

15
4. Discussion of case studies and main findings
Figures from the case studies have shown an important progress in the integration of DG – mainly
wind and solar - within the distribution grid. This is associated with the large and early support that
countries like Germany, Denmark and Sweden have provided to the expansion of renewable energy
resources within the respective national policies. Some of them were driven by their dependency on
oil import and fossil fuels. The consolidation of wind technology industry in Demark, has also
contributed to this integration. In Germany, the movement towards a renewable energy portfolio
involved the phase out of nuclear generation plants by 2022. However in Sweden, nuclear power is
part of the future energy portfolio and hydro power remains the main renewable energy source.
Subsidy schemes represent the main source of support. These schemes show a dynamic design over
time, from simplistic models (fixed rate) to sophisticated support mechanisms that involved
premiums, flexible digression rates, stepped tariffs and tendering (i.e. Germany from 2017 onwards).
Thus support mechanisms have been adapted in response to the expansion of renewable energy
sources, technology maturity and to the specific targets set in agreement with the European and
national energy policies. In agreement with Ferreira et al. (2010), we also observe that the expansion
of DG might be linked to the energy market structure. The three countries that are part of this study
have decentralised distribution electricity systems with a large number of DSOs. This facilitates the
connection of more generation units by reducing the distance to the point of connections, by
lowering the costs of more specialised equipment required to connect the generation units to higher
voltage levels (by connecting to the local DSOs instead of the national or regional DSOs) and by
accelerating the connection process (DG customers have more options to select among potential
DSOs within the preferred service area).
Connection and the associated charging methods also have an important role in the integration of
DG. Different rules are observed across the cases studies. Table 7 summarises the different
connection methodologies.
Table 7: Summary of Connection and Grid Access for DG
Germany is the country that has adopted the most favourable connection conditions. A DG customer
is not subject to the payment of reinforcement (if applicable), it does not pay use of system charges,
and has a priority connection to the grid and in the use of grid. This means that renewable DG plants
are connected ahead of conventional plants and have priority when the electricity is purchased and
needs to be exported into the grid. The least favourable conditions applied to renewable DG plants
in Sweden where grid operators (DSOs) have the obligation to connect the generation plant but they
are not necessarily required to incur the reinforcement costs (when applicable). In addition, based
on the threshold effect, the first potential DG customer who asks for connection is the one that
Country
deep shallowish shallow Yes No Priority
Non-
discriminatory Priority
Non-
discriminatory
Germany X X X X
Denmark X X X X
Sweden X X X X
Own elaboration. In the case of Denmark, use of system charges (in distribution) is not applicable only for environmetally green technologies.
Connection method Use of system
chargesUse of gridConnection to the grid

16
would incur the whole network upgrade investment cost. At the end of the day, in practice the TSO
and the grid operator (DSO) are those who make the decision on cost sharing due to the lack of
clarity in the connection rules described in the Electricity Act.
For instance, in other jurisdictions such as Great Britain, a shallowish method is applied, which
implies that generators would only pay a proportion of the reinforcement costs under specific
conditions (OFGEM, 2009). However, in practice, it is the DG customer that would need to cover the
reinforcement costs if the costs associated with the extension of the distribution network have not
been budgeted by the DNO. We observe that in comparison with the shallowish connection, the
option of shallow connection tends to facilitate the connection process but the socialisation costs
increase. DG customers are those that benefit from this approach (i.e. have no reinforcement costs)
and DNOs are not affected because any cost related to reinforcement costs will be passed on via
higher charges to demand customers. Therefore, Germany and Denmark are the ones where
demand customers are the most negatively affected because reinforcement costs are socialised and
reflected in the electricity tariff. For instance in Germany, based on the Ordinance on Incentive
Regulation of Energy Supply Grids (AregV), distribution operators are allowed in some specific cases
to request approval for network expansion or restructuring investment (“investment measures”) in
order to facilitate the integration of installations under the EEG and the Co Generation Act (KWKG).
Such approval allows DSOs to include additional costs in the estimation of the grid fees. The latest
amendment of the Ordinance on August 14 2013 mandates the treatment of specific mechanisms for
DSOs, namely expansion factor and the lump-sum investment.
Regarding the expansion factor, the Ordinance has established that a sustained change in the grid
operator’s supply task should be reflected in the determination of the revenue cap by a factor
(expansion factor). However, the application of the expansion factor is limited to networks below
110 kV. DSOs may also claim a lump-sum investment allowance which has to be included in the
determination of revenue cap prior to the beginning of the regulatory period. In all cases, these
additional costs are borne by demand customers through electricity tariffs.
In Denmark, the investment risk (associated with the network upgrades for connecting generating
units) may be transferred to DSOs but under specific conditions. According to Energinet, the
Udligningsordningen is a mechanism which helps to compensate the costs they incur due to the
integration of distributed environmental and friendly power production with a focus on wind power
generation. This is in accordance with the Promotion of Renewable Energy Act, which mandates the
share of connection costs between the DSO and the wind developer/generator above 1.5 MW. The
wind turbine generator incurs the cost of connecting the turbine at a defined connection point inside
the area designated by the municipality. If required, DSOs are obligated to pay the related
reinforcement costs of the network. Under this scheme, Energinet determines and covers the DSO’s
grid expansion costs caused by new electricity production units based on an expense model that
takes into account a base amount, the quantity of cable required and digging work. Thus, if the
estimations made by the DSOs are lower than those computed by Energinet, the DSO retains this
excess. An opposite situation is also possible, when DSO receives less money than the incurred costs.
In the last case, the DSO is responsible for the loss10. This model allows to DSOs to plan a cost-
efficient solution that meets future demand (the TSO does not interfere in the solution). It addition,
10
Following Energinet, total refund provided by Energinet for the 18 projects was around DKK 60.3m (£6.7m) and the total expenses reported by the DSOs were around DKK 57.8m (£6.4m).

17
it has low transaction costs (i.e. with annual turnover about US$ 35m (£20.9m), transaction costs are
1%). This is based on a simple refund process and releases resources to focus on special cases
(especially when model is insufficient). Similarly to the other initiatives, costs associated with the
network expansion are borne by all demand consumers through the Public Service Obligation.
We observe that in both cases, reinforcement costs are still borne by the demand customers through
the electricity tariff and the use of more innovative or smart solutions (technical and commercial) is
not observed (at least as business as usual or deployment). Smart solutions might contribute to use
more efficiently the distribution electricity infrastructure (i.e. offers of non-firm connections) and to
lower the reinforcement costs (i.e. network deferral) which is translated in lower socialisation costs.
According to CEER (2014), only 42% of 27 EU countries have a strategic road map in place for the
implementation of smart grids. Denmark has already implemented the plan at national level, Sweden
is already working on this with due date December 2014 and Germany has not introduced yet any
plan. Great Britain has introduced a high level route map. In addition, in the majority of countries
DSOs play the major role in the smart grid development. Only in some of them (e.g. Great Britain,
Norway and Italy), the dissemination and demonstration project results is compulsory. Among the
demonstration projects in Great Britain are those funded under the Low Carbon Network (LCN)
Fund, managed by OFGEM. Flexible Plug and Play (FPP) and the Accelerating Renewable Connections
(ARC) projects have suggested novel commercial arrangements (non-firm connections) and smart
technical solutions. For further details about smarter commercial arrangements see Anaya and Pollitt
(2014).
Finally, network planning is also a key element in the integration of DG units. It is not only about
promoting the expansion of DG but also about taking into account the impact that this expansion
might have on the distribution network. According to EPRI (2014) one of the main problems that
Germany is facing in relation to this expansion is the lack of effective integration, with a focus on
solar PV. Until recently, generators were not required to be equipped to provide grid support
functions (e.g. reactive power management, frequency control), ignoring power load limitations and
grid design. This fact produced an increase in network upgrades for all demand customers. The use
of smart inverters can help to avoid this kind of issues including mass disconnection risk of DG
customers (EPRI, 2014). In addition, specific remote equipment for managing the generator output
(such as those required by solar PV generation units in Germany), can help to deal with technical
problems in the event of grid overload and contribute with the efficient integration of DG.
5. Conclusions and Policy Implications
5.1 Conclusions
This study has evaluated the integration of DG within the distribution grid in three leading countries.
We have found that there is no specific regulation for DG but for the integration of electricity
generation from renewable energy sources and the related support schemes. The study has explored
the current methods for connecting DG to the distribution grid, the charging scheme including the
use of system charges and the way in which the connections and reinforcement costs are distributed
between parties.
We have found that there is a lot of socialisation of connection costs, especially in Germany and
Denmark where the shallow approach is the connection methodology and the grid operator or DSO

18
is obligated to reinforce the network and transfer the related costs to demand customers. This is
reflected in the high electricity tariff that electricity customers from those countries are required to
pay. In terms of subsidies, again Denmark and Germany are the ones with the most sophisticated
methodologies. However, this sophistication remains in the subsidies and it is not evident in the
business model for the connection of more DG in a cost and efficient way. An interesting initiative is
the recent implementation of the EEG 2014 in Germany which attempts to minimise the socialisation
of costs by the imposition of direct selling into the market from 1 August 2014 onwards.
Nevertheless, initiatives to reduce the socialisation of DG connection to the grid are not generally
observed. In Denmark, the expense model proposed by Energinet is quite interesting but is still
based on the option of reinforcing the network, and does not relate to the practice of smart
connection arrangements that may help to defer investment and to avoid charging demand
customers for unnecessary network expansion.
5.2 Policy Implications
The socialisation of connection costs implies higher electricity prices for end customers.
Governments should encourage the prompt implementation of national policies that promote the
development of smart grids. These might contribute to the integration of DG units in a quicker and
cost-efficient way. Currently, most smarter integration initiatives are only demonstration trials.
Auctions which include connection costs in the ranking of the bids for new DG units would represent
a novel way that may bring value-added to the current distribution business model. There are well-
document decentralised auctions (usually performed by electric utilities from the US) that could help
as reference. Most of these take into account the provision of additional services required by
generators which can help with the integration of the new DG units into the distribution grid.
5.3 Limitations and Further Research
This study has only focused on three leading countries in the integration of DG. Further research,
would consider not only expanding the list of case studies on DG integration (e.g. to include
examination of Spain, Italy, France) but also assess the progress on specific initiatives on smart grids
that promote the efficient integration of DG units into the distribution grid. The evaluation of these
policies and the economic impact analysis (with a focus on end customers) would bring additional
value to this research.
Acknowledgments
The authors wish to acknowledge the financial support of UK Power Networks via the Low Carbon
Networks Fund’s Flexible Plug and Play Project. The authors also want to acknowledge the support of
OFGEM, the Federal Network Agency for Electricity, Gas, Telecommunications, Posts and Railway
from Germany (BNetzA), the Danish Energy Agency (Energinet), the Danish Energy Association and
the Swedish Energy Agency for the provision of valuable information and clarifications. The views
expressed herein are those of the authors and do not reflect the views of the EPRG or any other
organisation that is also involved in the Flexible Plug and Play Low Carbon Networks (FPP) project.

19
References
Ackermann, T., 2013. What Matters for Successful Integration of Distributed Generation, presented at IEA
Workshop, Paris, October 1st
2013.
http://www.iea.org/media/workshops/2013/futurechallenges/9ackermann.pdf
AGEE-Stat, 2013. Zeitreihen zur Entwicklung der erneuerbaren Energien in Deutschland, Arbeitsgruppe
Erneuerbare Energien-Statistik. http://www.energiestiftung.ch/files/downloads/energiethemen-
erneuerbareenergien/zeitreihen-zur-entwicklung-der-erneuerbaren-energien-in-deutschland.pdf
Anaya, K., Pollitt, M.G., 2014. Experience with smarter commercial arrangements for distributed wind
generation. Energy Policy 71, 52-62.
BMU, 2011. The Federal Government’s energy concept of 2010 and the transformation of the energy system of
2011, Federal Ministry for the Environment, Nature Conservation and Nuclear Safety (BMU).
http://www.germany.info/contentblob/3043402/Daten/3903429/BMUBMWi_Energy_Concept_DD.pdf
BMU, 2012. Distributed Generation in Germany: From policy planning to implementation to performance,
presented at the Great Wall Renewable Energy Forum 2012, Sino-German International Symposium on
Renewable Energy and Distributed Generation, Beijing, December 10th
2012.
BMU, 2013. Renewable Energy Sources in Figures: National and International Development. Federal Ministry
for the Environment, Nature Conservation and Nuclear Safety (BMU).
http://www.fes-japan.org/wp-content/uploads/2013/04/broschuere_ee_zahlen_en_bf.pdf
BNetzA, 2014. Monitoring Report 2013. Bundesnetzagentur fur Elektrizitat, Gas, Telekommunikation, Post und
Eisenbahen, Bundeskartellamt.
http://www.bundesnetzagentur.de/SharedDocs/Downloads/EN/BNetzA/PressSection/ReportsPublications/20
13/MonitoringReport2013.pdf?__blob=publicationFile&v=11
CEER, 2014. CEER status review of European Regulatory Approaches Enabling Smart Grids Solutions (“Smart
Regulation”). Council of European Energy Regulators.
http://www.ceer.eu/portal/page/portal/EER_HOME/EER_PUBLICATIONS/CEER_PAPERS/Electricity/Tab3/C13-
EQS-57-04_Regulatory%20Approaches%20to%20Smart%20Grids_21-Jan-2014-2.pdf
Cossent, R., Gomez, T. and Frias, P., 2009. Towards a future with large penetration of distributed generation: Is
the current legislation of electricity distribution ready? Regulatory recommendations under a European
perspective. Energy Policy 37, 1145-1155.
Currie, R.A.F., Ault, G.W., McDonald, J.R., 2006. Methodology for determination of economic connection
capacity for renewable generator connections to distribution networks optimised by active power flow
management. IEE Proc. Gen., Transm., Distrib. 153, 456-462.
Cherian, S., 2013. Denmark: Smart grids, renewables and distributed generation, presented at NARUC Summer
Committee Meetings, Denver, Colorado, July 21-24.
http://www.narucmeetings.org/Presentations/Dr.%20Sunil%20Cherian%20-%20Denmark-
%20smart%20grids,%20renewables,%20distributed%20generation%20%20-
%20NARUC%202013%20SUMMER%20MEETING.pdf
DEA, 2012. Energy Statistics 2012. Data, tables, statistics and maps. Danish Energy Agency.
http://www.ens.dk/sites/ens.dk/files/info/tal-kort/statistik-noegletal/aarlig-
energistatistik/energy_statistics_2012.pdf

20
DERA, 2011. 2011 National Report to the European Commission Denmark. Danish Energy Regulatory Authority.
http://www.ceer.eu/portal/page/portal/EER_HOME/EER_PUBLICATIONS/NATIONAL_REPORTS/National%20Re
porting%202011/NR_En/C11_NR_Denmark-EN_v3.pdf
EPRI, 2014. The Integrated Grid. Realizing the full value of central and distributed energy resources. Electric
Power Research Institute.
http://www.epri.com/abstracts/Pages/ProductAbstract.aspx?ProductId=000000003002002733
EREC, 2011. Mapping renewable energy pathways towards 2020: EU Roadmap. European Renewable Energy
Council. http://www.erec.org/fileadmin/erec_docs/Documents/Publications/EREC-roadmap-V4_final.pdf
Ferreira, H., Fulli, G, Kling, W.L., L’abbate, A., Faas, H., Pecas Lopes, J., 2010. Distributed generation in Europe:
the European regulatory framework and the evolution of the distribution grids towards smart grids, presented
at the Fifth IEEE Young Researchers Symposium in Electrical Power Engineering Proceedings, p. 1-6. Institute of
Electrical and Electronics Engineers (IEEE).
Gil, H.A. and Joos, G., 2006. On the quantification of the network capacity deferral value of distributed
generation. IEEE Trans. Power Syst. 21, 1592-1599.
Harrison, G.P, Piccolo, A., Siano, P., Wallace, R., 2007. Exploring the tradeoffs between incentives for
distributed generation developers and DNOs. IEEE Trans. Power Syst. 22, 821-828.
Hung, D.Q. and Mithulananthan, N., 2012. A simple approach for distributed generation integration
considering benefits for DNOs, presented at 2012 IEEE International Conference of Power System Technology
(POWERCON).
IEA, 2011. Energy Policies of IEA Countries: Denmark 2011 Review. International Energy Agency.
http://www.iea.org/publications/freepublications/publication/Denmark2011_unsecured.pdf
IEA, 2013a. Energy Policies of IEA Countries: Sweden 2013 Review. International Energy Agency.
http://www.iea.org/textbase/nppdf/free/2013/sweden2013_excerpt.pdf
IEA, 2013b. Energy Policies of IEA Countries: Germany 2013 Review. International Energy Agency.
http://www.cne.es/cgi-bin/BRSCGI.exe?CMD=VEROBJ&MLKOB=734697974949
IEA, 2013c. National survey report of PV power applications in Sweden 2012. Task 1: Exchange and
dissemination of information on PV power system, Co-operative Programme on Photovoltaic Power Systems.
International Energy Agency.
http://www.energimyndigheten.se/Global/Forskning/Kraft/Solcellsstatistik/National%20Survey%20Report%20
of%20PV%20Power%20Applications%20in%20Sweden%202012.pdf
IEEE, 2012. Power system of the future: The case for energy storage, distributed generation and microgrids.
Sponsored by IEEE Smart Grid with analysis by ZPRYME.
http://smartgrid.ieee.org/images/features/smart_grid_survey.pdf
IRENA-GWEC, 2012. 30 Years of Policies for Wind Energy: Lessons from 12 Wind Energy Markets. International
Renewable Energy Agency and the Global Wind Energy Council.
http://www.irena.org/DocumentDownloads/Publications/IRENA_GWEC_WindReport_Full.pdf
Jacobs, D., 2012. Renewable Energy Policy Convergence in the EU: The Evolution of Feed-in Tariffs in Germany,
Spain and France, Ashgate Publishing Limited, England.

21
KEBMIN, 2011. Energy Strategy 2050 – from coal, oil and gas to green energy. Danish Ministry of Climate,
Energy and Building.
http://www.ens.dk/sites/ens.dk/files/dokumenter/publikationer/downloads/energy_strategy_2050.pdf
KEBMIN, 2012. Accelerating Green Energy Towards 2020: The Danish Energy Agreement of March 2012. Danish
Minister of Climate, Energy and Building.
http://www.ens.dk/sites/ens.dk/files/dokumenter/publikationer/downloads/accelerating_green_energy_towa
rds_2020.pdf
Lai, L.L. and Chan, T.F., 2007. Distributed Generation: Induction and Permanent Magnet Generators, John
Wiley & Sons, Ltd., Chichester, England.
Mendez, V.H., Rivier, J., Gomez, T., 2006. Assessment of energy distribution losses for increasing penetration of
distributed generation. IEEE Trans. on Power Syst. 21, 533-540.
OFGEM, 2009. Electricity distribution price control review. Final proposal – Incentives and Obligations. Office of
Gas and Electricity Market, London.
https://www.ofgem.gov.uk/ofgem-publications/46748/fp2incentives-and-obligations-final.pdf
Passey, R., Spooner, T., MacGill, I., Watt, M., Syngellakis, K., 2011. The potential impacts of grid-connected
distributed generation and how to address them: A review of technical and non-technical factors. Energy Policy
39, 6280-6290.
Poblocka, A., Bruckmann, R., Piria, R., Frank, R., Bauknecht, D., 2011a. Integration of electricity from
renewables to the electricity grid and to the electricity market, RES-Integration. National report: Denmark,
Client: DG Energy. Eclareon and Öko-Institut e.V.
http://www.eclareon.eu/sites/default/files/denmark_-_res_integration_national_study_nreap.pdf
Poblocka, A., Brückmann, R., Herling, J., Becker, L., Bauknecht, D., 2011b. Integration of electricity from
renewables to the electricity grid and to the electricity market – RES Integration. National Report: Sweden,
Client: DG Energy. Eclareon and Öko-Institut e.V.
http://www.eclareon.eu/sites/default/files/sweden_-_res_integration_national_study_nreap_final.pdf
SEMI, 2013. The Swedish electricity and natural gas markets 2012. Swedish Energy Markets Inspectorate.
http://www.ceer.eu/portal/page/portal/EER_HOME/EER_PUBLICATIONS/NATIONAL_REPORTS/National%20Re
porting%202013/NR_En/C13_NR_Sweden-EN.pdf
SVK, 2012. Annual Report 2012. Svenska Kraftnät.
Trendresearch, 2012. Anteile einzelner Marktakteure an Erneuerbare Energien-Anlagen in Deutschland (2. Aufl
age). Trend:Research, Institut für Trend- und Marktforschung.
Wang, D.T.C, Ochoa, L.F., Harrison, G.P., 2009. Distributed generation and security of supply: Assessing the
investment deferral, presented at 2009 IEEE Bucharest Power Tech Conference, June 28th
-July 2nd
, Bucharest,
Romania.
Wojszczyk, B. and Brandao, M., 2011. High penetration of distributed generation and its impact of electric grid
performance – utility perspective, presented at Innovative Smart Grid Technologies Asia (ISGT), 2011 IEEE PES.