integrated technology-vision-planning
TRANSCRIPT

Overview of the Enterprise Approach to IT Summary of Initiatives Key Outcomes What is your role?
2

1999: Silo organizations grounded in either the “University” or “Medical Center” Academic Computing and Information Systems
Telecommunications
Management Information Systems
Informatics Center
Current state: Unified organization based on core competencies and purpose: Enterprise Infrastructure
Enterprise Applications
Enterprise Informatics
3

4
Jerry Fife
Vice Chancellor for
Administration (Interim)
Jeff Balser
Vice Chancellor for Health
Affairs
Nick Zeppos
Chancellor
John Doulis
Assistant Vice Chancellor/
COO, Informatics Center;
Associate CIA, Enterprise
Informatics
Matt Hall, Associate Vice
Chancellor, ITS; Associate
CIA, Enterprise Infrastructure
Tim Getsay, Associate Vice
Chancellor, MIS; Associate
CIA, Enterprise Applications
Bill Stead
Chief Information Architect;
Associate Vice Chancellor,
Strategy and Transformation
Vanderbilt University Information Technology Organization
Information Technology
Leadership Council (ITLC)
Richard McCarty
Vice Chancellor for Academic
Affairs, Provost
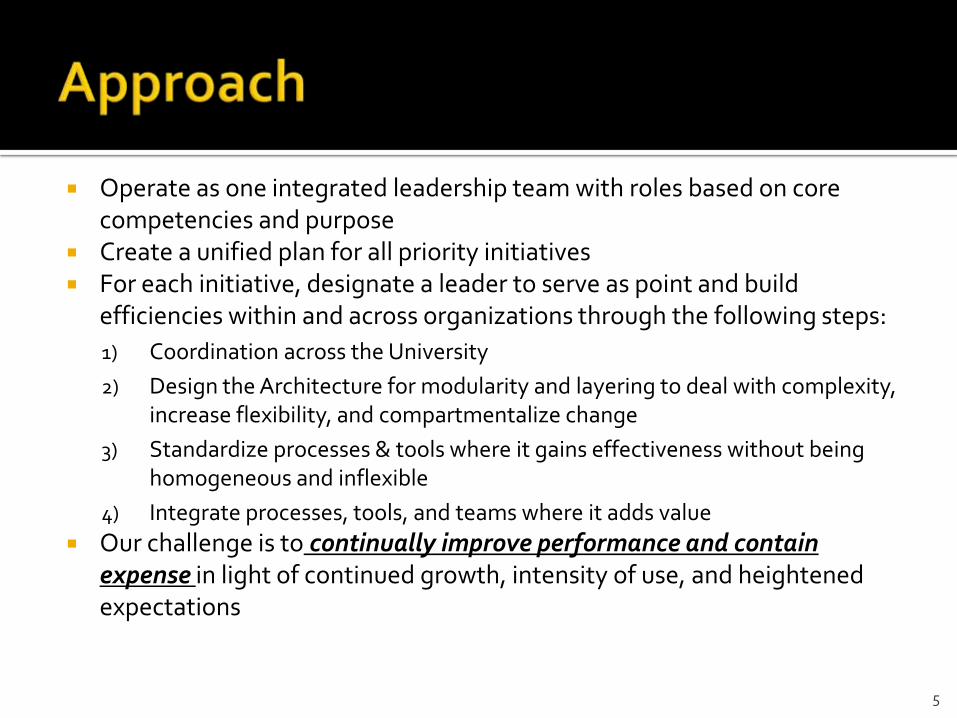
Operate as one integrated leadership team with roles based on core competencies and purpose
Create a unified plan for all priority initiatives For each initiative, designate a leader to serve as point and build
efficiencies within and across organizations through the following steps:
1) Coordination across the University
2) Design the Architecture for modularity and layering to deal with complexity, increase flexibility, and compartmentalize change
3) Standardize processes & tools where it gains effectiveness without being homogeneous and inflexible
4) Integrate processes, tools, and teams where it adds value
Our challenge is to continually improve performance and contain expense in light of continued growth, intensity of use, and heightened expectations
5

Roles and reporting relationships will likely change over time; however, our approach is not to solve problems through structural changes, but let organizational roles and relationships naturally emerge as collaboration intensifies.
Integration could be in the form of virtual teams, organizational structure changes, role changes, or moving activities externally to free up our internal resources for higher-value work.
As we move forward, the expectation is to always emphasize architecture over structure, integration over consolidation, and flexibility over rigidness.
6

7

Technical Support “Concept” Model
8
Support Processes (Monitoring, Purchasing, Capacity Planning, Service Level Agreements, Process Design & Improvement)
Service Mgmt
Product Mgmt
Tech Advisory

Operational Management
Technical Advisory
Support Processes
9Customer
Service Management
Product Management
3 Tiered Operational Support
Cu
stom
er Need
sC
apab
iliti
es a
nd
Co
sts
IT K
no
wle
dg
e


http://projects/sites/ic_admin/effectiveness/Lists/Opportunities for Efficiencies
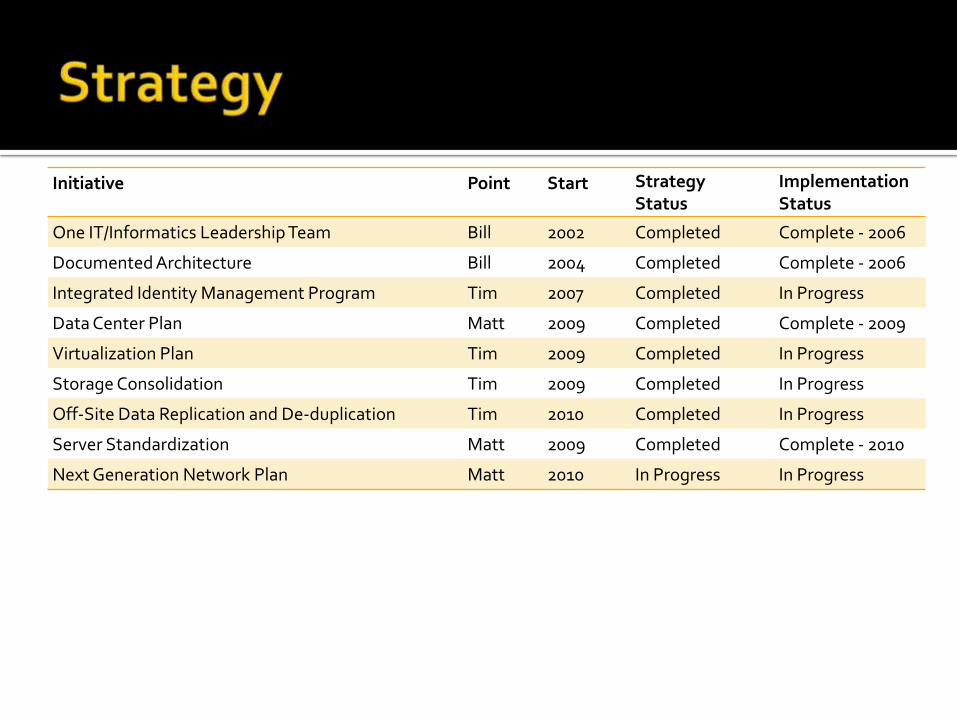
Initiative Point Start StrategyStatus
ImplementationStatus
One IT/Informatics Leadership Team Bill 2002 Completed Complete - 2006
Documented Architecture Bill 2004 Completed Complete - 2006
Integrated Identity Management Program Tim 2007 Completed In Progress
Data Center Plan Matt 2009 Completed Complete - 2009
Virtualization Plan Tim 2009 Completed In Progress
Storage Consolidation Tim 2009 Completed In Progress
Off-Site Data Replication and De-duplication Tim 2010 Completed In Progress
Server Standardization Matt 2009 Completed Complete - 2010
Next Generation Network Plan Matt 2010 In Progress In Progress

Initiative Point Start Status
IT Roles and Responsibilities (Latest Version) Bill 2009 Completed
Integrated Technology Risk Management John 2010 In Progress
Coordinated Contract Review /Vendor Protocols Matt 2009 In Progress
Data Center Best Practices Matt 2009 Completed
Consolidated Application Disaster Recovery John 2010 Completed
Common Change Management John 2010 In Progress
Shared Monitoring and Incident Response John 2010 In Progress
E-Discovery and Security Matt 2009 Completed

Initiative Point Start Status
Oracle Enterprise Agreement Tim 2003 Completed
Cisco Standard Matt 2006 Completed
Microsoft Enterprise Agreement Matt 2010 Completed

Initiative Point Start Status
Database Support Team Tim 2004 Completed
Application Servers, Storage, and Support Team Tim 2009 Completed
Business Intelligence Team Tim 2007 Completed
Communication Platform Team Matt 2009 Completed

17

18

Single authoritative source for person identity information Central service which will be responsible for provisioning and
managing accounts Well-defined and secure access points Up to date communication of person and account
information A robust governance structure Improvements resulting in: Improved security (e.g., Card Remuneration)
Reduced administrative costs based on reduction in complexity estimated at $250,000/yr
Utilization of role attribute in authorizations
19

0
500
1000
1500
2000
2500
T0 T1 T2 T3 T4 T5 T6 T7 T8 T9 T10
Power Capacity (kW)
Power Demand (kW)
Rack Capacity
Rack Demand
Committed Expansion of Hill (12/31/09)
New Data Center~ $66
Million

Virtualize whenever possible to decrease requirement for physical servers Manage Equipment Life cycle
Present: Processing performance drives replacement today
Future: Electrical [Power] capacity of data centers is what we manage. Pre-emptive replacement to reduce power consumption per unit of processing power
Develop rules for rational, secure & optimal occupancy of the data center Extend and expand disaster recovery capabilities at SunGard at operating
expense of $2 million/year Avoid a $66 Million+ in capital and operating expenditure for a new data
center (10 Years)

22
May 2010: 732 Images on 13 physical servers (50% capacity)Target: 60% Capacity

Category Year 1 Year 2 Year 3 Year 4 Year 5
Virtualization ($200,000) ($200,000) ($200,000) ($200,000) ($200,000)
Return Per Server Virtualized(200 servers @ $5,000 with 80%return)
$800,000 $800,000 $800,000 $800,000 $800,000
TOTAL $600,000 $600,000 $600,000 $600,000 $600,000
23
Reduces Hardware Burden
Lower maintenance
Lower space occupancy
Increased capital utilization
Mitigates need for new construction/capital expenditures

24
Collab
PACSMF
Apps
Apps
Apps
Apps MF
INF
PACS
PACS
VUH
Collab
Apps
Apps
Apps
INF
Hill Center
INF
3401 WE
MFApps
PACS
PACS
SunGard
INF
Stevenson
INF
INF
~24 Storage Devices
5 Locations
5 Support Groups
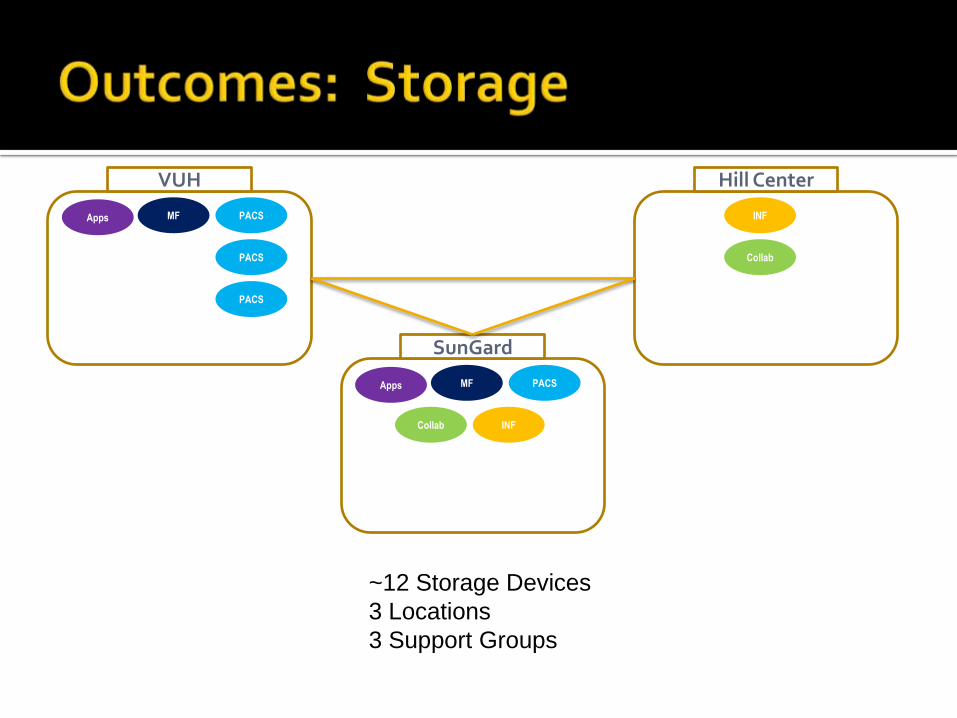
PACS
MFApps
PACS
PACS
VUH
Collab
INF
Hill Center
MFApps PACS
SunGard
INFCollab
~12 Storage Devices
3 Locations
3 Support Groups

Consolidation and simplification of environment reduces costs: Lower maintenance fees
Less operating expense
Greater scalability requires less capital to replace and grow
Category Year 1 Year 2 Year 3 Year 4 Year 5
Storage Plan Consolidation$ 1,250,000 $ 1,375,000 $ 1,512,500 $ 1,663,750 $ 1,830,125
Without Consolidation$ 1,562,500 $ 1,718,750 $ 1,890,625 $ 2,079,688 $ 2,287,656
TOTAL$ (312,500) $ (343,750) $ (378,125) $ (415,938) $ (457,531)

27

28

Data is replicated “real time” over secure internet connection to a de-duplication device outside of the Nashville area
Full recovery options provide for shipment within 72 hours or replication beginning immediately upon availability of local target
Elimination of critical Mainframe and Open Systems tapes within 1 year Alternative, less costly sites can be used to store remaining tapes until they can
be eliminated (2 – 4 years) Incremental cost impact based on April start date:
Category Year 1 Year 2 Year 3 Year 4 Year 5
New Data Vault Service $75,000 $288,000 $288,000 $288,000 $288,000
Tape Vault Hardware Maintenance ($25,000) ($25,000) ($25,000)
Tape Encryption (HIPAA) ($500,000) ($100,000) ($100,000) ($100,000) ($100,000)
Iron Mountian ($180,000) ($280,000) ($280,000) ($280,000)
TOTAL($425,000) $8,000 ($17,000) ($17,000) ($17,000)
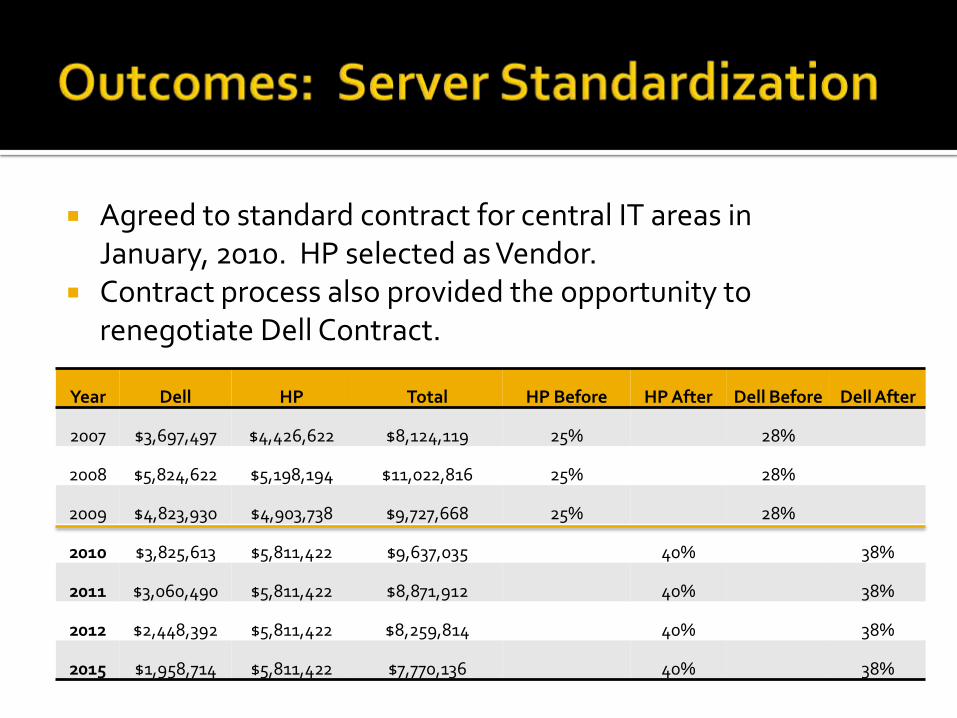
Agreed to standard contract for central IT areas in January, 2010. HP selected as Vendor.
Contract process also provided the opportunity to renegotiate Dell Contract.
Year Dell HP Total HP Before HP After Dell Before Dell After
2007 $3,697,497 $4,426,622 $8,124,119 25% 28%
2008 $5,824,622 $5,198,194 $11,022,816 25% 28%
2009 $4,823,930 $4,903,738 $9,727,668 25% 28%
2010 $3,825,613 $5,811,422 $9,637,035 40% 38%
2011 $3,060,490 $5,811,422 $8,871,912 40% 38%
2012 $2,448,392 $5,811,422 $8,259,814 40% 38%
2015 $1,958,714 $5,811,422 $7,770,136 40% 38%
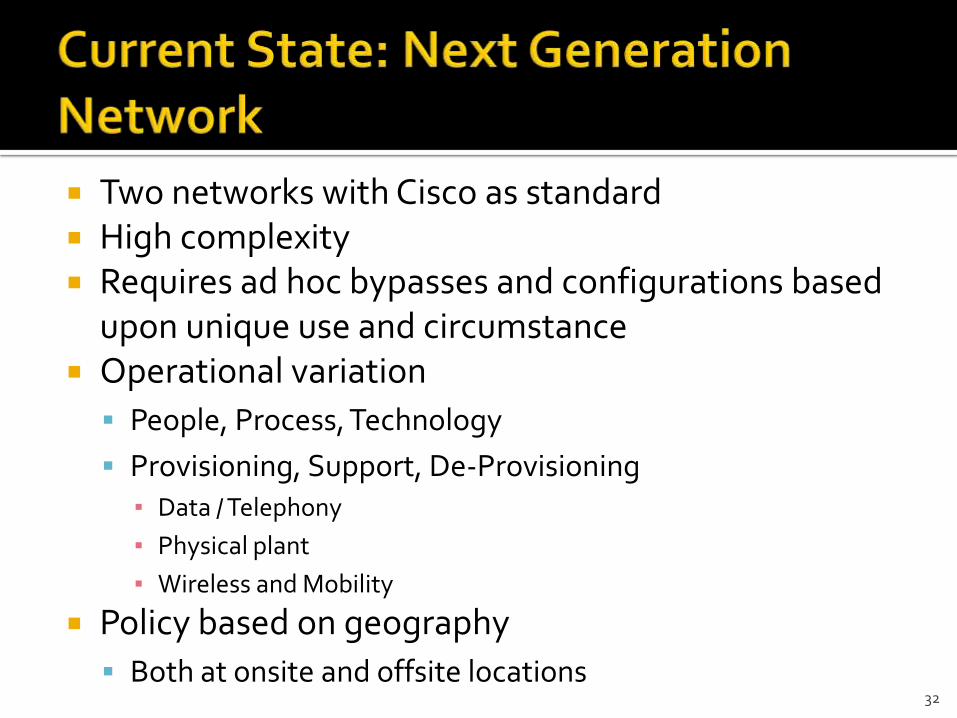
Two networks with Cisco as standard High complexity Requires ad hoc bypasses and configurations based
upon unique use and circumstance Operational variation
People, Process, Technology
Provisioning, Support, De-Provisioning▪ Data / Telephony
▪ Physical plant
▪ Wireless and Mobility
Policy based on geography
Both at onsite and offsite locations32

33

Never before experienced competitive traffic (voice, video, data, storage)
Example Case for Change Issue Usage Metrics
Video conferencing
& Desktop sharing
Real Time Video and Rich
Media Collaboration
Susceptible to
Latency
OCS voice and video (3/1 to 4/30/10) - 17,454; Skype
traffic - 3.9TB in April 2010;
Centra - 50 events/mo; avg. 3 attendees/event; 4
hrs/session
Academic Storage
(BlueArc)
High Volume Data
Transfer
FW Bottleneck;
Latency1.4 Gbps avg. peak (in & out)
State of Med. Ctr Streaming Media FW Bottleneck from 1 event in 2004 to 172 in 2009
YouTube, http
videoMedia Consumption
Network
Bandwidth
29.1TB in April 2010; 100% increase in 7 mos. (9/09
to 4/10)
Email, Web
browsingTraditional Traffic
Network
Bandwidth74 bil. DNS ref.; 1.45Bil. Messages
Anytime,
AnywhereHigh Expectations
Location
Dependent
Cell phones (30,000+); Laptops & Portable Devices
Proliferation (50,000+)
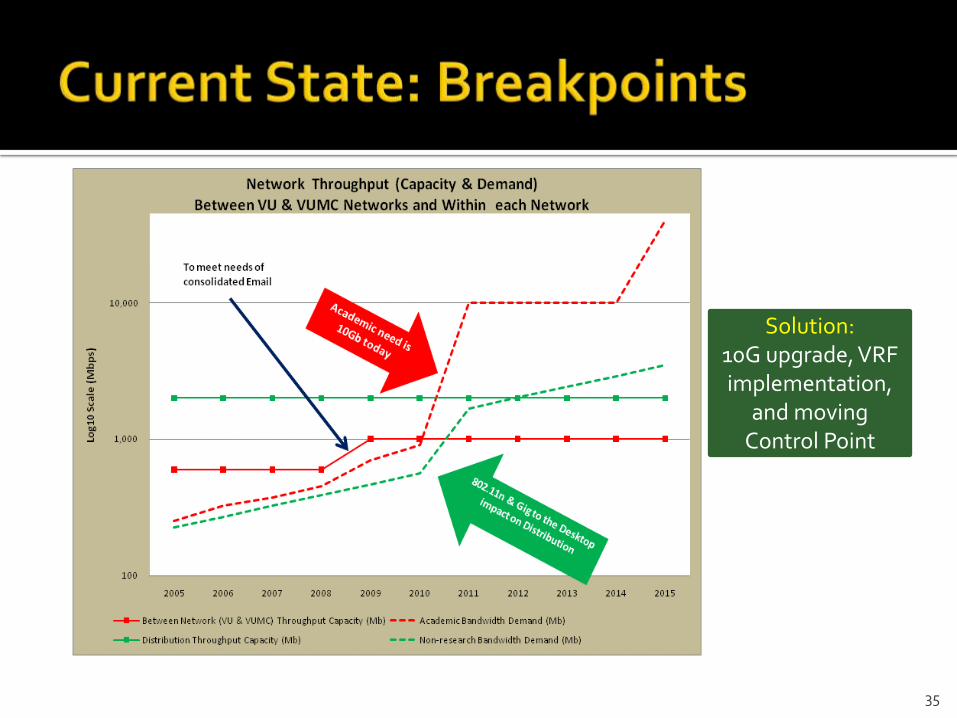
35
Solution:10G upgrade, VRF implementation,
and moving Control Point
Free people from location Allow competitive traffic to co-exist
Remove boundaries and choke points
Upgrade bandwidth from every on-ramp to the interstate
Recognize▪ the future of network traffic is voice, video, and things that don’t
tolerate latency
▪ Academic, student, clinical, administration share same physical net
Require affiliation and role identification to receive access to Vanderbilt resources
Allow for universal access to wireless, cellular, and fixed locations: Multiple carriers, max coverage
36
37
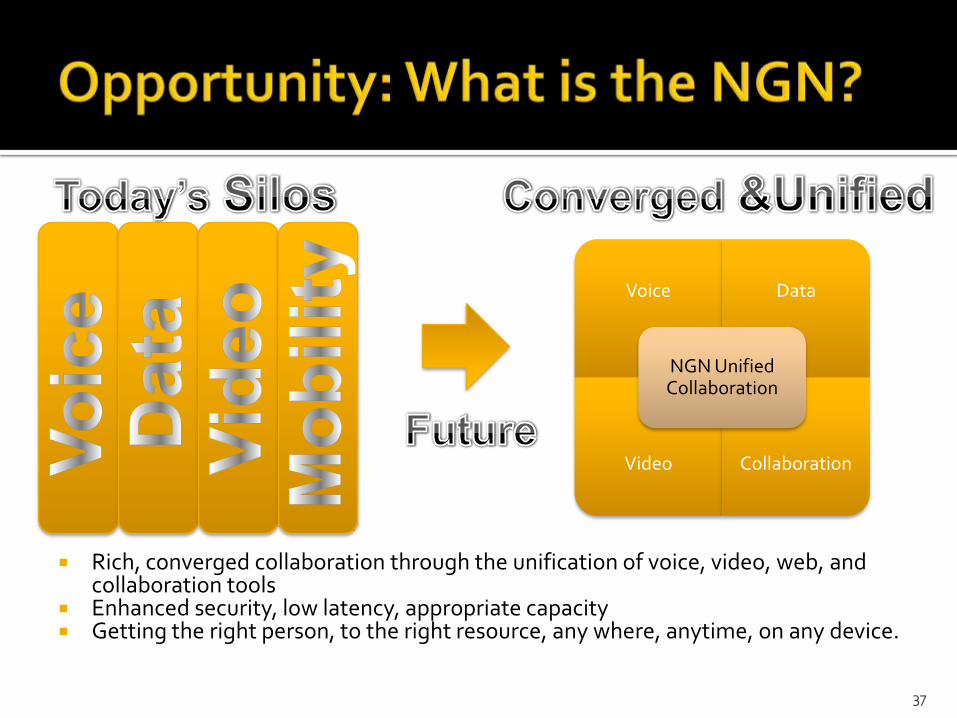
Rich, converged collaboration through the unification of voice, video, web, and collaboration tools
Enhanced security, low latency, appropriate capacity Getting the right person, to the right resource, any where, anytime, on any device.
Voice Data
Video Collaboration
NGN Unified Collaboration

38
Common Access Point
Right Person, Right Place, Right Time, Right Role

Borderless (location insensitive) Universal campus wireless
Universal campus cellular
Outside the Institution
Real Time Protocols
Video, Voice, Streaming
Rich Media Collaboration Based upon one’s usage profile Confidentiality, Integrity, and Availability
Preserved
On any device, at any time, from anywhere
39

End Result Increase mobility Increase Bandwidth Improve operational
efficiency Decrease complexity Enable Pervasive
wireless Offer granular security Base access on role
40
Activity Today NGN Start Year
Network Organizations Discrete Connected 1
Security Organizations Discrete Connected 1
Directory Organizations Discrete Connected 1
Vendor standards Multiple Single 1
Life cycle management Inconsistent Consistent 1
Voice and data provisioning Varied Standard 1
Points of service provision Multiple Single 1
Points of monitoring and operations Multiple Single 1
Consumption as Service Capital Service 1
Logical network topology Two One 1
Devices Standards & Policies Enforcement Inconsistent Consistent 1
Voice, Data, Video, Web Divergent Convergent 2
Real time protocol scalability Partial Prevalent 2
Data traffic Optimization Inconsistent Consistent 2
Wireless data 802.11x Unsecure Secure 2
Access Methodology Geographic Role 3
In-building cellular / LTE data Coverage Sporadic Consistent 4
42
Coordinating and standardizing assets would remove the need for costly workarounds and eliminate excess inventory
▪ initial estimates project a cost avoidance of $10M over 10 years.
When it comes to integration, we do not know what the final decision will be on team structures. The process over the next few months will bear out what the right roles and relationships are and what the timeline is for implementation.
As a result of the analysis, a phased approach for implementation over time could potentially result in any combination of structural teams, virtual teams, and services pushed to the cloud.

Develop Bill of Materials needed to implement NGN
Conduct Process Assessments to identify opportunities for
standardization
Identify Target Skill Sets to identify areas for integration and
training
Address Sourcing of assets and contract labor
Engage Community through advisory groups and public hearings
Develop Expense Allocations Present findings to leadership in October 2010
43


45
In order to keep up with demands, we will become an increasingly dynamic and progressive organization
We will be working differently five years from now or we will be behind the rest of the industry
Hence, all of our roles and relationships will change over time

46
Look for opportunities in these initiatives for you or your team to add value – where can you get involved and how can you evolve to add more value?
Apply industry standards or best practices in your discipline where it adds value…set the industry standard in areas where we are breaking new ground
Come up with the next big idea on how Vanderbilt IT services can become more effective…escalate these ideas to your manager
Ask your manager when you have questions about the current initiatives and how they might impact you